Science Journal of Applied Mathematics and Statistics 2015; 3(3): 153-159 Published online May 29, 2015 (http://www.sciencepublishinggroup.com/j/sjams) doi: 10.11648/j.sjams.20150303.18 ISSN: 2376-9491 (Print); ISSN: 2376-9513 (Online) Simulation of Heterogeneous Financial Market Model Based on Cellular Automaton Hong Zhang 1 , Li Zhou 1 , Yifan Yang 2 , Lu Qiu 3 1 School of Information, Beijing Wuzi University, Beijing, China 2 School of Banking and Finance, University of International Business and Economics, Beijing, China 3 School of International Business, Nanjing Audit University, Nanjing, China Email address [email protected] (Hong Zhang) To cite this article: Hong Zhang, Li Zhou, Yifan Yang, Lu Qiu. Simulation of Heterogeneous Financial Market Model Based on Cellular Automaton. Science Journal of Applied Mathematics and Statistics. Vol. 3, No. 3, 2015, pp. 153-159. doi: 10.11648/j.sjams.20150303.18 Abstract: In recent years, researchers analyzed the historical data from the financial markets. They found that the statistical result is different from the classical financial theories, models, and methods. The difference is challenging the three hypotheses which are rational people hypothesis, efficient market hypothesis and random walk hypothesis. We need new perspective and tools to re-study the financial market as a complex system. A cellular automata based heterogeneous financial market model is proposed in this categories which dissertation. In this model, the market participant id divided in to two is the fundamentalists and chartists. A learn rules is used to make sure all the market participant can convert in these two categories. The method emulates the interact behaviors between the market participants, and emulates the overall market behavior. The author analyzes the randomness sources, mean-reverting property, bubble happen and bust, and stationary of this model. The author analyzes the relationships between cellular automata based heterogeneous financial market model and the Ornstein-Uhlenbeck model and GARCH models. The data simulated by the financial market model is fit the characteristics such as the fat tail of return's distribution, negative skewness, relationship between return and trading volume, the randomness of volatility, and volatility cluster, which the classical theory is failed to explain. How to add more heterogeneity into the model is discussed in this dissertation. In this dissertation, by using the cellular automata as a tool, an option pricing model and a heterogeneous financial market model are proposed. The result of the option pricing model is close to the result calculated by the formula. The simulation of heterogeneous financial market model can explain many phenomenons which can not be explained by the classical theory, such as the fat-tail of return and the bubble happen and bust. The author also preliminary designs the financial market model based on the asynchronous cellular automata. These models and conclusions indicate that cellular automata have a ability to show the randomness of the financial markets and simulate the behaves of the participants in the financial maket. Keywords: Cellular Automaton, Financial Market, Heterogeneous, Simulation 1. Introduction Y Gao and Czbeni proposed a heterogeneous financial market model with Intrinsic Randomness, which uses the classic Brownian motion model to model the stock price movements. Mantegna and Stanle think Brownian motion model can’t explain Thick tail phenomenon and the generation of financial bubbles. You have to relax the hypothesis that the volatility in Brownian motion model is constant if you want to use Brownian motion model to explain Thick tail phenomenon. Based on this idea, Hull and White, Cox. Ingersoll and Ross, Ornstein and Uhlenbeck, respectively, established models of stock price based on stochastic volatility. But the main difficulty for these models is that how to determine the function of the stochastic volatility, in order to make it similar to the changes of market price. Bailia and Bollerslev, Engle, Bollerslev established a volatility model varying with time. Parts of these models explain Thick tail phenomenon. Y Gao and G beni’s model doesn’t directly model the price of the stock but model traders’ trading strategies and trading volume by the rules of cellular automata. Cellular automata will decide trading strategies according to the present state of cellular to choose their own market behavior. Except the hypothesis that the volatility in Brownian motion model is constant, the price data generated from Y Gao and G beni’s model also has the characteristics of random drift. The
Transcript
Science Journal of Applied Mathematics and Statistics 2015; 3(3): 153-159
Published online May 29, 2015 (http://www.sciencepublishinggroup.com/j/sjams)
doi: 10.11648/j.sjams.20150303.18
ISSN: 2376-9491 (Print); ISSN: 2376-9513 (Online)
Simulation of Heterogeneous Financial Market Model Based on Cellular Automaton
Hong Zhang1, Li Zhou
1, Yifan Yang
2, Lu Qiu
3
1School of Information, Beijing Wuzi University, Beijing, China 2School of Banking and Finance, University of International Business and Economics, Beijing, China 3School of International Business, Nanjing Audit University, Nanjing, China
For each type of market structure, this paper gives three
kinds of image: price trajectory image, technical analysis and
price volatility factor comparison image and the image of
drift rate and volatility. In these images, we have the solid
line representing the random fluctuations of Wiener process,
dotted line representing the random drift rate of every step
and the dotted line representing the price change. The
underlying asset-oriented market.
3. The Analysis of Underlying Asset
Value-Oriented Dominant Market
Suppose that at the initial state, shares holding H (x, t = 0)
takes a uniform value in the interval [0, 1]. Cellular automata
model is in the underlying asset value-oriented dominant
market. The features of this market are as following:
1. Prices return to the underlying asset value.
2. Stochastic volatility of Wiener process is small because
of the low factor of technical analysis.
3. The random drift rate and random Wiener process
offsetting each other makes smaller fluctuation in price.
As shown in figure 3, random drift rate and random
Wiener process present offsetting trends which results
in a relatively stable price trajectory.
156 Hong Zhang et al.: Simulation of Heterogeneous Financial Market Model Based on Cellular Automaton
Fig. 2. Charted factor and fluctuations factor in the fundamentalist-dominated market.
Figs. 3. Drift rate, noise terms and price trajectory in the fundamentalist-dominated market.
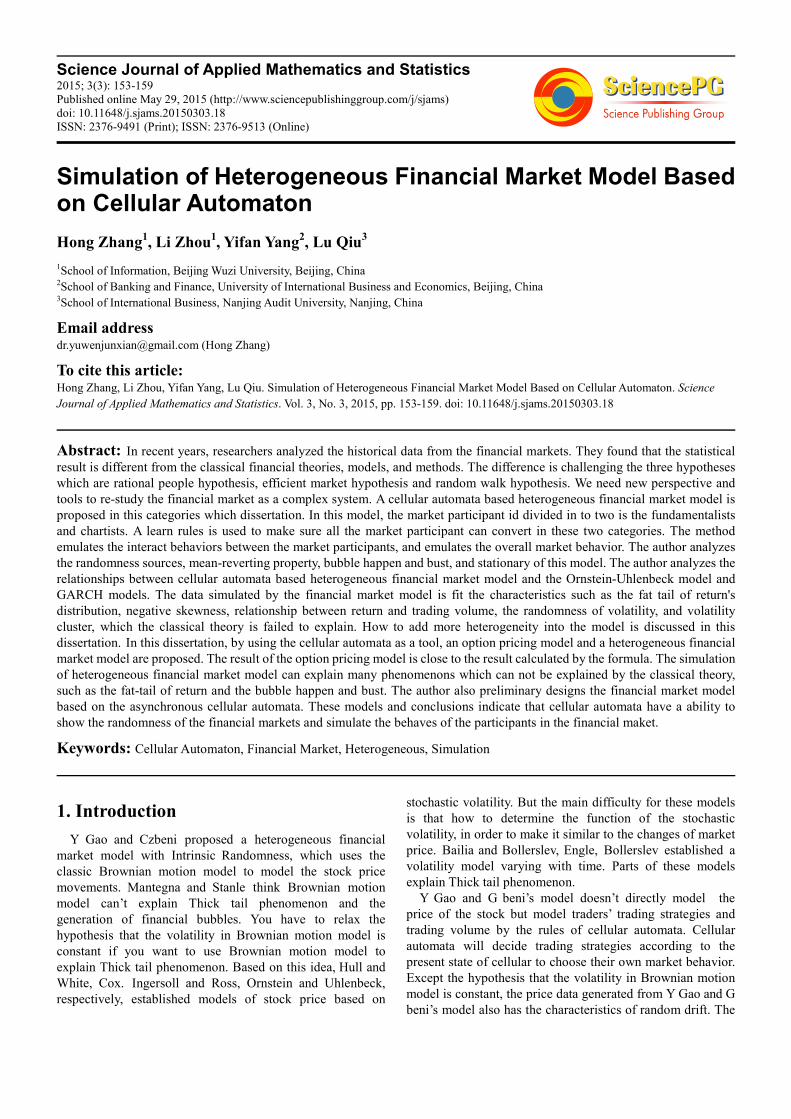
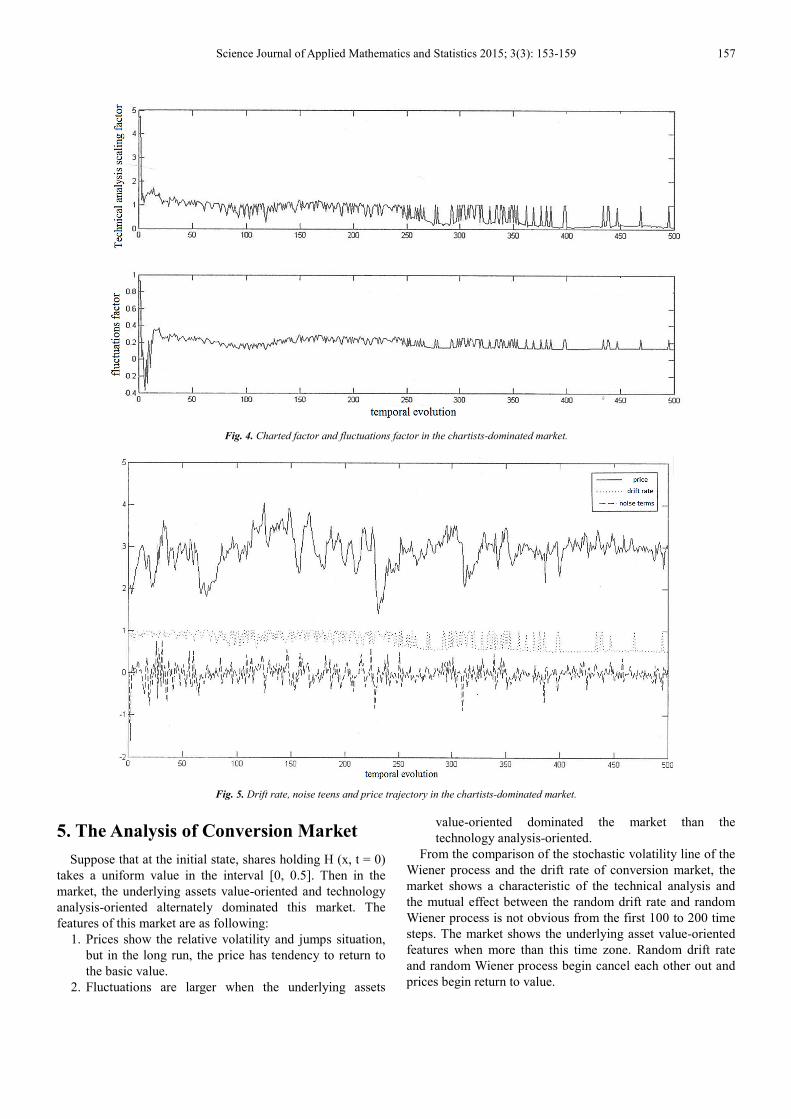
4. The Analysis of Technology
Analysis -Oriented Market
Suppose that at the initial state, shares holding H (x, t = 0)
takes a uniform value in the interval. The market is occupied
by technical analysis investors. The features of this market
are as following:
1. It shows greater volatility in the price curve and
sometimes produces foam.
2. Stochastic volatility of Wiener process is greatly high
due to the high factor of technical analysis,
3. There was no offset relationship between the random
drift rate and random Wiener process. Therefore, the
price has a great volatility.
Science Journal of Applied Mathematics and Statistics 2015; 3(3): 153-159 157
Fig. 4. Charted factor and fluctuations factor in the chartists-dominated market.
Fig. 5. Drift rate, noise teens and price trajectory in the chartists-dominated market.
5. The Analysis of Conversion Market
Suppose that at the initial state, shares holding H (x, t = 0)
takes a uniform value in the interval [0, 0.5]. Then in the
market, the underlying assets value-oriented and technology
analysis-oriented alternately dominated this market. The
features of this market are as following:
1. Prices show the relative volatility and jumps situation,
but in the long run, the price has tendency to return to
the basic value.
2. Fluctuations are larger when the underlying assets
value-oriented dominated the market than the
technology analysis-oriented.
From the comparison of the stochastic volatility line of the
Wiener process and the drift rate of conversion market, the
market shows a characteristic of the technical analysis and
the mutual effect between the random drift rate and random
Wiener process is not obvious from the first 100 to 200 time
steps. The market shows the underlying asset value-oriented
features when more than this time zone. Random drift rate
and random Wiener process begin cancel each other out and
prices begin return to value.
158 Hong Zhang et al.: Simulation of Heterogeneous Financial Market Model Based on Cellular Automaton
Fig. 6. Charted factor and fluctuations factor in the transform market.
Figs. 7. Drift rate, noise terms and price trajectory in the transform market.
6. Summary
The features of the underlying asset value-oriented
dominant market are as following:
1. Prices return to the underlying asset value.
2. Stochastic volatility of Wiener process is small because
of the low factor of technical analysis.
3. The random drift rate and random Wiener process
offsetting each other makes smaller fluctuation in price.
As shown in figure 3, random drift rate and random
Wiener process present offsetting trends which results
in a relatively stable price trajectory.
The features of the technology analysis -oriented market
are as following:
1. It shows greater volatility in the price curve and
sometimes produces foam.
2. Stochastic volatility of Wiener process is greatly high
due to the high factor of technical analysis,
3. There was no offset relationship between the random
drift rate and random Wiener process. Therefore, the
price has a great volatility.
The features of the conversion market are as following:
1. Prices show the relative volatility and jumps situation,
but in the long run, the price has tendency to return to
the basic value.
2. Fluctuations are larger when the underlying assets
value-oriented dominated the market than the
technology analysis-oriented.
Science Journal of Applied Mathematics and Statistics 2015; 3(3): 153-159 159
Acknowledgements
This paper is funded by the project of National Natural
Science Fund, Logistics distribution of artificial order
picking random process model analysis and
research(Project number: 71371033); and funded by
intelligent logistics system Beijing Key Laboratory
(No.BZ0211); and funded by scientific-research bases---
Science & Technology Innovation Platform---Modern
logistics information and control technology research
(Project number: PXM2015_014214_000001); and funded
by 2014-2015 school year, Beijing Wuzi University, College
students' scientific research and entrepreneurial action plan
project (No.68); and funded by Beijing Wuzi University,
Yunhe scholars program(00610303/007); and funded by
Beijing Wuzi University, Management science and
engineering Professional group of construction projects.
(No. PXM2015_014214_000039). University Cultivation
Fund Project of 2014-Research on Congestion Model and
algorithm of picking system in distribution center
(0541502703)
References
[1] Gao Y Beni G Price Fluctuations in Market Model with Heterogeneous Trading Strategies. Proceedings of tha 4th IASTED: Financial Engineering and Application, Berkeley CA, 2007.
[2] Gao Y, Beni G. Model of Heterogeneous Market wiih Intrinsic Randomness. International Conference on Computational Intelligence in Economics & Finance, Salt Lake City, UT, 2007.
[3] Barndorff-Nielsen O E, Shephard N. Non-Gaussian Ornstein Uhlenbeck-based Models and Some of Their Uses in Financial Economics [J]. Journal of the Royal Statistical Society, Series B, Vo1. 63(2), 2001, 167-241.
[4] Engle R E. Autoregressive Conditional Heteroskedasticity with Estimates of the Variance of United Kingdom Inflation [3]. Econometrics, Vo1.50, 1982, 987-1007.
[5] Bollerslev T. Generalized Autoregressive Conditional Heteroskedasticity [J]. Journal of Econometrics, Vol. 3(1), 1986, 307-328.
[6] Malkiel B G. The Efficient Market Hypothesis and Its Critics [J]. The Journal of Economic. Perspectives, Vo1. 17(1), 2003, 59-82.
[7] Lux T. The Socio-economic Dynamics of Speculative Markets: Interacting Agents, Chaos, and the Fat Tails of Return Distributions [J]. Journal of Economic Behavior and Organization, Vo1.33 (2), 1998, 143-165.
[8] Chairella C, Dieci R, Gardini L. Asset Price Dynamic in a Financial Market with Fundamentalist and Chartists [J]. Discrete Dynamics in Nature and Society, Vol. 6(2), 2001, 69-99.
[9] Horst U,. Financial Price Fluctuations in a Stock Market Model with Many Interacting. Agents [J]. Economic Theory, Vo1. 25(4), 2005, 917-932.
[10] Follmer H, Horst U, Kirman A. Equilibria in Financial Markets with Heterogeneous. Agents: A Probabilistic Perspective [J], Journal of Mathematical Economics, Vo1. 41(1-2), 2005, 123-155.
[11] Uhlenbeck G E, Ornstein L S. On the Theory of Brownian Motion [J]. Physical Review. Letters, Vo1.36, 1930, 823-841.
[12] Feller W. An Introduction to Probability Theory and its Applications [M], Wiley, 1958.
[13] Larralde H. Statstical Properties of a Discrete Version of the Ornstein- Uhlenbeck, Process [J]. Physical Review E, Vo1.69, 2004, 027102.
[14] Vasicek O A. An Equilibrium Characterization of Tenn Structure [J]. Journal of Financial, Economics, Vo1.5, 1977, 177-188.