[Ryzhkov et. al., Vol.5 (Iss.8): August, 2017] ISSN- 2350-0530(O), ISSN- 2394-3629(P)
DOI: https://doi.org/10.29121/granthaalayah.v5.i8.2017.2179
Http://www.granthaalayah.com ©International Journal of Research - GRANTHAALAYAH [26]
Science
SIMULATION OF HIGHER EDUCATIONAL ESTABLISHMENT
COMPETITIVENESS
Alexander S. Ryzhkov*1
, Konstantyn V. Koshkin2, Natalia R. Knyrik
2, Rostyslav S.
Ryzhkov3
*1Educatinal Scientific Center of International Cooperation, Admiral Makarov National
University of Shipbuilding, Mykolaiv, Ukraine 2 Educatinal Scientific Institute of Computer Sciences and Technologies, Admiral Makarov
National University of Shipbuilding, Mykolaiv, Ukraine 3 Educatinal Scientific Center of European Integration, Admiral Makarov National University of
Shipbuilding, Mykolaiv, Ukraine
Abstract
The success of International Joint Educational Programs of the Educational Establishments
based on effective management. This makes a need for predicting the competitiveness indicators
in order to analyze different strategies for the expansion of higher education establishments and
the picking up the best scenarios of its market play. The simulation methodology makes possible
to performe analysis management that contains elements of actions that influenced by random
factors. Using the method of system dynamics as the main tool is due to the complexity of the
strategic alternatives selection in a dynamically developing situation, under conditions of
external and internal uncertainty. The initial state of performed simulation was based on the
parameters that define the market share and the number of potential students of the joint
educational program between Admiral Makarov National University of Shipbuilding and partner
in Zhejiang City, China. Sensitivity analysis experiments allow determining the influence of the
initial hypotheses and the key parameters values on the model output parameters of the
interference of competitiveness factors under uncertainty conditions. This significantly improves
the effectiveness of management processes.
Keywords: Project Management; Promotion; Education System; Effectiveness-Performance;
International Experience; Knowledge Management; Simulation; Managerial Cognition;
Education Systems.
Cite This Article: Alexander S. Ryzhkov, Konstantyn V. Koshkin, Natalia R. Knyrik, and
Rostyslav S. Ryzhkov. (2017). “SIMULATION OF HIGHER EDUCATIONAL
ESTABLISHMENT COMPETITIVENESS.” International Journal of Research -
Granthaalayah, 5(8), 26-35. https://doi.org/10.29121/granthaalayah.v5.i8.2017.2179.
[Ryzhkov et. al., Vol.5 (Iss.8): August, 2017] ISSN- 2350-0530(O), ISSN- 2394-3629(P)
DOI: 10.5281/zenodo.853143
Http://www.granthaalayah.com ©International Journal of Research - GRANTHAALAYAH [27]
1. Introduction
The problem of increasing competitiveness is one of the primary tasks for optimizing the
management of higher education institutions, working in conditions of the market and crisis.
Optimization of university exchange relations with competing organizations is the main task of
effective management. This leads to the need for simulation and predicting the dynamics of
competitiveness indicators in order to analyze alternative strategies for the development of
higher education institutions and the selection of optimal scenarios of its market conduct. The
concept of competitiveness is still not clearly defined by experts, and depends on the subject
area: enterprise, educational institution, group of companies, industry, region, sector, etc. There
are also a number of unresolved problems: absence of universal mathematical models for
competitiveness assessing and forecasting, a weak hidden regularities account of the competition
process in existing models, complexity of automation and inadequate decision speed, lack of
specialized competitiveness management software and tools in the market. Simulation modeling
allows predicting the dynamics of competitiveness and making decisions on the selection of
measures for their increase (Koshkin, Knyrik, & Voznyy, 2016).
University management competitiveness requires the adoption of wise and scientifically based
managerial decisions. It is necessary to take into account a lot of factors that have a significant
impact on the management process, the quality of decisions and results. The decision-maker can
use different methods in the developing process and making managerial decisions: information
search, data mining, databases values search, reasoning based on precedents, simulation
modeling, evolutionary computation and genetic algorithms, neural networks, situation analysis,
collective modeling, artificial intelligence techniques (Logunova, 2012). The genetic algorithm
realizes a random search method, based on natural selection - the main mechanism of evolution,
allowing finding problems solutions that are close to optimal (Rutkovskaya, Pipinskiy, &
Rytkovskiy, 2008).
The basis of the decision-making process during the use of the simulation method is the model of
the research object that can be a complex of interrelated simulation and optimization models with
a multitude of dynamic and information links between all levels models (Lychkina). Expert
details the problem and model, generates alternatives, formulation of a directed computational
experiment on the simulation model and selection and ranking criteria. Simulation modeling
technology allows taking into account the expert subjective preferences and his experience in the
decision-making process.
Semistructured are systems that are characterized by a multidimensional nature of the occurring
processes in them and their interconnectedness, the lack of sufficient quantitative information
about the dynamics of processes, as well as the processes nature variability in time.
Cognitive modeling tools are used to study weakly semistructured systems. Information about
the system in the cognitive model is represented in the form of a set of concepts and the causal-
investigatory network (cognitive map) linking them. It reflects the expert’s subjective
representation on the laws and patterns that are inherent in the modeled system. Analytical
methods focused on the research of the system structure and obtaining predictions of its behavior
[Ryzhkov et. al., Vol.5 (Iss.8): August, 2017] ISSN- 2350-0530(O), ISSN- 2394-3629(P)
DOI: 10.5281/zenodo.853143
Http://www.granthaalayah.com ©International Journal of Research - GRANTHAALAYAH [28]
during various control actions are applied to the cognitive map with the purpose of effective
management strategies synthesis (Avdeev, Kovriga, & Makarenko, 2007).
The solution search based on precedents is to determine the similarity measure of the current
situation to precedent situations from the rule database (RD). The parameters weights specified
by the expert for the situation from the RD are taken into account in this case. The similarity
measure depends on the closeness of the current situation to the precedent situation
(Varshavskiy, 2008).
The neural network device (Borisov, Kruglov, & Fedulov, 2007) is simple to use and allows
reproducing complex dependencies. It is used to solve problems of forecasting, classification or
management.
The choice of method depends on the set of tasks that need to be resolved to make effective
management decisions.
The purpose of the study is to increase the effectiveness of taken decisions to improve the
competitiveness of the university on the basis of simulation modeling.
2. Materials and Methods
The simulation methodology allows performing effective analysis and structure management that
simultaneously contains elements of continuous and discrete action and is influenced by
numerous random factors. It is described by cumbersome relationships (Hamilton, 2004).
Various combinations of the principles of imitation (Lychkina N. , 2005), cognitive modeling
(Bai, et al., 2013), and Petri nets (Kotov, 1984) are used in the development of models. Using the
method of system dynamics as the main tool is due to the complexity of the strategic alternatives
selection in a dynamically developing situation, under conditions of external and internal
uncertainty (Lychkina N. N., 2007).
The use of different modeling methods by the decision maker enables:
Use multi-criteria in the model development and study;
Conduct a comprehensive analysis of a large number of alternatives and choose an option
that matches the selected criteria;
Explore dynamic situations, when the system and environment parameters change in the
implementing projects process;
To study the influence of structural organization features and feedback loops on the
behavior;
Interpret system flow diagrams. This makes it possible to make concerted decisions;
Use simulation models as a tool for conducting a large number of experiments of a
"what-if" set;
To conduct scenario research on simulation models.
3. Results and Discussions
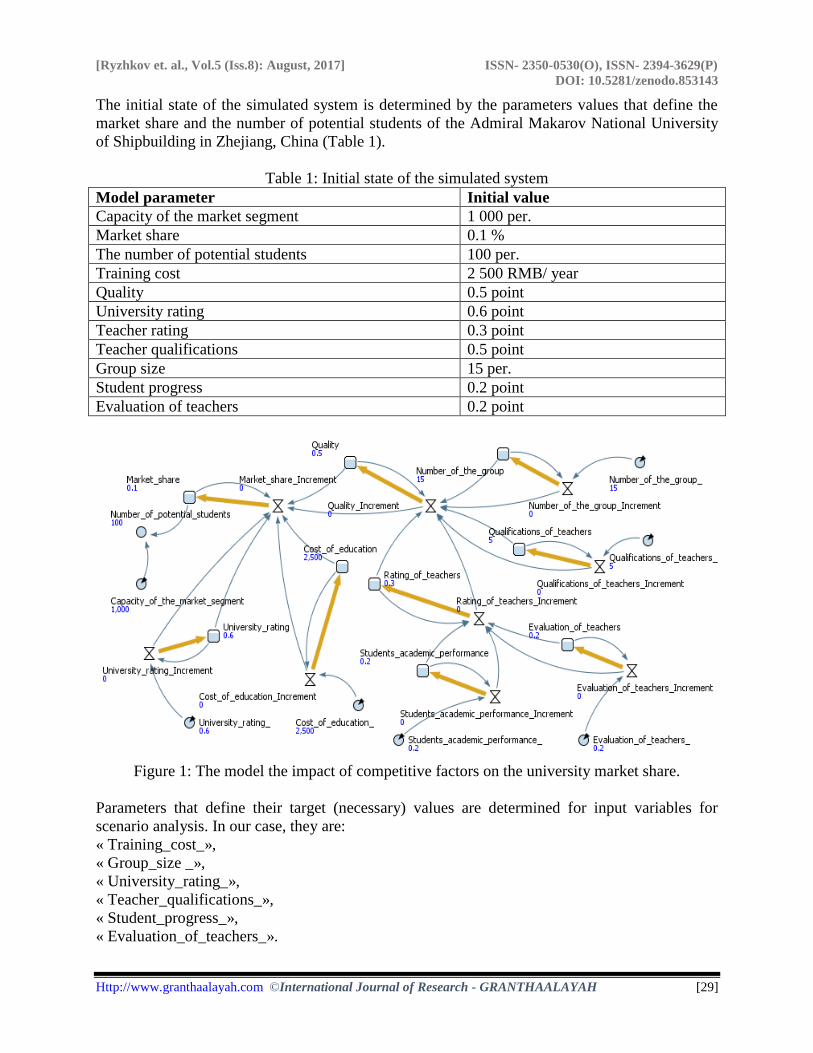
AnyLogic system (AnyLogic) is used for developing the model of mutual influence of university
competitiveness factors (Fig. 1).
[Ryzhkov et. al., Vol.5 (Iss.8): August, 2017] ISSN- 2350-0530(O), ISSN- 2394-3629(P)
DOI: 10.5281/zenodo.853143
Http://www.granthaalayah.com ©International Journal of Research - GRANTHAALAYAH [29]
The initial state of the simulated system is determined by the parameters values that define the
market share and the number of potential students of the Admiral Makarov National University
of Shipbuilding in Zhejiang, China (Table 1).
Table 1: Initial state of the simulated system
Model parameter Initial value
Capacity of the market segment 1 000 per.
Market share 0.1 %
The number of potential students 100 per.
Training cost 2 500 RMB/ year
Quality 0.5 point
University rating 0.6 point
Teacher rating 0.3 point
Teacher qualifications 0.5 point
Group size 15 per.
Student progress 0.2 point
Evaluation of teachers 0.2 point
Figure 1: The model the impact of competitive factors on the university market share.
Parameters that define their target (necessary) values are determined for input variables for
scenario analysis. In our case, they are:
« Training_cost_»,
« Group_size _»,
« University_rating_»,
« Teacher_qualifications_»,
« Student_progress_»,
« Evaluation_of_teachers_».
[Ryzhkov et. al., Vol.5 (Iss.8): August, 2017] ISSN- 2350-0530(O), ISSN- 2394-3629(P)
DOI: 10.5281/zenodo.853143
Http://www.granthaalayah.com ©International Journal of Research - GRANTHAALAYAH [30]
It is possible to analyze the consequences of possible design solutions by changing these
parameters in the simple experiment mode.
Thus, for example, the number of potential NUS students at given parameters is 100 persons
(market share – 0,1%, market segment capacity - 1000 persons).
Figure 2: The model parameters with an increase in training cost by 20%
If it is necessary to increase the training cost by 20% (3 000 RMB/year) under the influence of
objective factors, then the competitiveness of the university will decrease: the market share will
decrease to 0,09% and the number of potential students in Zhejiang will be about 90 people (Fig.
2).
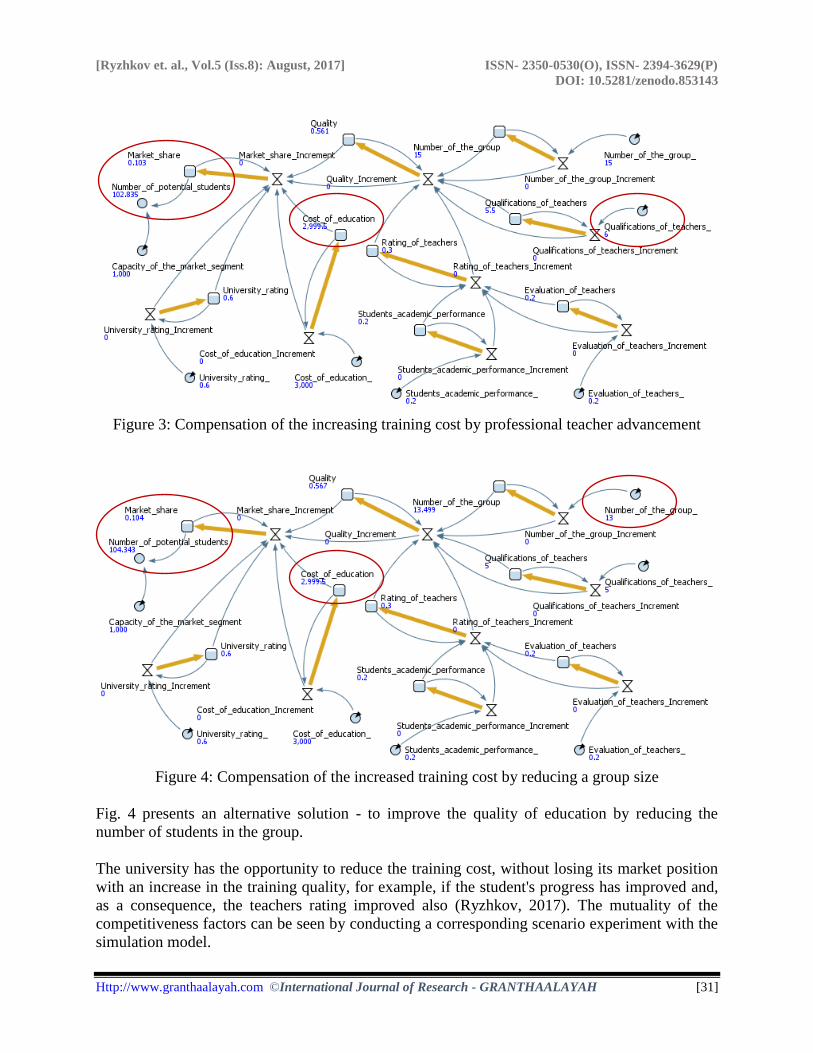
Fig. 3 shows that it is possible to compensate for the consequences after increasing the value of
the " Training_cost_" in the model and returning to the original market share value = 0,1% by
improving the quality of training by attracting more qualified teachers. The parameter
"Teacher_qualification_" is a normalized value, estimated in points in the range [1; 10].
Academic degree, academic rank, work pedagogical seniority of teachers is taken into account
while determining of this parameter value.
[Ryzhkov et. al., Vol.5 (Iss.8): August, 2017] ISSN- 2350-0530(O), ISSN- 2394-3629(P)
DOI: 10.5281/zenodo.853143
Http://www.granthaalayah.com ©International Journal of Research - GRANTHAALAYAH [31]
Figure 3: Compensation of the increasing training cost by professional teacher advancement
Figure 4: Compensation of the increased training cost by reducing a group size
Fig. 4 presents an alternative solution - to improve the quality of education by reducing the
number of students in the group.
The university has the opportunity to reduce the training cost, without losing its market position
with an increase in the training quality, for example, if the student's progress has improved and,
as a consequence, the teachers rating improved also (Ryzhkov, 2017). The mutuality of the
competitiveness factors can be seen by conducting a corresponding scenario experiment with the
simulation model.
[Ryzhkov et. al., Vol.5 (Iss.8): August, 2017] ISSN- 2350-0530(O), ISSN- 2394-3629(P)
DOI: 10.5281/zenodo.853143
Http://www.granthaalayah.com ©International Journal of Research - GRANTHAALAYAH [32]
Sensitivity analysis experiments help to evaluate the sensitivity of simulation results from
specific model parameters. There are several "runs" of the model when changing the value of one
of the parameters. Then it is shown how the simulation results are affected by these changes.
The experiment with the parameters variation and the model's reaction analysis helps to assess
how sensitive the model forecast is to the hypothesis change that underlies the model. The
change in factor values separately is recommended during the sensitivity analysis. This allows
ranking their impact on the resulting metrics.
The sensitivity research allows determining the strategy for planning experiments on the
simulation model (Lychkina N. , 2005). If the model is insensitive for any component of the
model's parameters vectornixi ,1,
, then it is not included in the plan of the simulation
experiment. Saving the simulation time resource is achieved during this. The values of the
parameters vary systematically within certain limits),( xx
and the influence of these variations
on the system characteristics is observed. If the results change very strongly with insignificant
changes in the some parameters values, then it is necessary to conduct additional studies in order
to obtain more accurate estimates. Conversely, if the final results do not change during the
change in the parameter values within wide limits, further experimentation in this direction is
unjustified.
The influence of key indicators on the output parameters vector can be analyzed during the
experiments of interference model sensitivity analyzing of competitiveness factors to all input
parameters.
The graphs in Fig. 5 illustrate the sensitivity of the number of potential student’s indicator to the
change in the parameters "Training_cost_" and "University_rating _".
а
[Ryzhkov et. al., Vol.5 (Iss.8): August, 2017] ISSN- 2350-0530(O), ISSN- 2394-3629(P)
DOI: 10.5281/zenodo.853143
Http://www.granthaalayah.com ©International Journal of Research - GRANTHAALAYAH [33]
б
Figure 5: Sensitivity analysis of the number of potential students to changing parameters: а –
Training_cost_; б – University_rating _
Sensitivity analysis will also make adjustments to the developed models (simplified). For
example, migrate from the distribution law to the mean variable value usage and some
subsystems discarded generally (or not itemize the processes). Conversely, sensitivity analysis
can show model parts that would be useful to develop in more detail.
We introduce the following notation for the model elements for the sensitivity estimation:
},,,{ 21 nxxxX – input data vector,
},,,{ 21 myyyY – output vector. Change interval
),( ii xx is determined for each input parameter
nixi ,1, , ix – bottom limit value, ix - top
limit value. The remaining vector X components do not change. Model experiments will be
conducted and for the pair ),( ii xx
we get the model response vectormjyy i
j
i
j ,1)},,{( ,
wheremjxAyxAy i
i
ji
i
j ,1),(),( , A - an operator that represents multiple input
parameters to a set of output parameters. Absolute and relative values can be used to estimate
sensitivity. Calculate the increments parameters vector in the latter case:
.,1%,100)(
)( 2
nixx
xxx
ii
ii
i
Each increment input parameter nixi ,1,
will match the output vector increments factors:
[Ryzhkov et. al., Vol.5 (Iss.8): August, 2017] ISSN- 2350-0530(O), ISSN- 2394-3629(P)
DOI: 10.5281/zenodo.853143
Http://www.granthaalayah.com ©International Journal of Research - GRANTHAALAYAH [34]
.,1%,100)(
)( 2
mjyy
yyy
i
j
i
j
i
j
i
ji
j
Model sensitivity on i-th component of the input parameters vector X is determined by a pair of
values),( i
i yx , where
}{max1
i
j
m
j
i yy .
The sensitivity of the simulation model is represented by the value of the minimum increment of
the selected quality criterion. It is calculated from statistics modeling with a consistent variation
of the modeling parameters over the entire range of their variation.
4. Conclusions & Recommendations
A series of experiments with an imitation model of the mutual influence of competitiveness
factors was leaded. Factors implement various scenarios of design solutions aimed at the key
indicators values of the university position in the educational services market.
Sensitivity analysis experiments allow determining the influence of the initial hypotheses and the
key parameters values on the model output parameters of the interference of competitiveness
factors under uncertainty conditions. This significantly improves the effectiveness of
management processes.
References
[1] AnyLogic. (б.д.). Multi-approach simulation simulation. Получено из AnyLogic:
http://www.anylogic.ru/.
[2] Avdeev, Z., Kovriga, S., & Makarenko, D. (2007). Cognitive modeling and solving the problems
of managing weakly structured systems (situations). Moscow: ИПУ РАН.
[3] Bai, S., Blintsov, V., Bushuev, D., Voznyy, A., Gayda, A., Zaporozhets, I., и др. (2013). The
management of the organization of the organization of the organization of the sea and sea
complex. Mykolaiv: Torubara Publishing.
[4] Borisov, V., Kruglov, V., & Fedulov, A. (2007). Fuzzy models and networks. Moscow:
Goriachaya Linia - Telecom.
[5] Hamilton, J. D. (2004). Time Series Analysis. New Jersey: Princeton University Press .
[6] Koshkin, K., Knyrik, N., & Voznyy, A. (2016). Decision-making in the implementation of IT
projects based on simulation. Journal of NTU "HPI" , 12-16.
[7] Kotov, V. E. (1984). Petri nets. Moscow: Nauka.
[8] Logunova, E. (2012). hysics and mathematics and information technologies: problems and
development trends. MATHEMATICAL MODELS OF DECISION SUPPORT SYSTEMS. IV.
Novosibirsk: СибАК.
[9] Lychkina, N. (б.д.). Modern technologies of simulation and their application in information
business systems and decision support systems . http://it-
claim.ru/Library/Books/SC/articles/sovremennye_tehnologii_immitacionnogo/sovremennye_tehn
ologii_immitacionnogo.html .
[10] Lychkina, N. N. (2007). Simulation models in procedures and systems for supporting strategic
decision-making for enterprises (Т. 1). Business-Informatics.
[11] Lychkina, N. (2005). Simulation of economic processes. Moscow: Akademiya IT.
[Ryzhkov et. al., Vol.5 (Iss.8): August, 2017] ISSN- 2350-0530(O), ISSN- 2394-3629(P)
DOI: 10.5281/zenodo.853143
Http://www.granthaalayah.com ©International Journal of Research - GRANTHAALAYAH [35]
[12] Rutkovskaya, D., Pipinskiy, M., & Rytkovskiy, P. (2008). Neural networks, genetic algorithms
and fuzzy systems. Moscow: Gorachaya Linia - Telecom.
[13] Ryzhkov, A. (2017). Assessment of the quality of teaching as an element of the management of a
joint international educational project. Science Rise , 3, 51-59.
[14] Varshavskiy, P. (2008). 1th National Conference KII-2008. Mechanisms of plausible reasoning
on the basis of precedents (accumulated experience) for expert diagnosis systems. 2, стр. 321-
329. Moscow: Lenand.
*Corresponding author.
E-mail address: oleksandr.ryzhkov@ nuos.edu.ua