Simulation of particle mixing and segregation in bidisperse gas fluidized beds O.O. Olaofe a , A.V. Patil a , N.G. Deen a,n , M.A. van der Hoef b , J.A.M. Kuipers a a Department of Chemical Engineering and Chemistry, Eindhoven University of Technology, PO Box 513, 5600 MB Eindhoven, The Netherlands b Faculty of Science and Technology, University of Twente, PO Box 217, 7500 AE Enschede, The Netherlands HIGHLIGHTS The axial segregation in hydrodynamic models of binary mixtures has been studied. Detailed comparisons have been made between DEM and experimental results. Some comparisons have been made between MFM and experimental results. Focus has been made on the role of drag relation in axial segregation. The drag relation from DNS performed better. article info Article history: Received 22 October 2013 Received in revised form 10 December 2013 Accepted 4 January 2014 Available online 15 January 2014 Keywords: Segregation Binary Drag Discrete element model Multi-fluid model Geldart type D abstract The mixing and segregation of particles of various types in gas–solid fluidized beds is a common phenomenon that is observed in experimental investigations. Generally, it is necessary to understand the phenomenon of mixing and segregation in gas-fluidized beds for the optimal design operation and scale- up of many industrial processes. To gain more insight into these, bed dynamics have been studied using a fully coupled Computational Fluid Dynamics/Discrete Element Method model (CFD/DEM), in which the particles are tracked individually using Newton 0 s law of motion, and a newly developed continuum- based Multi-Fluid Model [MFM, van Sint Annaland et al. (2009a). Chem. Eng. Sci. 64, 4222–4236]. Rigorous comparisons have been made between results from laboratory experiments and the CFD/DEM and MFM. The CFD/DEM was found to reliably predict the segregation rates in low beds, provided that an appropriate gas-particle drag relation is used that accounts for the effect of polydispersity. & 2014 Elsevier Ltd. All rights reserved. 1. Introduction In the past 20 years, the use of simulation models in the study of gas–solid fluidized systems has become increasingly popular. Initially, models in which the gas and solid phases were treated as interpenetrating continua were developed. These models incorpo- rate the kinetic theory of granular flow, which is essentially an extension of the kinetic theory of dense gases to that of inelastic particles. Though the continuum models have been applied to multi-component mixtures, difficulties are encountered due to the large sets of equations that must be solved and more research on the description of the frictional stresses is required to improve the prediction of the model (van Sint Annaland et al., 2009a). However, in more recent times, with increasing capacity of computational resources, the more detailed Computational Fluid Dynamics/Discrete Element Method (CFD/DEM) was developed. Although limited in scale due to yet some computational limita- tions, the CFD/DEM can be deployed for systems in which the total number of particles in the system are up to a few millions. The CFD/DEM is essentially an Euler–Lagrangian model in which the solid particles are treated individually with their motion and interactions tracked over time. Tsuji et al. (1993) extended the work of Cundall and Strack 0 s (1979) to 2D gas-fluidized bed by developing a soft-sphere discrete particle model in which the particle are allowed to overlap slightly from which the contact forces are calculated. Kawaguchi et al. (1998) compared the results from 3D motion of particles to 2D motion in which the particles do not move in the depth direction. Hoomans et al. (1996) used a hard-sphere based DEM to study bubble and slug formation in a 2D gas-fluidised bed. Mikami et al. (1998) studied cohesive powder behavior using an extension of the work of Tsuji et al. Contents lists available at ScienceDirect journal homepage: www.elsevier.com/locate/ces Chemical Engineering Science 0009-2509/$ - see front matter & 2014 Elsevier Ltd. All rights reserved. http://dx.doi.org/10.1016/j.ces.2014.01.009 n Corresponding author. Tel.: þ31 40 247 3681; fax: þ31 40 247 5833. E-mail address: [email protected](N.G. Deen). Chemical Engineering Science 108 (2014) 258–269
Transcript
Simulation of particle mixing and segregation in bidisperse gasfluidized beds
O.O. Olaofe a, A.V. Patil a, N.G. Deen a,n, M.A. van der Hoef b, J.A.M. Kuipers a
a Department of Chemical Engineering and Chemistry, Eindhoven University of Technology, PO Box 513, 5600 MB Eindhoven, The Netherlandsb Faculty of Science and Technology, University of Twente, PO Box 217, 7500 AE Enschede, The Netherlands
H I G H L I G H T S
� The axial segregation in hydrodynamic models of binary mixtures has been studied.� Detailed comparisons have been made between DEM and experimental results.� Some comparisons have been made between MFM and experimental results.� Focus has been made on the role of drag relation in axial segregation.� The drag relation from DNS performed better.
a r t i c l e i n f o
Article history:Received 22 October 2013Received in revised form10 December 2013Accepted 4 January 2014Available online 15 January 2014
Keywords:SegregationBinaryDragDiscrete element modelMulti-fluid modelGeldart type D
a b s t r a c t
The mixing and segregation of particles of various types in gas–solid fluidized beds is a commonphenomenon that is observed in experimental investigations. Generally, it is necessary to understand thephenomenon of mixing and segregation in gas-fluidized beds for the optimal design operation and scale-up of many industrial processes. To gain more insight into these, bed dynamics have been studied using afully coupled Computational Fluid Dynamics/Discrete Element Method model (CFD/DEM), in which theparticles are tracked individually using Newton0s law of motion, and a newly developed continuum-based Multi-Fluid Model [MFM, van Sint Annaland et al. (2009a). Chem. Eng. Sci. 64, 4222–4236].Rigorous comparisons have been made between results from laboratory experiments and the CFD/DEMand MFM. The CFD/DEM was found to reliably predict the segregation rates in low beds, provided that anappropriate gas-particle drag relation is used that accounts for the effect of polydispersity.
& 2014 Elsevier Ltd. All rights reserved.
1. Introduction
In the past 20 years, the use of simulation models in the studyof gas–solid fluidized systems has become increasingly popular.Initially, models in which the gas and solid phases were treated asinterpenetrating continua were developed. These models incorpo-rate the kinetic theory of granular flow, which is essentially anextension of the kinetic theory of dense gases to that of inelasticparticles. Though the continuum models have been applied tomulti-component mixtures, difficulties are encountered due to thelarge sets of equations that must be solved and more research onthe description of the frictional stresses is required to improve theprediction of the model (van Sint Annaland et al., 2009a).
However, in more recent times, with increasing capacity ofcomputational resources, the more detailed Computational FluidDynamics/Discrete Element Method (CFD/DEM) was developed.Although limited in scale due to yet some computational limita-tions, the CFD/DEM can be deployed for systems in which the totalnumber of particles in the system are up to a few millions. TheCFD/DEM is essentially an Euler–Lagrangian model in which thesolid particles are treated individually with their motion andinteractions tracked over time. Tsuji et al. (1993) extended thework of Cundall and Strack0s (1979) to 2D gas-fluidized bed bydeveloping a soft-sphere discrete particle model in which theparticle are allowed to overlap slightly from which the contactforces are calculated. Kawaguchi et al. (1998) compared the resultsfrom 3D motion of particles to 2D motion in which the particles donot move in the depth direction. Hoomans et al. (1996) used ahard-sphere based DEM to study bubble and slug formation in a2D gas-fluidised bed. Mikami et al. (1998) studied cohesivepowder behavior using an extension of the work of Tsuji et al.
Contents lists available at ScienceDirect
journal homepage: www.elsevier.com/locate/ces
Chemical Engineering Science
0009-2509/$ - see front matter & 2014 Elsevier Ltd. All rights reserved.http://dx.doi.org/10.1016/j.ces.2014.01.009
(1993). Thereafter, several researchers used the CFD/DEM toinvestigate the segregation behavior of beds with mixtures.Hoomans et al. (1998) further extended an earlier model(Hoomans et al., 1996) to simulate segregation in beds consistingof particles of equal density, but different sizes as well as forsystems consisting of particles of equal size, but different densities.Bokkers et al. (2004) successfully predicted experimentally mea-sured segregation rates in their CFD/DEM simulation of bidispersebed. Feng et al. (2004) developed a CFD/DEM model to study thesegregation and mixing of binary mixtures in a gas-fluidized bedof large thickness using periodic boundary conditions for the frontand rear walls. More recently, Tagami et al. (2009) used the CFD/DEM to simulate monodisperse, binary and ternary systems.Furthermore, Farzaneh et al. (2011) used a novel Lagrangianparticle tracking method to study fuel particle mixing in fluidizedbeds and Norouzi et al. (2012) used the CFD/DEM to investigatethe influence of fines in the segregation behavior of binarymixtures.
Although some of the earlier works did make some compar-isons between the CFD/DEM and experiments their scope wasrather limited. For a model to be valid, not only must it predictadequately the bubbling characteristics and porosity distributionin a multi-component system but also the degree and rate ofmixing and segregation. It is desirable to assess how well themodel performs when tested against laboratory experiments withchanging bed conditions. In this work, a soft-sphere DEM has beenused to study the dynamics of segregation in the bidispersefluidized beds. The CFD/DEM bed conditions were set equal tothose in the experiments of Goldschmidt et al. (2003) and Olaofeet al. (2013). In addition, we also performed additional simulationswith a recently developed Multi-Fluid Model (MFM). Detailedcomparisons have been made between the simulation and experi-mental results in this study. Note that the models used in thiswork were successfully tested for grid dependency previously(CFD/DEM: Link et al., 2005 and MFM: Wang et al., 2009).
2. Computational fluid dynamics/discrete element method(CFD/DEM)
The computational fluid dynamics/discrete element method(CFD/DEM) is essentially the Euler–Lagrange model in which thegas phase is treated as a continuum and the particles are trackedindividually by solving the Newtonian equations of motion with acollision model to account for the non-ideal particle–particle and/or particle–wall interactions. Among the advantages of this modelare the relative ease of incorporating an arbitrary distribution ofparticle properties, like size and density, and the possibility ofincorporating detailed particle–particle interaction models. How-ever, one major drawback in the use of the CFD/DEM is thelimitation of the number of particles resulting from CPU require-ments. In the previously developed CFD/DEM (van der Hoef et al.,2006) used in this study the particle–particle interaction are basedon the time-step driven soft particle model. The main equations ofthe model are given in Table 1.
3. The CFD/DEM simulation settings
First, some simulations run were carried out to ascertain theability of CFD/DEM to predict the segregation dynamics of theexperimental beds in Goldschmidt et al. (2003). Thereafter moresimulation runs were conducted to study the capabilities of theEuler–Langrange model with respect to reproducing the resultsreported by Olaofe et al. (2013). In this section, details of thesimulation bed settings are given.
3.1. Goldschmidt et al. (2003) Beds (Cases A–C)
The fluidized beds simulated in this work were set to mimic asclosely as possible the conditions reported in the experiments byGoldschmidt et al. (2003). The fluidization experiments wereconducted in a bed that was 15 cm wide, 1.5 cm deep and 70 cmhigh. The bed was made of glass material, and air, to which steamwas added to mitigate electrostatic effect in the bed, was appliedas the fluidization gas. A schematic representation of the bed inGoldschmidt et al. (2003) is shown in Fig. 1. Colored glass beads ofthe same density (2526 kg/m3) but different sizes (1.5 and 2.5 mm)were used in the segregation experiments. The illuminated bedmotion was recorded with a color digital video camera at a framerate of 25 frames per second. The dynamics of segregation wasthen determined from the aggregate evolution of local mixturecompositions, determined via digital image analysis, with time.
Details of the CFD/DEM parameters and the various bedconfigurations are given in Tables 2 and 3, respectively. In theCFD/DEM simulation of bidisperse beds the size of the computa-tional cell has to conform to two contrasting requirements. One isthat the cell should be large enough to give the appropriateestimates of the local void fraction, necessary for calculation offluid-particle drag, around particles. On the other hand the cellshould be fine enough to solve accurately the governing equations
Table 1CFD/DEM model equations in vector notation.
Fig. 1. Schematic of the experimental fluidized bed used by Goldschmidt et al.(2003).
O.O. Olaofe et al. / Chemical Engineering Science 108 (2014) 258–269 259
and provide highly resolved details about the flow. If the cell size ischosen solely on the basis of the large particles, then the size ofthe cell could become unnecessarily large resulting in a reductionin the accuracy of the flow. More so, in the Lagrangian model,particles are approximated as point-force components, hence thesize of the cells used to resolve the continuum cannot be less thanthose used for the discrete phase. In this work a cell size of3.33�3.33�15 mm was used as a compromise between thesetwo requirements. Note that this dimension is consistent with thevalues used by van Sint Annaland et al. (2009b) for similarsimulations. It is reckoned that a fixed cell is adequate becausethe diameter ratio of the mixture components is not too high. Thediameter ratio is within the limits for similar size mixture (SSM),that is, between 0.15 and 10/π, which can be modeled well by CFD/DEM formulations (Tagami et al., 2009).
The coefficients of friction and the normal and tangentialcoefficients of restitution were set to the same values reportedfrom direct impact experiments in van Sint Annaland et al.(2009b). The permissible contact time was determined from theequation of motion for the soft-model spring and mass system(van der Hoef et al., 2006) with the normal and tangential springstiffness set to values that keep particle–particle overlap mostlyunder 1%.
All the side walls (right, left, front and back) were assumed tobe impermeable, free-slip, symmetry boundaries. At the bottomwall, an inflow boundary was prescribed while at the top wall afixed atmospheric pressure was imposed. At the start of thesimulations, the small and large particles were placed randomlyin a lattice structure and then allowed to settle under gravity.
Hence, the initial values of the degree of segregation depended onthe degree of randomness in the initial positioning of the particles.
3.2. Olaofe et al. (2013) Beds (Case D)
In addition to the simulation studies on the 1.5–2.5 mmmixtures reported in the work of Goldschmidt et al. (2003), some2.5–3.5 mm mixtures in the newly conducted experiments byOlaofe et al. (2013) were also investigated. Furthermore, severaladditional simulations were conducted for the investigation of theinfluence of bed width on the time evolution of the segregationindex. Key parameters of the CFD/DEM settings used are given inTable 4. The wall conditions and bed initialization used here wereas in the simulations conducted for the Goldschmidt et al. (2003)experiments.
3.3. Drag closures
The Ergun (1952) and Wen and Yu (1966) drag correlation intheir basic forms are the most widely used for perfectly mono-dispersed systems. When the particle volume fraction exceeds 0.2,the Ergun (1952) relation is used, and is given in terms of thedimensionless drag force by:
Fðϕ;ReÞ ¼ 150ϕ18ð1�ϕÞ2
þ 1:75Re18ð1�ϕÞ2
ð1Þ
When the particle volume fraction is less than 0.2, the Wen andYu (1966) relation is used. The relation is given in term ofdimensionless drag force by:
Fðϕ;ReÞ ¼ ð1�ϕÞ�3:65ð1þ0:15Re0:687Þ ð2Þ
Studies have shown that the Ergun (1952) relation is moreapplicable to dense monodisperse regimes. A study conducted byBokkers et al. (2004) reported that bubble formation in CFD/DEMsimulations of fluidized beds were in better agreement withexperimental observations when the drag relations derived fromlattice-Boltzmann simulations were used. Hence, to check for theeffect of polydispersity on the gas-particle drag in fluidizedsystems, the correction obtained by Beetstra et al. (2007) fromlattice-Boltzmann simulations, was applied to the Ergun (1952)correlation in some simulation runs. The correction from Beetstraet al. (2007) is given by:
yi ¼did� � ð3Þ
where di is the diameter of particle type i, and the Sauter meandiameter, d
� �, is given by:
d� �¼∑c
i ¼ 1Nid3i
∑ci ¼ 1Nid
2i
¼ ∑ci ¼ 1
xidi
� �1
ð4Þ
Table 2General settings for the parameters used in the CFD/DEM simulations.
Particle type Glass Column heighta,b 1.000 m (300)Particle diameter 1.5, 2.5 mm Column widtha 0.150 m (45)Particle density 2526 kg/m3 Column deptha 0.015 m (1)Particle shape Spherical Contact time �10�6 sNumber of particles 33,690–101,080 Flow solver time step 10�4–10�5 sNormal Spring Stiffness 9,000 N/m Drag correlations Ergun (1952) and Wen and Yu (1966), Beetstra et al. (2007)Coefficient of restitution Normal, 0.97; tangential, 0.33 Gas type AirCoefficient of friction 0.1
a The number of fixed CFD cells are given in parentheses.b The column height includes freeboard.
Table 3Bed configurations.
Case AParticle size (mm) 1.5 2.5Volume fraction (%) 25 75Number of particles 27,720 17,940Combined approximate static bed height, h (cm) 15Fluidization velocities (m/s) 1.15–1.40
Case BParticle size (mm) 1.5 2.5Volume fraction (%) 50 50
Number of particlesB1 27,710 5,980B2 55,430 11,960B3 83,140 17,940Combined approximate static bed height, h (cm) 7.5 (B1), 15(B2), 22.5(B3)Fluidization velocities (m/s) 1.00–1.25
Case CParticle size (mm) 1.5 2.5Volume fraction (%) 75 25Number of particles 83,150 5,980Combined approximate static bed height, h (cm) 15Fluidization velocities (m/s) 0.95–1.15
O.O. Olaofe et al. / Chemical Engineering Science 108 (2014) 258–269260
where Ni represents the number of particles of type i. c representsthe number of species present in the system and xi represents thefractional composition of type i.
Furthermore, separate simulations were conducted using boththe correction for polydispersity and the drag force for mono-disperse systems presented by Beetstra et al. (2007). The dimen-sionless drag force, for monodisperse systems, from the latticeBoltzmann simulations conducted by Beetstra et al. (2007) is givenby:
Fðϕ;ReÞ ¼ 10ϕð1�ϕÞ2
þð1�ϕÞ2ð1þ1:5ϕ1=2Þ
þ 0:413Re24ð1�ϕÞ2
ð1�ϕÞ�1þ3ϕð1�ϕÞþ8:4Re�0:343
1þ103ϕRe�ð1þ4ϕÞ=2
!ð5Þ
These DNS derived relations have been demonstrated to beaccurate for systems containing particles with diameter ratios ofup to 10 (Sarkar et al., 2009). The various states of the dragrelations are compared in this work to examine their influence onthe segregation dynamics in fludized systems.
4. Segregation
The extent of segregation is defined in Goldschmidt et al.(2003) as:
s¼ S�1Smax�1
ð6Þ
where S is the actual degree of segregation:
S¼ hsmall� �hlarge� � ð7Þ
and Smax is the maximum possible degree of segregation, when thepacking densities of the small and large particles are the same:
Smax ¼2�xsmall
1�xsmallð8Þ
The extent of segregation, s, equals 0 when the particles areperfectly mixed and 1 when the components are completelyseparated with equal packing densities in both phases.
5. Results and discussion
Several simulation runs of the bed particle configurations inCases A–C were carried out with the various drag closures.Furthermore some selected bed configurations were simulatedwith the newly developed Multi-Fluid Model (MFM) of van SintAnnaland et al. (2009a). Detailed comparisons are made between
the segregation dynamics of the various model and experimentalresults. Before discussing the results it is necessary to state clearlywhat the terms used to designate the implemented drag relationsrefer to.
� CFD/DEM with basic Ergun (1952) dragThis designation implies that the fluid-particle drag implemen-ted in the CFD/DEM were the Ergun (1952) relation in Eq. (1),when the particle fraction in the CFD cell was greater than 0.2,and the Wen and Yu (1966) relation in Eq. (2), when theparticle fraction in the CFD cell was less than 0.2.
� CFD/DEM with modified Ergun (1952) dragThis term indicates that the fluid-particle drag used in the CFD/DEM was obtained as follows:a) when the particle fraction in a computational cell exceeds
0.2, the Ergun (1952) relation in Eq. (1) is multiplied by therelation proposed by Beetstra et al. (2007) in Eq. (3) tocorrect for the effect of polydispersity. This gives
Fðϕ;ReÞ ¼ yi150ϕ
18ð1�ϕÞ2þ 1:75Re18ð1�ϕÞ2
!ð9Þ
b) when the particle fraction in a computational cell was lessthan 0.2, the Wen and Yu (1966) in Eq. (2) was used withoutany modifications.
� CFD/DEM with Beetstra et al. (2007) dragThis designation denotes that the drag force on each particlewas computed by the polydisperse form of the relation pro-posed by Beetstra et al. (2007), that is
Fðϕ;ReÞ ¼ yi10ϕ
ð1�ϕÞ2þð1�ϕÞ2ð1þ1:5ϕ1=2Þ
"
þ 0:413Re24ð1�ϕÞ2
ð1�ϕÞ�1þ3ϕð1�ϕÞþ8:4Re�0:343
1þ103ϕRe�ð1þ4ϕÞ=2
!#ð10Þ
5.1. Case A
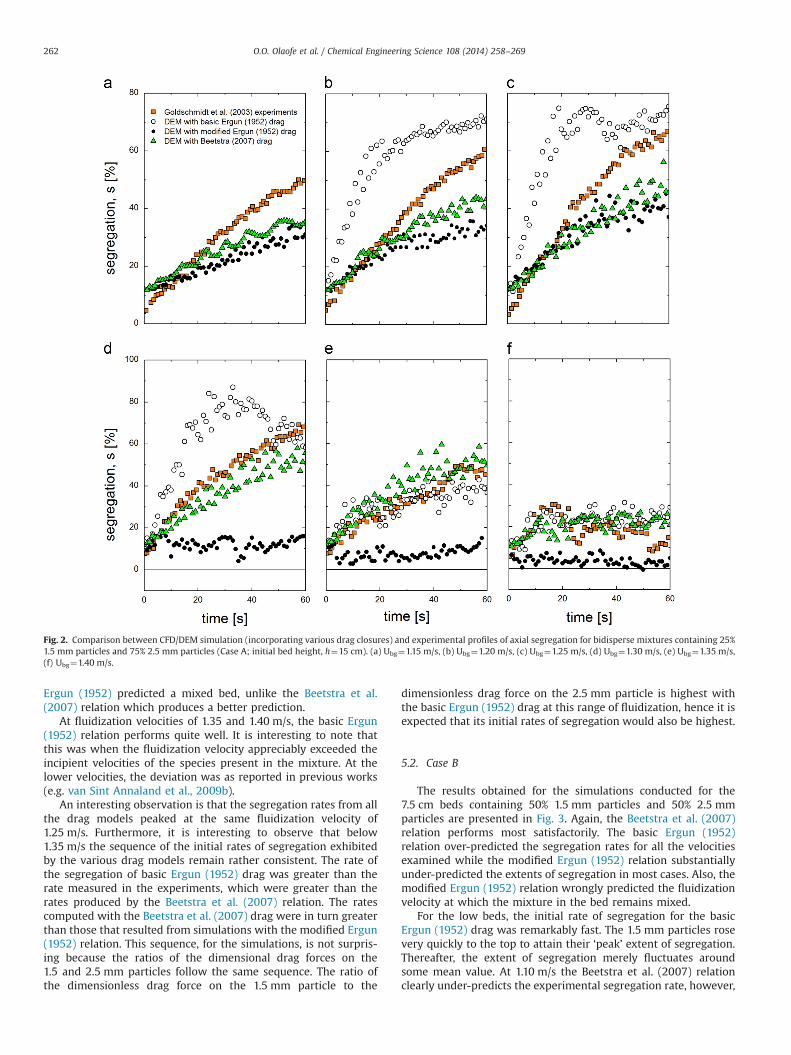
The results obtained for the simulations conducted for bedscontaining 25% 1.5 mm particles and 75% 2.5 mm particles arepresented in Fig. 2. Clearly the Beetstra et al. (2007) relationproduces the best results when the fluidization velocity rangesfrom 1.15 to 1.30 m/s, where it can also be seen that the correctionapplied to the Ergun (1952) drag resulted in over- correction of thedrag on the particles. However, from 1.15 to 1.25 m/s, it can be seenthat the segregation profile of the corrected Ergun (1952) drag iscloser to that of the Beetstra et al. (2007) relation than theuncorrected Ergun (1952) drag. From 1.30 m/s, the modified
Table 4General settings for parameters used in the CFD/DEM simulations corresponding to Case D.
Particle type Glass Column heighta,b 1.5 m (150)Particle diameter 2.5, 3.5 mm Column width (m)a 0.15 (15), 0.21 (21), 0.26 (25), 0.30 (30)Particle density 2.5�103 kg/m3 Column deptha 1.5 cm (1)Particle shape Spherical Contact time �6�10�6 sNumber of 2.5 mm particles 24,712–49,504 Flow solver time step 1.0�10�5 sNumber of 3.5 mm particles 9,061–18,041 Drag correlation Beetstra et al. (2007)Normal Spring stiffness 5,000 N/m Gas type AirCoefficient of restitution Normal, 0.9770.01; tangential, 0.3370.05 Fluidization velocity 1.72, 2.57 m/sCoefficient of friction 0, 0.170.01 Initial bed height 30 cm
a The number of fixed CFD cells are given in parentheses.b The column height includes freeboard.
O.O. Olaofe et al. / Chemical Engineering Science 108 (2014) 258–269 261
Ergun (1952) predicted a mixed bed, unlike the Beetstra et al.(2007) relation which produces a better prediction.
At fluidization velocities of 1.35 and 1.40 m/s, the basic Ergun(1952) relation performs quite well. It is interesting to note thatthis was when the fluidization velocity appreciably exceeded theincipient velocities of the species present in the mixture. At thelower velocities, the deviation was as reported in previous works(e.g. van Sint Annaland et al., 2009b).
An interesting observation is that the segregation rates from allthe drag models peaked at the same fluidization velocity of1.25 m/s. Furthermore, it is interesting to observe that below1.35 m/s the sequence of the initial rates of segregation exhibitedby the various drag models remain rather consistent. The rate ofthe segregation of basic Ergun (1952) drag was greater than therate measured in the experiments, which were greater than therates produced by the Beetstra et al. (2007) relation. The ratescomputed with the Beetstra et al. (2007) drag were in turn greaterthan those that resulted from simulations with the modified Ergun(1952) relation. This sequence, for the simulations, is not surpris-ing because the ratios of the dimensional drag forces on the1.5 and 2.5 mm particles follow the same sequence. The ratio ofthe dimensionless drag force on the 1.5 mm particle to the
dimensionless drag force on the 2.5 mm particle is highest withthe basic Ergun (1952) drag at this range of fluidization, hence it isexpected that its initial rates of segregation would also be highest.
5.2. Case B
The results obtained for the simulations conducted for the7.5 cm beds containing 50% 1.5 mm particles and 50% 2.5 mmparticles are presented in Fig. 3. Again, the Beetstra et al. (2007)relation performs most satisfactorily. The basic Ergun (1952)relation over-predicted the segregation rates for all the velocitiesexamined while the modified Ergun (1952) relation substantiallyunder-predicted the extents of segregation in most cases. Also, themodified Ergun (1952) relation wrongly predicted the fluidizationvelocity at which the mixture in the bed remains mixed.
For the low beds, the initial rate of segregation for the basicErgun (1952) drag was remarkably fast. The 1.5 mm particles rosevery quickly to the top to attain their ‘peak’ extent of segregation.Thereafter, the extent of segregation merely fluctuates aroundsome mean value. At 1.10 m/s the Beetstra et al. (2007) relationclearly under-predicts the experimental segregation rate, however,
Fig. 2. Comparison between CFD/DEM simulation (incorporating various drag closures) and experimental profiles of axial segregation for bidisperse mixtures containing 25%1.5 mm particles and 75% 2.5 mm particles (Case A; initial bed height, h¼15 cm). (a) Ubg¼1.15 m/s, (b) Ubg¼1.20 m/s, (c) Ubg¼1.25 m/s, (d) Ubg¼1.30 m/s, (e) Ubg¼1.35 m/s,(f) Ubg¼1.40 m/s.
O.O. Olaofe et al. / Chemical Engineering Science 108 (2014) 258–269262
at the higher velocities of 1.15 and 1.20 m/s it performsremarkably well.
As in Case A, the modified Ergun (1952) drag kept the system inthe mixed state at higher fluidization velocities. Furthermore, thesequence in initial segregation rates observed in Case A was tosome extent observed in Case B1. That is, the segregation rates ofthe basic Ergun (1952) relation exceeded the experimental rates,which in turn exceeded those of the Beetstra et al. (2007) relation,which also in turn exceeded those of the modified Ergun (1952)relation. It is also interesting to note that for all three fluidizationvelocities investigated the maximum extent of segregation in thebasic Ergun (1952) relation was somewhat similar to the max-imum extent of segregation in the simulations with the Beetstraet al. (2007) drag.
When the initial bed height was increased to 15 cm (Case B2,Fig. 4) the Beetstra et al. (2007) relation was less successful. In fact,from 1.00 to 1.10 m/s, the rate of segregation obtained with theBeetstra et al. (2007) relation was consistently less than the rate ofsegregation in the experiment. Also, while the segregation profilein the experiment was somewhat smooth at 1.10 m/s, the Beetstraet al. (2007) relation gave a profile with some fluctuations as aresult of the bubbling activities in the bed. It is interesting to notehowever that the Beetstra et al. (2007) relation still managed tocorrectly identify the velocity at which peak segregation rateoccurs (that is, 1.10 m/s). However, it failed to identify thefluidization velocity at which the mixture remains mixed. Surpris-ing, the modified Ergun (1952) relation, which had hitherto beenless reliable in this respect, correctly identified the critical velocityrequired to keep the mixture well mixed. It is important to notethat the profiles from the basic Ergun (1952) drag failed to evenclosely match the experimental segregation profiles at all thefluidization velocities examined. Furthermore, in addition to mak-ing the segregation rate slower, the increase in bed height delayedthe attainment of the maximum extent of segregation in both theexperiments and the simulations with the Beetstra et al. (2007)relation. However, the extents of segregation obtained with thebasic Ergun (1952) relation still managed to rise very quickly toattain the maximum value around which the segregation profilefluctuates.
The visualizations of the beds in the CFD/DEM model after 30 sof fluidization are compared with the snapshot of the experimen-tal bed in Fig. 5. The experimental bed seemed to compose of three
pseudo-layers: a top layer of the 1.5 mm particles, a middle layerthat is somewhat mixed, and a bottom layer with large regions of acomparatively high 2.5 mm particle concentration. The CFD/DEMresults with the Beetstra et al. (2007) relation gave a differentscenario with mostly 2 distinct layers: a top layer which is largerthan the top layer in the experimental bed, and a lower layerwhere the contents seemed uniformly mixed throughout. It isinteresting to note however that the Beetstra et al. (2007) relationdid not predict the rather pronounced concentration of the2.5 mm particles at the side walls of the top layer as seen in thesimulations with the basic Ergun (1952) relation.
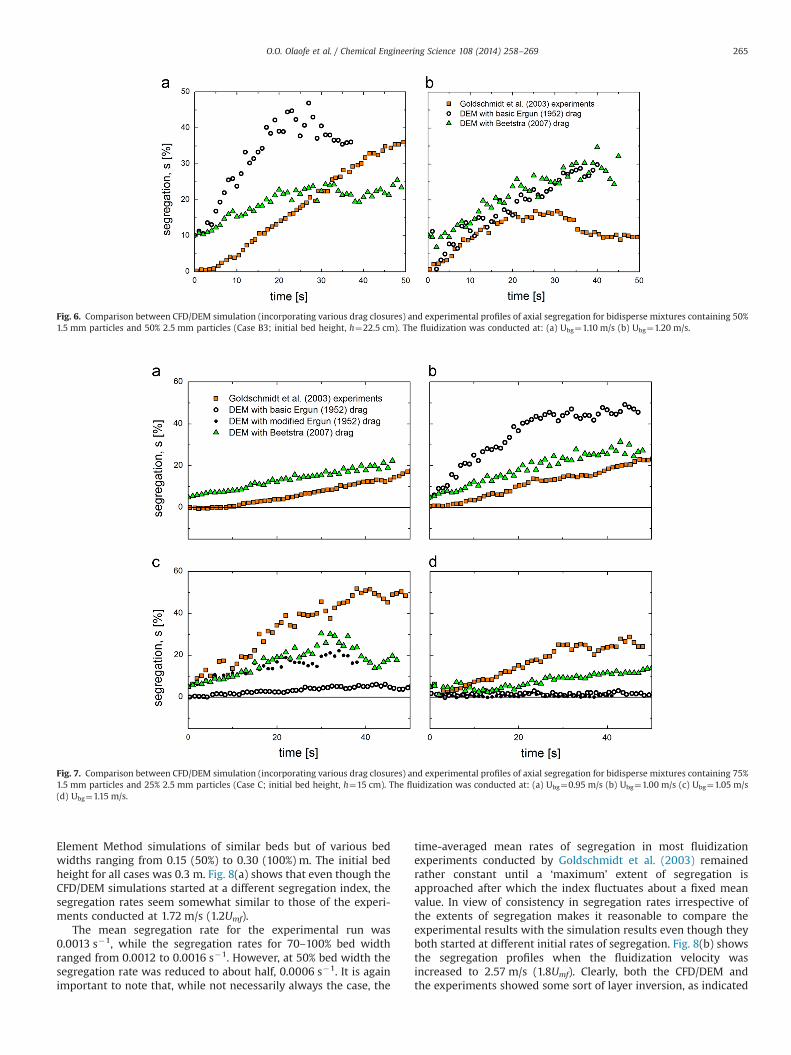
When the initial bed height was increased to 22.5 cm, both thebasic Ergun (1952) and Beetstra et al. (2007) could not reproducethe experimental results at the fluidization velocities investigated(Fig. 6). Note that most studies on axial segregation were con-ducted for relatively low bed heights (e.g. Norouzi et al., 2012).
5.3. Case C
Fig. 7 shows the extents of segregation when the mixturecontains 75% 1.5 mm particles. It can be seen that the segregationprofiles of the Beetstra et al. (2007) relation at 0.95 and 1.00 m/sare in good agreement with the experimental results. It isnecessary to mention here that, in this case, the rates of segrega-tion (i.e. the slope of the profiles) are more relevant than theprecise values of the extents of segregation because of thedifferences in the initial states of the bed. The deviation seenbetween the experimental and the Beetstra et al. (2007) profile inFig. 7(a) and (b) is more as a result of the differences in the degreeof mixedness at the initial states of the beds. The mean slopes ofboth profiles were similar throughout the observed time.
The Beetstra et al. (2007) relation was less successful at highervelocities. The extents of segregation predicted by the modelswere less than the experimental values for fluidization at 1.05 and1.15 m/s. Furthermore, this time around the model did not dis-tinctively capture the fluidization velocity at which the peaksegregation rate occurred.
5.4. Case D
Fig. 8 compares the experimental results of the fluidizationexperiments of the 2.5–3.5 mm mixture, with the Discrete
Fig. 3. Comparison between CFD/DEM simulation (incorporating various drag closures) and the experimental profiles of axial segregation for bidisperse mixtures containing 50%1.5 mm particles and 50% 2.5 mm particles (Case B1; initial bed height, h¼7.5 cm). The fluidization was conducted at (a) Ubg¼1.10 m/s, (b) Ubg¼1.15 m/s, (c) Ubg¼1.20 m/s.
O.O. Olaofe et al. / Chemical Engineering Science 108 (2014) 258–269 263
Fig. 4. Comparison between CFD/DEM simulation (incorporating various drag closures) and experimental profiles of axial segregation for bidisperse mixtures containing 50%1.5 mm particles and 50% 2.5 mm particles (Case B2; initial bed height, h¼15 cm). The fluidization was conducted at: (a) Ubg¼1.00 m/s (b) Ubg¼1.05 m/s (c) Ubg¼1.10 m/s(d) Ubg¼1.15 m/s (e) Ubg¼1.20 m/s (f) Ubg¼1.25 m/s.
Fig. 5. Snapshot of experimental bed, left; the visualization of a CFD/DEM simulation using the drag closures presented by Beetstra et al. (2007), middle; and thevisualization of CFD/DEM simulation using the basic form of the drag closure presented by Ergun (1952) equation, right. All images shows the bed states for Case B2 after 30 sof fluidization. The 1.5 mm particles are yellowish and the 2.5 mm particles are reddish brown. (For interpretation of the references to color in this figure legend, the reader isreferred to the web version of this article.)
O.O. Olaofe et al. / Chemical Engineering Science 108 (2014) 258–269264
Element Method simulations of similar beds but of various bedwidths ranging from 0.15 (50%) to 0.30 (100%) m. The initial bedheight for all cases was 0.3 m. Fig. 8(a) shows that even though theCFD/DEM simulations started at a different segregation index, thesegregation rates seem somewhat similar to those of the experi-ments conducted at 1.72 m/s (1.2Umf).
The mean segregation rate for the experimental run was0.0013 s�1, while the segregation rates for 70–100% bed widthranged from 0.0012 to 0.0016 s�1. However, at 50% bed width thesegregation rate was reduced to about half, 0.0006 s�1. It is againimportant to note that, while not necessarily always the case, the
time-averaged mean rates of segregation in most fluidizationexperiments conducted by Goldschmidt et al. (2003) remainedrather constant until a ‘maximum’ extent of segregation isapproached after which the index fluctuates about a fixed meanvalue. In view of consistency in segregation rates irrespective ofthe extents of segregation makes it reasonable to compare theexperimental results with the simulation results even though theyboth started at different initial rates of segregation. Fig. 8(b) showsthe segregation profiles when the fluidization velocity wasincreased to 2.57 m/s (1.8Umf). Clearly, both the CFD/DEM andthe experiments showed some sort of layer inversion, as indicated
Fig. 6. Comparison between CFD/DEM simulation (incorporating various drag closures) and experimental profiles of axial segregation for bidisperse mixtures containing 50%1.5 mm particles and 50% 2.5 mm particles (Case B3; initial bed height, h¼22.5 cm). The fluidization was conducted at: (a) Ubg¼1.10 m/s (b) Ubg¼1.20 m/s.
Fig. 7. Comparison between CFD/DEM simulation (incorporating various drag closures) and experimental profiles of axial segregation for bidisperse mixtures containing 75%1.5 mm particles and 25% 2.5 mm particles (Case C; initial bed height, h¼15 cm). The fluidization was conducted at: (a) Ubg¼0.95 m/s (b) Ubg¼1.00 m/s (c) Ubg¼1.05 m/s(d) Ubg¼1.15 m/s.
O.O. Olaofe et al. / Chemical Engineering Science 108 (2014) 258–269 265
by the negative values of the extents of segregation, in which theaverage heights of the jetsam (3.5 mm particles) exceeded that ofthe flotsam (2.5 mm particles). In all cases, the mean time-averaged segregation rates were more or less similar and constant.Again, the initial segregation index in the simulations was muchhigher, however, the extent of segregation resolves rapidly to thequasi-steady state value.
5.5. The multi fluid model predictions
The ability of a continuum-based model to predict the segrega-tion dynamics of binary mixtures has also been examined. For this,the newly developed Multi-Fluid Model (MFM) by van SintAnnaland et al. (2009a) has been used. In their closure equations,the rheologic properties of the particle mixture are explicitly
described in terms of the particle mixture velocity and granulartemperature, and the diffusion velocity and granular temperatureof the individual particle phases are computed from the mixtureproperties, a major advantage with respect to the numericalimplementation. From their studies, van Sint Annaland et al.(2009b) reported that the segregation rates they computed withthe MFM were in much better agreement with the experimentscompared to other MFMs in use. They also reported, however, thatat longer times the segregation rates is underestimated by themodel, unlike in other types of MFM where it is significantlyoverestimated.
Key parameters set in the MFM simulation carried out in thiswork are shown in Table 5. The maximum packing for the radialdistribution function was set to 0.60. This was done because theMFM, as reported by van Sint Annaland et al. (2009b), is only ableto correctly predict the minimum fluidization velocities at thisvalue. To account for the dissipation of granular energy due toparticle–particle friction, an effective coefficient of restitution of0.88 was used. The traditional Ergun (1952) and Wen andYu (1966) drag relations were used for the MFM.
The results of the simulations are presented in Fig. 9. The MFMfailed to correctly predict the segregation dynamics when the1.5 mm particle fraction was 25%. While the experiment showed asmooth increase in the extent of segregation, the MFM showedsome fluctuations with no noticeable consistent increase. A some-what similar scenario was also observed when the 50 % 1.5 mmparticle mixture was fluidized at 1.10 m/s. However, at the higherfluidization velocity of 1.15 and 1.20 m/s with the 50% mixture, theperformance of MFM seemed to improve. As a matter of fact, theMFM correctly predicted the initial rate of segregation, theoccurrence of the maximum extent of segregation and the trendafter the maximum for the 1.20 m/s fluidization. However, whilethe MFM seemed to predict correctly the initial rate of segregationat 1.15 m/s, it failed in its prediction of the segregation dynamicsafter the peak.
The CFD/DEM bed visualizations are compared with oneanother and the MFM visualizations in Figs. 10 and 11. Clearly,the MFM predicted the bottom strata with a high concentration ofthe 2.5 mm particles even though it predicted a smaller dimen-sion. It also predicted a mixed middle region with a relativelyhigher concentration of the 2.5 mm particle, and a top layer ofmostly the 1.5 mm particle. This observation seems to match theexperimental snapshot in Fig. 5 (for a taller bed!) where the bedalso had a small top layer, a mixed middle region and a smallbottom layer. Furthermore, it was interesting to see the MFMpredict the trends in peaks and troughs of the boundary of the2.5 mm particle-rich bottom strata of the CFD/DEM with the basicErgun (1952) drag (Fig. 11). Clearly, the MFM results match moreclosely the CFD/DEM simulations with the Ergun (1952) drag thanthe other CFD/DEM results in Fig. 10. Consequently, even betteragreement with the experiments could be achieved with theimplementation of the more successful Beetstra et al. (2007)relation.
Fig. 8. The CFD/DEM and experimental time profiles of the extent of segregationfor bidisperse mixtures, containing 50% 2.5 mm particles and 50% 3.5 mm particles,which were fluidized at (a.) 1.72 m/s (1.2Umf) and (b.) 2.57 m/s (1.8Umf); where thebed width is denoted by w.
Table 5General settings of parameters for MFM simulations.
Particle type Glass Column heighta,b 0.40 m (120)
Particle diameter 1.5, 2.5 mm Column widtha 0.15 m (45)Particle density 2526 kg/m3 Initial bed height 0.15 mParticle shape Spherical Time step 10�5 sMaximum packing fraction 0.60 Mass deficits relative accuracy 10�5 sCoefficient of restitution (effective) 0.88 Drag correlations Ergun (1952) and Wen and Yu (1966);Injection velocity 1.10, 1.15, 1.20 m/s Gas type Air
a The number of fixed Eulerian cells are given between brackets.b The bed height includes the emulsion phase and the freeboard.
O.O. Olaofe et al. / Chemical Engineering Science 108 (2014) 258–269266
Fig. 9. Comparison between CFD/DEM and MFM simulations and the experimental profiles of axial segregation for selected bidisperse mixtures. (a.) xsmall¼25%, Ubg¼1.15 m/s, h¼15 cm (b.) xsmall¼50%, Ubg¼1.10 m/s, h¼7.5 cm (c.) xsmall¼50%, Ubg¼1.15 m/s, h¼7.5 cm (d.) xsmall¼50%, Ubg¼1.20 m/s, h¼7.5 cm.
Fig. 10. CFD/DEM bed visualizations at 15, 30, 45 and 60 s respectively for simulation using: (a.) top, the drag closure from Beetstra et al. (2007) (b.) middle, drag closurefrom Ergun (1952) equation and (c.) bottom, drag closure from Ergun (1952) corrected for the effects of polydispersity with the relation presented by Beetstra et al. (2007).The 1.5 mm particles are yellowish and the 2.5 mm particles are reddish brown. (For interpretation of the references to color in this figure legend, the reader is referred to theweb version of this article.)
O.O. Olaofe et al. / Chemical Engineering Science 108 (2014) 258–269 267
6. Conclusions
State-of-the-art hydrodynamic models, the Euler–Lagrangebased CFD/DEM and the Euler–Euler based MFM, have been usedto study the segregation of binary mixtures of Geldart group Dparticles in order to evaluate their abilities to predict the axialsegregation dynamics in such systems. Investigations have beenlimited to rather low fluidization velocities during which thesegregation behavior of binary systems is expected to be pro-nounced, and special focus has been on the role/mode of dragrelations in the performance of the hydrodynamic models.
The CFD/DEM was found to predict, reliably, the segregationrates in some binary bed conditions when the DNS derived dragrelation proposed by Beetstra et al. (2007), which specificallyaddresses the effect of polydispersity, was implemented. Moreparticularly, it was observed that the CFD/DEM is able to reliablypredict the segregation dynamics at some fluidization velocitiesfor beds with an aspect ratio of 1 and below. However, the CFD/DEM made less reliable predictions when the bed height exceededthe bed width. Hence, any variants of hydrodynamic models mustbe subjected to tests with tall beds in any verification andvalidation process. Furthermore, the experimental results of the2.5–3.5 mm binary mixture gave trends that were consistent withCFD/DEM simulations. Rates of segregation obtained with the CFD/DEM were in agreement with the experiments carried out at thefluidization velocities of 1.2 and 1.8Umf, and a slight layer inversion
observed in the experiments at 1.8Umf was also reproduced in theCFD/DEM.
Although the MFM, with the traditional Ergun (1952) and Wenand Yu (1966) drag relation, was able to very accurately predict thesegregation dynamics in the 50–50% 1.5–2.5 mm mixture forfluidization at 1.20 m/s, generally, simulations executed with theMFM were less successful compared with the CFD/DEM. This re-emphasizes the need to implement frictional stresses associatedwith long-term multiple-particle contacts as reported by van SintAnnaland et al. (2009b).
Nomenclature
c number of species present in the system, dimensionlessdi diameter of particle specie i (m)d� �
Sauter mean diameter (m)Fcontact,a sum of individual contact forces exerted by all other
particles in contact with particle a (N)Fext,a sum of gravitational force, drag force and force resulting
from pressure gradient (N)Fpp,a sum of all other particle–particle forces e.g. short-range
cohesive forces (N)g acceleration due to gravity (m/s2)hi� �
average height of specie i (m)I moment of inertia (kg/m2)
Fig. 11. Bed simulation results visualizations at 15, 30, 45 and 60 s respectively for: (a.) top, CFD/DEM (b.) middle, small particle fractions in the MFM (c.) bottom, gasporosities in the MFM. All results were obtained using the basic form of the Ergun (1952) drag.
O.O. Olaofe et al. / Chemical Engineering Science 108 (2014) 258–269268
I unit tensor vectorsm mass (kg)Ni number of particles of specie iNpart number of particlesP pressure (N/m2)r position vector (m)Re Reynolds number, dimensionlesss extent of segregation, dimensionlessS actual segregation, dimensionlessSmax maximum extent of segregation, dimensionlessSp source term that describes the momentum exchange
with the solid particles present in the control volumet time (s)T torque (Nm)u velocity vector (m/s)Ubg fluidization/background velocity (m/s)Umf incipient fluidization velocity (m/s)v velocity vector (m/s)V local volume of a computational cell (m3)Va volume of particle a (m3)w bed width (m) (Fig. 8)xi mass fraction of specie i, dimensionlessβ momentum transfer coefficientδ vector functionε gas void fraction, dimensionlessϕ solid fraction, dimensionlessλ gas phase bulk viscosity (Pa s)μ gas phase shear viscosity (Pa s)ρ density (kg/m3)ω angular velocity (rad/s)
Subscripts
a particlesmall small particle specielarge large particle specie
Acknowledgements
The authors gratefully acknowledge the financial support ofThe Netherlands Organization for Scientific Research (NWO).
References
Beetstra, R., van der Hoef, M.A., Kuipers, J.A.M., 2007. Drag force of intermediateReynolds number flow past mono- and bidisperse arrays of spheres. AlChE J. 53,489–501.
Bokkers, G.A., van Sint Annaland, M., Kuipers, J.A.M., 2004. Mixing and segregationin a bidisperse gas–solid fluidised bed: a numerical and experimental study.Powder Technol. 140, 176–186.
Cundall, P.A., Strack, O.D.L., 1979. Discrete numerical model for granular assemblies.Geotechnique 29, 47–65.
Ergun, S., 1952. Fluid flow through packed columns. Chem. Eng. Process 48, 89.Farzaneh, M., Sasic, S., Almstedt, A., Johnsson, F., Pallarès, D., 2011. A novel multigrid
technique for Lagrangian modeling of fuel mixing in fluidized beds. Chem. Eng.Sci. 66, 5628–5637.
Goldschmidt, M.J.V., Link, J.M., Mellema, S., Kuipers, J.A.M., 2003. Digital imageanalysis measurements of bed expansion and segregation dynamics in densegas-fluidised beds. Powder Technol. 138, 135–159.
Hoomans, B.P.B., Kuipers, J.A.M., Briels, W.J., van Swaaij, W.P.M., 1996. Discreteparticle simulation of bubble and slug formation in a two-dimensional gas-fluidised bed: a hard-sphere approach. Chem. Eng. Sci. 51, 99–118.
Hoomans B.P.B., Kuipers J.A.M., van Swaaij W.P.M., 1998. Discrete particle simula-tion of segregation phenomena in dense gas-fluidized beds, In: L.S. Fan, T.M.Knowlton (Eds.), Fluidization, vol. IX, pp. 485–492.
Kawaguchi, T., Tanaka, T., Tsuji, Y., 1998. Numerical simulation of two-dimensionalfluidized beds using the discrete element method (comparison between thetwo- and three-dimensional models). Powder Technol. 96, 129–138.
Link, J.M., Cuypers, L.A., Deen, N.G., Kuipers, J.A.M., 2005. Flow regimes in a spout–fluid bed: a combined experimental and simulation study. Chem. Eng. Sci. 60,3425–3442.
Mikami, T., Kamiya, H., Horio, M., 1998. Numerical simulation of cohesive powderbehavior in a fluidized bed. Chem. Eng. Sci. 53, 1927–1940.
Norouzi, H.R., Mostoufi, N., Sotudeh-Gharebagh, R., 2012. Effect of fines onsegregation of binary mixtures in gas–solid fluidized beds. Powder Technol.225, 7–20.
Olaofe, O.O., Buist, K.A., Deen, N.G., van der Hoef, M.A., Kuipers, J.A.M., 2013.Segregation dynamics in polydisperse dense gas fluidized beds. PowderTechnol. 246, 695–706.
Sarkar, S., Kriebitzsch, S.H.L., van der Hoef, M.A., Kuipers, J.A.M., 2009. Gas–solidinteraction force from direct numerical simulation (DNS) of binary systemswith extreme diameter ratios. Particuology 7, 233–237.
Tagami, N., Mujumdar, A., Horio, M., 2009. DEM simulation of polydisperse systemsof particles in a fluidized bed. Particuology 7, 9–18.
van der Hoef, M.A., Ye, M., van Sint Annaland, M., Andrews, A.T., Sundaresan, S.,Kuipers, J.A.M., 2006. Multiscale modeling of gas-fluidized beds. In: Marin, GuyB. (Ed.), Advances in Chemical Engineering, 31. Academic Press, pp. 65–149.
van Sint Annaland, M., Bokkers, G.A., Goldschmidt, M.J.V., Olaofe, O.O., van der Hoef,M.A., Kuipers, J.A.M., 2009a. Development of a multi-fluid model for poly-disperse dense gas–solid fluidised beds, Part I: Model derivation and numericalimplementation. Chem. Eng. Sci. 64, 4222–4236.
van Sint Annaland, M., Bokkers, G.A., Goldschmidt, M.J.V., Olaofe, O.O., van der Hoef,M.A., Kuipers, J.A.M., 2009b. Development of a multi-fluid model for poly-disperse dense gas–solid fluidised beds, Part II: Segregation in binary particlemixtures. Chem. Eng. Sci. 64, 4237–4246.
Wang, J., van der Hoef, M.A., Kuipers, J.A.M., 2009. Why the two-fluid model fails topredict the bed expansion characteristics of Geldart a particles in gas-fluidizedbeds: a tentative answer. Chem. Eng. Sci. 64, 622–625.
Wen, C.Y., Yu, Y.H., 1966. Mechanics of fluidization. AlChE J. 62, 1.
O.O. Olaofe et al. / Chemical Engineering Science 108 (2014) 258–269 269