ISSN: 2319-5967 ISO 9001:2008 Certified International Journal of Engineering Science and Innovative Technology (IJESIT) Volume 4, Issue 3, May 2015 253 Abstract— Although solar photovoltaic technology is one of the matured technologies, its initial high cost and low efficiency have not made it fully attractive as an alternative option for electricity users. Hence it is very critical to utilize the maximum available solar power of the array and to operate the PV array at its highest energy conversion output. For this, the solar PV generating system has to operate at the maximum power output point. Since the maximum power point varies with radiation and temperature, it is difficult to maintain optimum power operation at all radiation levels. Over the years, many MPPT techniques have been advocated, developed and implemented. These methods vary in several aspects such as complexity, required number of sensors, convergence speed, cost, range of effectiveness, ease of hardware implementation etc. Although different methods have been developed by different research groups, very little literature is available, where different MPPT techniques/methods are compared in terms of energy capture, conversion efficiency, response time and reliability. This study compares the performance of different MPPT methods that are currently used in a solar PV system and also advocates a new MPPT technique which offers better performance than the existing ones. The methodology adopted for analysis is as follows: Initially, a MATLAB based solar PV array model is first developed and validated; then, different MPPT techniques are employed on this PV array under varying temperature and insolation conditions to study the effectiveness of the particular MPPT technique under consideration. I. INTRODUCTION The growing demand for electrical energy throughout the world has caused a great need to consider renewable energy sources as a technological option for sustainable energy supply. Among the renewable energy sources photovoltaic (PV) energy is now becoming one of the fastest growing renewable energy technologies due to continuous cost reduction and technological progress. PV is the field of technology related to the application of solar cells by converting sunlight directly into electricity. Due to the nonlinear relationship between the current and the voltage of the PV cell, it can be observed that there is a unique Maximum Power Point (MPP) at a particular environment, and this peak power point keeps changing with solar illumination and ambient temperature. An important consideration in achieving high efficiency in PV power generation system is to match the PV source and load impedance properly for any weather conditions, thus obtaining maximum power generation. Therefore, the system needs a Maximum power point tracking (MPPT) which sets the system working point to the optimum and increases the system’s output power. The main aim of this work is to use the solar power with MPPT technique. An attempt has been made to design solar panel with MPPT controller and DC - DC converter which switches in between buck and boost topology depending upon the input voltage and the switching signals from the MPPT algorithm. It uses a multi objective control algorithm wherein, the system is classified into various states based on operating conditions of the PV array and the load to generate the Pulse Width Modulation (PWM) pulses. By judging the state and setting the related control goal, the power will be balanced to satisfy the MPPT control. II. SOLAR CELL A solar cell (also called a photovoltaic cell) is an electrical device that converts the energy of light directly into electricity by the photovoltaic effect. It is a form of photoelectric cell (in that its electrical characteristics e.g. current, voltage, or resistance vary when light is incident upon it) which, when exposed to light, can generate and support an electric current without being attached to any external voltage source, but do require an external load for power consumption. The operation of a photovoltaic (PV) cell requires 3 basic attributes: 1. The absorption of light, generating either electron-hole pairs. 2. The separation of charge carriers of opposite types. Simulation of Photovoltaic Cell and MPPT Controllers and their Analysis ANAND KUMAR S, K L RATNAKAR, B.S.YOGANANDA, Dr. B. Rajesh Kamath
Transcript
ISSN: 2319-5967
ISO 9001:2008 Certified International Journal of Engineering Science and Innovative Technology (IJESIT)
Volume 4, Issue 3, May 2015
253
Abstract— Although solar photovoltaic technology is one of the matured technologies, its initial high cost and low
efficiency have not made it fully attractive as an alternative option for electricity users. Hence it is very critical to utilize the
maximum available solar power of the array and to operate the PV array at its highest energy conversion output. For this,
the solar PV generating system has to operate at the maximum power output point. Since the maximum power point varies
with radiation and temperature, it is difficult to maintain optimum power operation at all radiation levels. Over the years,
many MPPT techniques have been advocated, developed and implemented. These methods vary in several aspects such as
complexity, required number of sensors, convergence speed, cost, range of effectiveness, ease of hardware implementation
etc. Although different methods have been developed by different research groups, very little literature is available, where
different MPPT techniques/methods are compared in terms of energy capture, conversion efficiency, response time and
reliability. This study compares the performance of different MPPT methods that are currently used in a solar PV system
and also advocates a new MPPT technique which offers better performance than the existing ones. The methodology
adopted for analysis is as follows: Initially, a MATLAB based solar PV array model is first developed and validated; then,
different MPPT techniques are employed on this PV array under varying temperature and insolation conditions to study
the effectiveness of the particular MPPT technique under consideration.
I. INTRODUCTION
The growing demand for electrical energy throughout the world has caused a great need to consider renewable
energy sources as a technological option for sustainable energy supply. Among the renewable energy sources
photovoltaic (PV) energy is now becoming one of the fastest growing renewable energy technologies due to
continuous cost reduction and technological progress. PV is the field of technology related to the application of
solar cells by converting sunlight directly into electricity.
Due to the nonlinear relationship between the current and the voltage of the PV cell, it can be observed that there is
a unique Maximum Power Point (MPP) at a particular environment, and this peak power point keeps changing with
solar illumination and ambient temperature. An important consideration in achieving high efficiency in PV power
generation system is to match the PV source and load impedance properly for any weather conditions, thus
obtaining maximum power generation. Therefore, the system needs a Maximum power point tracking (MPPT)
which sets the system working point to the optimum and increases the system’s output power.
The main aim of this work is to use the solar power with MPPT technique. An attempt has been made to design
solar panel with MPPT controller and DC - DC converter which switches in between buck and boost topology
depending upon the input voltage and the switching signals from the MPPT algorithm. It uses a multi objective
control algorithm wherein, the system is classified into various states based on operating conditions of the PV array
and the load to generate the Pulse Width Modulation (PWM) pulses. By judging the state and setting the related
control goal, the power will be balanced to satisfy the MPPT control.
II. SOLAR CELL
A solar cell (also called a photovoltaic cell) is an electrical device that converts the energy of light directly into
electricity by the photovoltaic effect. It is a form of photoelectric cell (in that its electrical characteristics e.g.
current, voltage, or resistance vary when light is incident upon it) which, when exposed to light, can generate and
support an electric current without being attached to any external voltage source, but do require an external load for
power consumption.
The operation of a photovoltaic (PV) cell requires 3 basic attributes:
1. The absorption of light, generating either electron-hole pairs.
2. The separation of charge carriers of opposite types.
Simulation of Photovoltaic Cell and MPPT
Controllers and their Analysis ANAND KUMAR S, K L RATNAKAR, B.S.YOGANANDA, Dr. B. Rajesh Kamath
ISO 9001:2008 Certified International Journal of Engineering Science and Innovative Technology (IJESIT)
Volume 4, Issue 3, May 2015
254
3. The separate extraction of those carriers to an external circuit.
III. CHARACTERISTICS OF PV CELLS
Electrical characteristics of PV cells
The voltage-current (V-I) characteristic of each solar cell is as shown in the Fig.1. The nonlinearity of the
characteristic curve is due to the problem associated to extract maximum possible power from the photovoltaic
(PV) cell. The Fig.1 below also shows the power-voltage characteristic curve.
While observing the P-V curve of the photovoltaic cell [2] it can be observed that there is a peak power that
corresponds to a particular voltage and current. It is to make that the solar panel must be operating at a point where
P-V curve is at the maximum. However, the point at which the solar panel operates keeps on changing due to
changing ambient conditions such as temperature levels and insolation.
Fig 1: Photovoltaic V-I characteristic curve and P-V curve
Effect of Insolation Levels
The insolation is described as the flux of radiant energy extracted from the sun and is closely related to irradiance.
The power taken is in per unit area; where the intensity and spectral content varies with the position of sun, cloud
cover, moisture content in the air. The amount of sunlight that is being delivered to the specific surface area over a
day is being referred as insolation and is measured in kilowatt-hours per square meter per day (kWh/(m2*day)).
The sun radiation should be extracted in perpendicular to the photovoltaic module in order to extract maximum
amount of energy. The effects of insolation at different temperature on V-I curve of solar panel are shown in Fig .2
Fig. 2: Effect of insolation on V-I curve
Effect of Temperature
The performance of a photovoltaic module is greatly affected by the temperature. However, it is not that much
important factor as compared to the duration and the sunlight intensity. It should also be noted that the output
power of the photovoltaic module decreases with increase in temperature. The temperature affects the efficiency of
the photovoltaic module and normally the crystalline silicon photovoltaic module the efficiency is reduced by 0.5
ISSN: 2319-5967
ISO 9001:2008 Certified International Journal of Engineering Science and Innovative Technology (IJESIT)
Volume 4, Issue 3, May 2015
255
percent for temperature increase by every degree Celsius. The fig .3 shows the output of solar panel with varying
temperature. It can be observed that with the increase in temperature there is drop in voltage which is shown in
fig.3
Fig 3: Temperature effect on solar panel V-I curves
IV. MAXIMUM POWER POINT TRACKING (MPPT)
Power output of a Solar PV module changes with change in direction of sun, changes in solar insolation level and
with varying temperature as shown in the Fig .4
Fig .4: Changes in the characteristics of the Solar PV module due to change in the insolation level.
As seen in the PV (power vs. voltage) curve of the module there is a single maxima of power. That is there exists a
maximum power corresponding to a particular voltage and current. We know that the efficiency of the solar PV
module is low about 13%. Since the module efficiency is low it is desirable to operate the module at the maximum
power point so that the maximum power can be delivered to the load under varying temperature and insolation
conditions. Hence improves and maximize the utilization of the solar PV module. A maximum power point tracker
(MPPT) is used for extracting the maximum power[7] from the solar PV module and transferring that power to the
load. A DC-DC converter (step up/step down) serves the purpose of transferring maximum power from the solar
PV module to the load. A DC-DC converter acts as an interface between the load & module shown in Fig .5
Fig.5: Block diagram of a typical MPPT system
Methods of Maximum Power Point Tracking
The maximum power is reached with the help of a dc/dc converter by adjusting its duty Cycle. Now question arises
ISSN: 2319-5967
ISO 9001:2008 Certified International Journal of Engineering Science and Innovative Technology (IJESIT)
Volume 4, Issue 3, May 2015
256
how to vary the duty cycle and in which direction so that maximum power is reached. An automatic tracking can be
performed by utilizing various algorithms.
a. Perturb and observe
b. Incremental Conductance
c. Parasitic Capacitance
d. Voltage Based Maximum Power Tracking
e. Current Based Maximum power Tracking
1. Perturb and observe In this method the controller adjusts the voltage by a small amount from the array and measures power; if the power increases, further adjustments in that direction are tried until power no longer increases. This is called the perturb and observe method and is most common, although this method can result in oscillations of power output. It is referred to as a hill climbing method, because it depends on the rise of the curve of power against voltage below the maximum power point, and the fall above that point. Perturb and observe is the most commonly used MPPT method due to its ease of implementation.
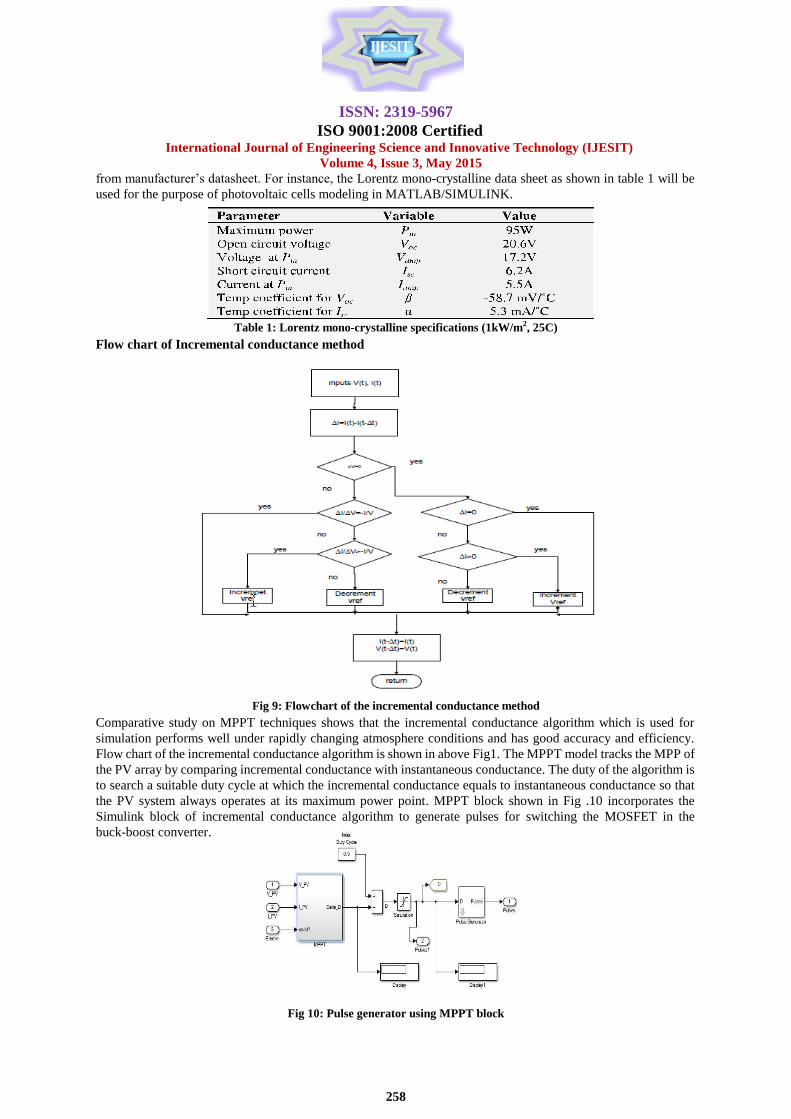
2. Incremental conductance
In the incremental conductance method, the controller measures incremental changes in array current and voltage
to predict the effect of a voltage change. This method requires more computation in the controller, but can track
changing conditions more rapidly than the perturb and observe method (P&O).The incremental conductance
method computes the maximum power point by comparison of the incremental conductance to the array
conductance. When these two are the same, the output voltage is the MPP voltage. The controller maintains this
voltage until the irradiation changes and the process is repeated.
Comparison of methods
Both perturb and observe, and incremental conductance, are examples of "hill climbing" methods that can find the
local maximum of the power curve for the operating condition of the array, and so provide a true maximum power
point. The comparison [1] is detailed in table below.
MPPT Additional power
component
Sensor Micro controller
computation
Total
CV absent low absent/low low
P&Oa absent medium low low/medium
ICa absent medium medium medium
ICb absent high medium/high high
V. MODELING AND SIMULATION
Mathematical Modeling of photovoltaic cell/ module and development of power converter using Matlab/Simulink
is presented in this paper in order to simulate the basic operation of MPPT based controller.
DETAILED BLOCK DIAGRAM
Fig 6: Detailed block diagram
Model of a photo voltaic (PV) cell
The solar cell is modeled by a current source and inverted diode connected parallel to it. It also has series and
ISSN: 2319-5967
ISO 9001:2008 Certified International Journal of Engineering Science and Innovative Technology (IJESIT)
Volume 4, Issue 3, May 2015
257
parallel resistance as shown in Fig 6 below.
Fig.7: Single diode model of a PV cell
From the Fig 7, the output voltage (V) and current (I) of a solar cell can be expressed as:
𝐼=𝐼𝐿−{exp(𝑉+𝐼𝑅𝑠/𝛼)−1}
Where, IL is light current, Io is saturation current and is the thermal voltage timing completion factor of the cell.
𝐼={𝐼𝑝−𝐼𝑛(exp(𝑞(𝑉+𝐼𝑅𝑠)/𝐴𝐾𝑇𝑁𝑠−1))};
Where, 𝐼𝑟𝑠=𝐼𝑛 (𝑇/𝑇𝑟)3exp{𝐸𝐺/𝐴𝐾(1/𝑇𝑟−1/𝑇)};
q = charge of an electron (1.6 x 10⁻⁹
C); K = Boltzman’s constant (1.38 x 10⁻²³
J/˚K);
A = diode ideality factor (1.92); T = cell temperature;
Irs = cell reverse saturation current at Tr; Tr = cell reverse temperature (28˚C);
EG = band gap energy of semiconductor (1.11eV); Iph = photocurrent given by the equation:
𝐼𝑝={𝐼𝑠𝑐𝑟+𝐾𝑖(𝑇−𝑇𝑟)}𝑆/100
ISCR = cell short circuit current at Tr and radiation; Ki = short circuit current temperature coefficient;
S = solar radiation (mW/cm2);
MATLAB – Simulink model of PV cell/module has been designed based on the above equations, Fig 8a shows six
solar cell connected in series to make one solar array, Fig 8 b shows the six solar are connected in series to make
solar panel as shown in Fig 8 c
Fig. 8 a: Solar cell connected in series Fig.8 b: Solar array connected in series
Fig. 8 c: solar panel model in MATLAB-SIMULINK
The data required for modeling and simulation of solar panel and the maximum power point tracking systems will
be used from the available sources in the literature. The parameters required for the photovoltaic cells can be used
ISSN: 2319-5967
ISO 9001:2008 Certified International Journal of Engineering Science and Innovative Technology (IJESIT)
Volume 4, Issue 3, May 2015
258
from manufacturer’s datasheet. For instance, the Lorentz mono-crystalline data sheet as shown in table 1 will be
used for the purpose of photovoltaic cells modeling in MATLAB/SIMULINK.