A 3D simulation of the lower trophic ecosystem in the Ise-Mikawa Bay estuary using a coupled physical and biological model
K. ~akata ' , K. ~ a ~ u c h i ~ , T. 1chikawa2 & T. ~ r u ~ u c h i * I Faculty of Marine Science and Technology, Tokai University, 3-20-1 Orido, Shimizu, Shizuoka, 424-8610 Japan Computational Science Department. 'CTI Co. Ltd., 1-2 7-2 Meieki-Minami, Nakamura-ku, Nagoya, 450-0003 Japan.
Abstract
The long-term variation in flow velocity, temperature and salinity fields in the Ise-Mikawa Bay estuary was examined in a triennial simulation, using a time- dependent 3-D hydrodynamic model. The simulation covered from April 1993 to March 1996. The daily change regimes of the observed sea-surface winds, tidal elevation at the open boundary, river discharges and meteorological parameters were incorporated into the forcing variables of the modelled estuary.
Simulated distributions of temperature and salinity were compared favorably with the field measurements both in time and space, suggesting good reproducibility of the flow field by the hydrodynamic model.
The numerical results were compared favorably with the field measurements of water quality indicating the validity and predictive capability of the model, and thus served for a detailed analysis of nutrient and oxygen cycles in the estua~y. It turned out from the nutrient flux analysis that primary productivity vaiied considerably over the three years in relation to water temperature and that the most limiting nutrient to phytoplankton growth was nitrogen. The oxygen field in the bottom layer, on the contrary, did not show any clear year-to-year variation in that the oxygen-depleted water mass regularly appeared in the middle-upper basin from late June, developed to cover the whole middle-upper basin in midsummer, and dissipated by about mid-November.
1 Introduction
Our modelling research on estuarine processes has made progress over the past 20 years through the implementation of environmental impact studies that precede with coastal development. The results of our work are found in numerical
24 Water Pollution \ / / I : Modclling, Mca~uring and Prediction
models such as those given by Nakata et al. ([1],[2],[3]&[4]), and Taguchi and Nakata [6]. The environment of an estuary, in general, varies over a wide range both temporally and spatially, because it is affected by dynamic forcing variables such as tide, river discharge, pollutant input, surface wind and other meteorological parameters; and its coastline geometry and bottom topography are usually complicated. That is why the models have been described in a 3-D time- dependent version..
The environment of the Ise-Mikawa Bay estuary has been regularly monitored by the local administrative offices of Japan; e.g., the environmental and fishery departments of Aichi and Mie Prefectures. In addition, as part of a comprehensive presiting environmental study on the impact of the new international airport project, extensive field surveys have been conducted by the Japan Fishery Resources Conservation Association since FY 1993. Ise-Mikawa Bay, located in the middle of the Pacific coast of Honshu Island, is one of the typical highly eutrophied semi-enclosed estuaries of Japan (Fig. 1).
In this study, based on the GIS database([5]), 3-D simulations of the estuary were carried out to study the long-term variability in flow field, salt and heat transport, and water quality. Both hydrodynamic and water quality simulations covered the three years from April 1993 to March 1996, a period in which the meteorological conditions differed remarkably y ear-to-y ear.
In the first instance, this paper describes some results from our hydrodynamic simulation by highlighting the annual difference in physical processes according to the meteorological conditions. The paper also illustrates the predictive capability of the model as it is applied to an estuary with dynamic forcing variables.
This paper also describes the major characteristics of estuarine water quality from an ecological model coupled with the hydrodynamical model: how did the plankton, nutrients or dissolved oxygen vary throughout the three-year period. And what were the biological processes controlling primary productivity and the appearance of an oxygen-depleted water mass in the bottom layer?
2 The hydrodynamic model
The numerical algorithm of the hydrodynamic model is well described by Nakata et al. [l], so only an outline shall be given here.
Although fine resolution was desirable to account for the complicated estuarine topography, a coarse grid system of 2 km was adopted in the horizontal direction in order to save computational time over 3 years period. In the vertical direction, the water column was divided into 10 computational levels with a minimum thickness of 2 m at the surface. A complete set of model equations was solved numerically by a primitive finite difference technique under a staggered grid regime. The computational time step was chosen at 60 seconds according to the CFL stability criterion for the surface inertial gravity wave.
At the open lateral boundary, the sea surface elevation was approximated by a sinusoidal oscillation consisting of five dominant constituents in the estuary. Those were two semi-diurnal constituents, M, and S,, two diurnal constituents, K , and O,, and the residual annual constituent, Sa. Based on the annual reports of systematic discharge measurements by the River Bureau, Ministry of Construction, Japan, a time series of daily mean discharges for these ten rivers
Figure 1: Location and morphology of the Ise-Mikawa Bay estuary. Values of the bathymetric isolines are in meters. Stations marked by black dots are the regular monitoring stations of water quality, and those by white dots are the weather observatories.
26 Watrr Pollution VII: Modclling, Mca~uritzg and P r ~ d i ~ f i o n
Figure 2: Seasonal variation of the combined discharge of the major ten rivers discharging into Ise-Mikawa Bay. The water temperature and the salinity prescribed as inflow conditions at the river mouth are also shown for Kiso River.
Surface A f
B Biodegr
, ,
Minel-alization j : j I I 1 I I Respirrlon 21 Mortaliiy \ i t
were incorporated into the simulation. As shown in Fig. 2, the combined river discharge during the simulation period ranged from about 500 m3.s-' in dry seasons to a maximum of about 11,000 m3 - S" in late September 1994.
At the free surface, a time series of wind field was incorporated into the simulation to calculate the momentum flux, the turbulent energy generation and the turbulent heat transfer. Instead of the sea surface wind, only wind measurements along the estuarine coast were available at eleven observatories from the regular weather monitoring system called "AMeDAS" (Automatic Meteorological Data Acquisition System), obtained by the Meteorological Agency of Japan (Fig. 1). The observed daily averaged wind data for the simulation period, were spatially interpolated for each day using the Spline technique to estimate the time-dependent sea surface wind field.
3 The coupled ecological model
The numerical model employed in this study is essentially the same as the one described by Nakata et al.([l] ,[2],,[3]&[4]) and Taguchi and Nakata([6]). The biochemical processes involved in these compartments are shown in Fig.3.
The general description of the coupled physical and biochemical model is as follows:
where, B stands for standing stock or concentration of an arbitrary compart ment, v = (qv ) is the horizontal component of flow velocity, W is the vert ical velocity component, W , is the sinking rate to be given for a particulat e organic compartment, V = (J / &, d / a ) is the horizontal gradient operato r, K,, K,, respectively are the horizontal and the vertical component of edd y diffusivity, and (dB/dt)* gives the local change in standing stock accordin g to the biochemical processes. The last term in the equation, q , accounts for the fluxes due to external sourcelsink such as nutrient loading from the
land, benthic nutrient release and benthic oxygen consumption, all of whic h are regarded as driving forces of the model.
Detailed descriptions of the biochemical processes are presented in Table 1. Under the same grid regime as used in the preceding hydrodynamic simulation,
the coupled physical and biochemical model was run over the three years with a time step of 5 minutes. At the initial stage of computation, the water quality measurements in April 1993 were spatially interpolated by the Spline method to set up the distribution of each state variable.
In regard to the coastal nutrient supply, as in the hydrodynamic simulation, only the inflow fluxes from ten major rivers were included here. A logarithmic correlation of the nutrient load (L) and the river discharge (Q) was utilized to estimate daily variation in the loading flux. Based on the monthly monitoring data of river water quality, collected by the local administrative offices, the L-Q correlation was determined for each river concerned. Then, by applying it to the freshwater discharge, the loading fluxes were estimated in a daily regime for carbon, nitrogen and phosphorus. Variations in the estimated nitrogen and
phosphorus fluxes with time are shown in Fig. 4 on the monthly-accumulated base. Benthic nutrient regeneration and oxygen consumption were both estimated according to the in situ flux measurements obtained at twenty water-quality monitoring stations in the summer and the winter seasons of each year. The observed fluxes were significantly related to water temperature in the bottom layer. Hence the exponential response to temperature was determined for the nitrogen, phosphorus and oxygen fluxes, except that the regeneration flux of phosphorus was also related to the dissolved oxygen concentration just above the sediment. Characteristic parameters derived from regression analyses were incorporated into the biochemical model and coupled with temperature and oxygen fields in the bottom layer to set up the variations in the regeneration fluxes over the three-year period of simulation.
At the sea surface, based on records of coastal weather observatories, a time series was prescribed for solar radiation, daytime length as well as wind field to calculate PAR and the turbulent oxygen exchange with the atmosphere.
The parameter values in our ecological model were fine tuned after model calibration using the observed data in the first year. Most of the parameter values (e.g., nutrient uptake rate of phytoplankton, metabolic coefficients of zooplankton and the rate of bacterial decomposition) were adopted from available literature. Parameters summarized in Tables 2 were finally chosen for the simulation. Another two years data were used for model verification.
4 Numerical results
The model results were examined from the viewpoint of the predictive capability of the physical processes mainly focused on the temperature and salinity fields (T-S structure).
The temperature field, in general, showed good agreement with the measurements taken at each monitoring station throughout the water column and the period of simulation. A comparison at St. 2 in the uppermost basin is shown in Fig.5. Only a small discrepancy was found in the bottom layer during summer periods, from June to October, when the water temperature rose. To watch the seasonal variation in the simulated temperature field over the three years, it becomes clear that: (1) the surface temperature during summer remained less than 25 'C in 1993, reflecting the meteorological situation where the air temperature stayed lower and the river discharge was larger than usual; (2) in contrast to 1993, water temperature during the summer of 1994 reached almost 30 "C, when the weather was extremely hot and dry; (3) the temperature difference between the surface and the bottom layer was significant from May to late September and contributed to the estuarine stratification, then inverted in October and the water column began to mix vertically; and (4) in the bottom layer, the temperature reached its maximum about two months later than it did in the surface layer, where the water is more sensitive to the atmosphere. The salinity field in general also resulted in good agreement with the observations (Fig. 5). But in contrast to temperature, there was a significant discrepancy in the concentration at the surface layer during flood period, especially at the monitoring stations in the vicinity of river mouth.
The simulated standing stock or concentration for each compartment in the ecosystem model was compared with the time series of monthly measurements
30 Water Pollution \ / / I : Modclling, Mca~uring and Prediction
8000 [Nitrogen] S Organic Niogen g 6000
Inorganic Nitrogen 3 0
Q 4000 a E,
2 2000 g el
0 A M J J A S O N D J P M A M I J A S O N D J F M A M J J A S O N D I P M
1993 1994 1% 13%
250
3 2 200 Organic Phosphorus o H Inorganic Phosphorus
2 1.50 U
il E: 100 W F .- U g 50 a
0 A M J J A S O N D J F M A M J J A S O N D J P M A M J J A S O N D J P M
Figure 4: Seasonal variation in the monthly-cumulated nutrient-loading fluxes that enter the Ise-Mikawa Bay estuary from ten of the major rivers in the watershed.
35
30
_X= .- .B W -
15
10
S
0 A M J J A S O N D l J g 9 T M A M J J A S O N D J F M A M J J A S O N D J F M
1993 1995 1996
Figure 5: Simulated variation in temperature and salinity in the upper basin of Ise Bay in comparison with the monthly monitoring data obtained at St. 2.
Table 2 Selected values for parameters of the coupled biochemical model Parameter Nomenclature Unit Value [ Phytoplankton ] Maximum growth rate Maximum nutrient uptake rates Half saturation constants for nutrient uptake Ammoniunl inhibition factor for nitrate uptake Maximum capacity ofcell quotn Photosynthetic ltght optimum Light extinction coefficient Fraction of extracellular release Respiration rate Sinking rate of living cells Rate of natural mortality CICId-a ratio C P , C N ratlos (except for cell quota) OIC ratio [ Zooplankton] Maximum ration Ivlev's constant Feeding threshold Rate of basic metabolism
Energy expend~ture in grazing actwity Assimilation efficiency Rate of natural inortality C P . C N d o s OIC ratio [ Detrital Carbon ] Mmerallzation rate
Oxygen linutation Fractlon of biodegradation CP, C N ratios OIC ratio Sinking rate [ D~ssolved Organic Carbon ] Mineralization rate Oxygen limitation C P , C/N ratios OIC ratio [ Others ] Nttrification rate of ammontum
32 Water Pollution \ / / I : Modclling, Mca~uring and Prediction
collected at every monitoring station in the estuary. Here, only the comparison at a station in the inmost basin, St. 2, is presented in Fig. 6, for phytoplankton abundance (expressed as chlorophyll-a concentration), phosphate and dissolved oxygen. Despite great uncertainties in the computational setting of driving forces and biological parameters, the model results, on the whole, agreed favorably with the observed data, reproducing general tendency for phytoplankton to gain in abundance every summer in the upper layer, in response to which the nutrient concentration declined; and for dissolved oxygen to be depleted every summer in the bottom layer. The simulated variation of dissolved oxygen, averaged within a spatial compartment, including St. 2 in the innnermost basin, is shown in Fig.7. The time-depth isopleth plot illustrates the dynamic behavior of oxygen-depleted water mass over the three years. Here, an oxygen concentration of less than 2 m111 (2.8 mgll) is regarded as oxygen depletion. While the variability in oxygen field in the bottom layer was less variable than in other ecological compartments, it can be seen from the figure that an oxygen-depleted water mass consistently appeared during summer, from July to October. The reproducibility of oxygen field in the bottom layer is examined for the bay-wide distribution in the midsummer of 1995. T he model successfully reproduced the spatial pattern of oxygen-depleted water mass for both Ise Bay and Mikawa Bay (not shown here).
5 Discussion
Seasonal variation in pnmary production within a spatial compartment in the inmost basin of Ise Bay, in comparison to secondary production and bacterial decomposition, is illustrated in Fig. 8 (a). They are all expressed as a depth- averaged daily carbon flux. The result shows that the rise in water temperature generally enhanced primary productivity during summer, but its great variability over the three years gave rise to remarkable year-to-year variation in productivity. The major features of the variation are summarized as follows. The pnmary production in early August 1994, for instance, came to about 2.25 gC - m-' - day-', and the corresponding values of the bacterial decomposition and the secondary production were 1.125 and 0.375 gC -m-' - day-', respectively, which compared with 50 % and 16 % of primary production. It peaked in August 1995, reaching about 4.0 gC.m-2.day-'. Bacterial decomposition and secondary production at that time are respectively estimated to be 0.975 and 0.375 gC.m-2 -day-', the values equal to 24 % and 9 % of primary production show that their relative role diminished almost by half. And, in early September 1995, prima~y production dropped to about 1.65 gC - m-2. day-'. Bacterial decomposition and secondary production, however, showing that their role recovered, came respectively to 0. 75 and 0.525 gC-m'2-day-1, which compared with 43 % and 32 % of primaq production.
The relative seasonal effect of water temperature, light and intracellular nutrients on phytoplankton growth was examined, and the results are shown in Fig. 8 (b). In the figure, the temperature curve stands for seasonal variation in the maximal growth rate that should be reduced by light and nutrients. The value is normalized by the seasonal maximum which was reached in mid August 1994. The result shows that light was the most limiting factor throughout the three-year period, and reduced maximal growth rate consistently by almost 70 %. While the role of nutrients was less important than light, intracellular nitrogen was generally
A M J J A S O N D J F M A M J J A S O N D J F M A M J J A S O N D J F M 1993 1994 1995 1996
Figure 6: Comparison of simulated and observed seasonal variation in phytoplankton abundance (above: expressed as chlorophyll-a concentration), phosphate concentration (middle), and dissolved oxygen concentration (below) at a monitoring station (St. 2) in the uppermost basin of Ise Bay.
Figw re 7: Time-depth isopleth plot of the simulated dissolved oxygen concentration. The oxygen concentration was averaged within a spatial compartment in the upper basin of Ise Bay including monitoring station St. 2. Hatched region represent the oxygen- depleted water mass, which is defined as a water mass with an oxygen concentration of less than 2 dA(2 .8 mg/l).
34 Water Pollution \ / / I : Modclling, Mca~uring and Prediction
Figure 8: Result from a flux analysis associated with primary production in the upper basin of Ise Bay. (a) Seasonal variation in primary production, together with secondary production and bacterial decomposition; (b) Relative seasonal role of temperature, light and intracellular nutrients that affect phytoplankton growth; (c) Relative seasonal role of intracellular and ambient nutrients that affect nitrogen uptake by phytoplankton.
04 , , , , , , , , , , , , , , , , , , , , , , , , , , , , , , , , . . , A M J J A S O N D , { $ M A M J J A S O N D J F M A M J J A S O N D A g M 1993 1 95
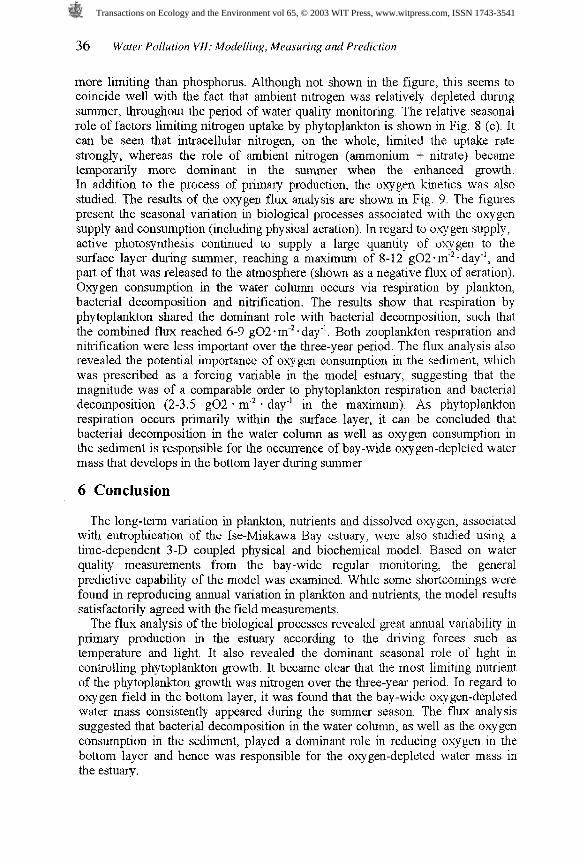
Figure 9: Result from a flux analysis associated with the dissolved oxygen kinetics in the upper basin of Ise Bay. Seasonal variation in oxygen flux is shown for the processes that relate to supply (above), consumption in the water column (middle), and consumption in the sediment (below).
36 Water Pollution \ / / I : Modclling, Mca~uring and Prediction
more limiting than phosphorus. Although not shown in the figure, this seems to coincide well with the fact that ambient nitrogen was relatively depleted during summer, throughout the period of water quality monitoring. The relative seasonal role of factors limiting nitrogen uptake by phytoplankton is shown in Fig. 8 (c). It can be seen that intracellular nitrogen, on the whole, limited the uptake rate strongly, whereas the role of ambient nitrogen (ammonium + nitrate) became temporarily more dominant in the summer when the enhanced growth. In addition to the process of primary production, the oxygen kinetics was also studied. The results of the oxygen flux analysis are shown in Fig. 9. The figures present the seasonal variation in biological processes associated with the oxygen supply and consumption (including physical aeration). In regard to oxygen supply, active photosynthesis continued to supply a large quantity of oxygen to the surface layer during summer, reaching a maximum of 8-12 g02.rn"-day-', and part of that was released to the atmosphere (shown as a negative flux of aeration). Oxygen consumption in the water column occurs via respiration by plankton, bacterial decomposition and nitrification. The results show that respiration by phytoplankton shared the dominant role with bacterial decomposition, such that the combined flux reached 6-9 g02 -mu2 - day-'. Both zooplankton respiration and nitrification were less important over the three-year period. The flux analysis also revealed the potential importance of oxygen consumption in the sediment, which was prescribed as a forcing variable in the model estuary, suggesting that the magnitude was of a comparable order to phytoplankton respiration and bacterial decomposition (2-3.5 g02 . m-2 - day-' in the maximum). As phytoplankton respiration occurs primarily within the surface layer, it can be concluded that bacterial decomposition in the water column as well as oxygen consumption in the sediment is responsible for the occurrence of bay-wide oxygen-depleted water mass that develops in the bottom layer during summer
6 Conclusion
The long-term variation in plankton, nutrients and dissolved oxygen, associated with eutrophication of the Ise-Miakawa Bay estuary, were also studied using a time-dependent 3-D coupled physical and biochemical model. Based on water quality measurements from the bay-wide regular monitoring, the general predictive capability of the model was examined. While some shortcomings were found in reproducing annual variation in plankton and nutrients, the model results satisfactorily agreed with the field measurements.
The flux analysis of the biological processes revealed great annual variability in primary production in the estuary according to the driving forces such as temperature and light. It also revealed the dominant seasonal role of light in controlling phytoplankton growth. It became clear that the most limiting nutrient of the phytoplankton growth was nitrogen over the three-year period. In regard to oxygen field in the bottom layer, it was found that the bay-wide oxygen-depleted water mass consistently appeared during the summer season. The flux analysis suggested that bacterial decomposition in the water column, as well as the oxygen consumption in the sediment, played a dominant role in reducing oxygen in the bottom layer and hence was responsible for the oxygen-depleted water mass in the estuary.
Acknowledgement This research was done in FY1997 as a part of the Comprehensive
Environmental Study in the Ise Bay estuary under the funding by the Japan Fishery Resources Conservation Association. We wish to thank Tsukasa Takei for providing precious observational data and valuable comments, and Linda Worland for helping to correct the manuscript.
References
[l] Nakata,K., Horiguchi, F., Taguchi, K and Y. Setoguchi,Three- dimensional tidal current simulation in Oppa Bay. Bull. Nut. Res. Inst. of Pollution and Resources, Vol. 12, No.3, 17-34, l983
[2] Nakata, K. and K. Taguchi,: Numerical simulation of eutrophication process in coastal bay by eco-hydrodynamic model; (2) Ecological niodeling. Bull. Nat. Res. Inst. of Pollution and Resources, Vol. 12, No.3, l7-36,1983.
[3] Nakata,K., M. Kishi and K. Taguchi,: Eutrophlcation model in coastal bay estuary. Dev. Ecol. andEnv. Q u a l i ~ , Vo1.2,357-366, 1983
[4] [Nakata, K., K. Taguchi and Y. Setoguchi,: Three-dimensional eco- hydrodynamic model for eutrophication process in the coastal bay. Proc. Int. Conf: of modeling and simulation, 55-59, 1985
[S] Nakata, K., M. Takei, T. Nakane, G. Maxwell and D. Torpie: Dissolved oxygen depletion analysis and visualization in Ise Bay, Japan, using a GIS approach. Management Information Systems 2000, GIS& Remote Sensing (ed. C.A.Brebbia and PPascolo) WIT Press, 463-470,2000
[6] Taguchi, K. and K. Nakata,: Analysis of water quality in Lake Harnana using a coupled physical and biochemical model. Special Issue: Modelling hydrodynamically dominated marine ecosystems. J. of Marine Systems,. 16, Elsevier, 107-1 32, 1998