SIMULATION ON PARTICLE ADHESION ON SIMULATED AND MODIFIED DRINKING WATER BIOFILMS BY CONGHUI HUANG THESIS Submitted in partial fulfillment of the requirements for the degree of Master of Science in Environmental Engineering in Civil Engineering in the Graduate College of the University of Illinois at Urbana-Champaign, 2015 Urbana, Illinois Advisor: Associate Professor Thanh H. Nguyen
Transcript
SIMULATION ON PARTICLE ADHESION ON SIMULATED AND MODIFIED DRINKING WATER BIOFILMS
BY
CONGHUI HUANG
THESIS
Submitted in partial fulfillment of the requirements for the degree of Master of Science in Environmental Engineering in Civil Engineering
in the Graduate College of the University of Illinois at Urbana-Champaign, 2015
Urbana, Illinois
Advisor:
Associate Professor Thanh H. Nguyen
ii
Abstract
Biofilms, commonly found in drinking water distribution system (DWDS), play an important
role in pathogens transportation and persistent and raise concern on drinking water safety.
They can harbor opportunistic pathogen from disinfectants added to control pathogen. Since
bacterial adhesion is the prerequisite for further propagation, understanding the mechanisms
of bacterial adhesion on biofilm surface is important to prevent pathogen adhesion and
reduce the risk to exposure in DWDS. In this study, bacterial size particles were used to
model bacterial adhesion on simulated drinking water biofilms surfaces. Simulations on
effects of Brownian motion and drag force on adhesion mechanism were conducted using
COMSOL Multiphysics. The role of surface topography and roughness on particle deposition
were determined through simulations on biofilm surfaces and artificial surfaces maintaining
roughness or topography similar to biofilms. The simulation results showed that surface
topography instead of roughness and associated hydrodynamic condition can affect particle
adhesion tendency. Spatial analysis through semivariogram showed that the deposition
location was not dominated by surface structure.
Keywords: drinking water biofilm, simulation, particle deposition
Technologies Corporation, Bozeman, MT) fed by groundwater, the drinking water source in
Champaign, IL. A greensand filter removed iron and magnesium in the groundwater before
feeding to the reactors. The PVC coupons, a common material used in pipe systems, were used
as the model surface for biofilm to attached and grow on in this study. A constant stirring speed
at 125 rpm was applied in reactors to simulate the hydrodynamic condition in drinking water
pipes. The biofilm was grown for different periods of time from 4 weeks to 20 weeks in the
reactors.
For biofilms used in disinfection experiments, biofilms were grown in the reactors as
described above for eight weeks to full coverage of the PVC surface. One of the reactors was fed
with groundwater and monochloramine (NH2Cl) for 12 weeks, which resulted in treated 20
weeks biofilms. One of reactors was fed with groundwater only for 12 weeks and used as the
control. Monochloramine solution was produced by mixing sodium hypochlorite with
ammonium chloride at a mass ratio (Cl2 to NH3-N) of 4:1. The solution was adjusted to pH 8.2,
the same pH measured in tap water in Champaign, IL, with 0.5 M sodium bicarbonate. The final
total and free chlorine concentration were measured to be 2-4 mg/L and 0.02 mg/L as Cl2, which
satisfied the requirement by Illinois State Law.
2.2 Biofilm surface recognition from OCT
Optical coherence tomography (OCT) was used to determine the structure and roughness
of the biofilm. The spectral domain OCT system imaged the biofilm cross-sections with
5
resolution 4.2 µm by 3.9 µm in axial and transverse direction, respectively. The images with size
of 3.1 by 4.2 mm images were taken with a mode-locked titanium sapphire laser source
(Kapteyn-Murnane Laboratories, Inc, Boulder, CO) centered at 800 nm with a bandwidth of 120
nm.
OCT images were taken for multiple locations on each biofilm sample with different ages
(4 weeks, 14 weeks, and 20 weeks). On each location, OCT images were taken every 10 µm
along the surface. OCT is transformed and rotated to the true scale before further processing
using ImageJ, a graphic java image processor. The OCT images were resized and rotated to true
size. The interface between biofilms and PVC coupon was marked and removed the PVC coupon
on the images. The biofilms structure, the biofilm surface coordinates, was obtained by drawing
lines along the biofilm surface with ImageJ. From the biofilm surface coordinates, roughness,
relative roughness, average thickness can be exported to the simulation software, COMSOL
Multiphysics. Roughness was calculated as follow:
where z (µm) is the biofilm thickness; 𝑧 (µm) is the average thickness of the biofilm
surface; n is the number of points of the surface profile; Ra’ is the relative roughness coefficient.
To process multiple images at a time, a MATLAB program developed by Derlon et al.
(2012) was used as an alternative method. The program applied automatic thresholding on
images and converted them to 8-bit grey scale format. The biofilm surface can be recognized by
1
1 N
ii
z zn
−
=
= ∑
Ra' =1n
zi − z−
z−
"
#
$$$$$
%
&
'''''
i=1
N
∑
Equation 1
Equation 2
6
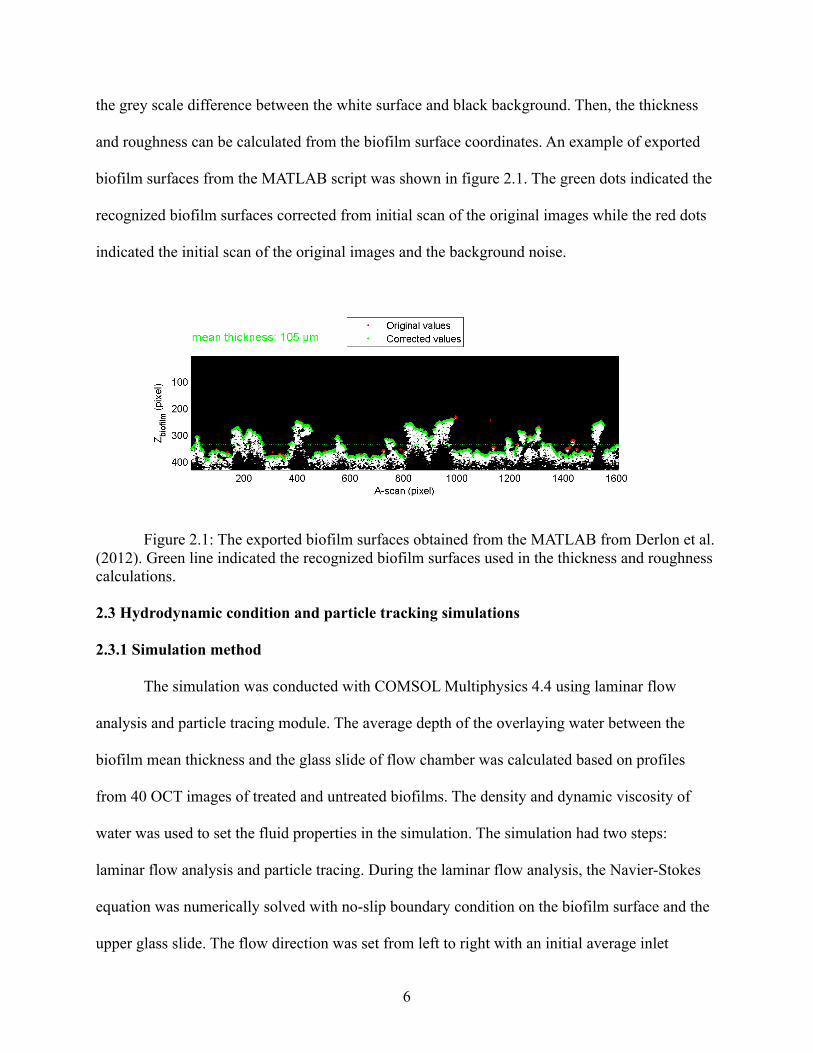
the grey scale difference between the white surface and black background. Then, the thickness
and roughness can be calculated from the biofilm surface coordinates. An example of exported
biofilm surfaces from the MATLAB script was shown in figure 2.1. The green dots indicated the
recognized biofilm surfaces corrected from initial scan of the original images while the red dots
indicated the initial scan of the original images and the background noise.
Figure 2.1: The exported biofilm surfaces obtained from the MATLAB from Derlon et al. (2012). Green line indicated the recognized biofilm surfaces used in the thickness and roughness calculations.
2.3 Hydrodynamic condition and particle tracking simulations
2.3.1 Simulation method
The simulation was conducted with COMSOL Multiphysics 4.4 using laminar flow
analysis and particle tracing module. The average depth of the overlaying water between the
biofilm mean thickness and the glass slide of flow chamber was calculated based on profiles
from 40 OCT images of treated and untreated biofilms. The density and dynamic viscosity of
water was used to set the fluid properties in the simulation. The simulation had two steps:
laminar flow analysis and particle tracing. During the laminar flow analysis, the Navier-Stokes
equation was numerically solved with no-slip boundary condition on the biofilm surface and the
upper glass slide. The flow direction was set from left to right with an initial average inlet
7
velocity (0.00531 m/s), which was calculated from the experimental flow rate of 1 mL/s, the
width of the flow chamber and the water depth above the biofilm surface. Particle tracing
simulation was performed using the velocity profiles obtained from the solution of the Navier-
Stokes equation applied for the water layer above the biofilm surface. Drag force and Brownian
diffusion was included either separately or together in the particle tracing simulation. For the
boundary conditions in the particle tracing simulation, particles were assumed to stick on the
biofilm surface or disappear at the upper glass cover plate. The particles were assumed to be
spherical with 1050 kg.m-3 in density and 2 µm in diameter, which was similar to L.
pneumophila cell. Three particles were uniformly distributed along inlet and released every 0.01
second continuously for 3 second. The number of attached particles on biofilm surface was
recorded after the simulation.
The simulation parameters were shown in Table 1 below:
8
Table 2.1: Simulation configuration set up parameters (Shen et al., 2015)
Particle
Size 2 µm
Shape Circle
Density 1050 kg/m3
Release frequency 300 particles/s
Flow
Compressibility Incompressible
flow
Density 1000 Kg/m3
Dynamic viscosity 0.001 Pa•S
Average inflow velocity used in
particle tracing 0.005 m/s
Average inflow velocity used in
shear stress distribution
0.005 m/s
0.1 m/s
0.3m/s
0.7 m/s
Temperature 293 K
2.3.2 Building model
In previous study, biofilm structures were measured by OCT imaging continuously for 30
minute under different flow rates from 0 to 0.7 m/s (Shen et al., 2015). No significant structural
deformations on biofilms were observed during the experiment (Shen et al., 2015). Relative
roughness and thickness of the biofilms before and after the experiment were statistically the
same (Shen et al., 2015). These observations showed that the aged biofilm fed by low nutrient
and high hardness groundwater was rigid enough to withstand structural deformations caused by
flow rate (Shen et al., 2015). Thus, the temporal change of biofilm surface was not considered in
this model.
9
In previous study, cell adhesion mechanism was correlated to surface roughness instead
of ionic strength on biofilm aged beyond 8 weeks (Janjaroen et al., 2013). Adhesion experiment
of E. coli and CML particles on biofilm surfaces aged from 2 to 27 weeks were carried out at
different monovalent concentration in a similar parallel flow chamber (Janjaroen et al., 2013).
Relative roughness obtained from OCT images and coverage of PVC surfaces observed from
SEM imaging was positively correlated to biofilm age (Janjaroen et al., 2013). Adhesion rate
coefficients predicted by Derjaguin, Landau, Verwey and Overbeek (DLVO) theory remained
steady as the ionic strength increased but increased with relative roughness (Janjaroen et al.,
2013). Also, later study on L. pneumophila adhesion on groundwater biofilm has similar results.
Biofilm roughness instead of electrostatic double layer compression control adhesion based on
the fact that Sherwood numbers were similar for different ionic strength level (3 to 300 mM) on
biofilms older than 4 weeks (Shen et al., 2015). Based on the results, surface interactions were
not modeled in this model.
Also, under a confocal laser-scanning microscope as well as a fluorescence microscope,
L. pneumophila was observed to adhere to biofilm surfaces without penetration into biofilm
matrixes under similar experimental setup used previously (Janjaroen et al., 2013; Shen et al.,
2015). Thus, no penetration into biofilm matrixes was modeled in this study.
2.3.3 Simulation on biofilm surfaces and artificial surfaces
Separate sets of simulation were conducted to study the effect of flow condition,
topography, roughness, and release conditions on particle deposition on the biofilm surface.
Configuration for simulation was set as mentioned above unless stated otherwise. Number of
deposition particles was recorded and compared. The following cases were studied. Case 1: To
understand the effects of Brownian motion and drag force on particle deposition on lab grown
10
biofilm surfaces obtained from OCT images. In case 2, the importance of topography and
roughness was studying using eight biofilm surfaces. These biofilm surfaces were created based
on those obtained from OCT images but with the thickness (i.e. y coordinate of the biofilm
profile) tripled to create synthetic surfaces with the same topography but different roughness. In
Case 3, six sets of biofilm surfaces (two to three biofilm surfaces in each set) with similar
roughness but different topography were selected and used in simulations. In Case 4, artificial
surfaces made of regular shapes such as semicircle were used as biofilm surfaces in simulations.
Particles deposition mechanism was investigated on controlled surfaces instead of randomly
distributed bump obtained biofilm surface. In Case 5, to understand the effects of releasing
positions on deposition, 10 particles distributed uniformly were released from the inlet instead of
3 particles set previously. Each particle was assigned an index number and traced after
simulation. Configurations except initial released particle number were applied as before. The
index number of deposited particle was recorded after simulations. A simple MATLAB script
was used to trace index number to released position from 1 to 10 (top to bottom) at the inlet. The
data about released position of deposited particle was compared for both rough and smooth
surfaces. See Table 2 for description of these cases:
11
Table 2.2: Simulation cases and associated research question
Simulation case
number
Simulation configuration Research question
Case 1 Brownian motion and drag force were applied independently and simultaneously in the simulation.
The role of Brownian motion and/or drag force in particle deposition on biofilm surfaces was determined.
Case 2 Artificial surfaces with similar topography but different roughness were used in these simulations.
The role of roughness on surfaces with similar topography was determined.
Case 3 Biofilm surfaces with similar roughness but different topography were used in these simulations.
The role of topography on surfaces with similar roughness was determined.
Case 4 Artificial surfaces made out of a series of semicircle shape asperities with similar roughness to biofilm surfaces were used in these simulations.
The role of asperity shape with similar roughness to biofilm surfaces was determined.
Case 5 Ten instead of three particles were released at the inlet and assigned an index by location. The deposited particles with index were related to released location.
The role of released location on particle deposition was determined.
2.4 Spatial analysis on biofilm surfaces
Semivariogram, a basic geostatistic technique, was used to investigate the spatial
correlation between deposited particle locations and biofilm thickness. A package called “gstat”
in R, a commonly used statistic software, was used to generate semivariogram. Semivariogram
simulate spatial dependence by calculating variance between two observation locations using
following equation:
where 𝛾 is the index plotted in semivariogram; 𝑒 is the observed value for known location
𝑠%; h is the distance between locations; 𝑁' is the number of location pairs with the same distance
h. The distance h between two locations were calculated by following equation:
Equation 3
12
ℎ = 𝑥+ + 𝑦+
where x and y were the coordinates of the biofilm surfaces or the location of the
deposited particle. Deposited particle locations were obtained from COMSOL after simulation
for six smooth and rough surfaces. Index 1 was assigned to the coordinates with deposited
particles while other coordinates were assigned as index 0. Variograms were plotted as a graph
using h as x axis and 𝛾 as y axis. To predict the trend of the deposited location for other locations
without running simulations, functions were fitted on the variogram. The most fitted function
was nugget, a linear regression line.
2.5 Data analysis
Standard ANOVA and t test are used in all simulation result to compare the particle
deposition probability. The t test was conducted to compare the population means of deposition
probability from simulation results under configurations described in Table 2. Statistical analysis
was conducted in Excel and R.
Equation 4
13
3. Results and Discussion
3.1 Biofilm structure determined by OCT
The biofilms surface thickness and roughness were obtained by analyzing OCT images taken
under no flow condition. Biofilms surface structures were marked in yellow as shown in figure
3.1. The PVC coupon and biofilms interface was recognized by ImageJ or MATLAB code. The
PVC surface was then removed from the thickness and roughness calculation. The biofilms
surface profiles were obtained to determine the effect of monochloramine treatment on biofilms
thickness and roughness. The average thicknesses for untreated 20-week biofilms (90.1 ± 12.2
µm, n = 20) and treated 20-week biofilms (84.1 ± 7.96 µm, n = 15) were statistically similar (t
test, p = 0.11). The average roughness coefficient for untreated 20-week biofilms (0.26 ± 0.07, n
= 20) was higher than treated 20-week biofilms (0.11 ± 0.03, n = 15). The reduction in roughness
(t test, p < 0.05) coefficient showed that monochloramine treatment removed part of biofilms
matrix on PVC surfaces. This observation can be explained by reduction of extracellular
polymeric substances (EPS) in biofilms and cluster detachment due to reaction between
monochloramine and biofilms matrix (Xue et al., 2014).
Figure 3.1: A) OCT images for monochloramine treated biofilms surface B) OCT images for groundwater (untreated) biofilms surface.
14
3.2 Hydrodynamics and particle tracking simulation results on groundwater biofilms and
monochloraminated biofilms
3.2.1 Simulated hydrodynamic profiles
The simulation results on hydrodynamic profiles were obtained to determine hydrodynamic
conditions of the fluid above biofilm surfaces with different roughness. The simulation results
for hydrodynamic profile showed that the change in biofilms surface due to monochloramine
treatment altered the velocity profile. Similar observation on hydrodynamic difference due to
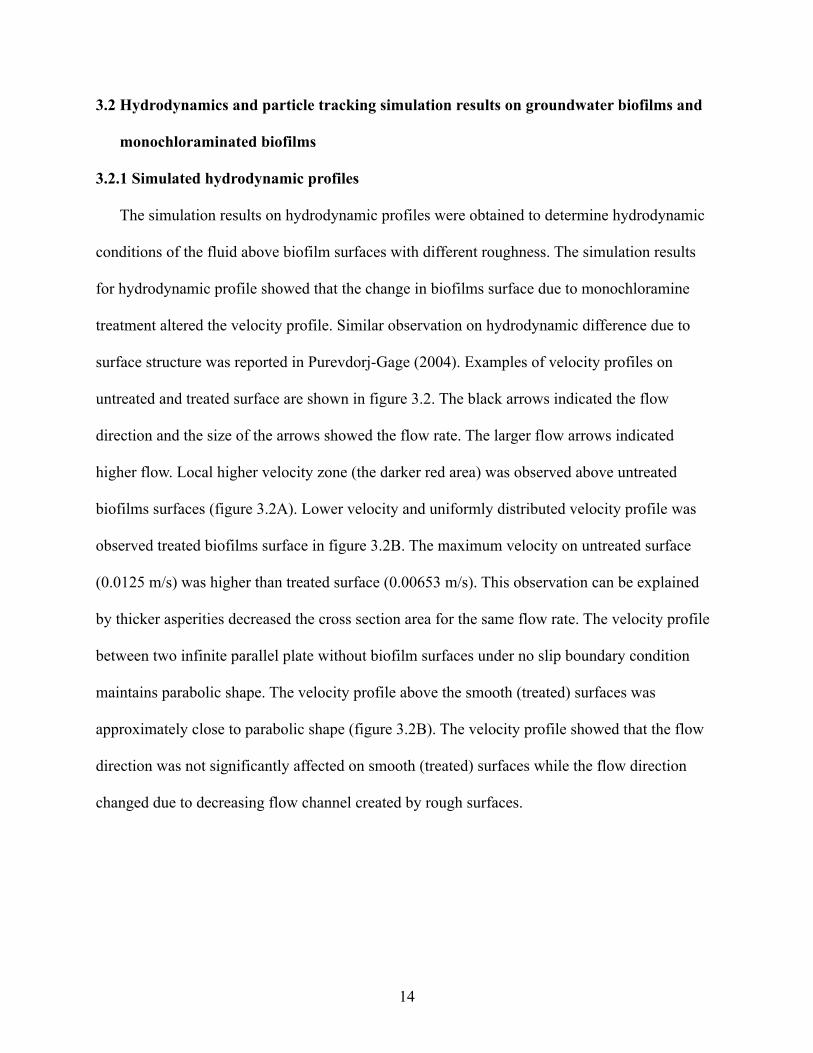
surface structure was reported in Purevdorj-Gage (2004). Examples of velocity profiles on
untreated and treated surface are shown in figure 3.2. The black arrows indicated the flow
direction and the size of the arrows showed the flow rate. The larger flow arrows indicated
higher flow. Local higher velocity zone (the darker red area) was observed above untreated
biofilms surfaces (figure 3.2A). Lower velocity and uniformly distributed velocity profile was
observed treated biofilms surface in figure 3.2B. The maximum velocity on untreated surface
(0.0125 m/s) was higher than treated surface (0.00653 m/s). This observation can be explained
by thicker asperities decreased the cross section area for the same flow rate. The velocity profile
between two infinite parallel plate without biofilm surfaces under no slip boundary condition
maintains parabolic shape. The velocity profile above the smooth (treated) surfaces was
approximately close to parabolic shape (figure 3.2B). The velocity profile showed that the flow
direction was not significantly affected on smooth (treated) surfaces while the flow direction
changed due to decreasing flow channel created by rough surfaces.
15
Figure 3.2: A) Velocity profile for untreated biofilms surface B) Velocity profile for treated biofilms surface. The asperity was pointed out in red arrow in A. The color legend on the left indicating velocity from 0 to 0.01 m/s (from blue to red). The triangle above the color legend indicates the maximum velocity in the velocity profile.
3.2.2 Effects of Brownian motion and drag force on particle deposition
The simulation results by Brownian motion and/or drag force were obtained to determine the
role of these diffusion methods on particle deposition on biofilm surfaces. The particle tracing
simulations were carried out on groundwater biofilms (rough) surfaces and monochloramine
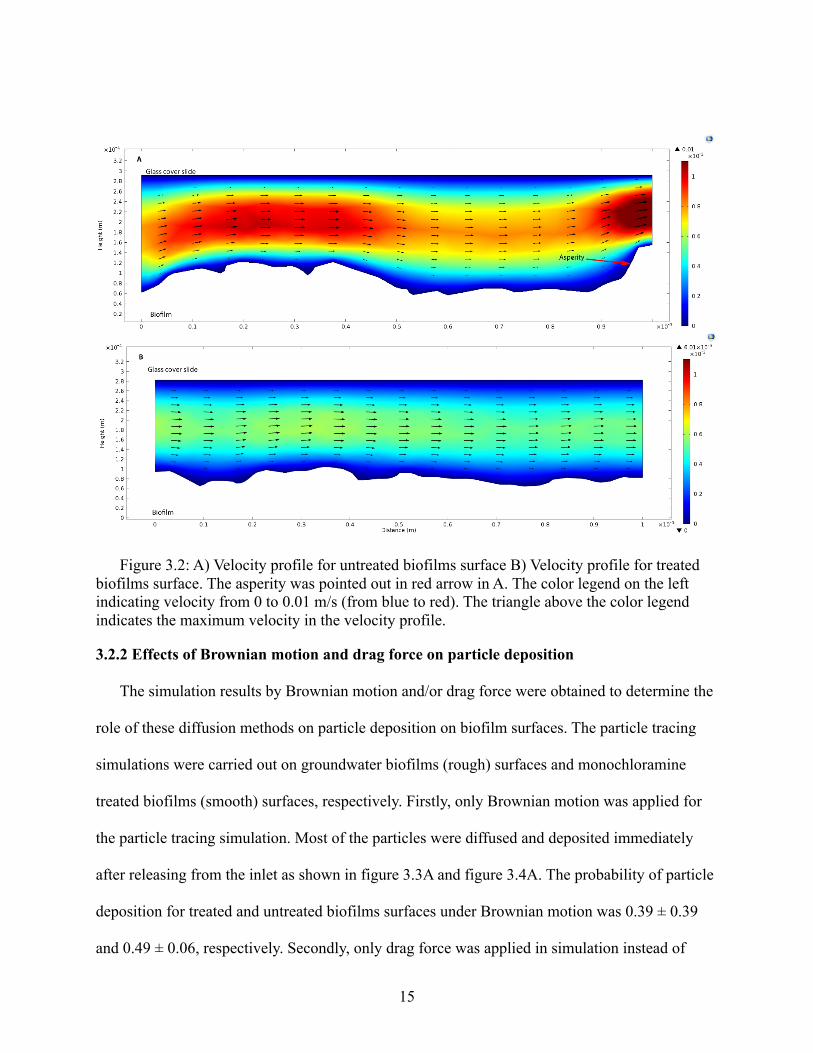
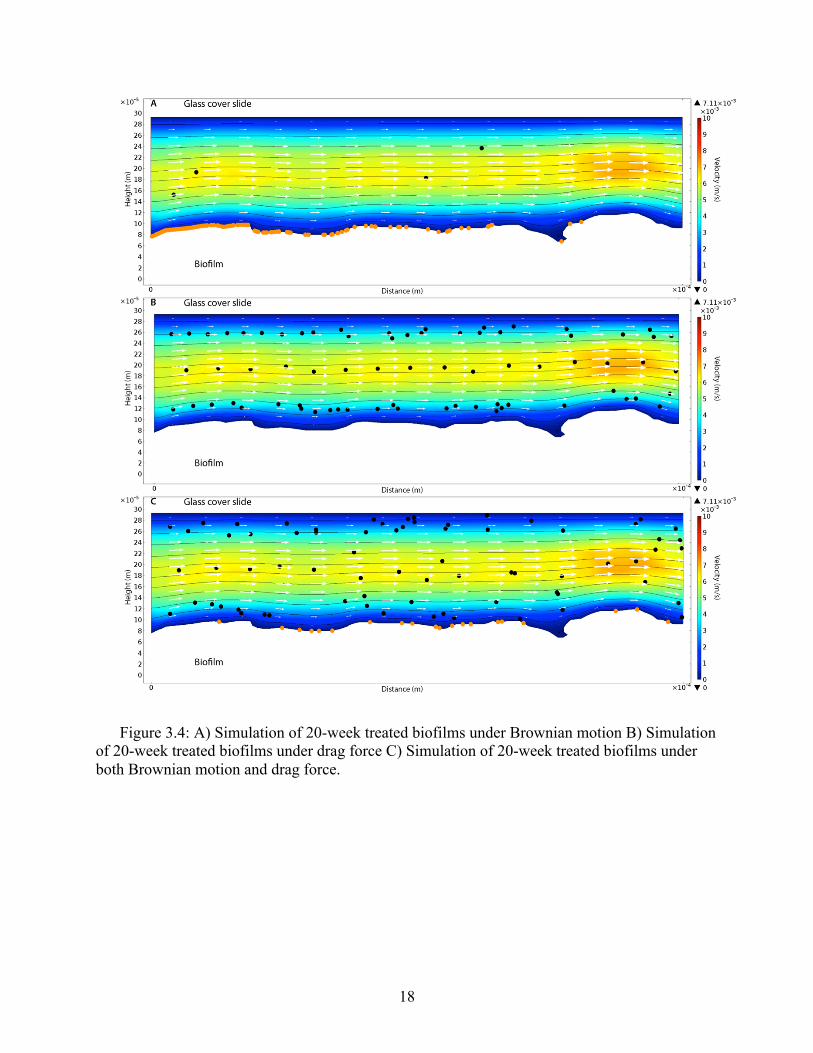
treated biofilms (smooth) surfaces, respectively. Firstly, only Brownian motion was applied for
the particle tracing simulation. Most of the particles were diffused and deposited immediately
after releasing from the inlet as shown in figure 3.3A and figure 3.4A. The probability of particle
deposition for treated and untreated biofilms surfaces under Brownian motion was 0.39 ± 0.39
and 0.49 ± 0.06, respectively. Secondly, only drag force was applied in simulation instead of
16
Brownian motion. The probability of particle deposition for treated and untreated surfaces under
drag force was 0 as shown in figure 3.3B and figure 3.4B. Finally, both Brownian motion and
drag force were applied in simulation. The probability of particle deposition for treated and
untreated biofilms surfaces were 0.07 ± 0.01 and 0.05 ± 0.009, respectively. The observations
showed that Brownian motion were important for particle adhesion on biofilm surfaces while
drag force carried particles along the streamline. Similar observation on diffusion (Brownian and
convective) controlling adsorption kinetic on biofilms were reported under flow and no flow
condition (Pelleïeux et al., 2012). The combined effect of Brownian motion and drag force result
in particle deposition on streamline interceptions with asperities and low velocity zone where
streamline were close to asperities.
3.2.3. Effects of roughness on particle deposition
The simulation results for particle deposition were obtained to determine the role of biofilms
surface roughness on particle deposition. As shown in figure 3.3, particle deposition on rougher
surfaces were significantly different from the one on smoother surfaces (t test, p = 0.0034). More
particle deposited on rougher surfaces than on smoother surfaces (figure 3.5). The combined
effect of Brownian motion and drag force demonstrated similar results from experimental results
in flow cell reported in Shen et al (2015). This observation can be reasoned that rough surfaces
created hydrodynamic condition which is favorable for particle deposition. More streamline
interceptions with asperities were found on rough surfaces as shown in figure 3.3D. The
probability of particles attachment onto the streamline interceptions with surface asperities was
higher because of the larger stagnant zone (Shen et al., 2015). The observations showed that
bacteria sized particles tended to adhere on rougher surfaces compared to smoother surfaces
17
under both Brownian motion and drag force. Thus, the following simulation results were carried
out under both Brownian motion and drag force.
Figure 3.3: A) Simulation of 20-week groundwater biofilms under Brownian motion B) Simulation of 20-week groundwater biofilms under drag force C) Simulation of 20-week groundwater biofilms under both Brownian motion and drag force D) The interception of streamline and asperity.
18
Figure 3.4: A) Simulation of 20-week treated biofilms under Brownian motion B) Simulation of 20-week treated biofilms under drag force C) Simulation of 20-week treated biofilms under both Brownian motion and drag force.
19
Figure 3.5: The deposition probability on treated and untreated 20 week biofilms surfaces.
3.3 Simulation results on artificial surfaces with semicircle shape asperity
The simulation results on artificial surface with semicircle asperity were obtained to
determine the role of the topography of the surface on particle deposition. The artificial surfaces
were made of a series of semicircle shape asperities with similar roughness and thickness but
different topography to the biofilms surfaces obtained from CDC reactors as shown in figure 3.6.
The average roughness of treated and untreated biofilms surfaces used in the simulation were
0.095 ± 0.009 (n = 5) and 0.30 ± 0.044 (n = 5), respectively. To maintain the average thickness
and roughness similar to the biofilm surfaces, the size of the asperity (the radius of the
semicircle) was larger for rougher surfaces than for smoother surfaces. Thus, more asperities
Untreated 20wk biofilms Treated 20wk biofilms0.00
0.02
0.04
0.06
0.08
0.10
0.12
Aver
age
depo
sitio
n pr
obab
ility
20
were distributed on rougher surfaces than on smoother surfaces. The particle deposition on the
artificial surfaces and biofilms surfaces with lower roughness was significantly different (t test, p
= 0.002). More particles were observed to adhere on the artificial surfaces with lower roughness
than the treated biofilms surfaces. The probability of adhering onto artificial surfaces and treated
biofilms surfaces were 0.073 ± 0.009 and 0.048 ± 0.009, respectively. However, the particle
deposition on the artificial surfaces and groundwater biofilms surface were statistically similar (t
test, p > 0.05). The possible reason can be larger surface area (t test, p < 0.05) created by
uniformly distributed asperities on artificial surfaces providing more space available allowing
deposition under the hydrodynamic condition resulting from lower roughness. The
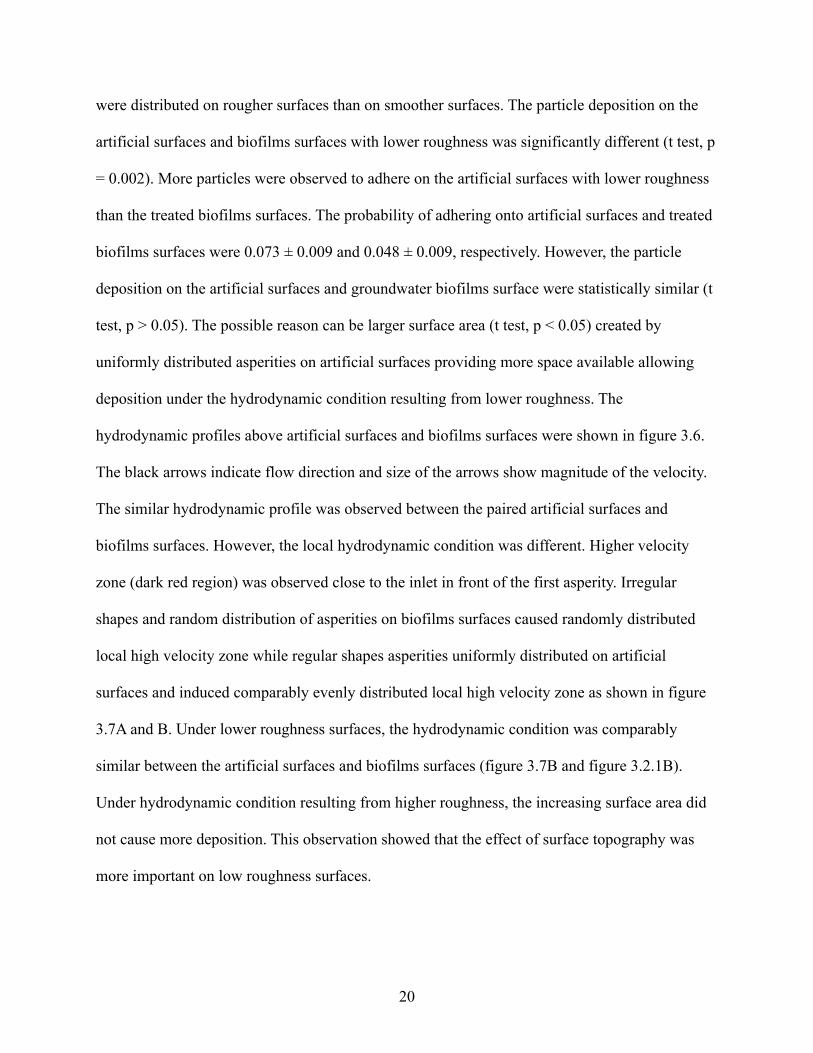
hydrodynamic profiles above artificial surfaces and biofilms surfaces were shown in figure 3.6.
The black arrows indicate flow direction and size of the arrows show magnitude of the velocity.
The similar hydrodynamic profile was observed between the paired artificial surfaces and
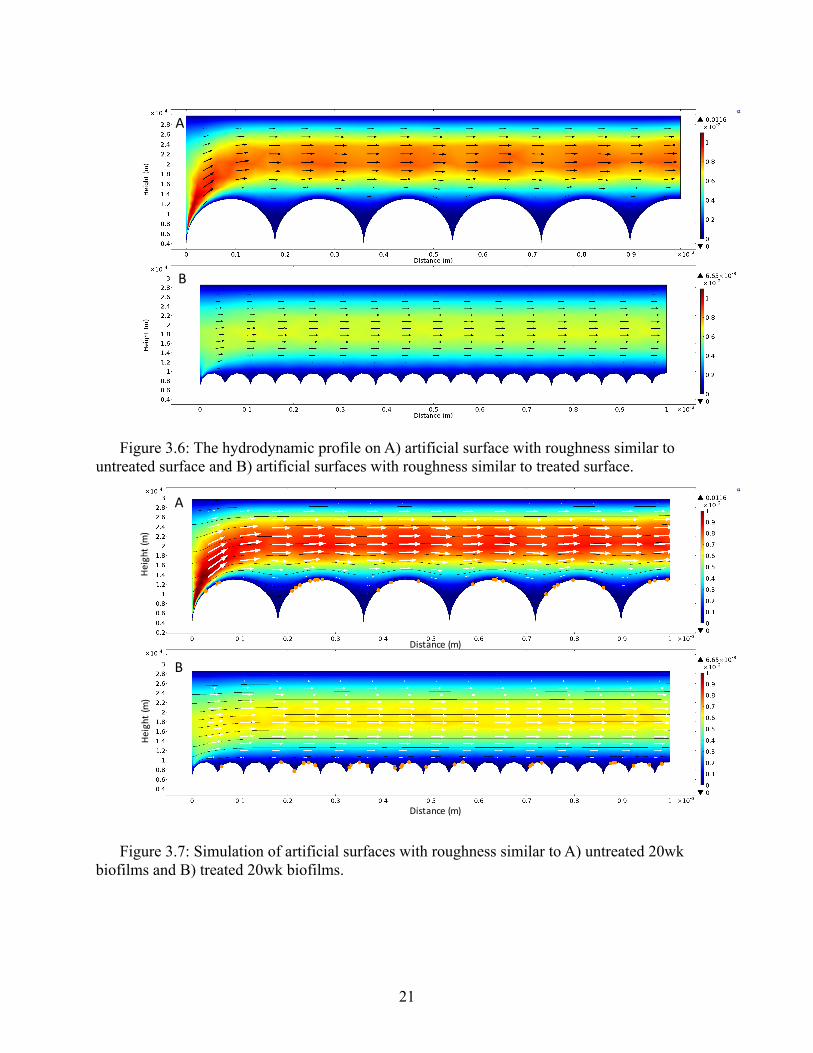
biofilms surfaces. However, the local hydrodynamic condition was different. Higher velocity
zone (dark red region) was observed close to the inlet in front of the first asperity. Irregular
shapes and random distribution of asperities on biofilms surfaces caused randomly distributed
local high velocity zone while regular shapes asperities uniformly distributed on artificial
surfaces and induced comparably evenly distributed local high velocity zone as shown in figure
3.7A and B. Under lower roughness surfaces, the hydrodynamic condition was comparably
similar between the artificial surfaces and biofilms surfaces (figure 3.7B and figure 3.2.1B).
Under hydrodynamic condition resulting from higher roughness, the increasing surface area did
not cause more deposition. This observation showed that the effect of surface topography was
more important on low roughness surfaces.
21
Figure 3.6: The hydrodynamic profile on A) artificial surface with roughness similar to untreated surface and B) artificial surfaces with roughness similar to treated surface.
Figure 3.7: Simulation of artificial surfaces with roughness similar to A) untreated 20wk biofilms and B) treated 20wk biofilms.
A
B
A
BDistance(m)
Height(m
)
Distance(m)
Height(m
)
22
Figure 3.8: The average deposition probability on biofilms surfaces and artificial surfaces with roughness similar to biofilm surfaces.
3.4 Simulation results on artificial surfaces modified from monochloramine treated
surfaces
The simulation results on artificial surfaces obtained from increasing the roughness of the
treated biofilms while maintaining similar shape and location of the asperities were obtained to
determine the role of the roughness on particle deposition compared to the topography. An
example of the simulation results was shown on figure 3.9. The modified surfaces had similar
topography to the original biofilms surfaces, such as the same asperity shape and location.
However, the modified surfaces have higher roughness than the original biofilms surfaces. The
Surfaces with low roughness Surfaces with high roughness0.00
0.02
0.04
0.06
0.08
0.10
0.12
Aver
age
depo
site
d pa
rticl
e pr
obab
iltiy
Biofilm surfaces Artificial surfaces
23
velocity profiles between modified surfaces and original biofilms surfaces increased due to the
increasing roughness. Higher velocity zones and interception between streamlines and asperities
were observed above the modified surfaces (figure 3.9). The effect of asperity on hydrodynamic
condition was enhanced. The overall velocity increased. The location of high velocity zone
remained similar and the magnitude of velocity zone increased. However, no significantly
difference of particle deposition was observed between modified surfaces and biofilms surfaces
(t test, p > 0.05). These observations showed that roughness did not have important effect on
particle deposition over topography obtained from smooth (treated) surfaces.
Figure 3.9: A) Simulation on treated 20-week biofilm surfaces B) Simulation on artificial surface obtained by triple the thickness from treated 20-week biofilm surface from A.
A
BDistance(m)
Height(m
)
Distance(m)
Height(m
)
24
Figure 3.10: Average deposition probability for Treated 20-week biofilm surfaces and modified surfaces with triple thickness from 20-week biofilms.
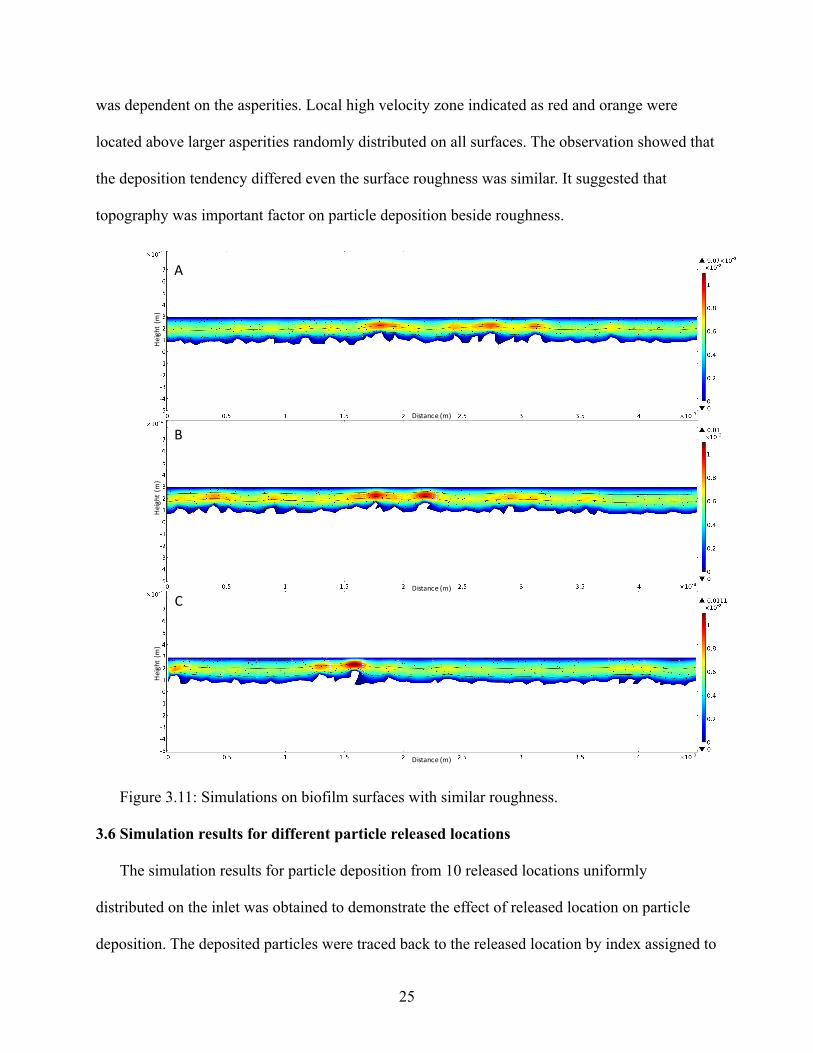
3.5 Simulation results on surfaces with similar roughness but different topography
The simulation results on four groups of surfaces with similar roughness were obtained to
determine the effect of topography on particle deposition. The particle deposition probability
variance was tested by chi square. The simulation results showed that average deposition
probability on four groups of surfaces with similar roughness was significantly different from the
deposition probability obtained from the repeated simulations on the same surface (p < 0.05).
Even though all surfaces in the same group have similar roughness, the distribution and size of
asperities are randomly distributed (figure 3.11). The local hydrodynamic condition distribution
Modified surfaces Treated 20wk surfaces0.00
0.02
0.04
0.06
0.08
0.10
Aver
age
depo
sitio
n pr
obab
ility
25
was dependent on the asperities. Local high velocity zone indicated as red and orange were
located above larger asperities randomly distributed on all surfaces. The observation showed that
the deposition tendency differed even the surface roughness was similar. It suggested that
topography was important factor on particle deposition beside roughness.
Figure 3.11: Simulations on biofilm surfaces with similar roughness.
3.6 Simulation results for different particle released locations
The simulation results for particle deposition from 10 released locations uniformly
distributed on the inlet was obtained to demonstrate the effect of released location on particle
deposition. The deposited particles were traced back to the released location by index assigned to
A
B
C
Distance(m)
Heig
ht(m)
Distance(m)
Heig
ht(m)
Heig
ht(m)
Distance(m)
26
particles immediately after release from the inlet. The released locations were marked by black
dots in figure 3.12. The probability of deposited particle released from the 1st location (the
highest location) were the greatest compared to the one released from other locations. This
observation showed that the particles released at the highest location deposited first and occupied
potential deposition location.
Figure 3.12: Particle released location and hydrodynamic condition obtained from
simulation.
3.7 Results for spatial analysis
The results for spatial analysis on biofilms surfaces and particle deposited location were
obtained to determine the correlation of the thickness of the biofilms along the cross section. Six
treated and untreated 20-week biofilms surfaces were analyzed by semivariogram method. The
sample of semivariogram was shown in figure 3.13. The nugget of the semivariogram, the
semivariogram at the paired distance at zero, was too high. The nugget showed the variability at
distance smaller than typical sample spacing such as measurement errors. Thus, no correlation
between the thickness and distance from inlet can be obtained for these surfaces. The possible
reason causing such high nugget could be high randomness in asperities distribution and particle
deposition on biofilm surfaces. For example, figure 3.3 showed that the number of deposited
particle varied along the same thickness. This observation showed that the particle deposition
Distance(m)
Height(m
)
27
was not strongly controlled by the thickness of the biofilm surfaces under flow condition.
Hydrodynamic condition and model set up should be considered.
Figure 3.13: Semivariogram between particle deposition location and biofilm surfaces profile.
Paired horizontal distance from inlet (m)
28
4. Conclusion
• Both Brownian motion and drag force played an important role on bacterial adhesion
on biofilm surfaces. The observation showed that Brownian motion controlled
deposition and drag force controlled deposited particle distribution on biofilm
surfaces.
• Biofilm surfaces’ roughness and associated hydrodynamic condition had positive
correlation to particle adhesion. Particle tended to deposit at interceptions between
streamline and asperities.
• Shape of the asperities was related to particle deposition on surfaces with low
roughness. No significant difference was observed on surfaces with different shape of
asperities and high roughness.
• In addition to roughness, surface topography was also important factor on particle
deposition.
• Particle deposition location was randomly distributed on the biofilm surfaces. No
spatial correlation was found between particle deposition location and biofilm surface
geometry.
29
References
Associated Press. (2015). NYC Legionnaires’ outbreak up to 10 dead, 100 diagnosed. FOX News
Network.
Boks, N. P., Norde, W., van der Mei, H. C., & Busscher, H. J. (2008). Forces involved in
bacterial adhesion to hydrophilic and hydrophobic surfaces. Microbiology (Reading,
England), 154(Pt 10), 3122–33.
Cervero-Aragó, S., Rodríguez-Martínez, S., Puertas-Bennasar, A., & Araujo, R. M. (2015).
Effect of Common Drinking Water Disinfectants, Chlorine and Heat, on Free Legionella
and Amoebae-Associated Legionella. PLoS ONE, 10(8), 1–18.
Declerck, P. (2010). Biofilms: The environmental playground of Legionella pneumophila.
Environmental Microbiology, 12(3), 557–566.
Derlon, N., Peter-Varbanets, M., Scheidegger, A., Pronk, W., & Morgenroth, E. (2012). Predation
influences the structure of biofilm developed on ultrafiltration membranes. Water Research,
46(10), 3323–3333.
Garrett, T. R., Bhakoo, M., & Zhang, Z. (2008). Bacterial adhesion and biofilms on surfaces.
Progress in Natural Science, 18(9), 1049–1056.
Gião, M. S., Wilks, S., Azevedo, N. F., Vieira, M. J., & Keevil, C. W. (2009). Incorporation of
natural uncultivable Legionella pneumophila into potable water biofilms provides a
protective niche against chlorination stress. Biofouling, 25(4), 345–351.
Hébrant, M., Pelleïeux, S., Mathieu, L., Skali-Lami, S., Gantzer, C., Bertrand, I., & Block, J.-C.
(2014). Distinct adsorption kinetics of Qβ and GA bacteriophages on drinking water
biofilms. Adsorption, 20(5-6), 823–828.
Janjaroen, D., Ling, F. Q., Ling, F., Monroy, G., Derlon, N., Morgenroth, E., … Nguyen, T. H.
(2013). Roles of ionic strength and biofilm roughness on adhesion kinetics of Escherichia
coli onto groundwater biofilm grown on PVC surfaces. Water Research, 47(7), 2531–42.
Lau, H. Y., & Ashbolt, N. J. (2009). The role of biofilms and protozoa in Legionella
pathogenesis: implications for drinking water. Journal of Applied Microbiology, 107(2),
368–378.
Lehtola, M. J., Torvinen, E., Kusnetsov, J., Pitkänen, T., Maunula, L., von Bonsdorff, C.-H., …
Miettinen, I. T. (2007). Survival of Mycobacterium avium, Legionella pneumophila,
Escherichia coli, and Caliciviruses in Drinking Water-Associated Bioflims Grown under