Page 1
SIMULATION: OPTIMIZE THE PRODUCTION OF BENZOIC ACID BY
USING BENZENE AND ACETIC ANHYDRIDE
CHIN KAH LOONG
A project report submitted in partial fulfilment of the
requirements for the award of Bachelor of Engineering
(Hons.) Chemical Engineering
Faculty of Engineering and Science
Universiti Tunku Abdul Rahman
May 2011
Page 2
i
DECLARATION
I hereby declare that this project report is based on my original work except for
citations and quotations which have been duly acknowledged. I also declare that it
has not been previously and concurrently submitted for any other degree or award at
UTAR or other institutions.
Signature : _________________________
Name : Chin Kah Loong
ID No. : 07UEB05126
Date : _________________________
Page 3
ii
APPROVAL FOR SUBMISSION
I certify that this project report entitled “SIMULATION: OPTIMIZE THE
PRODUCTON OF BENZOIC ACID BY USING BENZENE AND ACETIC
ANHYDRIDE” was prepared by CHIN KAH LOONG has met the required
standard for submission in partial fulfilment of the requirements for the award of
Bachelor of Engineering (Hons.) Chemical Engineering at Universiti Tunku Abdul
Rahman.
Approved by,
Signature : _________________________
Supervisor : Ms. Bee Soo Tueen
Date : _________________________
Page 4
iii
The copyright of this report belongs to the author under the terms of the
copyright Act 1987 as qualified by Intellectual Property Policy of University Tunku
Abdul Rahman. Due acknowledgement shall always be made of the use of any
material contained in, or derived from, this report.
© 2011, Chin Kah Loong. All right reserved.
Page 5
iv
Specially dedicated to
my beloved mother and father
Page 6
v
ACKNOWLEDGEMENTS
I would like to thank everyone who had contributed to the successful completion of
this project. I would like to express my gratitude to my research supervisor, Ms. Bee
Soo Tueen for her valuable advice, guidance and her enormous patience throughout
the development of the research. All the knowledge that I learned from her will be
will come in handy in the future.
In addition, I would also like to express my gratitude to my loving parent and
friends who had helped and given me encouragement. I am very fortune to be blessed
by our course mates and seniors whose help, stimulating suggestions and
encouragement. Without the mentioned parties, it is impossible for me to complete
this final year project.
Finally, to all of my friends that contributed to this thesis. Thank you very
much to all of them that help me either direct or indirect.
Page 7
vi
SIMULATION: OPTIMIZE THE PRODUCTION OF BENZOIC ACID BY
USING BENZENE AND ACETIC ANHYDRIDE
ABSTRACT
Benzoic acid production from oxidation of toluene is widely used in the industry.
This study is to develop a new process that applied green technology to replace the
current benzoic acid production process. The idea of this project was to introduce
heterogeneous catalyst to replace the homogenous catalyst in the acylation of
benzene by acetic anhydride due to the economic and environment factors. On the
other hands, replacement of potassium permanganate (IV) by sodium hypochlorite in
the oxidation process to produce benzoic acid was recommended because of the
cheaper cost and less hazardous. Another purpose of this study was to identify the
effect of various operating parameters such as reaction temperature and material
molar flow rate to get the optimum benzoic acid production. The process of benzoic
acid production was successfully simulated by using ASPEN HYSYS 3.2. In this
study, benzene and acetic anhydride was chosen as starting materials. The benzoic
acid production plant in this study consist of packed bed reactor, two distillation
column, four heat exchangers, two conversion reactors, two separators and two hydro
cyclones. Besides, economic analysis of benzoic acid production is studied in this
study to estimate the net profit value. From the results, the benzoic acid purity
obtained in the process is 89% and the payback period is estimated within 3 years.
Net profit is estimated to be US$ 890.6/MT or US$ 33 million per year.
Page 8
vii
TABLE OF CONTENTS
DECLARATION i
APPROVAL FOR SUBMISSION ii
ACKNOWLEDGEMENTS v
ABSTRACT vi
TABLE OF CONTENTS vii
LIST OF TABLES x
LIST OF FIGURES xiii
LIST OF SYMBOLS / ABBREVIATIONS xiv
LIST OF APPENDICES xvi
CHAPTER
1 INTRODUCTION 1
1.1 History and Application of Benzoic Acid 1
1.2 HYSYS 2
1.3 Problem Statement 3
1.4 Aims and Objectives 3
1.5 Scope of Study 4
2 LITERATURE REVIEW 4
2.1 Inroduction 4
2.2 Green Chemistry 5
2.2.1 Replacement of homogenous catalyst with
heterogeneous catalyst 6
2.2.2 Replacement of current oxidizing agent with Clorox 7
2.3 Process Description 8
2.3.1 Friedel-Crafts Acylation of aromatics compound 9
Page 9
viii
2.3.2 Oxidation of ketone by haloform reaction 10
2.4 Properties and background of chemicals 11
2.4.1 Acetic anhydride 11
2.4.2 Benzene 11
2.4.3 Acetic Acid 12
2.4.4 Sodium Hypochlorite 13
2.4.5 Sulphuric Acid 14
2.4.6 Chloroform 15
2.4.7 Chlorine 15
2.4.8 Sodium Hydroxide 16
2.5 Material Safety Data Sheet (MSDS) of Chemicals 18
2.6 Summary 20
3 METHODOLOGY 21
3.1 Research Tools 21
3.1.1 Aspen HYSYS 21
3.1.2 Simulation of Benzoic Acid Production 23
3.2 Mathematical Modelling for Reactor Operating 24
3.2.1 Reactor Sizing 24
3.2.2 Energy Balances 26
3.2.3 Degree of Freedom Analysis 28
3.2.4 Material Balance 28
3.2.5 Efficiency of Hydro Cyclone 29
3.3 Thermodynamics Properties 30
3.4 Summary 32
4 RESULTS AND DISCUSSIONS 33
4.1 Optimization for Packed Bed Reactor 33
4.1.1 Packed Bed Reactor Heat Integration 33
4.1.2 Optimization by Varying Material Flow Rate 34
4.1.3 Distillation Column Specifications 35
4.2 Optimization for Conversion Reactor 37
4.2.1 Optimization by Varying Sodium Hypochlorite 38
Page 10
ix
Molar Flow Rate
4.2.2 Conversion Reactor Heat Integration 39
4.2.3 Comparison of Optimization Results 41
4.3 Optimization of Acidification Reactor 42
4.3.1 Optimization by Varying Sulphuric Acid Molar 42
Flow Rate
4.3.2 Acidification Reactor Heat Integration 43
4.3.3 Optimization by Varying Hydrocyclone Efficiecy 44
4.3.4 Comparison of Optimization Results 44
4.4 Optimization of Chloroform and Chlorine Production 45
4.4.1 Optimization of Chlorine by Using Distllation 46
Column Specifications
4.4.2 Optimization of Chloroform by Varying 47
Separator Inlet Temperature
4.5 Cost Estimation 48
4.5.1 Capital Cost Investment 48
4.5.2 Variable Manufacturing Cost 61
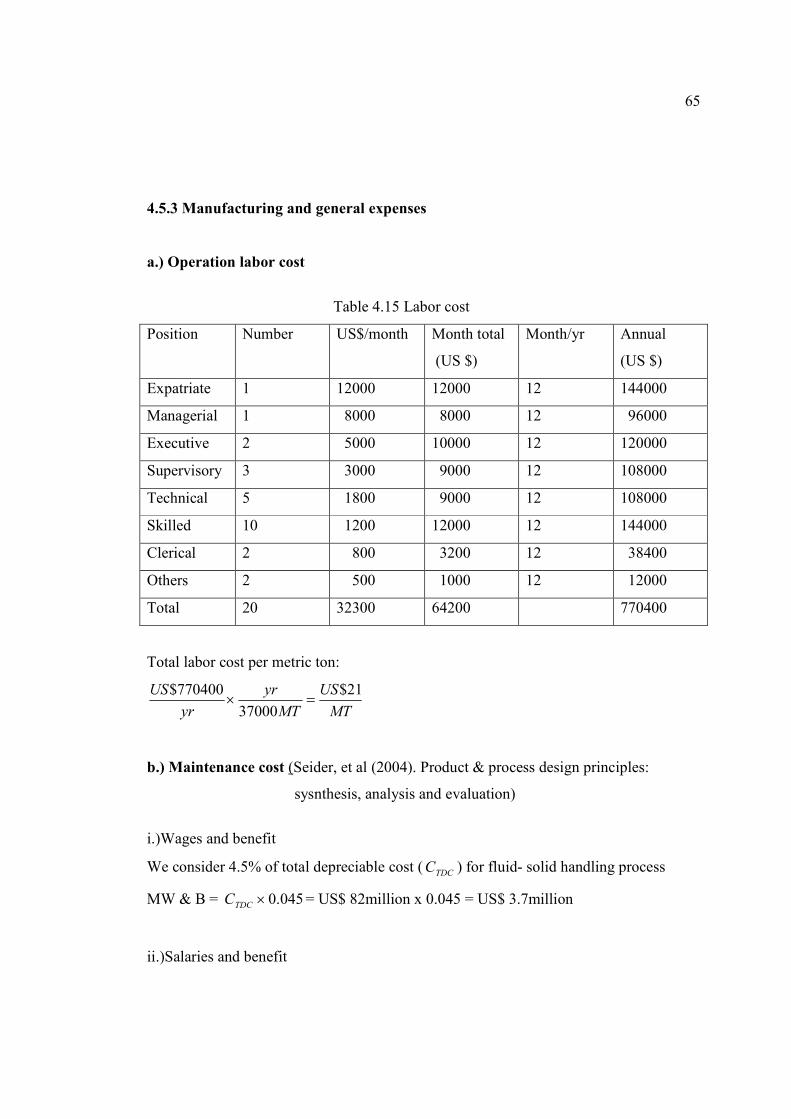
4.5.3 Manufacturing and General Expenses 65
4.5.4 Summary of Benzoic Acid Annual 69
Production Cost
4.6 Breakeven Point Calculations 70
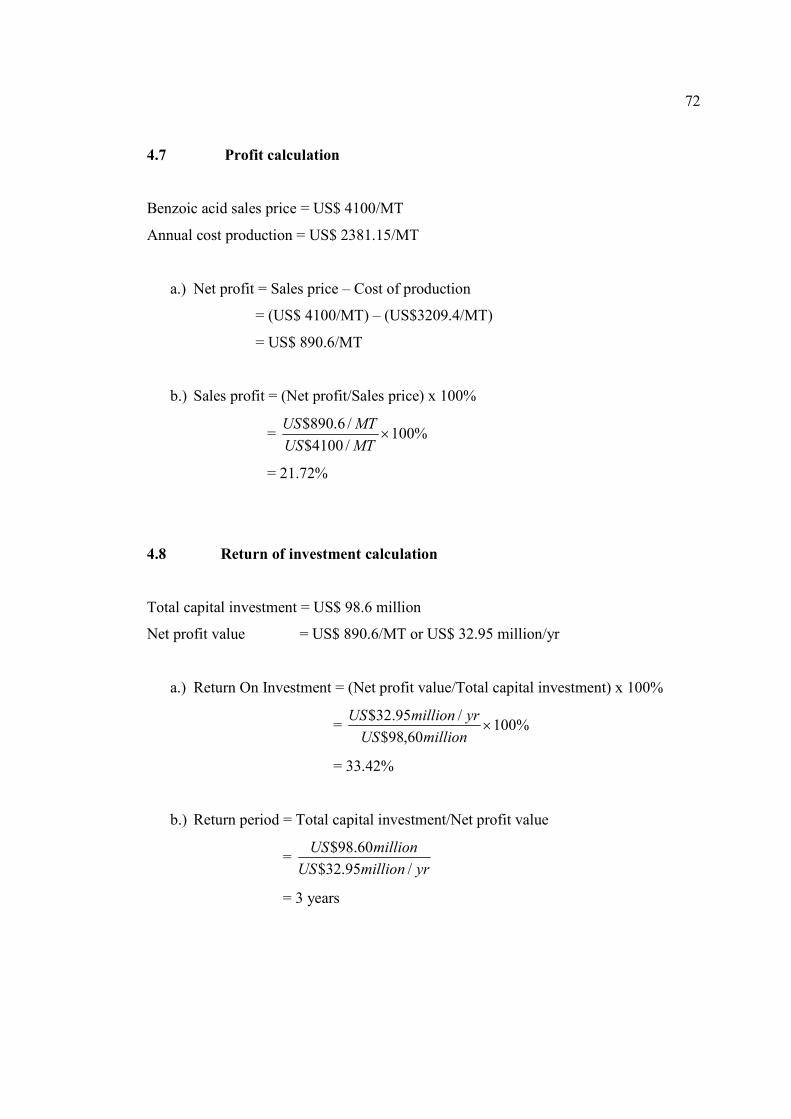
4.7 Profit Calculations 72
4.8 Return Of Investment Calculations 72
4.9 Benzoic Acid Project Economics 73
Analysis Review
5 CONCLUSION AND RECOMMENDATIONS 74
5.1 Conclusions 74
5.2 Recommendations 75
REFERENCES 76
APPENDICES 79
Page 11
x
LIST OF TABLES
TABLE TITLE PAGE
2.1 Environmental and Health Effects for Chemicals 18
3.1 Process Data for PBR reactor 25
3.2 Heat Capacities and Formation for Various Chemical Reactants 27
3.3 Mass Flow Rate for Various Materials and Product stream in HYSYS
3.4 Mass flow rate and fraction for Hydro cyclone-2 in 30
HYSYS
4.1 Results of distillate and bottom liquids molar flow and 34
component mole fraction for different temperature
4.2 Distillate and bottoms liquids molar flow and component 35
mole fraction for different acetic anhydride molar flow rate
4.3 Relationship between reflux ratio, composition and power 36
4.4 Conversion rate and composition of chemical substance 39
inside the oxidation reactor
4.5 Composition of various chemical substances in oxidation 40
reactor at different temperature
Page 12
xi
4.6 Results after and before optimization 41
4.7 Benzoic acid component mole fraction and conversion rate 42
at different temperature
4.8 Benzoic acid component mole fraction and molar flow 43
at different temperature
4.9 Results before and after optimization 44
4.10 Benzoic acid purity at different hydro cyclone efficiency 45
4.11 Chlorine and chloroform component mole fraction before 47
and after enter the distillation column
4.12 Chloroform component mole fraction and molar flow 48
at different temperature
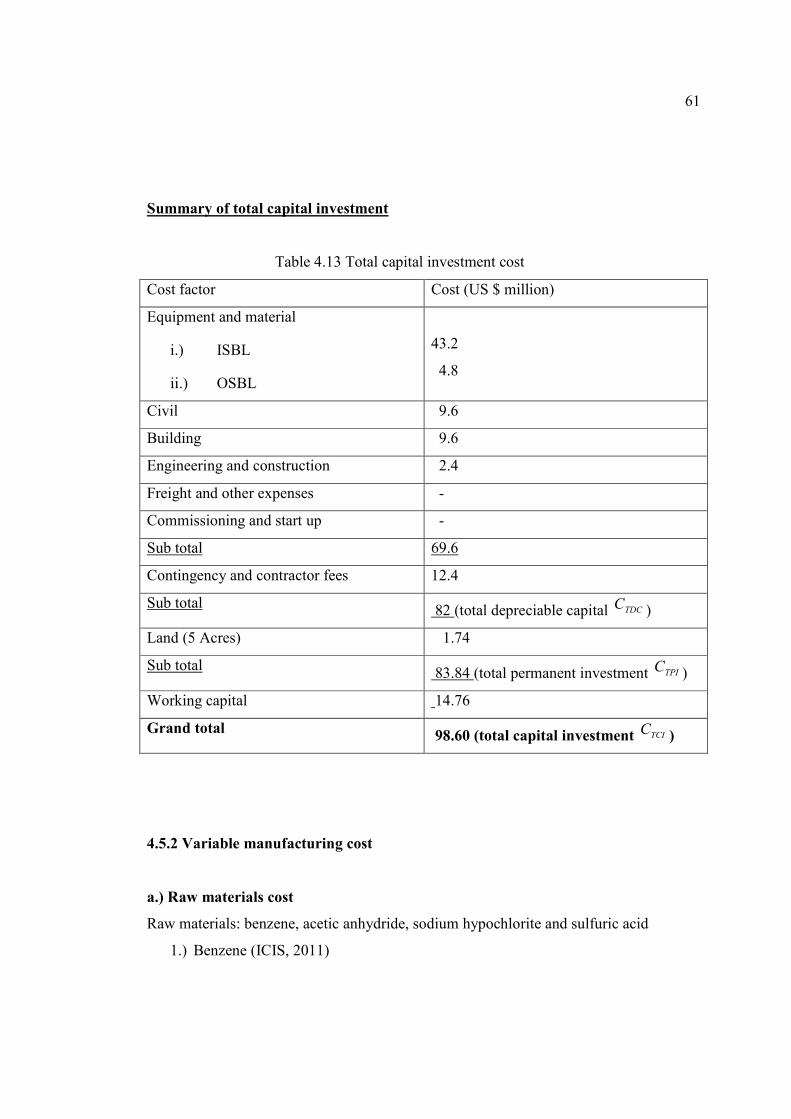
4.13 Bare module cost of equipment 58
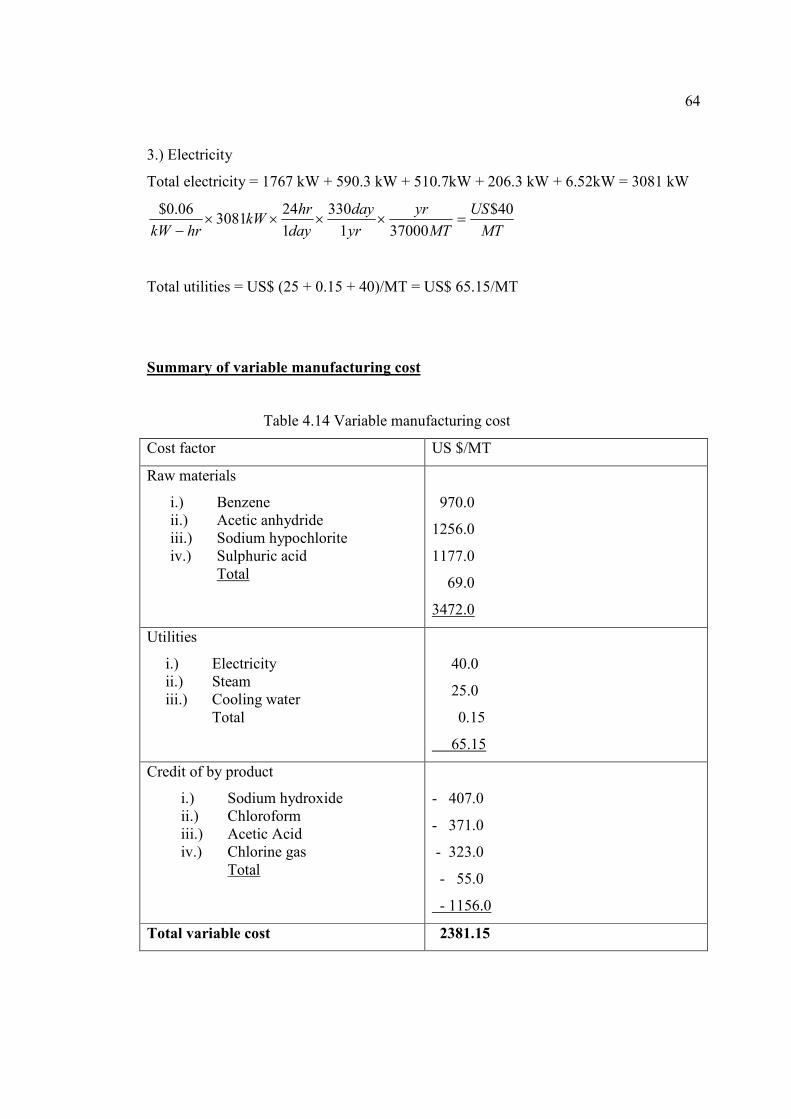
4.14 Variable manufacturing cost 64
4.15 Labor cost 65
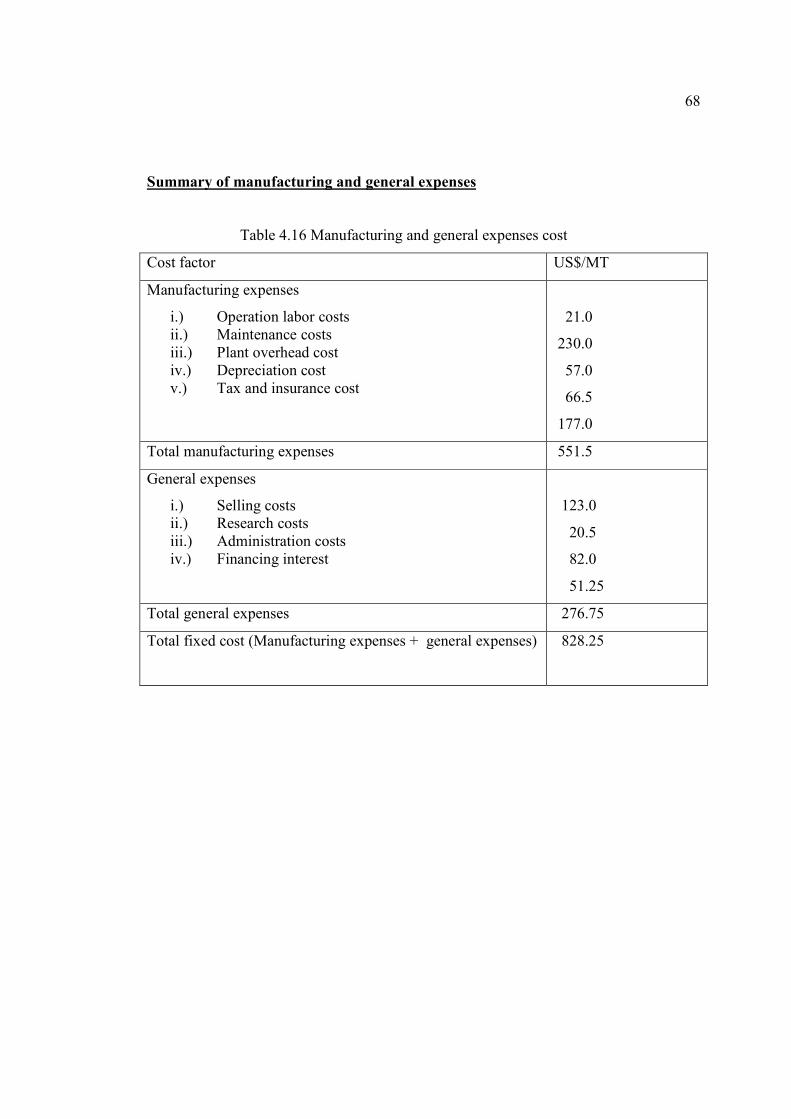
4.16 Manufacturing and general expenses cost 68
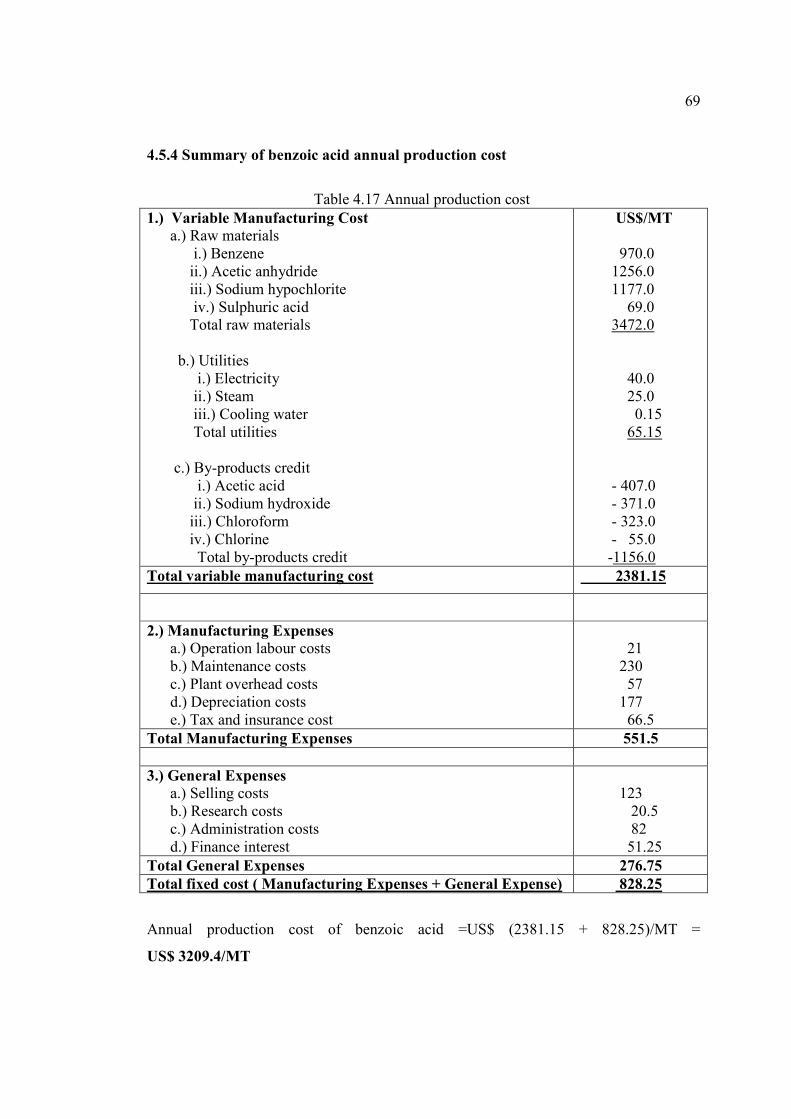
4.17 Annual production cost 69
4.18 Benzoic acid economics analysis 73
Page 14
xiii
LIST OF FIGURES
FIGURE TITLE PAGE
3.1 Block diagram of the benzoic acid plant simulation using 32
ASPEN HYSYS
4.1 (a) Acetophenone composition specification of 99% mole fraction 37
4.1 (b) Acetic acid composition specification of 99% mole fraction 37
4.2 Benzoic Acid Profit Volume Graph (Breakeven point) 71
Page 15
xiv
LIST OF SYMBOLS / ABBREVIATIONS
BMC bare module cost
cp specific heat capacity, J/(kg⋅K)
PC purchase cost
iD Internal diameter, ft
oD Outer diameter, ft
TE separation efficiency
BMF bare module factor
MF material factor
PF pressure factor
H height, ft
οRxH∆ heat of reaction
L length, ft
M mass flow rate, kg/s
Nm
number of independent variables
Nom
number of manipulated variables with no steady state effect
Noy
number of variables that need to be controlled from Nm
Nss
number of variables needed to be specified
P pressure, kPa
Pb pump horsepower. Hp
Q heat
S maximum allowable stress
T temperature, K
RT reference temperature
V volumetric flow rate. GPM
Page 16
xv
W work done
X conversion
Θ stoichiometric coefficient
η power efficiency
ρ density, kg/m3
ω compressible flow parameter
CO carbon monoxide
2CO carbon dioxide
et al. et alias: and others
NaOH sodium hydroxide
Page 17
xvi
LIST OF APPENDICES
APPENDIX TITLE PAGE
A Optimization Graph 80
B Benzoic Acid Production Plant Diagram 88
C HYSYS Workbook 89
Page 18
1
CHAPTER 1
INTRODUCTION
1.1 History and Application of Benzoic Acid
Benzoic acid was discovered by Nostradamus (1556), and subsequently by Alexius
Pedemontanus (1560) and Blaise de Vigenère (1596). However, the structure of benzoic
acid only be determined later in year 1832 by Justus von Liebig and Friedrich Wehler.
Benzoic acid, can also be known as benzenecarboxylic acid is the simplest aromatic
carboxylic acid containing carboxyl group bonded directly to benzene ring, is a white,
crystalline organic compound.
It application is widely benefits in our daily lives. Benzoic acid is converted to
its salts and esters for the use of preservative application in foods, drugs and personal
products. Sodium benzoate, sodium salt of benzoic acid, is used preferably as one of the
principal anti-microbial preservatives used in foods and beverages. Sodium Benzoate is
also used in medications, anti-fermentation additives and tabletting lubricant for
pharmaceuticals. The industrial applications are as a corrosion inhibitor, or as an
additive to automotive engine antifreeze coolants and in other waterborne systems, it is
used as a nucleating agents for polyolefin. as a dye intermediate, as a stabilizer in
photographic processing and as a catalyst. Wide range of benzoic esters are used as
solvents, dying carrier, disinfectant additive, penetrating agent and pesticides and
Page 19
2
manufacturing other compounds. Besides, more than 90% of commercial benzoic acid is
converted directly to phenol and caprolactam. Its use in the production of glycol
benzoates for the application of plasticizer in adhesive formulations is increasing. It is
also used in the manufacture of alkyd resins and drilling mud additive for crude oil
recovery applications. It is used as a rubber polymerization activators and retardants.
(encyclopedia Benzoic Acid, 2008)
1.2 HYSYS
Aspen Hysys contains data, physical properties, unit operation models, built in default,
reports and other features and capabilities developed for specific industrial application.
Key Aspen Hysys feature is listed below: (HYSYS documentation, 2002)
1.) Thermo physical properties
Physical properties model and data are key to generating accurate simulation
results. Aspen Hysys used the extensive and proven physical property models,
data and estimation methods which cover a wide range of processes.
2.) Convergence analysis
Automatically analyze and suggest optimal tear streams, flow sheet convergence
method and solution sequence for even the largest flow sheets with multiple
stream and information recycle.
3.) Sensitivity analysis
Conveniently generate tables and plots showing how performance varies with
changes to selected equipment specifications and operating conditions.
4.) Design specification
Page 20
3
Capabilities to calculate operating conditions or equipment parameters to meet
specified performance target.
5.) Determine plant operating condition
It will maximize any objective function specified, including process yields,
energy usage, stream purities and process economics.
1.3 Problem statement
The production of benzoic acid by oxidation of toluene is used nearly 99% of the
worldwide. The latest technology of benzoic acid production is acylation of benzene
with acetic anhydride which might be more profitable and could replace the current
benzoic acid production process. Besides, in reality the chemical plant are often in
unsteady state due to catalytic degradation, equipment fouling and feed disturbances.
Optimization is needed to make a better design in order to ensure the process run
smoothly without risk.
1.4 The objectives of study
The aim of this study is to design a new process to produce benzoic acid by using
benzene and acetic anhydride as raw material. A further objective of this project is to
estimate the net profit of this process.
Page 21
4
1.5 Scope of study
To achieve objectives, several scopes have been studied.
i.) Base case simulation
By using ASPEN HYSYS 3.2, benzoic acid simulation plant was being
developed.
ii.) Optimization
Benzoic acid production was optimized by varying the material flow rate in
certain range to monitor the composition of the product.
iii.) Heat integration
This system is used to increase the efficiency of the plant and maximizing the
production by varying the process temperature using heat exchanger.
iv.) Physical and chemical properties of chemical substance
To study the chemical reaction and critical properties for each chemical
substance which are play important role in the plants.
v.) Cost estimation
To learn how to estimate the production cost and the net profit of the process.
Page 22
5
CHAPTER 2
LITERATURE REVIEW
2.1 Introduction
In this chapter, a general benzoic acid production using benzene, acetic anhydride,
sodium hypochlorite and sulphuric acid as an input was reviewed. The idea of this
project was to carry out the simulation of benzoic acid production by using ASPEN
HYSYS software. Simulation is the process designing a model of a real system and
conducting experiments with this model for the purpose either of understanding the
behaviour of the system or of evaluating various strategies (within the limits imposed by
a criterion or set of criteria) for the operation of the system. The purpose to carry out a
simulation for this reaction was to obtain an optimum condition for this reaction.
Optimum condition is the certain condition that allows the reaction to achieve a highest
yield of product. The main objective of this project was to find out the conditions that
can achieve the highest yield product of benzoic acid. The type of conditions were in
flow rate, temperature or pressure.
Page 23
6
2.2 Green Chemistry
Green chemistry may be defined as the invention, design, and application of chemical
products and processes to reduce or eliminate the use and generation of hazardous
substances. Practitioners of green chemistry strive to protect the environment by
cleaning up toxic waste sites and by inventing new chemical methods that do not pollute
and that minimize the consumption of energy and natural resources.
Green synthesis of the future will require making choices about reactants,
solvents, and reaction conditions that are designed to reduce resource consumption and
waste production. A synthesis is performed in a way that will not consume excessive
amounts of resources (and thus use less energy and be more economical) and also will
not produce excessive amounts of toxic or harmful by-products, by using a milder
reaction conditions.
Ritter (2004) found out that one of the green chemistry approach is to select
safer reagents that are used to carry out the synthesis of a given organic compound. For
example, sodium hypochlorite (bleach) can be used in some oxidation reactions instead
of the highly toxic dichromate/sulphuric acid mixture. (Green Innovations, 2004)
Another approach in green chemistry is to use a reagent that can promote the
formation of a given product in less time and with greater yield. Finally, some reagents,
especially catalysts, can be recovered at the end of the reaction period and recycled for
use again in the same conversion. (Green Innovations, 2004)
Besides, another approach to making organic chemistry greener involves the
way in which a reaction is carried out, rather than in the selection of starting material,
reagents, or solvents. Microwave technology can be used in some reactions to provide
the heat energy required to make the transformation go to completion. With microwave
Page 24
7
technology, reactions can take place with less toxic reagents and in a shorter time, with
fewer side reactions, all goals of green chemistry. (Green Innovations, 2004)
Industrial processes are being designed that are based on the concept of atom
economy. Snorri and James (2005) discovered that the Atom economy means that close
attention is paid to the design of chemical reactions so that all or most of the atoms that
are starting materials in the process are converted into molecules of the desired product
rather than into wasted by-products. The atom economy for a reaction can be calculated
based on the following equation: (Green Chemistry, 2003)
%100)(tan
)(% ×=
MWtsreacAll
MWproductsdesiredyatomeconom
K
K
2.2.1 Replacement of homogenous catalyst with heterogeneous catalyst
Catalysis process research has a tremendous opportunity to reduce the chemical effects
to the environment. New catalytic processes that generate less waste, to protect ozone
layer, to combat the greenhouse effect, to create environmentally safer transport and to
solve environmental problems of energy production will bring development of
environmentally safer products.
Generally the acylation reaction was normally catalyzed Lewis acid for example
AlCl 3 , BF 3 and TiCl 4 which are homogenous catalyst that widely used in industrial
process. However, Lewis acids must be used in higher than stoichiometric amounts and
the catalysts must be destroyed at the end of the reaction with a significant production of
undesirable wastes. Subrahmanyam and Kumari (2003) state that introduction of zeolites
as alternative catalysts has proved to be a major development in the acid catalysed
reactions because of their reusability, shape selectivity, high thermal stability and they
Page 25
8
can be easily tailored to fit the desired reaction. (Catalysis for Energy and
Environmentally Benign Technologies, 2003)
According to Castro et al (1998), recoverable and re-generable solid acid
catalyst such as zeolites Beta can overcome this type of problems. The use of this
heterogeneous catalyst is due to the high selectivity of yield, good in separation and the
recyclable of the catalyst. Meier et al. (1996) found out that due to it acidity, zeolite Beta
catalyst can be catalyzed for Friedel-Crafts-acylation reaction. Furthermore, zeolite Beta
has a high Si/Al ratio, large pore, high acid strength and thermal stability. As overall
conclusion, the heterogeneous catalyst is more efficiency and environmental friendly if
compared to homogenous catalyst. (Molecular Catalysis, 1998)
2.2.2 Oxidation of acetophenone by sodium hypochlorite – Green Chemistry
This project is introduced us to new era of green chemistry. Green Chemistry tries to use
new reagents or less toxic familiar reagents to be more environmental friendly in place
of more hazardous traditional reagents. Currently benzoic acid production is the
oxidation of toluene by using potassium permanganate (IV) as an oxidizing agent. This
reagent is harmful to environment by releasing the metal ions. A great deal of research is
being done and major success stories have been written. One difficulty with green
chemistry is finding reagents that perform as well as older reagents.
According to Anderson and Shine (2010), in the past few years in Ramapo
College New Jersey, there has been success using Clorox (sodium hypochlorite)
reagents but the yield is low if compared to the older reagents. However, the yield can
be improved by varying the reaction conditions by simulation. The green advantage of
using acetophenone is the products formed are not harmful to the environment and in
addition acetophenone is more easily to oxidize by hypochlorite via haloform reaction.
(Ramapo College of New Jersey, 2010)
Page 26
9
Clorox, a mild oxidant, is a dilute solution of sodium hypochlorite (NaOCl).
Clorox should never be mixed with ammonia solutions or ammoniated cleansers as a
reaction that releases deadly chlorine gas. (Ramapo College of New Jersey, 2010)
According to Gholam et al (2008) the advantages of using sodium
hypochlorite are listed below: (Drake University Department of Chemistry, 2008)
i.) Environmental safe
ii.) Inexpensive oxidants
iii.) Available as grocery store as household bleach
iv.) Easy experimental procedure
2.3 Process description
To prepare benzoic acid, three steps are needed in this project. The first step is acylation
of benzene is carried out by the acetic anhydride. Acylation of benzene actually is a
heterogeneous catalytic reaction and thus we need to use packed bed reactor (PBR) in
order to carry this out reaction. The products of this process are acetophenone and acetic
acid. Acetophenone act as an intermediate and will carry forward to another step while
acetic acid is a by-product.
Second step is the oxidation of acetophenone by sodium hypochlorite to
produce sodium benzoate salt, sodium hydroxide and chloroform which are the by-
products. This reaction is carried in a conversion reactor and the sodium benzoate salt is
separated out by the hydro cyclone and again will act as an intermediate in order to
produce benzoic acid in the next step.
Page 27
The final step is the acidific
products will be main products of this project benzoic acid and sodium sulphate which is
the waste disposal of this proces
benzoic acid will be separated by the hydro cyclone as liquid product from the sodium
sulphate salt.
2.3.1 Friedel-Craft acylation of aromatic compounds
A Friedel-Crafts acylation is an electrophilic aromatic substitution reaction which
introduces an acyl group onto an aromatic ring. The electroph
often coupled to a Lewis acid catalyst, such as alumin
reaction to take place, the aromatic ring system must be very electron rich and thus
cannot contain any electron withdrawing groups.
process:
Figure 2.1 Friedel-Crafts acylation
Adams and Noller (2005)
withdrawing effect of the carbonyl group, the ketone product is always less r
the original molecule so multiple acylation or other side reaction do not occur.
The final step is the acidification of sodium benzoate by sulph
products will be main products of this project benzoic acid and sodium sulphate which is
the waste disposal of this process. The reaction is carried out in a conversion reactor and
benzoic acid will be separated by the hydro cyclone as liquid product from the sodium
Craft acylation of aromatic compounds (McMurry, Joh
Crafts acylation is an electrophilic aromatic substitution reaction which
introduces an acyl group onto an aromatic ring. The electrophile is an acyl cation that is
often coupled to a Lewis acid catalyst, such as aluminium chloride. In order for the
reaction to take place, the aromatic ring system must be very electron rich and thus
cannot contain any electron withdrawing groups. Below is the diagram of acylation
Crafts acylation
Adams and Noller (2005) discovered that due to the electron
withdrawing effect of the carbonyl group, the ketone product is always less r
the original molecule so multiple acylation or other side reaction do not occur.
10
ation of sodium benzoate by sulphuric acid. The
products will be main products of this project benzoic acid and sodium sulphate which is
s. The reaction is carried out in a conversion reactor and
benzoic acid will be separated by the hydro cyclone as liquid product from the sodium
McMurry, John. 2004)
Crafts acylation is an electrophilic aromatic substitution reaction which
ile is an acyl cation that is
um chloride. In order for the
reaction to take place, the aromatic ring system must be very electron rich and thus
the diagram of acylation
discovered that due to the electron-
withdrawing effect of the carbonyl group, the ketone product is always less reactive than
the original molecule so multiple acylation or other side reaction do not occur.
Page 28
11
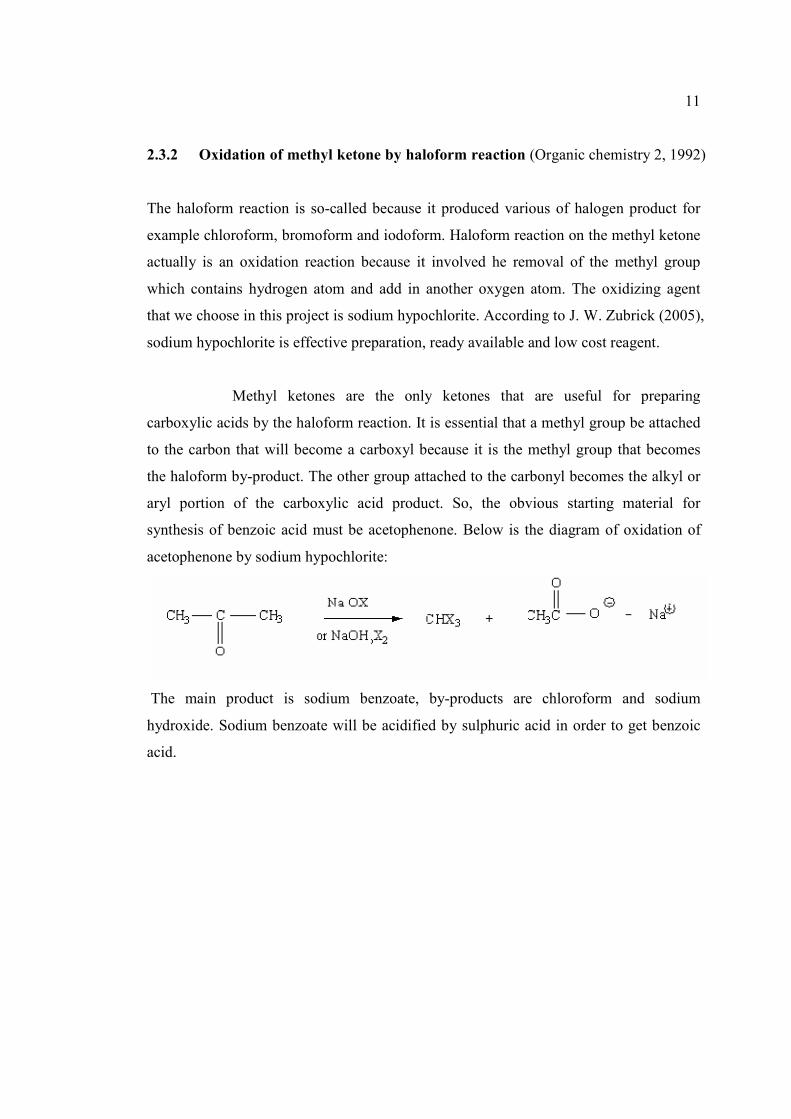
2.3.2 Oxidation of methyl ketone by haloform reaction (Organic chemistry 2, 1992)
The haloform reaction is so-called because it produced various of halogen product for
example chloroform, bromoform and iodoform. Haloform reaction on the methyl ketone
actually is an oxidation reaction because it involved he removal of the methyl group
which contains hydrogen atom and add in another oxygen atom. The oxidizing agent
that we choose in this project is sodium hypochlorite. According to J. W. Zubrick (2005),
sodium hypochlorite is effective preparation, ready available and low cost reagent.
Methyl ketones are the only ketones that are useful for preparing
carboxylic acids by the haloform reaction. It is essential that a methyl group be attached
to the carbon that will become a carboxyl because it is the methyl group that becomes
the haloform by-product. The other group attached to the carbonyl becomes the alkyl or
aryl portion of the carboxylic acid product. So, the obvious starting material for
synthesis of benzoic acid must be acetophenone. Below is the diagram of oxidation of
acetophenone by sodium hypochlorite:
The main product is sodium benzoate, by-products are chloroform and sodium
hydroxide. Sodium benzoate will be acidified by sulphuric acid in order to get benzoic
acid.
Page 29
12
2.4 Properties and background of chemicals
2.4.1 Acetic anhydride
Acetic anhydride is a clear, colorless, mobile (free-flowing) liquid with a sharp odor.
According to Shakhashiri (2008), an anhydrous (“without water”) reagent could lead to
better yields of product. This is the reason why acetic anhydride was chosen as material
in this project. As with acetic acid, the primary use of acetic anhydride is used in the
manufacture of cellulose acetate for films and plastic goods; about 75 percent of the
acetic anhydride produced annually in the United States is used for this purpose.
Approximately 1.5 percent of the annual acetic anhydride production is used in the
synthesis of aspirin. Other uses include the manufacture of industrial chemicals,
pharmaceuticals, perfumes, plastics, synthetic fibers, explosives, and weed killers.
Because acetic anhydride reacts with water, it is sometimes used as a dehydrating agent
in reaction mixtures where removal of water is necessary. (Chemical of the Week, 2008)
2.4.2 Benzene
Benzene is an aromatic hydrocarbon that is produced by the burning of natural products.
It is a component of products derived from coal and petroleum and is found in gasoline
and other fuels. It is also a principal component of combustion products produced by the
burning of PVC (polyvinyl chloride). Benzene is used in the manufacture of plastics,
detergents, pesticides, and other chemicals. Benzene also acts as an intermediate in the
manufactures of phenol for resins and cyclohexane for nylon. Only smaller amount of
benzene are used to make some types of rubbers, lubricants, dyes, detergents, drugs,
explosives, napalm and pesticides. (Report of Carcinogens, 2000)
Page 30
13
Until World War II, most benzene was produced as a by-product of coke
production (or "coke-oven light oil") in the steel industry. However, in the 1950s,
increased demand for benzene, especially from the growing plastics industry,
necessitated the production of benzene from petroleum. Today, most benzene comes
from the petrochemical industry, with only a small fraction being produced from coal.
There are four chemical processes contribute to industrial benzene production: catalytic
reforming, toluene hydrodealkylation, toluene disproportionation and steam cracking.
(Report of Carcinogens. 2000)
2.4.3 Acetic acid
Acetic acid is a clear, colorless liquid with a sharp, irritating odor of vinegar. In poorly
heated laboratories, the acid was oftentimes found frozen inside its container because its
freezing point is only slightly below room temperature at 16.7C. The term glacial (ice-
like) came to be applied to the pure acid in either its solid or liquid state. Glacial acetic
acid boils at 118C, and has a density of 1.049 g/mL at 25C. It is flammable with a flash
point of 39C. Shakhashiri (2008) discovered that through hydrogen bonding interactions,
acetic acid is miscible (mixable) in all proportions with water, ethyl alcohol, and diethyl
ether. Pure or concentrated solutions of acetic acid are very corrosive and can cause
painful burns. Aqueous solutions of acetic acid freeze at temperatures below the freezing
point of water. (Chemical of the Week, 2008)
For many years, the bulk of commercial acetic acid was produced by the
oxidation of ethanol. Today, most industrial production of acetic acid is by the Monsanto
process, in which carbon monoxide reacts with methanol under the influence of a
rhodium complex catalyst at 180C and pressures of 30–40 atm. About 3.2 × 10⁹
kilograms of acetic acid were produced in the United States in 1999. The primary use of
this chemical is in the manufacture of assorted acetate esters. These are substances
formed by reacting acetic acid with a substance containing a hydroxyl (–OH) group.
Page 31
14
Cellulose, found in cotton and wood, is a polymeric material containing multiple
hydroxyl groups. It reacts with acetic acid to yield cellulose acetate, which is used to
make films and textiles. Some photographic films are made of cellulose acetate, and
rayon is made from cellulose acetate fibers. Vinyl acetate, another ester of acetic acid,
polymerizes to form poly(vinyl acetate), which is used in water-based latex paints and in
glues for paper and wood. (Chemical of the Week, 2008)
2.4.4 Sodium hypochlorite
Sodium hypochlorite is a green/yellow liquid with the characteristic smell of chlorine. It
was first used as a bleaching agent and was then discovered to be effective in controlling
wound infections. Subsequently, it is most commonly known as household bleach and as
a disinfectant, a bleaching agent, in medical treatments and used in the disinfection of
drinking water. It is also used for a number of industrial processes such as for
commercial laundering, in the manufacture of paper and pulp, for industrial chemical
synthesis and disinfection of swimming pools. Perhaps one of the most important
applications of sodium hypochlorite is in the disinfection of public water supplies to
prevent the transmission of waterborne diseases such as cholera and typhoid. (HPA
Compendium of Chemical Hazard, 2008)
Sodium hypochlorite generally is an unstable compound even at normal
temperatures, which gradually decomposes naturally. The decomposition rate is accelerated
by the elevation of temperature, sunlight especially ultraviolet, heavy metals and the
acceleration of pH. Since commercial aqueous solutions are diluted with a large quantity of
water, there is no danger of ignition or explosion. Most metals and fibers are corroded by
sodium hypochlorite due to its oxidizing properties. Excellent corrosion resistant materials
are titanium, glass, and ceramics. Other corrosion resistant materials are rigid polyvinyl
chloride, polyvinylidene chloride, polyethylene, fluororesin, flexible polyvinyl chloride, and
Page 32
15
ebonite. Rubbers are less resistant to corrosion by sodium hypochlorite. (Japan Soda
Industry Association, 2008)
2.4.5 Sulphuric acid
Commercial sulphuric acid is sometimes colourless but, it is often yellow and its colour
ranges from pale to dark brown shades. In dilute solution, it is highly corrosive and
attacks nearly all metals. Dilute solution of sulphuric acid show all the behaviour
characteristics of acids. They taste sour, conduct electricity, neutralize alkalines and
corrode active metals with the formation of hydrogen gas. It used as drying agent,
acidifying agent (pH control), hydrolyzing agent, neutralizing agent, dehydrating agent,
oxidizing agent, absorbing agent, purifying agent, leaching agent, catalyst and active
reagent is petrochemical industries.
There are two major processes which are lead chamber and contact process
for production of sulphuric acid, are available commercially in a number of grades and
concentration. The lead chamber process, the older of the two processes, is used to
produce much of the acid used to make fertilizers; it produces a relatively dilute acid
(62%-78% H 2 SO 4). The contact process produces a purer, more concentrated acid but
requires purer raw materials and the use of expensive catalysts. (Encyclopedia, 2008)
Sulphuric acid is one of the most important industrial chemicals. More of it is
made each year than is made of any other manufactured chemical; more than 40 million
tons of it was produced in the United States in 1990. The major use of sulfuric acid is in
the production of fertilizers, for example superphosphate of lime and ammonium sulfate.
It is widely used in the manufacture of chemicals in making hydrochloric acid, nitric
acid, sulfate salts, synthetic detergents, dyes and pigments, explosives, and drugs.
Besides, it is also used in petroleum refining to wash impurities out of gasoline and other
refinery products. (Encyclopedia, 2008)
Page 33
16
2.4.6 Chloroform
Chloroform is a colourless, volatile liquid that is non-flammable. It is slightly soluble in
water and is miscible with oils, ethanol, ether, and other organic solvents. Chloroform
has a pleasant, non-irritating odour. It is unstable when exposed to air, light, and/or heat,
which cause it to break down to phosgene, hydrochloric acid, and chlorine. It is usually
stabilized by the addition of 0.5% to 1% ethanol. When heated to decomposition,
chloroform emits toxic fumes of hydrochloric acid and other chlorinated compounds
(WHO 1994, HSDB 2001).
In industry, chloroform normally is produced by the chlorination of methyl
chloride at high temperatures or through the haloform reaction which the sodium
hypochlorite as a reagent. McCulloh (2003) discovered that chloroform is manufactured
mainly in United State and the total capacity in the late 1990s being about 520000 tons
per year. An estimated 95% of the global consumption of chloroform is in the
manufacture of hydrochlorofluorocarbons, specifically HCFC-22, which is widely used
in refrigeration and air conditioning applications because of its excellent physical and
thermodynamic properties. HCFC-22 is also used in the production of fluoropolymers
and as a blowing agent for rigid expanded polystyrene (XPS) foam insulation. The
remaining 5% of chloroform produced globally is used in the synthesis of
pharmaceuticals and agricultural products, and as laboratory reagents.
2.4.7 Chlorine
Chlorine is a toxic, corrosive, greenish yellow gas with a pungent, irritating odour.
Chlorine is produced mostly by electrolysis of brine; some is obtained as a by-product in
the manufacture of sodium metal by the electrolysis of sodium chloride either molten or
in solution. It was, in fact, one of the first poisonous gases used in warfare—in 1915
during World War I. In spite of its disagreeable nature, there are so many everyday
Page 34
17
products that contain chlorine or are manufactured through the use of chlorine that it is
among the top ten chemicals produced in the United States each year. In 1994, more
than 24 billion lb (11 billion kg) of chlorine were produced. (United State Protection
Agency, 1999)
Chlorine is an important chemical in water purification, in disinfectants, in
bleach and in mustard gas. Chlorine is also used widely in the manufacture of many
products and items directly or indirectly, for example in paper product production,
antiseptic, dyestuffs, food, insecticides, paints, petroleum products, plastics, medicines,
textiles, solvents, and many other consumer products. It is used to kill bacteria and other
microbes from drinking water supplies. Chlorine is involved in beaching wood pulp for
paper making, bleach is also used industrially to remove ink from recycle paper. (United
State Protection Agency, 1999)
2.4.8 Sodium hydroxide
Sodium hydroxide is industrially produced as a 50 % solution by variations of the
electrolytic chloro-alkali process. Chlorine gas is also produced in this process. Solid
sodium hydroxide is obtained from this solution by the evaporation of water. Solid
sodium hydroxide is most commonly sold as flakes, prills, and cast blocks. In 2004,
world production was estimated at 60 million dry metric tonnes of sodium hydroxide,
and demand was estimated at 51 million tonnes. Sodium hydroxide may be formed by
the metathesis reaction between calcium hydroxide (also known as lime) and sodium
carbonate (also known as soda ash). The major use of sodium hydroxide is in the
manufacture of other chemicals. It is widely use in textile industry, production of viscose
rayon, production of soap and detergents, and used for sodium hypochlorite which is
used as a household bleach. (Encyclopedia, 2008)
Shalok and Kaley (2003) discovered that sodium hydroxide itself is non-
combustible material but if sodium hydroxide mixed with water, it may generate enough
Page 35
18
heat to ignite the combustible materials. Sodium hydroxide reacts with all mineral and
organic acids, forming the corresponding salts. The heat generated may be sufficient to
raise the temperature above the boiling point, resulting in sporadic, dangerous of the
solution. Besides, sodium hydroxide also reacts with metals such as aluminium and zinc
to generate flammable hydrogen gas. (Technical Supporting Documents, 2003)
Page 36
19
2.5 Material Safety Data Sheet (MSDS) of chemicals
Table 2.1 Environmental and health effects of chemicals
Chemicals Environmental effects Health effects
Acetic anhydride
(OSHA, 2008)
- Toxic gases and vapours (such as
CO 2 , CO, various hydrocarbons
and acid aerosol) may be released
if decomposed.
- When released into water, this
material is expected to react with
water to form acetic acid which
decreased the pH of the water.
- Proctor et al (1988) found
that if exposed to higher
than 5ppm experienced
acute eye and upper
respiratory tract irritation.
- Grayson (1985)discovered
that causes delayed burn
when contact with skin
Benzene
(OSHA, 2008),
(National Pollutant
Inventory, 1992)
- It will breakdown and mobile
quickly when released into soil.
- Slightly soluble in water but is
absorbed by lipid phase of aquatic
organism which results in transport
in the environment
- Long term exposure can
result in various blood
disorder, ranging from
anemia to leukemia, an
irreversible and fatal
disease.
Acetic acid
(OSHA, 2008),
(National Pollutant
Inventory, 1992)
- High concentration means highly
corrosive which can be harmful to
animals, plants and aquatic life.
- Liquid or spray may
produce damage
particularly on mucous
membrane of eyes, mouth
and respiratory tract.
Sodium
hypochlorite
(JapanSoda Industry
Association, 2008),
(OSHA, 2008),
(National Pollutant
Inventory, 1992)
- Chlorine gas and chloroamines
will be produced when mixed with
acidic products or ammonia
cleansers. Chlorine and
chloromines are toxic to aquatic
organism.
- From overall it is an environment
- Hypochlorous acid is
isolated and irritates the
human skin and mucous
membranes, but there is
hardly systemic poisoning
due to absorption.
Page 37
20
friendly chemical.
Sulphuric acid
(National Pollutant
Inventory, 1992)
- It will bring acid rains by
dissolve in cloud, fog or rain.
- Acid rains bring toxicity to
aquatic organisms and plants.
- Exposure to mist can
irritate the eyes, nose,
throat and lungs, and at
higher levels can cause
pulmonary oedema.
Chloroform
(Environment
Agency, 2011),
(OSHA, 2008)
- It involved in reactions with
other air pollutants that form
ground level ozone, which can
cause damage to crop and material
- From overall it is not likely o
cause significant impact
- Inhalation of chloroform
causes central nervous
depression
- Clayton (1982) found put
that exposure of pregnant
women to chloroform may
results in malformation
Chlorine
(OSHA, 2008),
(Lentech water
treatment and
purification, 2009)
- Once in air or water, it
hydrolyses to hypochlorous acids
which are harmful to organisms
living in water and soil.
- No significance effect to animals
and plants since they are not likely
to store chlorine.
- Genium (1992) state that
high level of chlorine can
decrease the organ and
body weight in animal. The
main concern is the
increased likelihood of
cancer induction.
Sodium hydroxide
(OSHA, 2008),
(Technical Support
Document: Sodium
Hydroxide, 2009)
- If release to air it will combines
with water vapour, and the
resulting aerosol or mist will be
corrosive.
- Contamination of groundwater is
not likely to happen since it is
highly reactive and is rapidly
neutralized by organic materials in
soil.
- High concentrations are
irritating to the upper
respiratory tract and may
result in pulmonary edema.
- Skin contact with sodium
hydroxide granules cause
chemical and thermal burns
leading to deep tissue
injury.
Page 38
21
2.6 Summary
Generally there are many articles and journals have been published on benzoic acid
production. In this research, the production of benzoic acid was decided by using
benzene, acetic anhydride and sodium hypochlorite. The reason was because acylation
of benzene by acetic anhydride can result higher yield due to the anhydrous properties of
acetic anhydride. In addition, the low cost and environmental friendly of sodium
hypochlorite is also the main factor for production of benzoic acid.
Page 39
22
CHAPTER 3
MENTHODOLOGY
3.1 Research Tools
This research was carried out using various computational tools. Aspen HYSYS 3.2
simulator was used for process flow sheeting to provide data regional analyses. Aspen
HYSYS 3.2 simulator was also used to perform the new process model for benzoic acid
production using acetic anhydride and benzene as a raw material for fuel cell application.
3.1.1 Aspen Hysys
Aspen Hysys is a component of the Aspen Engineering Suite (AES). The process
simulation capabilities of Aspen Hysys enables engineers to predict the behavior of a
process using basic engineering relationships such as mass and energy balances, phase
and chemical equilibrium, and reaction kinetics. With reliable thermodynamic data,
realistic operating conditions and the rigorous Aspen Hysys equipment models, they can
simulate actual plant behavior.
Page 40
23
3.1.2 Modeling and Simulation of benzoic acid production
The benzoic acid production from benzene and acetic anhydride was simulated using
Hysys software. Typically, the simulation processes took the following stages:
1.) Preparation stage
a.) Define chemical component
b.) Select a thermodynamics package
c.) Add and define the reaction
2.) Building stage
a.) Add and define streams
b.) Add and define unit operations
i.) Packed bed reactor
ii.) Distillation column
iii.) Oxidation reactor
iv.) Acidification reactor
v.) Hydro cyclone
c.) Connecting streams to unit operations
d.) Add auxiliary units
i.) Heat exchanger
ii.) Cooler
3.) Execution
a.) Starting simulation
b.) Optimization for each part
Page 41
24
Based on bench-scale testing, the following process parameters are expected.
Feedstock Consumption
Acetic anhydride: 50 kgmole/h
Benzene: 50 kgmole/hr
Process Conditions
Temperature: 50 ℃
Pressure: 101 kPa
3.2 Mathematical Modelling of the reactor operating
A linear first-order Ordinary Differential Equation (ODE) can be described as follows:
)(yKfYt
Y=+
∂∂
τ (3.1)
In a non-linear equation, the process variable Y may appear as a power,
exponential, or is not independent of other process variables. Here are two examples:
)(3yKfY
t
Y=+
∂∂
τ (3.2)
)(2 yKfYYt
Y=+
∂∂
τ (3.3)
The great majority of chemical engineering processes occurring in nature
are nonlinear. Nonlinearity may arise from equations describing equilibrium behaviour,
fluid flow behaviour, or reaction rates of chemical systems. While a linear system of
equations may be solved analytically using matrix algebra, the solution to a non-linear
set of equations usually requires the aid of a computer.
Page 42
25
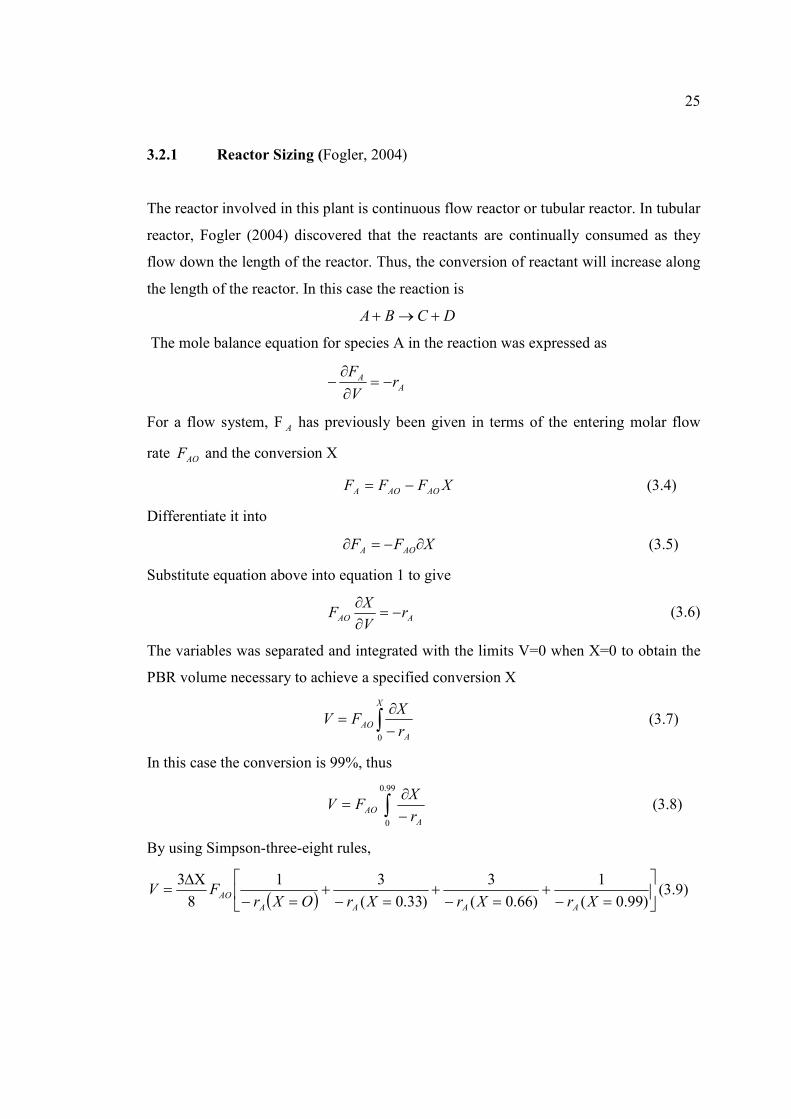
3.2.1 Reactor Sizing (Fogler, 2004)
The reactor involved in this plant is continuous flow reactor or tubular reactor. In tubular
reactor, Fogler (2004) discovered that the reactants are continually consumed as they
flow down the length of the reactor. Thus, the conversion of reactant will increase along
the length of the reactor. In this case the reaction is
DCBA +→+
The mole balance equation for species A in the reaction was expressed as
AA rV
F−=
∂
∂−
For a flow system, F A has previously been given in terms of the entering molar flow
rate AOF and the conversion X
XFFF AOAOA −= (3.4)
Differentiate it into
XFF AOA ∂−=∂ (3.5)
Substitute equation above into equation 1 to give
AAO r
V
XF −=
∂∂
(3.6)
The variables was separated and integrated with the limits V=0 when X=0 to obtain the
PBR volume necessary to achieve a specified conversion X
∫ −∂
=X
A
AOr
XFV
0
(3.7)
In this case the conversion is 99%, thus
∫ −∂
=99.0
0 A
AOr
XFV (3.8)
By using Simpson-three-eight rules,
( )
=−+
=−+
=−+
=−∆Χ
=)99.0(
1
)66.0(
3
)33.0(
31
8
3
XrXrXrOXrFV
AAAA
AO (3.9)
Page 43
26
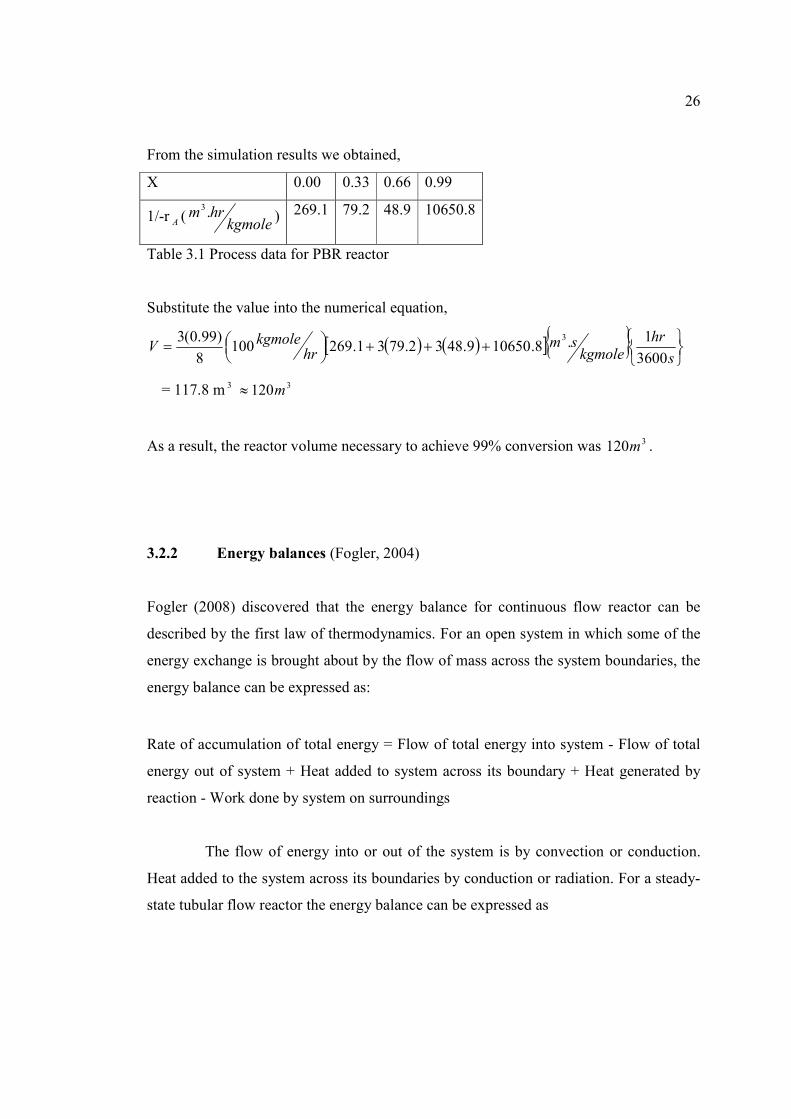
From the simulation results we obtained,
X 0.00 0.33 0.66 0.99
1/-r A ( kgmolehrm .3 ) 269.1 79.2 48.9 10650.8
Table 3.1 Process data for PBR reactor
Substitute the value into the numerical equation,
( ) ( )[ ]{ }
+++
=
s
hr
kgmolesm
hrkgmole
V3600
1.8.106509.4832.7931.2691008
)99.0(3 3
= 117.8 m 3 3120m≈
As a result, the reactor volume necessary to achieve 99% conversion was 3120m .
3.2.2 Energy balances (Fogler, 2004)
Fogler (2008) discovered that the energy balance for continuous flow reactor can be
described by the first law of thermodynamics. For an open system in which some of the
energy exchange is brought about by the flow of mass across the system boundaries, the
energy balance can be expressed as:
Rate of accumulation of total energy = Flow of total energy into system - Flow of total
energy out of system + Heat added to system across its boundary + Heat generated by
reaction - Work done by system on surroundings
The flow of energy into or out of the system is by convection or conduction.
Heat added to the system across its boundaries by conduction or radiation. For a steady-
state tubular flow reactor the energy balance can be expressed as
Page 44
27
[ ] 0)()()(1
0 =−∆+∆−−Θ−− ∑=
n
i
AORPRRxiPiiAOS XFTTCTHTTCFWQο (3.10)
Where
Q = Rate of heat flow
W = Work done by the system
=AOF Reactant initial molar flow rate
T = Operating temperature or outlet temperature
=RT Reference temperature
X = Conversion
=PC Heat capacity
οRxH∆ = Heat of reaction
Θ= Stoichiometric coefficient
Consider plug flow reactor as an example, the reaction is
COOHCHCOCHHCOHCHC 335636466 +→+
Table 3.2 Heat capacities and heat of formation data for various chemical reactants
Substance Heat of formation (kJ/kg mole) Heat capacities (kJ/kg mole.C)
Benzene 82980 126.1
Acetic anhydride -576100 188.6
Acetophenone -86920 253.3
Acetic acid -435100 103.3
Heat of reactionRRx TH (( ο∆ )) = Heat of formation (product) – Heat of formation (reactant)
= (-435100) + (-86920) – [(-576100) + 82980]
= -28900 kJ/kg mole
0PiPiP CCC −=∆ = 253.3 + 103.3 – 126.1 – 188.6 = 42 kJ/kg mole. C
Page 45
28
∑=
=+=Θn
i
PiiC1
7.314)6.188)(1()1.126)(1(
In this case, the reactor is adiabatic. So Q = W = 0. The energy balance equation will be
reduced to
[ ] 0)()()(1
0 =−∆+∆−−Θ− ∑=
n
i
AORPRRxiPiiAO XFTTCTHTTCFο (3.11)
With F AO = 100 kg mole/hr and X = 0.99,
( )
( ) ( )99.010025105.
4228900
256.105.
7.314100
−
+
−−
−
−
hrkgmole
CCCkgmole
kJkgmole
kJ
CCCkgmole
kJhr
kgmole
οο
οο
-2536482 + 2525965 0≈
3.2.3 Degree of freedom (Felder et al, 2000)
There are two types of degree of freedom. The first one is dynamic degrees of freedom,
Nm (m denotes manipulated). Second is steady state degrees of freedom, N
ss . To obtain
the number of steady state degrees of freedom, the subtract from Nom which was the
number of manipulated variables with no steady state effect and Noy which was the
number of variables that need to be controlled from Nm
( )OYOMMSS NNNN +−= (3.12)
In any process simulation work, it is essential that the degrees of freedom analysis be
carried out to determine the number of variables to be specified.
Page 46
29
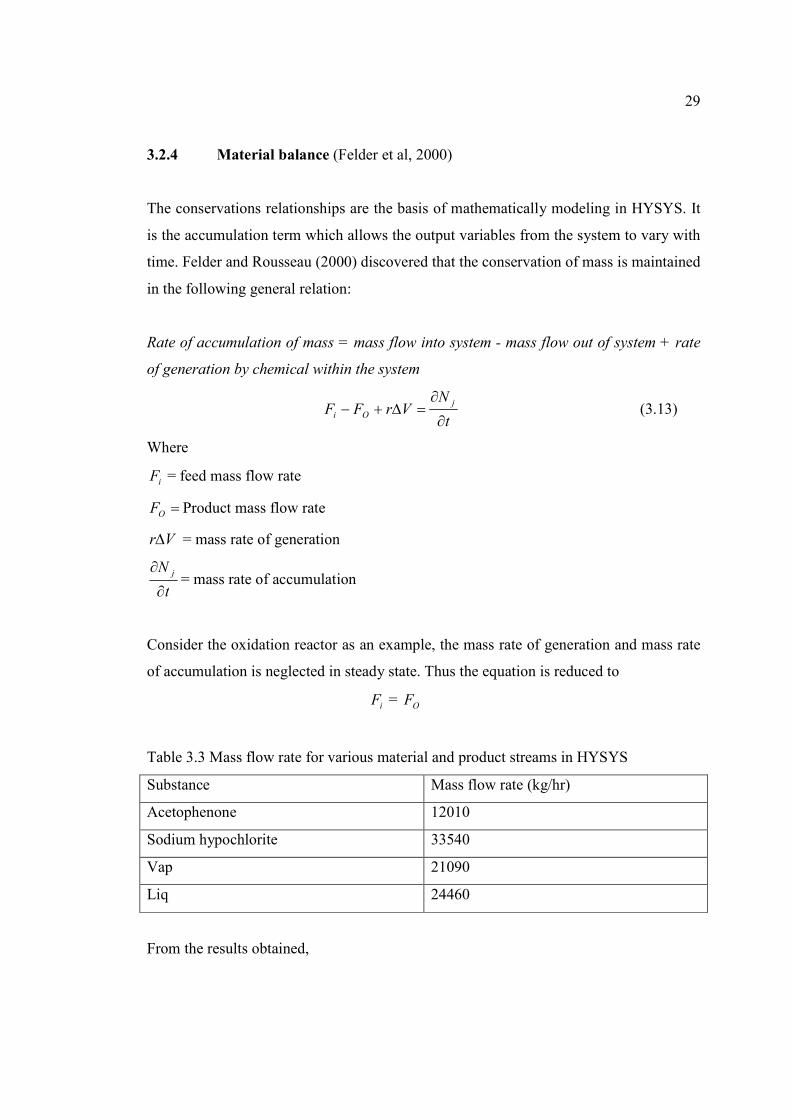
3.2.4 Material balance (Felder et al, 2000)
The conservations relationships are the basis of mathematically modeling in HYSYS. It
is the accumulation term which allows the output variables from the system to vary with
time. Felder and Rousseau (2000) discovered that the conservation of mass is maintained
in the following general relation:
Rate of accumulation of mass = mass flow into system - mass flow out of system + rate
of generation by chemical within the system
t
NVrFF
j
Oi ∂
∂=∆+− (3.13)
Where
iF = feed mass flow rate
=OF Product mass flow rate
Vr∆ = mass rate of generation
t
N j
∂
∂= mass rate of accumulation
Consider the oxidation reactor as an example, the mass rate of generation and mass rate
of accumulation is neglected in steady state. Thus the equation is reduced to
iF = OF
Table 3.3 Mass flow rate for various material and product streams in HYSYS
Substance Mass flow rate (kg/hr)
Acetophenone 12010
Sodium hypochlorite 33540
Vap 21090
Liq 24460
From the results obtained,
Page 47
30
12010 + 33540 = 21090 + 24460
45550 = 45550
3.2.5 Efficiency of hydro cyclone separation (Martin Rhodes, 2008)
Martin Rhodes (2008) did a survey on the efficiency separation if he hydro cyclone. The
efficiency could be related to the following equation:
( )x
FM
xF
M
E
CC
T
∂∂
∂∂
= (3.14)
Where
TE = Separation efficiency
M = feed mass flow rate
=CM coarse product mass flow rate
∂∂
xFC = mass fraction of solid in coarse product
( )x
F∂
∂ = mass fraction of solids in feed
Consider hydro cyclone 2 as an example
Table 3.4 Mass flow rate and fraction for Hydro cyclone-2 in HYSYS
Stream name Mass flow rate (kg/hr) Mass fraction
Liq prods (feed) 20620 0.267
Sodium sulphate (coarse product) 8451 0.656
( )
( )99.0
267.020620
656.08451
=
=
hrkg
hrkg
ET
The efficiency obtained was satisfied with the simulation result.
Page 48
31
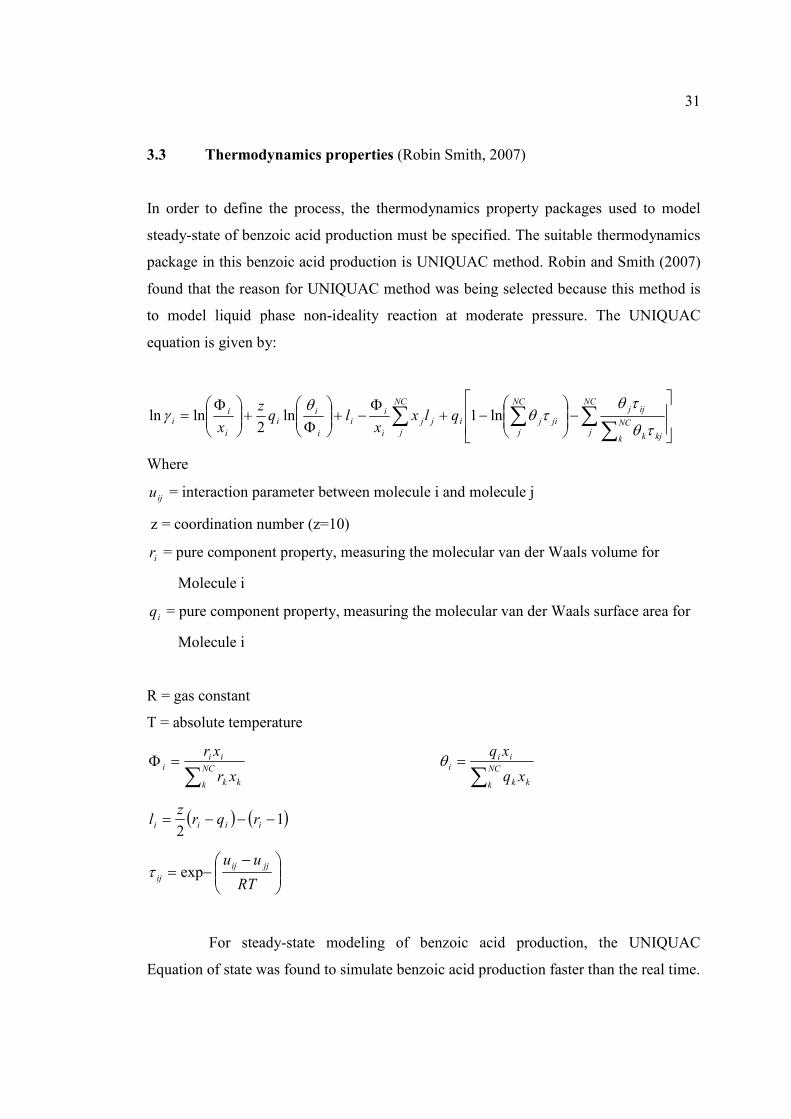
3.3 Thermodynamics properties (Robin Smith, 2007)
In order to define the process, the thermodynamics property packages used to model
steady-state of benzoic acid production must be specified. The suitable thermodynamics
package in this benzoic acid production is UNIQUAC method. Robin and Smith (2007)
found that the reason for UNIQUAC method was being selected because this method is
to model liquid phase non-ideality reaction at moderate pressure. The UNIQUAC
equation is given by:
−
−+
Φ−+
Φ+
Φ= ∑
∑∑∑
NC
jNC
k kjk
ijjNC
j
jiji
NC
j
jj
i
ii
i
ii
i
ii qlx
xlq
z
x τθ
τθτθ
θγ ln1ln
2lnln
Where
iju = interaction parameter between molecule i and molecule j
z = coordination number (z=10)
ir = pure component property, measuring the molecular van der Waals volume for
Molecule i
iq = pure component property, measuring the molecular van der Waals surface area for
Molecule i
R = gas constant
T = absolute temperature
∑=Φ
NC
k kk
iii
xr
xr
∑=
NC
k kk
iii
xq
xqθ
( ) ( )12
−−−= iiii rqrz
l
−−=
RT
uu jjij
ij expτ
For steady-state modeling of benzoic acid production, the UNIQUAC
Equation of state was found to simulate benzoic acid production faster than the real time.
Page 49
32
3.4 Summary
As summary, this chapter was mainly about the development of the simulation using
ASPEN HYSYS 3.2. The thermodynamics package need to be chosen before begins the
simulation and all energy and mass balances have established for all cases. Below is the
block diagram for the simulation sequences.
Figure 3.1 Block diagram of the benzoic acid plant simulation using ASPEN HYSYS
Page 50
33
CHAPTER 4
RESULTS AND DISCUSIONS
4.1 Optimization for base case study
The base case of this study was developed by the introduction of the raw
materials into the packed bed reactor (PBR). The raw materials used were acetic
anhydride and benzene. The variables to be optimized were the acetic anhydride flow
rate and packed bed reactor feed temperature in order to monitor the composition and
molar flow of the products. The process was carried in liquid form and the reactor and
distillation column was set to 101kPa which is atmospheric pressure.
4.1.2 Results of base case feed temperature optimization
Initially both of the materials were in liquid phase at room temperature 25 Co . The
reactor pressure was set to 101kPa because in this reaction the pressures do not have
significant effect since the reaction is under liquid phase. On the other hands, from table
4.1, by varying the feed temperature from the range 0 Co to 100 Co , the composition
and molar flow of the distillate and bottom liquids were observed to be the same. In this
Page 51
34
case, the temperature did not play an important role in this reaction. Thus this reaction
could undergo under room temperature. This could save the equipment cost utility costs
because the process was run in the condition without the heat exchanger. Below are the
results for different temperature:
Table 4.1 Results of distillate and bottom liquids molar flow and component mole
fraction for different temperature
Temperature
( oC)
Distillate molar
flow rate
(kg mole/hr)
Distillate acetic
acid component
mole fraction
Bottom liquids
molar flow rate
(kg mole/hr)
Bottom liquids
acetophenone
component
mole fraction
20 50.14 0.9967 49.86 0.9999
40 50.15 0.9966 49.85 0.9999
60 50.17 0.9962 49.83 0.9999
80 50.27 0.9941 49.72 0.9999
100 59.64 0.8380 40.36 0.9999
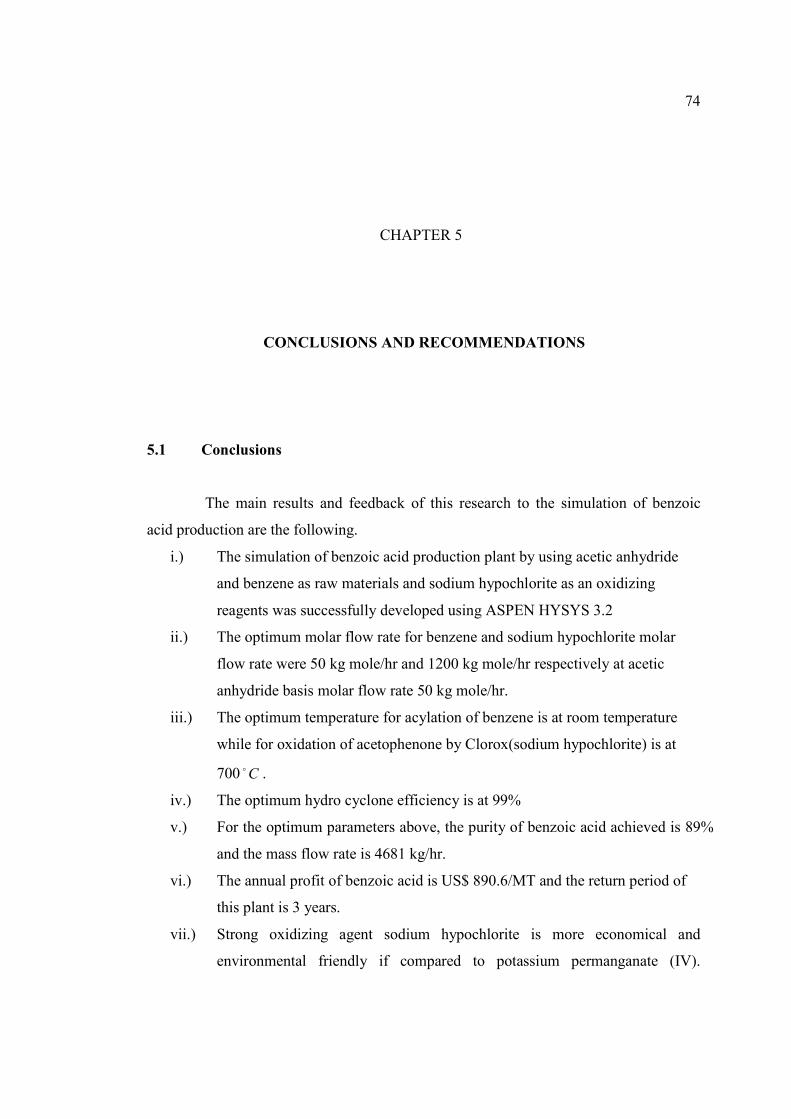
4.1.2 Results of optimization by variation of material molar flow rate
The optimized materials were acetic anhydride in order to obtain the highest purity and
yield for acetic acid and acetophenone. The basis for benzene was set to 50 kg mole/hr.
The variation range for acetic acid molar flow rate was between 10 kg mole/hr to 100 kg
mole/hr at room temperature. From table 4.2, the most suitable flow rate for acetic
anhydride was 50 kg mole/hr. For this acetic anhydride flow rate, the highest
composition and molar flow rate for both the acetic acid and acetophenone could be
obtained. The purity for acetic acid was 99.67% while purity for acetophenone is
99.99%. Besides, both of the molar flow rates of acetic acid and acetophenone were 50
kg mole/hr (50% yields). The results for different acetic anhydride flow rate were
showed in table 4.2:
Page 52
35
Table 4.2 Distillate and bottoms liquids molar flow and component mole fraction for
different acetic anhydride molar flow rate
Acetic
anhydride
molar flow rate
(kg mole/hr)
Distillate molar
flow rate
(kg mole/hr)
Distillate acetic
acid component
mole fraction
Bottom liquids
molar flow rate
(kg mole/hr)
Bottom liquids
component
mole fraction
10 50 0.2 10 0.9999
30 50 0.6 30 0.9999
50 50 0.9967 50 0.9999
70 71.3 0.7005 48.67 0.9999
90 92 0.5437 48.12 0.9999
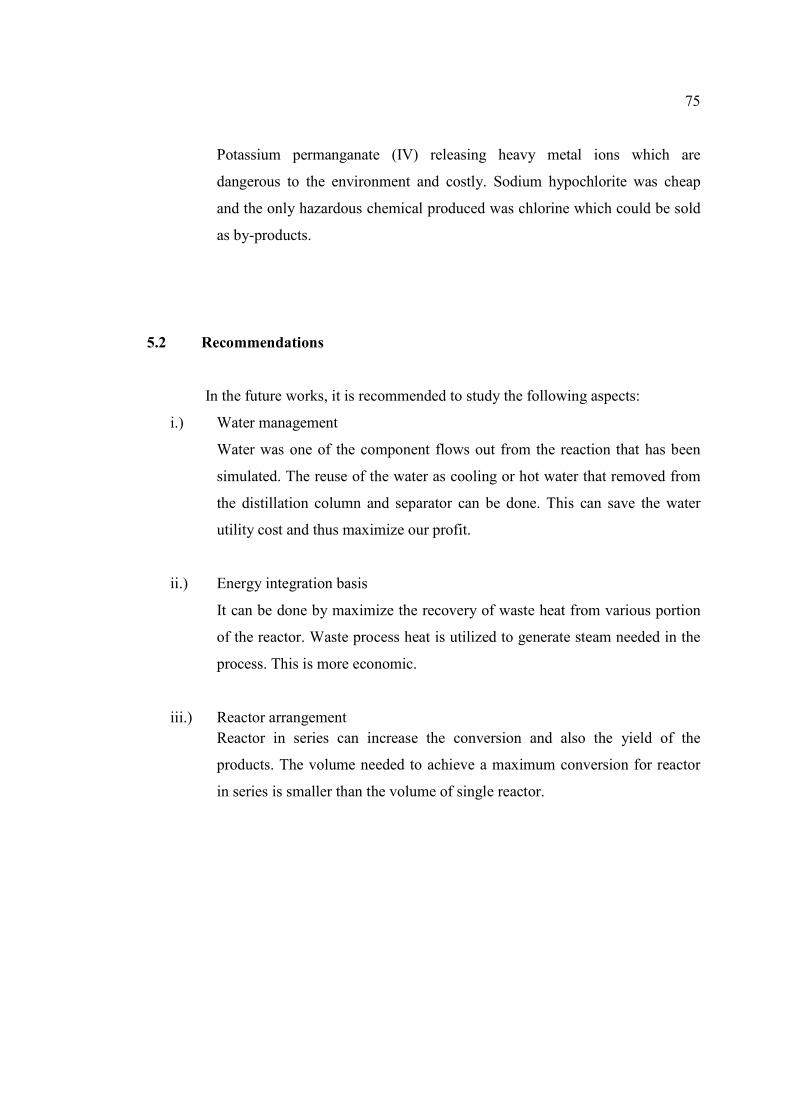
4.1.3. Distillation column specification
In order to get the high purity, the separation by using distillation column was needed.
From the stimulation, the number of stages required for this distillation column was
determined to be ten (10) and the feed stage location was plate number five (5) from the
top. This number of stages and feed stage location was chosen because it can satisfy all
the specifications made throughout the whole stimulation. A pump was need to add
before enter the distillation column. Seader and Henley (2006) did a survey on the feed
pressure must be greater than the column pressure to prevent the feed partially vaporize
before enter the distillation column. Two specifications were use in this distillation
column, percentage of acetophenone recovery and reflux ratio. In this case, the 99%
acetophenone recovery was specified in acetophenone stream and one for the reflux ratio.
The reflux ratio defined as the ratio of the amount of moles returned as
refluxed liquid to the fractionating column and the amount of moles of final product,
both per unit time. By adjusting the reflux ratio, the composition of the acetic acid in
distillate could be improved. Theoretically, the more reflux provided for a given number
Page 53
36
of theoretical stages, the better the column separation. Then, the reflux ratio was
increased to 10. The recovery of the components was much better compared to the
previous one. The diagrams below have showed the comparison of composition when
different reflux ratio. The composition of acetic acid was 0.9273 for reflux ratio 0.1 and
0.9999 for reflux ratio 10. This shows the differences of acetic acid composition by
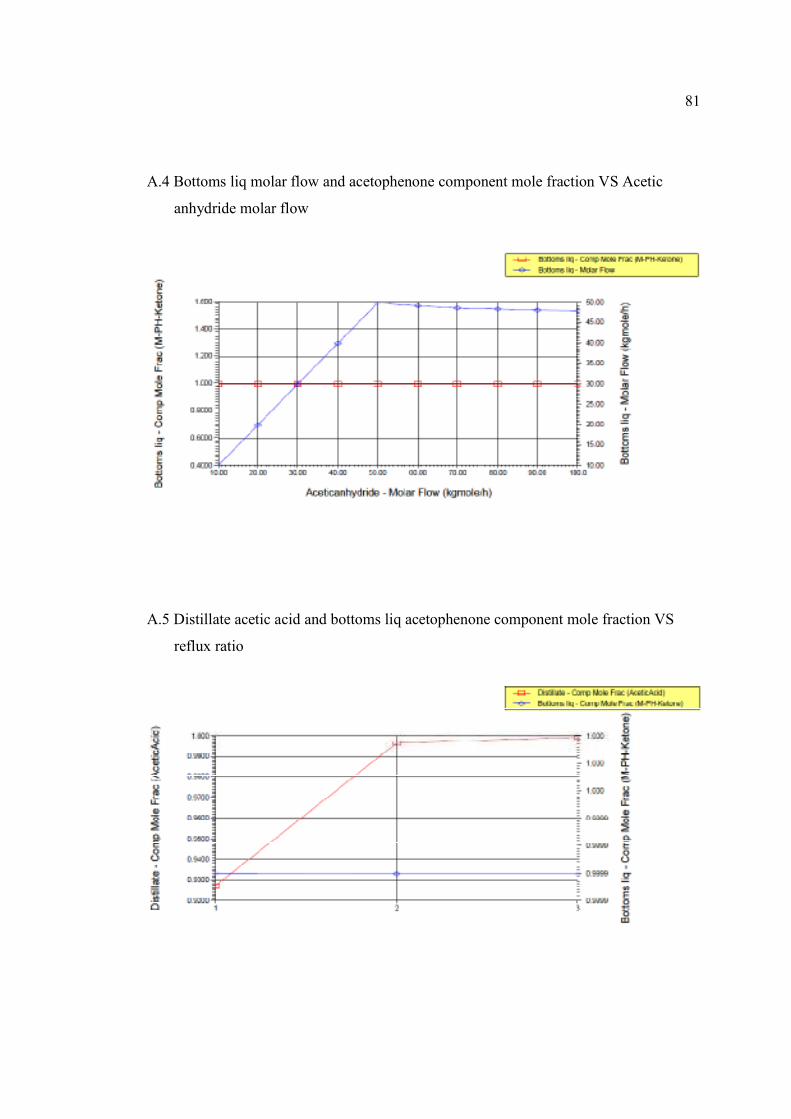
varying the reflux ratio. However, Seader and Henley (2006) discovered that the reboiler
steam and condenser cooling water requirements increased with the increasing of reflux
ratio. This had caused the power of both condenser and reboiler increase and resulted in
high utilities cost. There were not much different for acetic acid and acetophenone
composition between reflux ratios 1 and 10. Thus the reflux ratio one was chosen in
order to reduce the utilities cost. The results for different reflux ratio showed in table 4.3.
Table 4.3 Relationship between reflux ratio, composition and power
Reflux ratio Acetophenone
component mole
fraction
Acetic acid
component mole
fraction
Total power of
reboiler and
condenser (kW)
0.1 0.9999 0.9273 1912
1 0.9999 0.9967 2357
10 0.9999 0.9993 7628
Other than reflux ratio specification, the component mole fraction specification
was also found in the distillation column. There were two options here, one was specify
the distillate acetic acid composition as 0.99 or specify the bottom products
acetophenone composition as 0.99. There was some significance between the two
specifications. If specified the acetic acid composition in distillate is 0.99, the
components were all recovered in bottom liquids. It did not fit the purpose of building
the distillation column to separate the components. On the other hands, if specified the
acetophenone composition in bottom liquids as 0.999, the percentage recoveries of all
components were also found at least 99%. Besides it could separate the acetic acid and
acetophenone with each of them 50% yield. This could fulfill the purpose to build the
distillation column and the aim to obtain 99.99% purity of acetophenone and acetic acid.
Page 54
37
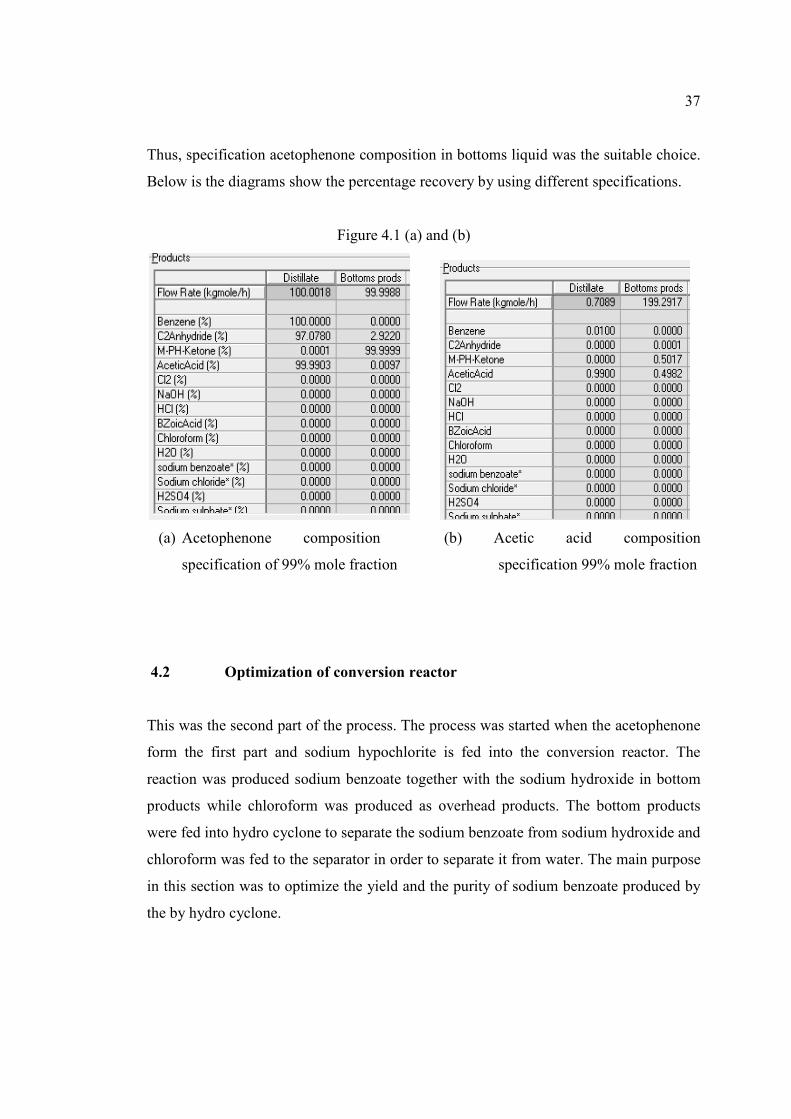
Thus, specification acetophenone composition in bottoms liquid was the suitable choice.
Below is the diagrams show the percentage recovery by using different specifications.
Figure 4.1 (a) and (b)
(a) Acetophenone composition (b) Acetic acid composition
specification of 99% mole fraction specification 99% mole fraction
4.2 Optimization of conversion reactor
This was the second part of the process. The process was started when the acetophenone
form the first part and sodium hypochlorite is fed into the conversion reactor. The
reaction was produced sodium benzoate together with the sodium hydroxide in bottom
products while chloroform was produced as overhead products. The bottom products
were fed into hydro cyclone to separate the sodium benzoate from sodium hydroxide and
chloroform was fed to the separator in order to separate it from water. The main purpose
in this section was to optimize the yield and the purity of sodium benzoate produced by
the by hydro cyclone.
Page 55
38
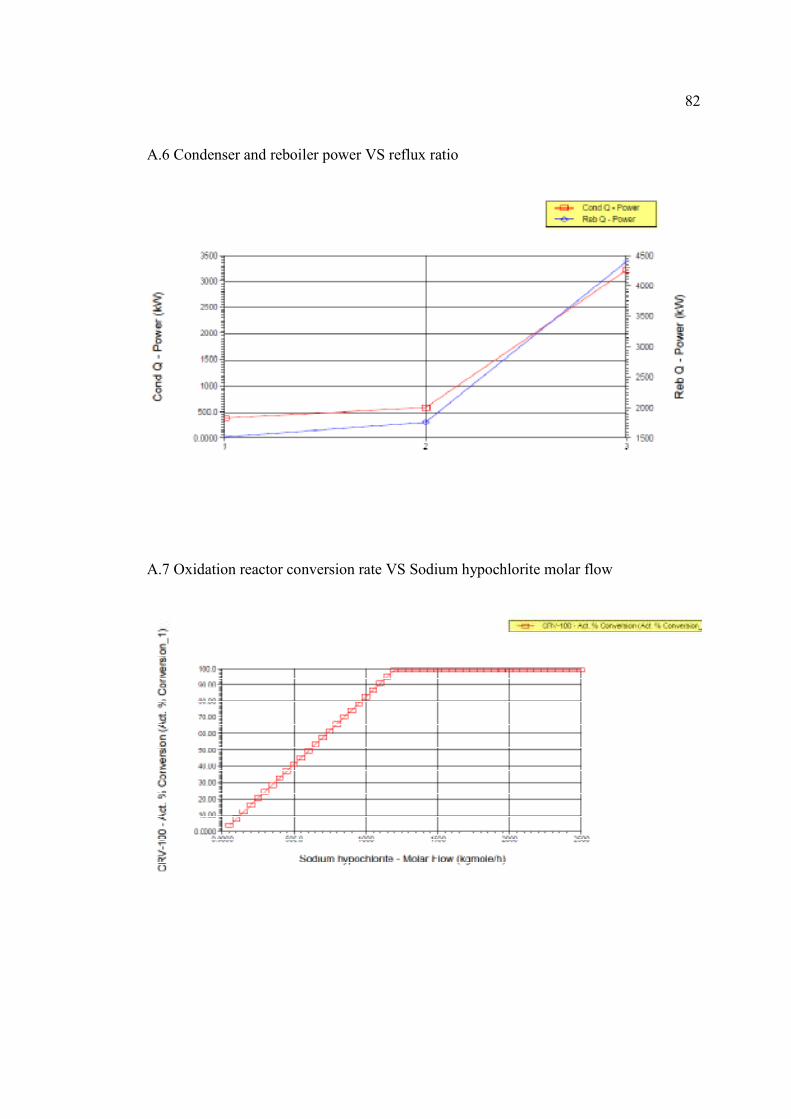
4.2.1 Results of optimization for variation of sodium hypochlorite molar flow rate
Initially the quantity of acetophenone produced from the first part of the process
contains 50 kg mole/hr. Thus, in order to achieve the maximum purity and yield for both
chloroform and sodium benzoate, the molar flow rate of sodium hypochlorite need to be
optimized. The range of sodium hypochlorite molar flow rate was set within 150 to 1500
kg mole/hr. From the figure 4.9, the conversion rate is proportional to the sodium
hypochlorite molar flow rate and then it achieved maximum conversion at 1200 kg
mole/hr. So the best molar flow rate was 1200 kg mole/hr. At this flow rate, the reactor
was operating at maximum conversion. Thus, maximum purity and yield of products
could be achieved. In a study of chemical reaction engineering (Fogler, 2008) the reason
for high molar flow rate of sodium hypochlorite need to use was because the
stoichiometric coefficient was directly proportional to the molar flow rate. When the
stoichiometric coefficients increased, the molar flow rate need to be used will increase
also. According to the chemical equation, the stoichiometric coefficient for sodium
hypochlorite was three if compared to acetophenone stoichiometric coefficient which
was one. This indicates that the quantity of sodium hypochlorite we need to use is more
than the acetophenone in order to achieve optimum conversion. For instance,
A + 3B → C + D
The initial molar flow rate was calculated by the following equations:
BAOBO FF Θ= =3FAO
CAOCO FF Θ= DAODO FF Θ=
where Θ = stoichiometric coefficient F= molar flow
From the above equations if the initial flow rate of A was 50 kg mole/hr, the initial flow
rate for B was 150 kg mole/hr. Below are the results of conversion rate and sodium
benzoate component mole fraction for different sodium hypochlorite molar flow rate.
Page 56
39
Table 4.4 Conversion rate and composition of chemical substance inside the oxidation
reactor
Sodium
hypochlorite molar
flow rate
(kg mole/hr)
Conversion
(%)
Sodium benzoate
component mole
fraction
Acetophenone
component mole
fraction
300 24.83 0.2187 0.0192
600 49.65 0.2196 0.0100
900 74.48 0.2203 0.0040
1200 99.00 0.2205 0.0001
1500 99.00 0.2049 0.0001
From the table above, the acetophenone component mole fraction decreased
while sodium benzoate component mole fraction increased with the increasing of
sodium hypochlorite molar flow rate. The acetophenone was fully utilized at 1200 kg
mole/hr, thus if the sodium hypochlorite molar flow rate was exceeded 1200 kg mole/hr,
it would dilute the mixture and eventually lower the sodium benzoate mole fraction.
4.2.2 Results of heat integration for conversion reactor
Initially the temperature of acetophenone was 377.6 Co while the temperature for sodium
hypochlorite was at room temperature. The mixture from this component is at 60 Co .
Now the conversion reactor feed temperature was settled within the range 50 Co to 1000
Co . After optimization, the optimum temperature is found to obtain maximum yield and
purity of sodium benzoate was at temperature 700 Co . Kurt and George (2007) found
that the reaction rate that involves sodium hypochlorite was increased by elevation of the
temperature. This was because the reaction rate increased with the reduced of
hypochlorite concentration and increased of pH. In this case the concentration of
Page 57
40
hypochlorite is 12.5% for industrial uses and there is also some chlorine was also present
in the solution. This would reduce the pH at the same time. Thus the temperature must
be increased in order to vaporize the chlorine and as a result the pH would be increased.
Below are the results of sodium benzoate, acetophenone and chlorine component mole
fraction at different temperature.
Table 4.5 Composition of various chemical substances in oxidation reactor at different
temperature
Temperature (C) Sodium benzoate
component mole
fraction
Acetophenone
component mole
fraction
Chlorine component
mole fraction
100 0.0318 0.0003 0.0767
300 0.0980 0.0006 0.0096
500 0.1924 0.0004 0.0029
700 0.2049 0.0001 0.0011
900 0.2071 0.0001 0.0006
Page 58
41
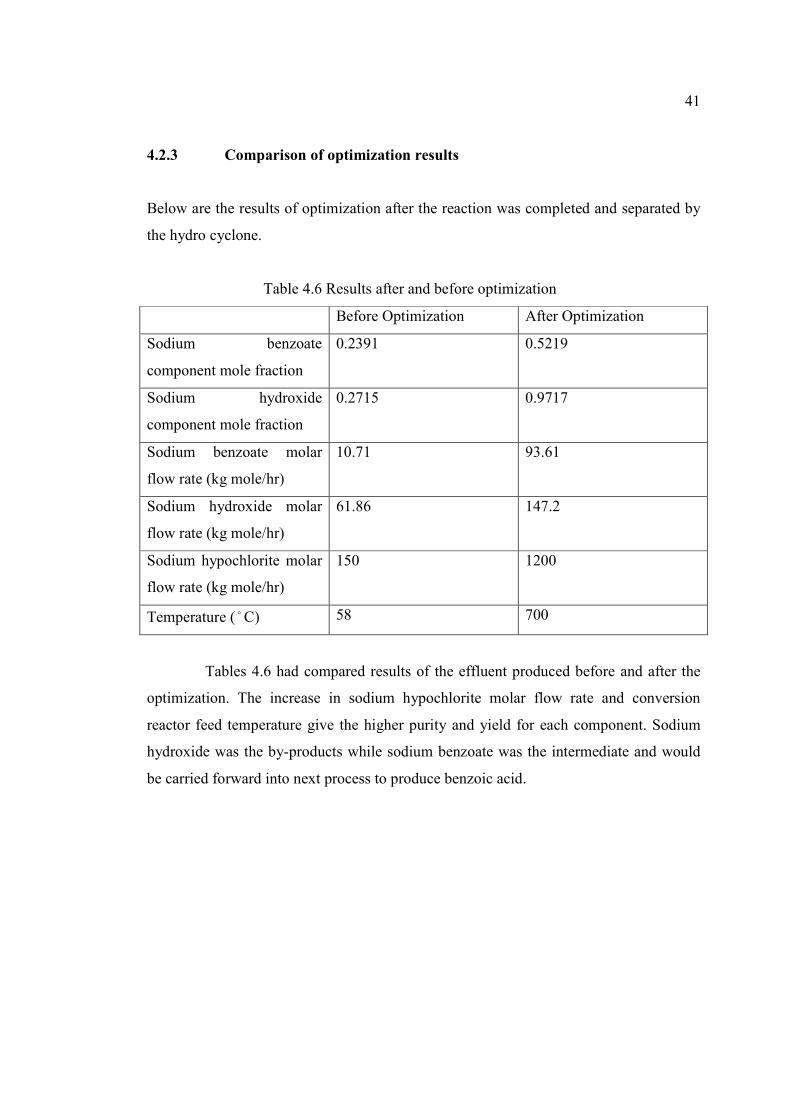
4.2.3 Comparison of optimization results
Below are the results of optimization after the reaction was completed and separated by
the hydro cyclone.
Table 4.6 Results after and before optimization
Before Optimization After Optimization
Sodium benzoate
component mole fraction
0.2391 0.5219
Sodium hydroxide
component mole fraction
0.2715 0.9717
Sodium benzoate molar
flow rate (kg mole/hr)
10.71 93.61
Sodium hydroxide molar
flow rate (kg mole/hr)
61.86 147.2
Sodium hypochlorite molar
flow rate (kg mole/hr)
150 1200
Temperature ( oC) 58 700
Tables 4.6 had compared results of the effluent produced before and after the
optimization. The increase in sodium hypochlorite molar flow rate and conversion
reactor feed temperature give the higher purity and yield for each component. Sodium
hydroxide was the by-products while sodium benzoate was the intermediate and would
be carried forward into next process to produce benzoic acid.
Page 59
42
4.3 Optimization of acidification reactor
Acidification of sodium benzoate is the final part of the process. This process involved a
conversion reactor and hydro cyclone. After the reaction take place in the reactor the
outcome will be fed into the hydro cyclone in order to separate benzoic acid from the
salts. In this section, the main purpose was to optimize the yield and purity of final
product benzoic acid by varying the sulphuric acid molar flow rate and the conversion
reactor feed temperature.
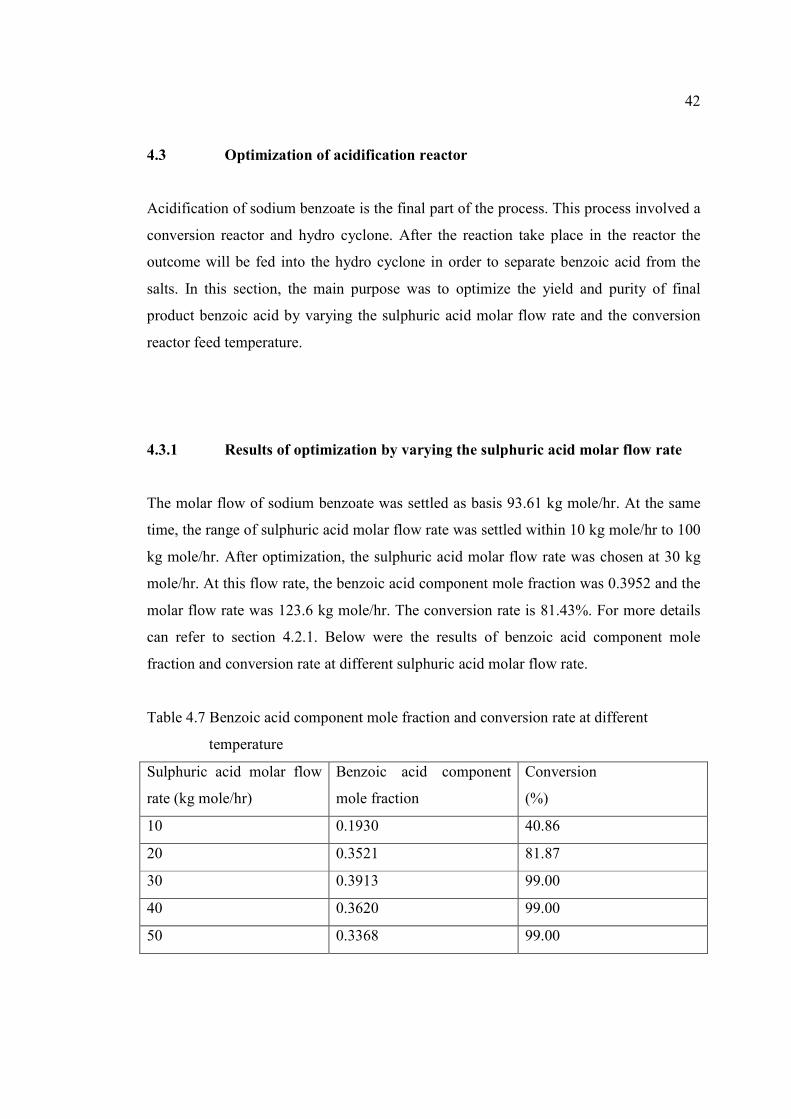
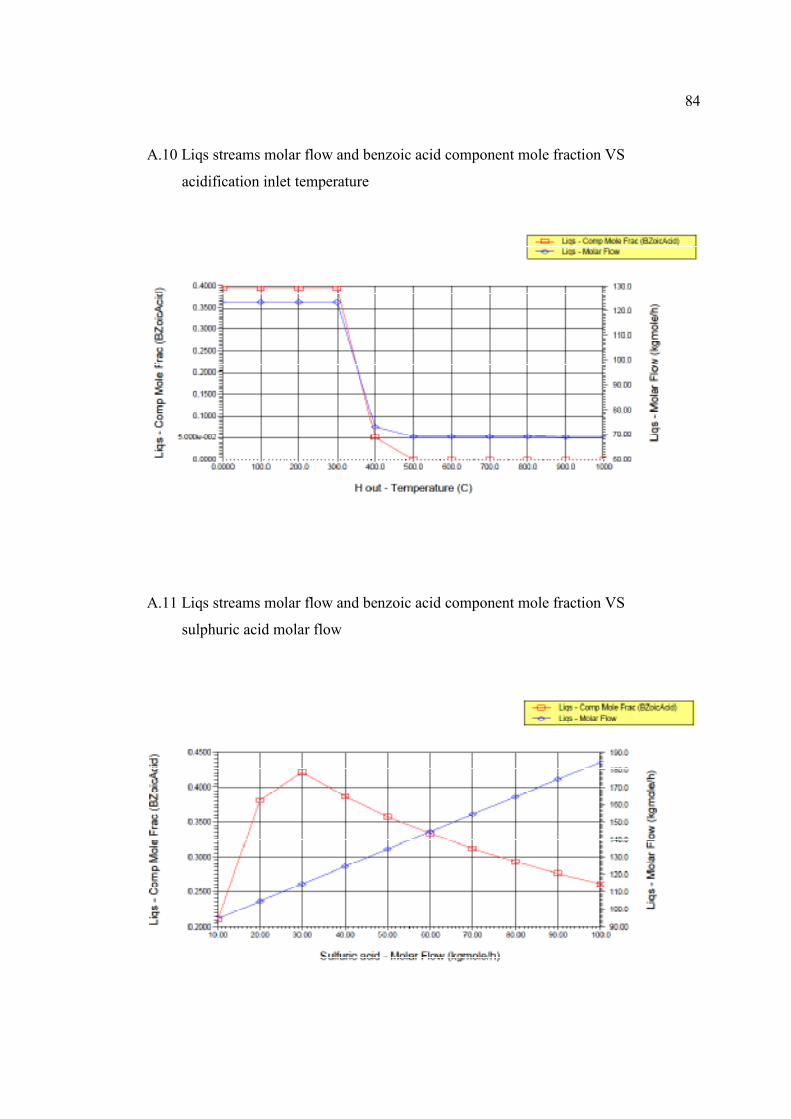
4.3.1 Results of optimization by varying the sulphuric acid molar flow rate
The molar flow of sodium benzoate was settled as basis 93.61 kg mole/hr. At the same
time, the range of sulphuric acid molar flow rate was settled within 10 kg mole/hr to 100
kg mole/hr. After optimization, the sulphuric acid molar flow rate was chosen at 30 kg
mole/hr. At this flow rate, the benzoic acid component mole fraction was 0.3952 and the
molar flow rate was 123.6 kg mole/hr. The conversion rate is 81.43%. For more details
can refer to section 4.2.1. Below were the results of benzoic acid component mole
fraction and conversion rate at different sulphuric acid molar flow rate.
Table 4.7 Benzoic acid component mole fraction and conversion rate at different
temperature
Sulphuric acid molar flow
rate (kg mole/hr)
Benzoic acid component
mole fraction
Conversion
(%)
10 0.1930 40.86
20 0.3521 81.87
30 0.3913 99.00
40 0.3620 99.00
50 0.3368 99.00
Page 60
43
Table 4.7 shows that the conversion rate is increased linearly with the sulphuric
acid molar flow rate. The benzoic acid component mole fraction and conversion rate is
the highest at 30 kg mole/hr sulphuric acid molar flow rate.
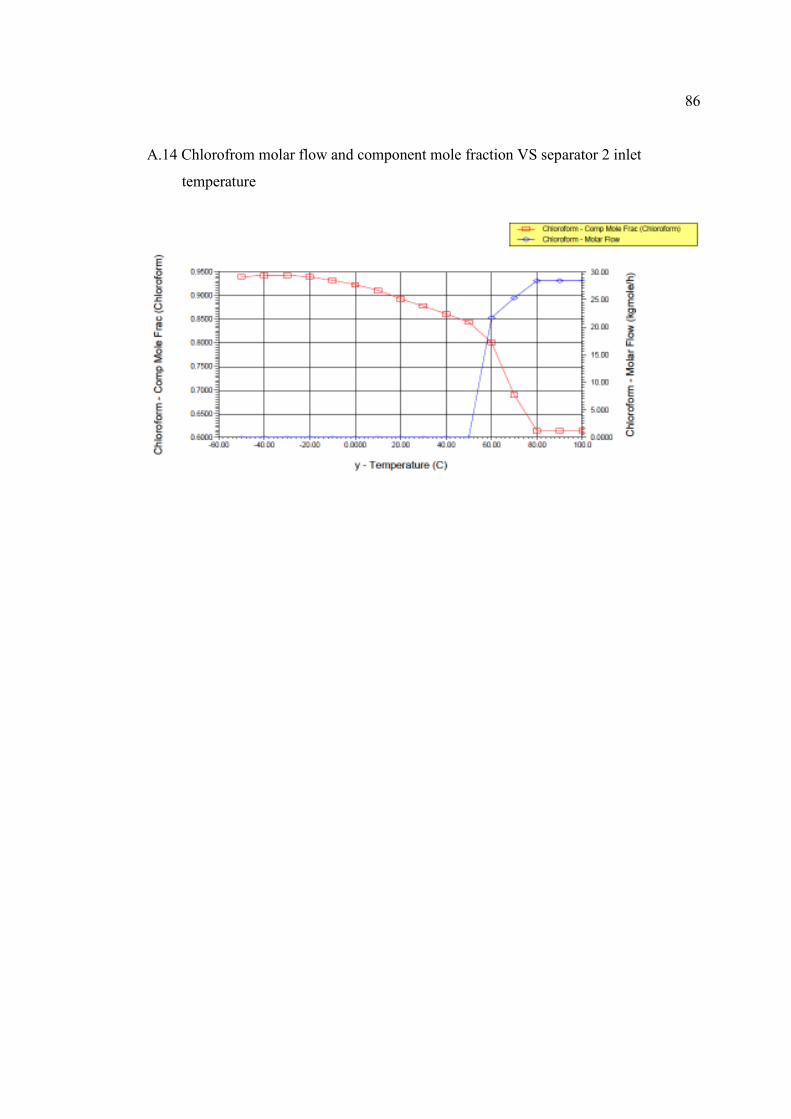
4.3.2 Results of heat integration for acidification reactor
The range of optimization for conversion feed temperature was settled within 0 Co to
1000 Co . After optimization, the purity and yield of benzoic acid were remained the
same between 0 Co and 300 Co . For temperature above 300 Co , the component mole
fraction and molar flow of benzoic acid decreased linearly with the temperature. This
was because the boiling point of benzoic acid was at about 300 Co . If the reactor
temperature was exceeded 300 Co , this could lower the component mole fraction and
molar flow of benzoic acid since some of the benzoic acid may be vaporized at this
temperature. Thus we have to control the reactor feed temperature to ensure that the
reactor outlet temperature not exceeded 300 Co . In this case, the optimum temperature
chosen was at 200 Co .
Table 4.8 Benzoic acid component mole fraction and molar flow at different temperature
Temperature (C) Benzoic acid component
mole fraction
Molar flow
(kg mole/hr)
100 0.3952 123.6
200 0.3952 123.6
300 0.3952 123.6
400 0.0510 73.11
500 0.0007 69.23
Page 61
44
From table 4.8, the benzoic acid component mole fraction and molar flow
decreased when the temperature was above 300 Co .
4.3.3 Comparison of optimization results
Below were the results of optimization after the reaction was completed and separated
by the hydro cyclone.
Table 4.9 Results before and after optimization
Before optimization After optimization
Benzoic acid component mole
fraction
0.4955 0.8785
Benzoic acid molar flow
(kgmole/hr)
27.76 39.29
Sulphuric acid molar flow
(kgmole/hr)
100 30
Temperature ( )Co 353 200
Table 4.9 shows the effluent results before and after the optimization. In this case,
the reactor must operate at temperature below 300 Co and the suitable molar flow rate
was 30 kg mole/hr of sulphuric acid in order to achieve high purity of benzoic acid.
4.3.3 Hydro cyclone efficiency
Other than varying the material molar flow and feed temperature for each reactor, the
optimization of benzoic acid could also be done by varying the hydro cyclone efficiency.
Page 62
45
The table below shows the results of purity and molar flow of benzoic acid for different
efficiency.
Table 4.10 Benzoic acid purity at different hydro cyclone efficiency
Hydro cyclone efficiency
(%)
Benzoic acid purity (%)
33 62.21
66 72.73
99 87.75
From table 4.10, higher efficiency of hydro cyclone would result in high
purity but low molar flow of benzoic acid. Martin Rhodes (2008) found that high
efficiency of hydro cyclone was characterized by small inlet and fluid outlet orifices.
This would give high recoveries but at the same time would offer high resistance to the
flow. On the other hands, low efficiency hydro cyclone had large inlet and fluid outlet
orifices. This would results low recoveries and low resistance to the flow. Thus, high
efficiency hydro cyclone gave higher purity but lower molar flow rate and low
efficiency gave lower purity but high molar flow rate.
4.4 Optimization of chloroform and chlorine gas production
The chloroform and chlorine gas produced were by-products from this plant. The residue
from the oxidation reactor was separated out and fed into a separator to remove the large
amount of water. The inlet temperature must be maintained at 140 Co or above because
if the temperature was below 140 Co the chlorine and chloroform will be washed out
together with the water. After the water had washed out from the reactor, the remaining
products would be fed into the distillation column to separate out the chlorine gas.
Page 63
46
4.4.1 Optimization of chlorine by using distillation column specifications
The function of distillation column was to separate the chemical mixture based on their
physical and chemical properties in order to get a better purity. The number of stages
required for this distillation column was ten (10) and the feed stage location was plate
number five (5) from the top. This number of stages and feed stage location was chose
due to it could satisfy all the specifications made throughout the whole stimulation. The
main purpose here was to separate the corrosive chlorine from the mixture. Two
specifications were used in this distillate column, overhead products flow rate and reflux
ratio.
For overhead products flow rate and reflux ratio specifications, specify it
overhead product flow rate as 9 kg mole/hr and reflux ratio as six. At these
specifications, the chlorine component mole fraction wass 0.9999 in vapour form while
the chloroform component mole fraction was 0.6146 in liquid form. Although the
overhead product molar flow was only 9 kg mole/hr out of 37.41 kg mole/hr, but it was
already meet our requirement to separate the chlorine from the bottom liquids product.
On the other hands, the minimum reflux ration in this distillation column in
order to separate the chlorine from the mixture is 6. As mentioned in section 4.1.3 before,
the electricity is increased with increasing of reflux ratio. In this case, there is no
different in chlorine and chloroform composition in overhead or bottom liquid products.
Hence, use minimum reflux ratio in order to save the electricity cost. Below are the
results of chlorine and chloroform composition in bottom liquid streams before and after
separation by distillation column at the specifications state above.
Page 64
47
Table 4.11 Chlorine and chloroform component mole fraction before and after enter the
distillation column
Before separation After separation
Chlorine component mole
fraction
0.5233 0.0002
Chloroform component mole
fraction
0.3036 0.6146
Overhead products flow rate: 9 kg mole/hr Reflux ratio: 6
4.4.2 Optimization of chloroform by varying the separator inlet temperature
The bottom liquids product separated from the previous distillation column are now
undergoes another separation by separator to obtain better purity of chloroform products.
The optimization could be done by varying the inlet temperature of separator in order to
get high purity of chloroform. The range of temperature would set between 0 Co and
100 C. From the table 4.12, the minimum temperature for the separation is at 60 C
otherwise the chloroform will be washed out again together with the water. This was
because the boiling point of the chloroform was at 60 C. If the temperature was below
the boiling point all the chloroform would be in liquid form and if the temperature was
beyond the boiling point the chloroform will be separated in vapour form and then
undergoes liquefaction later to obtain the chloroform liquid. Besides, the chloroform
component mole fraction was decreased with increasing temperature. Thus, the most
suitable flow rate to obtain a better purity was at 60 C. Below are the results of
chloroform component mole fraction and molar flow at different temperature.
Page 65
48
Table 4.12 Chloroform component mole fraction and molar flow at different temperature
Temperature ( Co ) Chloroform component
mole fraction
Chloroform molar flow rate
(kg mole/hr)
-30 0.9439 0.00
0 0.9240 0.00
30 0.8780 0.00
60 0.8012 21.79
90 0.6146 28.41
4.5 Cost estimation
4.5.1 Total cost investment
a.) Equipment Cost (Seider et al, 2004)
1.) Distillation column (two distillation columns in the process)
Maximum allowable stress = S = 15000 psig (395.8 Fo ) Weld efficiency = E =1
Number of trays = n =10 density = 229.0in
lb=ρ
Operating pressure = 275.4 psig Internal diameter = Di= 4.921 ft
Design pressure = dP = ( ){ }200 ln0015655.0ln91615.060608.0exp PP ++ (4.1)
( ){ }24.275ln0015655.0)4.275(ln91615.060608.0exp ++=
= 331 psig
Height of the column = Head + (n-1)*tray spacing + bottoms (4.2)
= 4ft + (10-1)(1.804ft) + 10ft
= 30.236ft
Calculate the wall thickness,
Page 66
49
inpsigpsig
ftinftpsig
PSE
DPt
d
id
p 6600.0)331(2.1)1)(15000(2
)1
12921.4)(331(
2.12=
−
×=
−= (4.3)
Since the minimum wall thickness for D i = 4.921 ft is 0.3125in, so we specify t p =
0.66in
Outer diameter = oD = (0.66 in x 2) + (4.921 ft x 12 in/ 1ft) = 60.372 in
Consider wind load and earthquake for distillation column,
inin
inlb
ftinftin
SD
LDt
O
O
w 0095.0)372.60)(15000(
})1
12236.30(18372.60{22.0)18(22.0
22
22
=×+
=+
= (4.4)
Required thickness to withstand internal pressure and wind load;
ininintR 6695.00095.066.0 =+=
Average thickness = inininin
ACtt
t PRV 7898.0125.0
2
66.06695.0..
2=+
+=+
+= (4.5)
For increment of 1/8 in, specify t ins 875.0=
Calculate the weight of shell and the two heads;
ρπ sisi tDLtDW )8.0)(( ++= (4.6)
= [ ][ ][ ]229.0875.0}052.59{8.0832.362)(875.0052.59(in
lbininininin ++π
= 19590 lb
Vertical tower for 9000 < W < 2500000 lb
{ }2)(ln02297.0)(ln18255.02756.7exp WWCV ++= (4.7)
= { }2)19590(ln02297.0)19590(ln18255.02756.7exp ++
= $ 82675
Vertical tower for 3 < Di< 21ft and 12 < L < 40ft
12688$)236.30()921.4(9.3009.300 80161.063316.080161.063316.0 === ftftLDC iPL (4.8)
Purchase cost: 649286$12688$)82675)($7.7( =+=+= PLVMP CCFC (4.9)
For installed cost of sieve trays,
757.1)921.4(0724.0401.10724.0401.1 =+=+= ftDF iTM (4.10)
[ ] 1101$)921.4(1739.0exp468)1739.0exp(468 === ftDC iBT (4.11)
Page 67
50
Given 1=NTF for N T < 20, F TT = 1 (assume sieve tray)
19345$)1101)($757.1)(1)(1)(10( === BTTMTTNTTT CFFFNC
(4.12)
Total purchase cost at CE index of 550 for 2 distillation columns
( ) ( ) ( ) ( ) 1470988$19345$649286$500
5502
500
5502 =+
=+
= TPTP CCC (4.13)
F 16.4=BM for vertical pressure vessel,
Bare module cost: 6119310$)1470988)($16.4()( === TPBMBM CFC (4.14)
2.) Condenser (two condensers in the process)
Given that Ai= 72.18 ft 2
*The materials of construction shell and tube is carbon steel and stainless steel
58.10100
18.726.9
100
06.0
=
+=
+=b
M
AaF (4.15)
Assume 1== LP FF
Assume floating head:
{ }2)(ln09005.0)(ln8709.0667.11exp AACB +−= (4.16)
= exp { }2)18.72(ln09005.0)18.72(ln8709.0667.11 +−
= $ 14606
At cost index 550, the purchase cost for 2 distillation columns is:
( ) ( ) 339970$)14606)($1)(58.10)(1(500
5502
500
5502 =
=
= BLMPP CFFFC (4.17)
Bare module cost: 1077705$)339970)($17.3( === PBMBM CFC
3.) Reboiler (three reboilers in the process)
Given that A i = 72.18 ft2
* The materials of construction shell and tube are tiatanium
Page 68
51
Assume kettle vaporizer,
{ }2)(ln09005.0ln8709.0967.11exp AACB +−= (4.18)
= exp { }2)18.72(ln09005.0)18.72(ln8709.0967.11 −−
= $ 19716
Assume 1== LP FF
58.10100
18.726.9
100
06.0
=
+=
+=b
M
AaF
At cost index of 550, the purchase cost for 2 reboilers are
( ) ( ) 458910$)19716)($1)(58.10)(1(500
5502
500
5502 =
=
= BLMPP CFFFC
Bare module cost: 1454745$)458910)($17.3( === PBMBM CFC
4.) Vertical pressure vessel (acidification reactor and oxidation reactor)
Given that the volume of vessel = V =1413 ft 3
Internal diameter = D i =10.62 ft Length = L = 16 ft
Operating pressure = 275.4 psig Maximum allowable stress = S =15000psig
Design pressure =Pd= ( ){ }200 ln0015655.0ln91615.060608.0exp PP ++
= ( ){ }24.275ln0015655.04.275ln91615.060608.0exp ++
= 331 psig
Calculate wall thickness,
inpsigpsig
ftinftpsig
PSE
DPt
d
id
p 186.1)331(2.1)1)(15000(2
)1
1262.10)(4.275(
2.12=
−
×=
−=
The minimum wall thickness for Di= 8.432ft is t
p= 0.4375 in, so we specify
int p 186.1=
Outer diameter = oD = (1.186 in x 2) + (10.62 ft x 12 in/ 1ft) = 130 in
Consider wind load and earthquake for distillation column,
Page 69
52
inin
inlb
ftinftin
SD
LDt
O
Ow 0006..0
)130)(15000(
})1
1216(18130{22.0)18(22.0
22
22
=×+
=+
=
Required thickness to withstand internal pressure and wind load;
Average thickness = inininin
ACtt
t PRV 3113.1125.0
2
1860.11866.1..
2=+
+=+
+=
For increment of 1/8 in, specify t ins 375.1=
Calculate the weight of shell and the two heads;
ρπ sisi tDLtDW )8.0)(( ++=
= [ ][ ][ ]229.0375.1}44.127{8.0192)(375.144.127(in
lbininininn ++π
= 47434 lb
Vertical vessels for 4200 < W < 1000000 lb
{ }2)(ln02297.0)(ln18255.00132.7exp WWCV ++= (4.19)
= { }2)47434(ln02297.0)47434(ln18255.02756.7exp ++
= $ 147865
Vertical vessels for 3 < Di< 21ft and 12 < L < 40ft
14740$)16()62.10(8.3618.361 70684.073960.070684.073960.0. === ftftLDC iPL (4.20)
*The materials of construction is titanium, 7.7=MF
Purchase cost: 1153300$14740$)147865)($7.7( =+=+= PLVMP CCFC
At cost index of 550, the purchase cost for 3 vertical pressure vessels are
( ) ( ) ( ) 3805890$1153300$500
5503
500
5503 =
=
= PTP CC
Bare module cost: 15832502$)3805890)($16.4( === PBMBM CFC
ininintR 1866.10006.01860.1 =+=
Page 70
53
5.) Separator (vertical pressure vessel)
Given that the volume of vessel = V =706.3ft 3
Internal diameter = D i =8.432ft Length = L = 12.65ft
Design pressure =Pd=10psig Maximum allowable stress = S =15000psig
Calculate wall thickness,
inpsigpsig
ftinftpsig
PSE
DPt
d
idp 0337.0
)10(2.1)1)(15000(2
)1
12432.8)(10(
2.12=
−
×=
−=
The minimum wall thickness for D i = 8.432ft is t p = 0.4375 in
Outer diameter = oD = (0.4375 in x 2) + (8.432 ft x 12 in/ 1ft) = 102 in
Consider wind load and earthquake for distillation column,
inin
inlb
ftinftin
SD
LDt
O
O
w 004.0)102)(15000(
)1
1265.12)(18102(22.0)18(22.0
22
22
=×+
=+
=
Required thickness to withstand internal pressure and wind load;
ininintR 4415.0004.04375.0 =+=
Average thickness = inininin
ACtt
t PRV 5645.0125.0
2
4375.04415.0..
2=+
+=+
+=
For increment of 1/8 in, specify t ins 625.0=
Calculate the weight of shell and the two heads;
ρπ sisi tDLtDW )8.0)(( ++=
= [ ][ ][ ]2163.0625.0}184.101{8.08.151)(5.0184.101(in
lbininininin ++π
= 7584 lb
Vertical vessels for 4200 < W < 1000000 lb
{ }2)(ln02297.0)(ln18255.00132.7exp WWCV ++= (4.21)
= { }2)7584(ln02297.0)7584(ln18255.02756.7exp ++
= $ 35503
Vertical vessels for 3 < D i < 21ft and 12 < L < 40ft
10527$)65.12()432.8(8.3618.361 70684.073960.070684.073960.0. === ftftLDC iPL (4.22)
Page 71
54
*The materials of construction is titanium, 7.7=MF
Purchase cost: 283900$10527$)35503)($7.7( =+=+= PLVMP CCFC
6.) Horizontal pressure vessel (Packed bed reactor)
Given that the volume of vessel = V = 4237 ft 3
Internal diameter = Di= 23.4ft Length = L = 9.8ft
Design pressure =P d =10psig Maximum allowable stress = S =15000psig
Calculate wall thickness,
inpsigpsig
ftinftpsig
PSE
DPt
d
id
p 0480.0)10(2.1)1)(15000(2
)1
1212)(10(
2.12=
−
×=
−=
The minimum wall thickness for Di= 12 ft is t p = 0.5 in
Since this is horizontal vessel and it is not subject to wind load and earthquake.
Required thickness to withstand internal pressure,
inininACtt pV 625.0125.05.0.. =+=+=
For increments of 1/8 in, specify st =0.625 in
Calculate the weight of shell and the two heads;
ρπ sisi tDLtDW )8.0)(( ++=
= [ ][ ][ ]229.0625.0}144{8.08.472)(625.0144(in
lbininininin ++π
= 48423 lb
Horizontal vessels for 1000 < W < 920000 lb
{ }2)(ln04333.0)(ln2330.09552.8exp WWCV +−=
= { }2)48423(ln02297.0)48423(ln18255.09552.8exp ++
= $ 804227
Horizontal vessels for 3 < D i < 12ft
3320$)12(20052005 20294.020294.0. === ftDC iPL (4.22)
*The materials of construction is titanium, 7.7=MF
Purchase cost: 6195868$3320$)804227)($7.7( =+=+= PLVMP CCFC
Page 72
55
At cost index of 550, the purchase cost is:
( ) 6815455$6195868$500
550
500
550=
=
= PTP CC
Bare module cost: 20787138$)6815455)($05.3( === PBMBM CFC
7.) Hydro cyclone (2 hydro cyclones in the process)
Given Q = 14.34 hm /3 or 63.14 gal/min
1907$)14.63(240240 50.050.0 === QCP (4.23)
At cost index of 550, the total purchase cost for 2 hydro cyclones is:
( ) 4195$)2(1907$500
550
500
550=
=
= PTP CC
Bare module cost: 5831$)4195)($39.1( === TPBMBM CFC
8.) Shell and tube heat exchanger (four heat exchangers in the process)
Given that total heat transfer area = A = 649.3 ft length of tube = L =20 ft
Shell side pressure = P =100psig
Assume the heat exchanger is fixed head:
{ }2)(ln09861.0)(ln9228.00545.11exp AACB +−= (4.24)
= { }2)3.649(ln09861.0)3.649(ln9228.00545.11exp +−
= $ 10036
*The materials for construction of shell/tube is titanium/titanium
72.10100
3.6496.9
100
06.0
=
+=
+=b
M
AaF
1=LF for 20 ft tube length ;
2
100100018.09803.0
+
+=PP
FP (4.25)
=
2
100
100
100
100018.09803.0
+
+
Page 73
56
= 1.9983
The total purchase cost at CE index 550 for 4 shell and tube heat exchanger
( ) ( ) 945951$)10036)($1)(72.10)(9983.1(500
5504
500
5504 =
=
= BLMPP CFFFC
Bare module cost: 2998665$)945951)($17.3( === PBMBM CFC
9.) Mixer (three mixers in the process)
All mixer volume was specified at V = 270 3ft
35699$)270(34003400 42.042.0 === VCP (4.26)
At cost index of 550, the total purchase cost for 3 mixers is
( ) 117807$35699$500
550)3(
500
550)3( =
=
= PTP CC
10.) Storage tank (11 storage tank in the process)
Given the volume = V = 5283 gal
8625$)5283(1818 72.072.0 === VCP (4.27)
At cost index of 550, the total purchase cost is
( ) 9488$8625$500
550
500
550=
=
= PTP CC
11.) Centrifugal pump and electric motor
Given that the flow rate = 38.2 gal/min and pump head = 596 ft
Pump:
( )( ) 9335962.385.05.0 === ftGPMQHS (4.28)
[ ] [ ]{ }2ln0519.0ln6019.07171.9exp SSCB −−= (4.29)
= [ ] [ ]{ }2933ln0519.0933ln6019.07171.9exp +−
= $ 3066
Page 74
57
5.2=TF 7.9=MF (titanium)
( )( )( ) 74351$3066$7.95.2 === BMTP CFFC (4.30)
Electric motor:
Given that the flow rate = 38.2 gpm and pump horsepower = 8.741 Hp
( ) ( )2ln01199.0ln24015.0316.0 QQP −+−=η (4.31)
= ( ) ( )22.38ln01199.02.38ln24015.0316.0 −+−
= 0.4
( ) ( )2ln00182.0ln0319.080.0 BBM PP −+=η (4.32)
= ( ) ( )2741.8ln00182.0741.8ln0319.080.0 −+
= 0.86
HpHpP
PM
BC 16.10
86.0
741.8===
η (4.33)
[ ] [ ] [ ] [ ]{ }432ln0035549.0ln028628.0ln053255.0ln13141.08259.5exp CCCCB PPPPC −+++=
[ ] [ ] [ ] [ ]{ }43216.10ln0035549.016.10ln028628.016.10ln053255.016.10ln13141.08259.5exp −+++=BC
= $ 789
1973$)789)($5.2( === BTP CFC
At cost index of 550, the total purchase cost is
( ) 83956$1973$74351$500
550=+
=TPC
Bare module cost: 277055$)83956)($30.3( === TPBMBM CFC
The bare module cost of equipment includes the direct cost and indirect cost of the
equipment. The direct-cost items that are incurred in the construction of a plant, in
addition to the cost of equipment are:
1. Equipment erection, including foundations and minor structural work.
2. Piping, including insulation and painting.
Page 75
58
3. Electrical, power and lighting.
4. Instruments, local and control room.
5. Process buildings and structures.
6. Ancillary buildings, offices, laboratory buildings, workshops.
7. Storages, raw materials and finished product.
8. Utilities (Services), provision of plant for steam, water, air, firefighting services (if
not cost separately).
9. Site preparation.
The indirect costs are considered as indirect expenses which are estimated by
the equipment bare module cost. Different equipment has different bare module factor.
The indirect cost included design and engineering cost, contractor fees, contingency
allowance and cost of freight to deliver the equipment.
Table 4.13 bare module cost of equipment
Equipment Quantity Purchase cost ($)
Packed bed reactor (Horizontal pressure vessel) 1 20787138
Oxidation reactor (Vertical pressure vessel) 1 5277501
Acidification reactor (Vertical pressure vessel) 1 5277501
Distillation column (Vertical tower) 2 6119310
Separator 1 (Vertical pressure vessel) 1 5277501
Separator 2 (Vertical pressure vessel) 1 283900
Shell and tube heat exchanger 4 2998665
Condenser 2 1077705
Reboiler 2 1454745
Hydro cyclone 2 5831
Mixer 3 117807
Storage tank 11 104368
Centrifuges pump and electric motor 1 277055
Total 27 48089027
Page 76
59
From table 4.13, we estimate that the total bare module cost (C TBM) is $ 48089027 or
US$ 48 million.
According to Seider et al (2010), to calculate the total capital investment cost, we still
need to estimate the site developments cost, building cost and offsite facilities cost.
b.) Site development cost
For grass-roots plant, we assume 20% of total bare module cost
millionUSmillionUSCC TBMsite 6.9$48$2.02.0 =×=×=
c.) Building cost
For grass-roots plant and non process building, we assume 20% of total bare module
cost
millionUSmillionUSCC TBMbuilding 6.9$48$2.02.0 =×=×=
d.) Offsite facilities cost
We assume 5% of the total bare module cost
millionUSmillionUSC ilitiesoffsitefac 4.2$48$05.0 =×=
e.) Contingency and contractor fees
The contingency and contractor fees are unanticipated costs incurred during the
construction of plant. According to Guthrie(1969), the contingency and contractor fees
are 18% of the summation of total bare module cost, civil cost and building cost.
( )ilitiesoffsitefacbuildingcivilTBMcon CCCCC +++×= 18.0 (4.34)
= ( )4.2$6.9$6.9$48$18.0 USmillionUSmillionUSmillionUS +++×
= US$ 12.5 million
Page 77
60
f.) Land prices
Land required = 10 acres = 435600 ft2
millionUSftft
US74.1$435600
4$ 2
2=×
According to Guthrie (1969), the total permanent investment is calculated by using the
equation below:
ContractorLandilitiesoffsitefacBuildingCivilTBMTPI CCCCCCC +++++= (4.35)
= US$(48million + 9.6million + 9.6million + 2.4million + 1.74million +
12.5million)
= US$ 83.84million
g.) Working capital
We assume the working capital as 17.6% in order to cover the initial catalyst charges.
millionUSmillionUSCC TPITCI 76.14$84.83$176.0176.0 =×=×=
The total capital investment is calculated by the Guthrie method
millionUSmillionUSmillionUSCCC WCTPITCI 6.98$76.14$84.83$ =+=+=
Page 78
61
Summary of total capital investment
Table 4.13 Total capital investment cost
Cost factor Cost (US $ million)
Equipment and material
i.) ISBL
ii.) OSBL
43.2
4.8
Civil 9.6
Building 9.6
Engineering and construction 2.4
Freight and other expenses -
Commissioning and start up -
Sub total 69.6
Contingency and contractor fees 12.4
Sub total 82 (total depreciable capital TDCC )
Land (5 Acres) 1.74
Sub total 83.84 (total permanent investment TPIC )
Working capital 14.76
Grand total 98.60 (total capital investment TCIC )
4.5.2 Variable manufacturing cost
a.) Raw materials cost
Raw materials: benzene, acetic anhydride, sodium hypochlorite and sulfuric acid
1.) Benzene (ICIS, 2011)
Page 79
62
Given that mass flow rate = 3905 kg/hr
MT
US
MT
yr
yr
day
day
hr
hr
kg
kgCbenzene
970$
37000
330
1
24390516.1$=××××=
2.) Acetic anhydride (ICIS, 2011)
Given that the mass flow rate = 5104 kg/hr
MT
US
MT
yr
yr
day
day
hr
hrkgC drideAceticanhy
1256$
37000
33024510415.1$=××××=
3.) Sodium hypochlorite (ICIS, 2011)
Given that the volume flow rate = 8458 gal/hr
MT
US
MT
yr
yr
day
day
hr
hr
gal
galCNaOCl
1177$
37000
33024845865.0$=××××=
4.) Sulfuric acid (ICIS, 2011)
Given that the mass flow rate = 4904 kg/hr
MT
US
MT
yr
yr
day
day
hr
hr
kg
kgC SOH
69$
37000
33024294211.0$42 =××××=
Total raw materials cost = 42SOHNaOCldrideaceticanhybenzene CCCC +++
= US$ (970 + 1256 + 1177 + 69)/MT
= US$ 3472/MT
b.) By products credit
1.) Acetic acid: (ICIS, 2011)
Given that the mass flow rate = 3020 kg/h
MT
US
MT
yr
yr
days
day
h
h
kg
kg
407$
37000
33024302063.0$=××××
2.) Sodium hydroxide: (ICIS, 2011)
Given that the mass flow rate = 5420 kg/h
Page 80
63
MT
US
MT
yr
yr
days
day
h
h
kg
kg
371$
37000
33024542032.0$=××××
3.) Chloroform: (ICIS, 2011)
Given that the mass flow rate = 2153 kg/hr
MT
US
MT
yr
yr
days
day
hr
hr
kg
kg
323$
37000
33024215370.0$=××××
4.) Chlorine: (ICIS, 2011)
Given that the mass flow rate = 638.5 kg/hr
MT
US
MT
yr
yr
days
day
hr
hr
kg
kg
55$
37000
330245.63840.0$=××××
Total by-products credit:
US$ (407 + 371 + 323 + 55)/MT = US$1156/MT
c.)Utilities cost (Seider et al (2004). Product & process design principles: synthesis,
analysis and evaluation)
1.) Steam
Given the total mass flow rate of steam = 17110 kg/hr + 360 kg/hr = 17470 kg/hr
MT
US
MT
yr
yr
day
day
hr
hr
kg
kg
25$
370001
330
1
2417470
1000
60.6$=××××
2.) Cooling water
Given the total volume flow rate of cooling water = hr
m
hr
m
hr
m 333
361818 =+
MT
US
MT
yr
yr
day
day
hr
hr
m
m
15.0$
370001
330
1
2436
02.0$ 3
3=××××
Page 81
64
3.) Electricity
Total electricity = 1767 kW + 590.3 kW + 510.7kW + 206.3 kW + 6.52kW = 3081 kW
MT
US
MT
yr
yr
day
day
hrkW
hrkW
40$
370001
330
1
243081
06.0$=××××
−
Total utilities = US$ (25 + 0.15 + 40)/MT = US$ 65.15/MT
Summary of variable manufacturing cost
Table 4.14 Variable manufacturing cost
Cost factor US $/MT
Raw materials
i.) Benzene ii.) Acetic anhydride iii.) Sodium hypochlorite iv.) Sulphuric acid
Total
970.0
1256.0
1177.0
69.0
3472.0
Utilities
i.) Electricity ii.) Steam iii.) Cooling water
Total
40.0
25.0
0.15
65.15
Credit of by product
i.) Sodium hydroxide ii.) Chloroform iii.) Acetic Acid iv.) Chlorine gas
Total
- 407.0
- 371.0
- 323.0
- 55.0
- 1156.0
Total variable cost 2381.15
Page 82
65
4.5.3 Manufacturing and general expenses
a.) Operation labor cost
Table 4.15 Labor cost
Position Number US$/month Month total
(US $)
Month/yr Annual
(US $)
Expatriate 1 12000 12000 12 144000
Managerial 1 8000 8000 12 96000
Executive 2 5000 10000 12 120000
Supervisory 3 3000 9000 12 108000
Technical 5 1800 9000 12 108000
Skilled 10 1200 12000 12 144000
Clerical 2 800 3200 12 38400
Others 2 500 1000 12 12000
Total 20 32300 64200 770400
Total labor cost per metric ton:
MT
US
MT
yr
yr
US 21$
37000
770400$=×
b.) Maintenance cost (Seider, et al (2004). Product & process design principles:
sysnthesis, analysis and evaluation)
i.)Wages and benefit
We consider 4.5% of total depreciable cost (TDCC ) for fluid- solid handling process
MW & B = 045.0×TDCC = US$ 82million x 0.045 = US$ 3.7million
ii.)Salaries and benefit
Page 83
66
We consider 25% of MW & B
0.25 X US$ 3.7million = US$ 0.93million
iii.) Maintenance overhead
We consider 5% of MW & B
0.05 US$ 3.7million = US$ 0.19million
iv.) Materials overhead:
We consider 100% of MW & B
1 x US$ 3.7million = US$ 3.7 million
The total maintenance cost per metric ton:
( )MT
US
MT
yr
yr
millionUS 230$
37000
7.319.093.07.3$=×
+++
c.) Plant overhead cost ( Seider et al (2004). Product & process design principles:
synthesis, analysis and evaluation)
We consider 22.8 % of the total cost of operating labor and maintenance per ton:
( )MT
US
MT
US 57$23021$228.0 =
+×
d.) Tax and insurance cost
We consider 3% of total depreciable cost (C TDC )
US$ 82million x 0.03 = US$ 2.46million
Tax and insurance cost per metric ton:
MT
US
MT
yr
yr
millionUS 5.66$
37000
46.2$=×
e.) Total depreciable cost
According to Busche (1995), the depreciation cost is 8% of the total depreciation capital
miliionUSmillionUSCC TDCondepreciati 56.6$82$08.008.0 =×=×=
Page 84
67
Depreciation cost per metric ton:
MT
US
MT
yr
yr
millionUS 177$
37000
56.6$=×
f.) General expenses
According to Busche (1995), the general expenses included selling cost, research cost,
administration cost and financing interest. Below is the percentage contributed by each
section:
Sales price of ethylene = US$4100/MT
Selling cost = 3% of sales = MT
USMT
US 123$4100$03.0 =×
Research cost = 0.5% of sales = MT
USMT
US 5.20$4100$005.0 =×
Administration cost = 2% of sales = MT
USMT
US 82$4100$02.0 =×
Financing interest = 1.25% of sales = MT
USMT
US 25.51$4100$0125.0 =×
Total cost of general expenses = US$276.75/MT
Page 85
68
Summary of manufacturing and general expenses
Table 4.16 Manufacturing and general expenses cost
Cost factor US$/MT
Manufacturing expenses
i.) Operation labor costs ii.) Maintenance costs iii.) Plant overhead cost iv.) Depreciation cost v.) Tax and insurance cost
21.0
230.0
57.0
66.5
177.0
Total manufacturing expenses 551.5
General expenses
i.) Selling costs ii.) Research costs iii.) Administration costs iv.) Financing interest
123.0
20.5
82.0
51.25
Total general expenses 276.75
Total fixed cost (Manufacturing expenses + general expenses)
828.25
Page 86
69
4.5.4 Summary of benzoic acid annual production cost
Table 4.17 Annual production cost
1.) Variable Manufacturing Cost
a.) Raw materials i.) Benzene ii.) Acetic anhydride iii.) Sodium hypochlorite iv.) Sulphuric acid Total raw materials b.) Utilities i.) Electricity ii.) Steam iii.) Cooling water Total utilities c.) By-products credit i.) Acetic acid ii.) Sodium hydroxide iii.) Chloroform iv.) Chlorine Total by-products credit
US$/MT
970.0 1256.0 1177.0 69.0 3472.0 40.0 25.0 0.15 65.15 - 407.0 - 371.0 - 323.0 - 55.0 -1156.0
Total variable manufacturing cost 2381.15
2.) Manufacturing Expenses
a.) Operation labour costs b.) Maintenance costs c.) Plant overhead costs d.) Depreciation costs e.) Tax and insurance cost
21 230 57 177 66.5
Total Manufacturing Expenses 551.5
3.) General Expenses
a.) Selling costs b.) Research costs c.) Administration costs d.) Finance interest
123 20.5 82 51.25
Total General Expenses 276.75
Total fixed cost ( Manufacturing Expenses + General Expense) 828.25
Annual production cost of benzoic acid =US$ (2381.15 + 828.25)/MT =
US$ 3209.4/MT
Page 87
70
4.6 Breakeven point calculation
Fixed cost per ton = US$ 828.25/MT
Benzoic acid production capacity = 37 KTA
Total fixed cost = US$ 30645250/yr
Benzoic acid sales price per ton = US$ 4100/MT
Variable Costs per ton = US$ 2381.15/MT
a.) Contribution margin per ton = Benzoic acid sales price per ton – Variable costs
per ton
= US$ 4100/MT – US$ 2381.15/MT
= US$ 1718.85/MT
b.) Sales volume = Total fixed costs/Contribution margin per ton
=
MTUS
yrUS
85.1718$
30645250$
= 17829MT/yr
= 48.85 MT/day
Breakeven point would be:
c.) Sales revenue = Sales volume x Sales price
= 17829MT/yr x US$4100/MT
= US$ 73 million/yr
d.) Output capacity = (Sales volume/ Production capacity)*100%
= %10037000
17829
×
yrMT
yrMT
= 48.2%
Page 88
71
Figure 4.1 Benzoic Acid Cost Volume Profit Graph (Breakeven point)
From figure 4.1, the non-shade area is loss area while the shade area is profit area.
This also indicates that the output capacity is 48% and the cost revenue per year was
US$ 72 million.
e.) Contribution margin ratio = (Sales price – Variable costs)/Sales price
= ( )
%1004100$
15.2381$4100$
×−
MTUS
MTUS
MTUS
= 42%
Page 89
72
4.7 Profit calculation
Benzoic acid sales price = US$ 4100/MT
Annual cost production = US$ 2381.15/MT
a.) Net profit = Sales price – Cost of production
= (US$ 4100/MT) – (US$3209.4/MT)
= US$ 890.6/MT
b.) Sales profit = (Net profit/Sales price) x 100%
= %100/4100$
/6.890$×
MTUS
MTUS
= 21.72%
4.8 Return of investment calculation
Total capital investment = US$ 98.6 million
Net profit value = US$ 890.6/MT or US$ 32.95 million/yr
a.) Return On Investment = (Net profit value/Total capital investment) x 100%
= %10060,98$
/95.32$×
millionUS
yrmillionUS
= 33.42%
b.) Return period = Total capital investment/Net profit value
= yrmillionUS
millionUS
/95.32$
60.98$
= 3 years
Page 90
73
4.9 Summary of benzoic acid project economics analysis review
Table 4.18 Benzoic acid economics analysis
Plant capacity 40 KTA
Operating rate 90.4
Benzoic acid price $ 4100/MT
Benzoic acid production capacity 37 KTA
Fixed investment cost $ 98.60 million
Variable cost $ 2381.15/MT
Fixed cost $ 828.25/MT
Annual production cost $ 3209.4/MT
Contribution margin ratio 42%
Net profit $ 890.6/MT
Sales profit 21.72%
Return on investment (ROI) 33.42%
Return period 3 years
Breakeven point (sales revenue) US$ 73 million/yr
Breakeven point (output capacity) 48.2%
Page 91
74
CHAPTER 5
CONCLUSIONS AND RECOMMENDATIONS
5.1 Conclusions
The main results and feedback of this research to the simulation of benzoic
acid production are the following.
i.) The simulation of benzoic acid production plant by using acetic anhydride
and benzene as raw materials and sodium hypochlorite as an oxidizing
reagents was successfully developed using ASPEN HYSYS 3.2
ii.) The optimum molar flow rate for benzene and sodium hypochlorite molar
flow rate were 50 kg mole/hr and 1200 kg mole/hr respectively at acetic
anhydride basis molar flow rate 50 kg mole/hr.
iii.) The optimum temperature for acylation of benzene is at room temperature
while for oxidation of acetophenone by Clorox(sodium hypochlorite) is at
700 Co .
iv.) The optimum hydro cyclone efficiency is at 99%
v.) For the optimum parameters above, the purity of benzoic acid achieved is 89%
and the mass flow rate is 4681 kg/hr.
vi.) The annual profit of benzoic acid is US$ 890.6/MT and the return period of
this plant is 3 years.
vii.) Strong oxidizing agent sodium hypochlorite is more economical and
environmental friendly if compared to potassium permanganate (IV).
Page 92
75
Potassium permanganate (IV) releasing heavy metal ions which are
dangerous to the environment and costly. Sodium hypochlorite was cheap
and the only hazardous chemical produced was chlorine which could be sold
as by-products.
5.2 Recommendations
In the future works, it is recommended to study the following aspects:
i.) Water management
Water was one of the component flows out from the reaction that has been
simulated. The reuse of the water as cooling or hot water that removed from
the distillation column and separator can be done. This can save the water
utility cost and thus maximize our profit.
ii.) Energy integration basis
It can be done by maximize the recovery of waste heat from various portion
of the reactor. Waste process heat is utilized to generate steam needed in the
process. This is more economic.
iii.) Reactor arrangement
Reactor in series can increase the conversion and also the yield of the
products. The volume needed to achieve a maximum conversion for reactor
in series is smaller than the volume of single reactor.
Page 93
76
References
Abd Hamid, Mohd Kamaruddin (2007) HYSYS: an introduction to chemical engineering simulation for UTM Degree++ program. University Teknologi Malaysia Institutional Repository. ALLEN, D. H. (1991) Economic Evaluation of Projects, 3rd edition (Institution of Chemical Engineers, London). Amato, I. “Green Chemistry Proves It Pays Companies to Find New Ways to Show That Preventing Pollution Makes More Sense Than Cleaning Up Afterward.” Fortune (July 24, 2000). Chlorine Gas, R.E.D.FACTS (1999). United States Environment Protection Agency. Electronic references. Retrieved 30th August 2010, from http://www.epa.gov/oppsrrd1/REDs/factsheets/4022fact.pdf Environment Agency (2011). Electronic references. Retrieved 10 August 2010, from http://www.environment-agency.gov.uk/default.aspx
Felder, R. M., & Rousseau, R. W. (2000). Elementary principles of chemical processes (3rd ed.). United States: John-Wiley & Sons. Fine Chemical Price list (2010). Integra Chemical Company. Retrieved 23 March 2011, from www.integrachem.com/pdfs/IntegraChemicalCatalog.pdf Guerisoli, Silva & Pecora (1998). Evaluation of some physico-chemical properties of different concentrations of sodium hypochlorite solutions. Electroni references. Retrieved 20 August 2010, from http://www.forp.usp.br/restauradora/Trabalhos/prnaclo.html
Page 94
77
HYSYS 2.2 Documentation (2000), Hyprotech Ltd. Calgary, Canada.
H.Scott Fogler (2006). Elements of Chemicals Reaction Engineering. (4th edition). United States: Pearson International. ICIS pricing (2011). Electronic references. Retrieved 20 March 2011, from http://www.icispricing.com/il_home.asp J.D.Seader & Ernest J.Henley (2006). Separation Process Principles. (2nd edtion). United States: John Wiley &Sons. J.M.Smith, H.C.Van Ness & M.M.Abbott (2005). Introduction to Chemical Engineering Thermodynamics. (7th edition). New York: McGraw-Hill. J.W.Zubrick (2005). Haloform Reaction. The Organic Chem Lab Survival Manual. p22- 23. Kurt Lind & George Fischer (2005). Sodium hypochlorite characteristic. Important Considerations to Performance of Sodium Hypochlorite Wastewater Treatment Piping System. Martin Rhodes (2008). Introduction to Particle Technology. (2nd edition). London: John Wiley & Sons. Marzita Bt Abdul Marzak (2006). Synthesis of Zeolite Beta. Modified Zeolite Beta As Catalyst in Friedel-Crafts Reaction Alkylation of Resorcinol. p44-45 McMurry J. (2003), Organic Chemistry, Brooks/Cole. Muhammad A. Al-Arfaj and William L. Luyben (2000). Effect of Number of Fractionating Trays on Reactive Distillation Column. Process and Modelling Control Research. p8-9 Occupational Safety and Health Administration (2008). Electronic references. Retrieved
Page 95
78
30August 2010, from http://www.osha.gov/ Racioppi F., Daskaleros PA., Besbelli N., Borges A., Deraemaeker C., Magalini SI., Martinez AR., Pulce C., Ruggerone ML. and Vlachos P. (1994). Household bleaches based on sodium hypochlorite: review of acute toxicology and poison control centre experience. Food Chem. Toxicol. 32, 845-61 Ritter, S. K. “Green Innovations.” Chemical and Engineering News, 82 (July 12, 2004). p25 Robin Smith (2005). Chemical Design and Integration. (1st edition). London: John Wiley & Sons. Safe Handling of Sodium Hypochlorite. (November 20, 2006). Japan Industry Soda Association, p21. S Bull (2007). HPA Conpendium of Chemical Hazards Sodium Hypochlorite. Health Protection Agency. p24-25 Seider, Seader, Lewin & Widagdo (2010). Product and Process Design Principles. Synthesis, Analysis and Evaluation. (3rd edition). United States: John Wiley & Sons. Shakhashiri (2008). Chemical of the Week. Electronic references. Retrieved 30th August 2010, from www.scifun.org Charles Shaloks and Karlyn Kaley (2003). Technical Support Document: Toxicology Clandestine Drug Labs: Sodium Hydroxide, 1, p7. Snorri Sigurdson & James Patterson (2005). Green Chemistry. Introduction to Organic Laboratory Techniques: A Microscale Approach. p267-277 Stephen Anderson & Robert Shine (2010). Hypochlorite Oxidation-Green Chemistry. Organic Chemistry 2. p22-23 Substance Profile, Benzene (2000). Report of Carcinogens. United States.
Page 96
79
APPENDIX A
A.1 Distillate molar flow and acetic acid component mole fraction Vs Temperature
Page 97
80
A.2 Bottoms liq molar flow and acetophenone component mole fraction VS temperature
A.3 Distillate molar flow and acetic acid component mole fraction VS Acetic anhydride
molar flow
Page 98
81
A.4 Bottoms liq molar flow and acetophenone component mole fraction VS Acetic
anhydride molar flow
A.5 Distillate acetic acid and bottoms liq acetophenone component mole fraction VS
reflux ratio
Page 99
82
A.6 Condenser and reboiler power VS reflux ratio
A.7 Oxidation reactor conversion rate VS Sodium hypochlorite molar flow
Page 100
83
A.8 Liq streams acetophenone and sodium benzoate component mole fraction VS
Sodium hypochlorite molar flow
A.9 Liq streams acetophenone and sodium benzoate component mole fraction VS
oxidation reactor inlet temperature
Page 101
84
A.10 Liqs streams molar flow and benzoic acid component mole fraction VS
acidification inlet temperature
A.11 Liqs streams molar flow and benzoic acid component mole fraction VS
sulphuric acid molar flow
Page 102
85
A.12 Benzoic acid component mole fraction VS Hydrocyclone 2 separation efficiency
A.13 Liq streams chlorine component mole fraction VS separator 1 inlet temperature
Page 103
86
A.14 Chlorofrom molar flow and component mole fraction VS separator 2 inlet
temperature