SANDIA REPORT SAND2014-16529 Unlimited Release Printed August 2014 Simulation Studies of Nucleation of Ferroelectric Polarization Reversal Geoff L. Brennecka and Benjamin Winchester Prepared by Sandia National Laboratories Albuquerque, New Mexico 87185 and Livermore, California 94550 Sandia National Laboratories is a multi-program laboratory managed and operated by Sandia Corporation, a wholly owned subsidiary of Lockheed Martin Corporation, for the U.S. Department of Energy’s National Nuclear Security Administration under contract DE-AC04-94AL85000. Approved for public release; further dissemination unlimited.
Transcript
SANDIA REPORTSAND2014-16529Unlimited ReleasePrinted August 2014
Simulation Studies of Nucleation ofFerroelectric Polarization Reversal
Geoff L. Brennecka and Benjamin Winchester
Prepared bySandia National LaboratoriesAlbuquerque, New Mexico 87185 and Livermore, California 94550
Sandia National Laboratories is a multi-program laboratory managed and operated by Sandia Corporation,a wholly owned subsidiary of Lockheed Martin Corporation, for the U.S. Department of Energy’sNational Nuclear Security Administration under contract DE-AC04-94AL85000.
Approved for public release; further dissemination unlimited.
Issued by Sandia National Laboratories, operated for the United States Department of Energyby Sandia Corporation.
NOTICE: This report was prepared as an account of work sponsored by an agency of the UnitedStates Government. Neither the United States Government, nor any agency thereof, nor anyof their employees, nor any of their contractors, subcontractors, or their employees, make anywarranty, express or implied, or assume any legal liability or responsibility for the accuracy,completeness, or usefulness of any information, apparatus, product, or process disclosed, or rep-resent that its use would not infringe privately owned rights. Reference herein to any specificcommercial product, process, or service by trade name, trademark, manufacturer, or otherwise,does not necessarily constitute or imply its endorsement, recommendation, or favoring by theUnited States Government, any agency thereof, or any of their contractors or subcontractors.The views and opinions expressed herein do not necessarily state or reflect those of the UnitedStates Government, any agency thereof, or any of their contractors.
DE
PA
RT
MENT OF EN
ER
GY
• • UN
IT
ED
STATES OFA
M
ER
IC
A
2
SAND2014-16529Unlimited Release
Printed August 2014
Simulation Studies of Nucleation of FerroelectricPolarization Reversal
Geoff L. BrenneckaElectronic, Optical, and Nanostructured Materials Department
Benjamin WinchesterComputational Materials & Data Science Department
Sandia National LaboratoriesP.O. Box 5800, MS 1411
Albuquerque, NM 87185-1411
Abstract
Electric field-induced reversal of spontaneous polarization is the defining characteristic of a fer-roelectric material, but the process(es) and mechanism(s) associated with the initial nucleation ofreverse-polarity domains are poorly understood. This report describes studies carried out usingphase field modeling of LiTaO3, a relatively simple prototype ferroelectric material, in order to ex-plore the effects of either mechanical deformation or optically-induced free charges on nucleationand resulting domain configuration during field-induced polarization reversal. Conditions wereselected to approximate as closely as feasible those of accompanying experimental work in orderto provide not only support for the experimental work but also ensure that additional experimentalvalidation of the simulations could be carried out in the future. Phase field simulations stronglysupport surface mechanical damage/deformation as effective for dramatically reducing the overallcoercive field (Ec) via local field enhancements. Further, optically-nucleated polarization reversalappears to occur via stabilization of latent nuclei via the charge screening effects of free charges.
3
Acknowledgment
This work was supported by the Physics and Engineering Models (P&EM) portion of the Ad-vanced Simulation and Computing (ASC) Program and built upon earlier experimental work thatwas supported by the Laboratory Directed Research and Development (LDRD) program. The au-thors wish to express their appreciation to Veena Tikare (1444) and Corbett Bataille (1814) forassistance with code development and implementation, David Scrymgeour (1728) for technicaldiscussions related to LiTaO3 materials parameters and behavior, and Tom Buchheit (1814), JeffRodelas (1831), Mike Sinclair (1816), Fred Zutavern (5444), Gary Dension (5443), Gary Pena andSteve Glover (1353), and Larry Schneider (1350) for technical and/or financial assistance with theearlier experimental components that provided input and guidance for these simulation-focusedefforts.
4.1 Previous experimental work showed that surface indentations significantly decreasedthe polarization reversal time for LiTaO3 wafer samples. . . . . . . . . . . . . . . . . . . . . . 20
4.2 More recent experimental work [1] demonstrated similarly-reduced switching timesfor surface-scratched LiTaO3 crystal samples under high power drive conditions. . . 20
4.3 Speed of switching for various indent widths under a constant voltage ramp rate. . . 21
4.4 Speed of switching for varying magnitudes of extra potential applied at indentunder a constant voltage ramp rate. . . . . . . . . . . . . . . . . . . . . . . . . . . . . . . . . . . . . . . 22
5.1 Data traces from a measurement in which a square wave just below the coercivevoltage was applied to a LiTaO3 single crystal showing enhanced charge release(presumed ferroelectric switching) upon illumination with 8 mW of 390 nm laserlight. . . . . . . . . . . . . . . . . . . . . . . . . . . . . . . . . . . . . . . . . . . . . . . . . . . . . . . . . . . . . . . 24
5.3 Graphical illustration of the basic approach to the simulations discussed here. . . . . 26
5.4 Comparison of Eapplied at first nucleation to the magnitude of charge center. . . . . . . 27
5.5 Comparison of Eapplied at first nucleation to the angles between the charge centers. 28
5.6 Minimum size of stable nuclei vs applied field, showing also the effect of changingthe background dielectric constant, εb, which sets the electric field resulting frombound charge (such as at uncompensated domain walls). A larger εb means smallerresulting electric fields, and smaller stable nuclei. . . . . . . . . . . . . . . . . . . . . . . . . . . . 32
Ec Coercive field: the magnitude of electric field required to reverse polarization in a ferroelectric,generally defined as the point(s) on the Polarization vs. Electric field hysteresis loop wherethe loop crosses the P=0 axis.
HWHM Half-width half-maximum: one of several methods for describing a symmetric distribu-tion, in this case, half of the width of the distribution at the value which is one half of themaximum value.
LiNbO3 and LiTaO3 Lithium Niobate and Lithium Tantalate: very similar ferroelectric materialswith large remanent polarizations, small saturated permittivities, and low electromechan-ical response. These materials are commercially available in single crystal form and arecommonly used in electro-optic devices. Their crystal structure precludes the existence ofnon-180◦ domain walls making them excellent subjects for fundamental studies of domaindynamics. The coercive fields of these crystals show an extremely strong dependence on Listoichiometry.
SNL Sandia National Laboratories
TDGL Time Dependent Ginzburg-Landau: equation that describes the evolution of polarizationas a linear relationship of the variational derivative of the energy functional with respect topolarization.
9
10
Chapter 1
Introduction
The fundamental phenomena associated with ferroelectric switching began receiving significantattention in the 1950s [2–5] and with the advent of advanced characterization and simulation toolshas seen a recent resurgence in interest. [6–13] Many of the questions that continue to perplex theferroelectrics community are associated with the process of initial nucleation of otherwise-orienteddomains upon application of a switching electric field. The project whose results are describedhere was conceived to take advantage of the simulation capabilities and expertise available withinSNL to develop a better understanding of the processes and critical parameters associated with theformation and stability of nuclei of inverse-polarity domains within a matrix of homogeneous po-larization. Previous experimental work (some of which is described in an earlier SAND report [1])demonstrated conclusively that mechanical surface damage could significantly affect polarizationreversal times in single crystal ferroelectrics and hinted that optically-induced nucleation may alsobe possible; this project was structured in order to develop a simulation framework that couldprovide some theoretical support to these prior experimental findings and help to develop a morecomplete understanding of dynamic ferroelectric response under a variety of drive conditions.
This report begins with an brief overview of the phenomenological theory of ferroelectric ma-terials as a way of introducing the terminology and energy-based arguments that form the basisof the rest of the work. As this work was entirely focused on simulation, the input material pa-rameters came from literature values. Since an entirely self-consistent set of parameters were notavailable in the open literature, we used the best that we could find and discuss the concerns andrationale behind associated assumptions in Chapter 3; a full list of the material parameters used inthis work can be found in Appendix A. Based on the earlier experimental work that prompted thisstudy, the next two chapters, 4 and 5, address the role(s) of surface mechanical damage and opticalenergy, respectively, in nucleation of reverse-polarity domains. The code developed for this workis available by contacting Amy Sun, manager of 1814 ([email protected]).
11
12
Chapter 2
Phenomenological theory for ferroelectrics
We derive an energy functional F for the system as a function of strain, electric field, and polar-ization, and find the temporal evolution of the system by the time-dependent Ginzburg-Landau(TDGL) equation, which describes the evolution of the polarization, Pi, as a linear relationship ofthe variational derivative of the free energy functional with respect to the Pi,
∂Pi
∂t=−L
δF [P,E,ε]δPi
The above can be thought of as finding the change in Pi that most quickly decreases the freeenergy of the system. Here we define the system free energy as the volume integral of the Landau,elastic, electrostatic, and gradient energies over the entire system [14],
A brief discussion of the different energy terms follows.
2.1 Landau Energy
Landau theory allows us to describe the free energy in terms of a Taylor expansion of the orderparameter near the critical temperature. For a second-order phase transition, as we go below thecritical temperature, the second-order term becomes negative, creating a double-well potential ormore, depending on the crystal symmetry (Figure 2.1). Here we discuss a Landau free energyestimate for materials in the 3m point group, such as LiTaO3 and LiNbO3. We denote the uniaxialcrystallographic direction as the x3 axis.
The 4th-order 3m local Landau free energy is given as:
fLandau = α1(P21 +P2
2 )+α3P23 +α33P4
3
13
Figure 2.1. Schematic double-well energy potential for T < TC.
Where α1 > 0 as dictated by the lack of spontaneous polarization along the x1 or x2 axes.If FLandau = FL represents the volume integral of the local free Landau energy, fLandau, then thevariational derivatives with respect to each Pi are given as:
δFL
δPi=
∂ fL4
∂Pi
For P1 and P2 this simplifies as:
δFL
δP1= 2α1P1
δFL
δP2= 2α1P2
And for P3, in factorized form:
δFL
δP3= P3(2α3 +4α33P2
3 )
2.2 Electrostatic Energy
In the case of a ferroelectric, the electrostatic energy can be written as: [15]
felectrostatic =−12
ε0εb,iiEiEi−EiPi
Where Ei is the electric field along the xi, Pi is the polarization along xi, and ε0 and εb,ii arethe electric constant and background dielectric constants, respectively. The variational form of theelectrostatic energy with respect to polarization is simply:
14
δFelectrostatic
δP3=−Ei
We recall that the potential, φ, and electric field, Ei are connected via
Ei =−∂φ
∂xi
So, describing the energy functional as a function of polarization and potential, we arrive at:
F [P(x),φ(x)] =∫ 1,2,3
∑i−1
2ε0εb,ii
∂φ
∂xi
∂φ
∂xi+Pi
∂φ
∂xidV
If we find the Euler-Lagrange equations associated with the variational derivative with respectto φ(x), we find, of course, the following equations:
ddxi
(ε0εb,ii
∂φ
∂xi
)− dPi
dxi= 0,
If we assume that εr,ii is spatially homogeneous, we can reformulate this as:
∂2φ
∂x2i=5·Pε0εb,ii
Or, since the bound charge is defined here as ρb =−5·P, we can put this in its common form,Poisson’s equation:
52φ =
−ρb
ε0εb,ii
So Poisson’s equation can be derived as the Euler-Lagrange equations of the electrostatic en-ergy e.g., by setting the first variational derivative of the electrostatic energy equal to zero.
2.3 Elastic Energy
We take a linear approximation to the elastic strain energy, given as:
15
felastic =12
ci jklei jekl =12
ci jkl(εi j− ε0i j)(εkl− ε
0kl)
=12
ci jkl
[12
(∂ui
∂x j+
∂u j
∂xi
)− ε
0i j
][12
(∂uk
∂xl+
∂ul
∂xk
)− ε
0kl
]
Where ui is the ith component of mechanical displacement, ei j is the elastic strain, ci jkl is theelastic stiffness tensor, and ε0
i j represents the eigenstrain. We also describe the total strain, εi j,
εi j =12
(∂ui
∂x j+
∂u j
∂xi
),
and the eigenstrains are connected to the polarizations via the electrostrictiver properties of thematerial,
ε0kl = QklopPoPp.
As with the electric potential, the mechanical displacement can be solved either via variationalmethods or directly.
2.4 Gradient Energy
The local gradient energy of polarization can be expressed in cubic form as
fGradient =12
g11(P21,1 +P2
2,2 +P23,3)+g12(P1,1P2,2 +P1,1P3,3 +P2,2P3,3)
+g44([P1,2 +P2,1]2 +[P1,3 +P3,1]
2 +[P2,3 +P3,2]2)
+g′44([P1,2−P2,1]2 +[P1,3−P3,1]
2 +[P2,3−P3,2]2)
Where Pi, j =∂Pi∂x j
, and Pi,Pi, j, and the gradient energy coefficients gi j may in a general formall be functions of position. However, here we assume that the gradient energy coefficients areisotropic and uniform in space; g11 = 2g44 = 2g′44, and g12 = 0. With spatially homogeneousgradient energy coefficients, the local variational derivatives with respect to Pi are:
δ fG
δPi=
ddx j
∂ fG
∂Pi, j.
16
Chapter 3
Numerical details and model discussion
3.1 Evolution equation
In solving the TDGL equation, we treat the gradient energy implicitly, as doing so greatly increasesthe simulation numerical stability. Defining Fng as the non-gradient energy terms, the resultingdiscretization of the TDGL equation is as follows:
Pn+1i∆t
+LδFgradient(Pn+1
i )
δPn+1i
=−LδFng[Pn
i ,E,ε]δPn
i+
Pni
∆t
where Pni refers to the polarization Pi at timestep n.
3.2 Electrostrictive parameters
The material parameters for LiTaO3 and LiNbO3 come from the seminal work by Scrymgeour,Gopalan, et al. [16] In this work, we were unable to derive a robust, consistent set of values forthe electrostrictive coefficients Qklop from the given coefficients in the paper. We found disagree-ments between the stated values for the elastic stiffness constants and the values derived fromthem, and we were unable to reconcile the derivation of the simplified energy terms used in theirformulas with any standard model for calculating free energy based on strain. We therefore setthe electrostrictive coefficients to zero, and the elastic energy effects are neglected. While at firstthis may seem to be an unjustifiable oversimplification, since LiTaO3 and LiNbO3 have only twoantiparallel polarization directions, ferroelastic contributions are non-existent. It is known that the180◦ domain walls in these materials are not entirely strain-free, [17–19] but given the constraints,we chose to investigate the limiting case dominated by electrostatic effects rather than assumingarbitrary non-zero values for the electrostrictive parameters and thereby effectively investigatingas less-well-defined situation.
17
3.3 Coercive field Ec
The coercive electric field, Ec, is defined as the electric field under which the ferroelectric polar-ization switches. Given the parameters used here (listed in Appendix A), the coercive field for anucleation-free, defect-free system is 0.262 MV/m. This value is roughly 3-4 orders of magnitudegreater than the experimental value(s), as is common for estimates of Ec based solely on Landautheory. Two of the potential explanations for an overly-high estimate of Ec will be relevant for thiswork: nucleation sites [20, 21] and charge screening of depolarization fields. [22]
3.4 Background dielectric constant for LiTaO3
The best-known Landau parameters for LiTaO3 and LiNbO3 employ a dielectric constant of about45. [16] However, typical background dielectric constant values for similar ferroelectrics are inthe range of 6-15. Additionally, common practice used to be to employ the relative dielectricconstant in the calculation of Landau parameters instead of the background dielectric constant.These factors lead the authors to suspect that the background constant referenced and employedhere is too high by a factor of 3-4x. However, properly demonstrating this would require a re-analysis of the literature work which is outside the scope of this study, so for now, we use theliterature data with full awareness of the potential shortcomings.
18
Chapter 4
Indent-mediated ferroelectric switching inLiTaO3
4.1 Motivation
Here, we consider a physical method for introducing nucleation sites, a ferroelectric with mechani-cal indents on the surface. Former experimental work indicates that indents and/or scratches on theferroelectric surface increase the switching uniformity and rate (Figures 4.1 and 4.2), presumablyby increasing the number and spatial uniformity of nucleation sites.
The full scope of the resulting materials property changes from a mechanical indent is unclearwe would expect the indent to result in a buildup of dislocations, ion displacement, etc., any ofwhich might contribute to the nucleation and pinning properties of the ferroelectric. However,the indent also provides a change in the surface topography of the ferroelectric. By depositingan electrode onto the ferroelectric surface, the electrode inherits the sharp topography change,protruding into the sample and resulting in an increased local electric field under an applied bias.
4.2 Methodology
We model the effects of indents on LiTaO3 as an increased potential distribution on the top surfaceof the ferroelectric. Using fixed-potential boundary conditions, we break the applied bias into twoparts, the uniform bias φu and the heterogenous “overpotential” resulting from the indent, φn(x),such that the resulting top-surface potential φtop is given as:
φtop(x) = φu[1+φn(x)].
We employ a Lorentzian distribution to set the shape of the overpotential,
φn(x) = I(
γ2
(x− x0)2 + γ2
)19
Figure 4.1. Previous experimental work showed that surface in-dentations significantly decreased the polarization reversal time forLiTaO3 wafer samples.
Figure 4.2. More recent experimental work [1] demonstratedsimilarly-reduced switching times for surface-scratched LiTaO3crystal samples under high power drive conditions.
20
Where I is the peak height of the distribution, γ is the half-width half-maximum (HWHM), andx0 represents the spatial location of the Lorentzian peak. The above equations imply that the indentbias adds a fixed percentage scaling to the uniform bias. We vary the HWHM and the distributionmagnitude, and examine the effects on speed of switching. We start with no applied top surfacebias, and gradually ramp up φu at a rate of 0.1 every 200 timesteps, while the bottom surface isheld fixed with zero potential.
4.3 Results
We present the results in terms of what percent of the opposing electrode area has switched.
In Figure 4.3 we present the effect of changing γ for a given peak overpotential, I, of 30%.The base applied field refers to the electric field calculated from just φu. We note that initialcurves all rise together to about 150kV/m before diverging; this is a numerical artifact coming frompolarization change under the applied field across the entire sample and should not be interpretedto mean that nucleation has occurred.
Figure 4.3. Speed of switching for various indent widths under aconstant voltage ramp rate.
We see that the wider indents nucleate faster than the narrower indents, and with proportionallymore initial surface area, they also grow faster at a given applied field. For each of the indents,we note that there is an applied field where growth sharply accelerates. The mechanics of this areunknown.
In Figure 4.4 we present the effect of changing the overpotential magnitude while using anindent width of 10nm. As might be expected, a greater potential increase results in nucleation
21
at a lower applied field. However, the switching occurs at about the same rate, regardless of theoverpotential size. The exception, of course, is the reference case with zero overpotential, whichmatches the analytical expectation of abrupt, homogenous switching.
Figure 4.4. Speed of switching for varying magnitudes of extrapotential applied at indent under a constant voltage ramp rate.
4.4 Simulation details
These are 2-D simulations, with a system size of 64nm by 125nm, along x1 and x3 respectively,with two gridpoints for every nanometer of real space. The initial domain structure is just a singledomain of +P3. The material parameters for LiTaO3 can be found in Appendix A, and all othersimulation parameters are given in table 4.1.
Table 4.1. Additional simulation parameters
∆t 0.2εb 44.9g11 4.56
22
Chapter 5
Laser-mediated nucleation and switching inLiTaO3
Figure 5.1 shows one example of the data collected as part of earlier experimental efforts whichsuggested that optical energy could be used to assist with ferroelectric switching in LiTaO3. Ad-ditional experiments ruled out this being a simple effect of photocurrent generation, and the nullresults from high power infrared (IR, 780 nm) illumination strongly suggests that this is not sim-ply a thermal effect. Several literature studies have also indicated that lasers can be used to eitherpromote [23,24] or inhibit [25] polarization reversal, and a birefringence laser pattern can be usedto pattern a domain structure within an optically-transparent ferroelectric. [26] One goal of thepresent simulation-focused work was the investigate the potential mechanisms and their relativecontributions to polarization reversal.
There are two potential mechanisms by which application of laser light can induce or encouragedomain switching. The first is that the laser application sets up regions with alternating, highelectric field. [23] In order to minimize electrostatic energy, the ferroelectric polarization lines upwith the laser-induced electric field. Alternatively, slow-moving free charges may move to screenthe laser-induced fields, and upon removal of the laser light, these charges induce an electric fieldthat switches the polarization.
The second mechanism involves the excitation of electrons or holes, raising the amount ofmobile charge. [22, 26, 27] Given that a switched domain wall has a high concentration of boundcharge due to the head-to-head or tail-to-tail orientation of the polarization, these free chargesmay serve to screen the electrostatic energy associated with the domain wall, encouraging domainnucleation (Figure 5.2).
Both mechanisms have supporting evidence. We use the phase-field model to examine bothmechanisms separately, although the two mechanisms are not necessarily mutually exclusive andjoint consideration is an obvious subject for future work. In Part 1, we introduce bound chargecenters in order to examine the effects of regions of concentrated electric fields. In Part 2, weinvestigate the stability of a nucleus with respect to a given applied electric field.
23
Figure 5.1. Data traces from a measurement in which a squarewave just below the coercive voltage was applied to a LiTaO3 sin-gle crystal showing enhanced charge release (presumed ferroelec-tric switching) upon illumination with 8 mW of 390 nm laser light.
24
(a) Under an applied field, new do-mains can nucleate but have highlycharged domain walls
(b) Charged domain wallscreate a depolarization fieldEd that cancels the appliedfield and suppresses the newdomain.
(c) Reducing the net bound charge atthe domain wall reduces the depolar-ization field, and allows the new do-main to grow.
Figure 5.2. Schematic illustration of charge screening in the nu-cleation, stability, and propagation of charged domain walls.
5.1 Part 1: Effects of bound charge centers on nucleation
Beginning with a simulation of a uniform, poled, bulk single crystal of LiTaO3, we introducetemporally-fixed charge centers of varying distance, angle, and magnitude, in order to identifythe effects of a spatially-varying electric field on the ferroelectric. We employ one positive andone negative charge center of equal magnitude and shape. To set the shape, we use a Lorentziandistribution, with a constant HWHM of 5nm across all simulations considered here, and we varythe angle between positive and negative charge centers, such that the resulting electric field variesbetween being parallel and perpendicular to the applied electric field (Figure 5.3). Once the chargecenter positions and magnitudes are set, we slowly increase the applied electric field along x3 untilnucleation is observed.
Let us denote the applied field at first nucleation as En, the angle between charges as ρθ, thedistances between charge centers as ρd , and the peak magnitude of the charge centers ρmag. In asimple 1-D case with charge centers aligned along x3, alternating regions of positive and negativecharge produce an electric field with alternating sign, and this gives simplistic results: when theresulting electric field plus the applied field becomes larger than Ec anywhere, nucleation results.
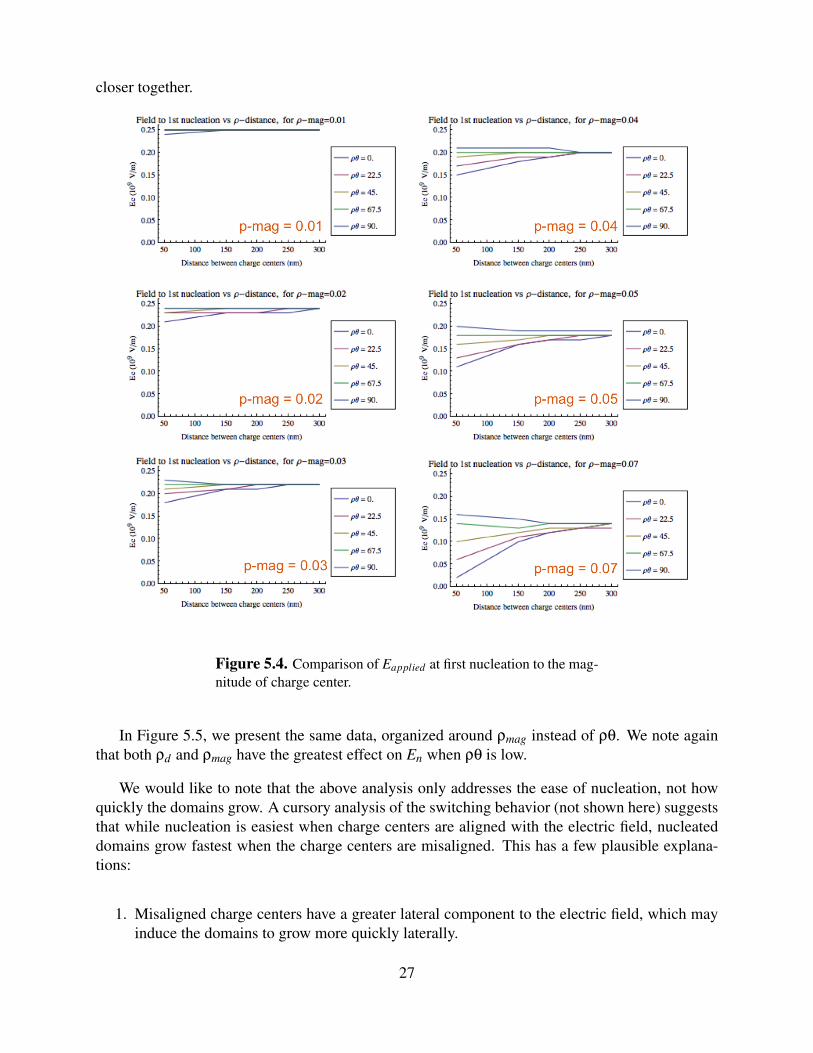
Let us consider a 2-D simulation, with simulation details given below. In Figure 5.4, we showthe applied electric field required for nucleation, En, as we vary both the distance between thecharges and the peak magnitude. At low magnitudes (ρmag = 0.01), neither ρθ nor ρd mattersmuch, and En is close to Ec. As we increase the charge center magnitude, we notice a few trends.The required field drops for all angles and distances, but at unequal rates. Nucleation is alwayseasiest when the charge centers are aligned with the applied electric field, when ρθ is low. Last,when ρθ and ρmag are both high, nucleation is harder to obtain as the charge centers move closertogether, in contrast to most of the cases where nucleation becomes easier as the charges move
25
(a) Take a uniform, bulk ferroelectric (b) add some bound chargedistribution
(c) and observe the effects onnucleation, switching, domaingrowth, etc.
(d) Vary: angle between charges (e) amount of charge (f) and distance between charges:(50, 100, 150, 200, 250, 300 nm)
Figure 5.3. Graphical illustration of the basic approach to thesimulations discussed here.
26
closer together.
Figure 5.4. Comparison of Eapplied at first nucleation to the mag-nitude of charge center.
In Figure 5.5, we present the same data, organized around ρmag instead of ρθ. We note againthat both ρd and ρmag have the greatest effect on En when ρθ is low.
We would like to note that the above analysis only addresses the ease of nucleation, not howquickly the domains grow. A cursory analysis of the switching behavior (not shown here) suggeststhat while nucleation is easiest when charge centers are aligned with the electric field, nucleateddomains grow fastest when the charge centers are misaligned. This has a few plausible explana-tions:
1. Misaligned charge centers have a greater lateral component to the electric field, which mayinduce the domains to grow more quickly laterally.
27
Figure 5.5. Comparison of Eapplied at first nucleation to the an-gles between the charge centers.
28
2. Analogous to the decreased switching time for larger physical nucleation sites from Figure4.3, charge centers at large angles with respect to the applied field will present a largereffective cross-sectional area. Since domain growth along the polarization direction is knownto occur much more quickly than lateral domain growth, increasing the area of each normal-growth domain reduces the amount of lateral domain wall motion required.
3. With misalignment, En is higher, and domains always grow faster under higher applied fields.In this case, the quicker growth after nucleation would be simply an artifact of the highernucleation field.
4. Charge centers emit electric field in all directions. Where the resulting electric field is in thesame direction as the applied field, nucleation is enhanced, and where it opposes the appliedfield, both nucleation and switching are suppressed. Aligning charges produces a highernucleating field, but also aligns the nuclei in such a way that switching will be hindered bythe opposing electric fields on the unfavorable side of the charge center.
We would like to point out that both quickly-growing and slowly-growing nuclei may havepractical uses for rapid and uniform ferroelectric switching. If indeed nuclei can be induced andpinned by laser-induced charge distributions, we might try to establish a regular, optimal distri-bution of non-growing nuclei under an applied laser illumination, then switch the illumination offto allow those domains to move freely, prompting quick and controllable switching of the mate-rial. On the other hand, if other, unexpected nucleation sites prove to play an important role inswitching, we may not be able to restrict the growth of the nuclei, leading to irregular and dif-fuse switching. In this case, the best switching properties might come from inducing as manyquickly-growing nuclei as possible.
Last, we note that a charge center of ρmag = 0.05 with a HWHM of 5nm correlates to anapproximate charge density of 1016 C/m3, too high to be physically realistic. This would suggestthat charge centers cannot be, by themselves, the mechanism inducing nucleation and switchingin laser illumination of LiTaO3. However, the extremely high charge concentration that is neededfor nucleation may also just be another result of the Landauer Paradox, the discrepancy betweentheory and experiments on the critical field needed for switching.
We used 2-D simulations, with a system size of 600nm x 600nm and 600 x 600 gridpointson a fixed, regular mesh. The timestep is taken as ∆t = 0.06, which does not yet have a physicalmeaning without an experimental comparison for calibration of L, the kinetic parameter. We beginthe simulations with a uniform polarization of P1 = P2 = 0; P=0.1 C/m2 and no applied electricfield. We allow the simulations to come to equilibrium over 600 timesteps before we introduce thecharge centers or start to change the applied electric field. We introduce the charge centers at 600timesteps, and at 900 timesteps we begin lowering the applied electric field along x3 by 0.01 MV/mevery 200 timesteps. This interval of timesteps seems to be large enough to allow most metastablebehavior to settle out and for the simulation to get close to the pseudo-static conditions.
29
5.2 Part 2: Stability of nuclei under an applied electric field
Here we endeavor to find the smallest stable nuclei for a given an applied electric field. This dataserves two purposes so far. First, as related to the previous discussion of nucleating domains usingvariable charges or electric fields, this work places a lower limit on how small the resulting nucleican be and still be of use for switching.
Second, we will examine the effects of changing the background dielectric constant of thematerial. The background dielectric constant governs the electric fields that result from boundcharges such as uncompensated domain walls, as previously described in Part 1:
52φ =−ρb
ε0εb
By varying εb, we can vary the amount of depolarization fields created inside a nucleus. Thisserves as a proxy for examining the role of mobile charge, which would increase nuclei stabilityby the same mechanism, the reduction of the depolarization fields. [22]
5.2.1 Methods
We introduce a circular nucleus of radius r into a homogeneous, single domain of +P3 using thetanh function:
P3(x) = Pstanh(||x− x0||− r
ξ
)
where x0 is the reference location of the center of the nucleus, ξ governs the transition width,and Ps is the spontaneous polarization. In the case of LiTaO3, Ps ≈ 0.5 C/m2. The nucleus polar-ization is aligned with the applied electric field.
We adopt somewhat flexible standards in determining what constitutes a “stable” nucleus. Innature, no nucleus should be stable under an applied field; at best, it would be metastable, eithergrowing or shrinking over time. However, because of the roots of its formulation, the phase-fieldmethod typically represents a smoothed version of reality, and domains are less easily pinned insimulation that in experimental observation. At the same time, numerical constraints add someartificial pinning behavior back in, particularly if the numerical integration scheme is low-order inspace or the resolution is relatively low (which it is, here).
With these in mind, we employ the same timestep size as above, and allow the simulation torun for a comfortably long period of time (3000 time steps), or until the nucleus has either shrunkby > 50%, grown by > 400%, or reached half the simulation volume. So long as the nucleus doesnot shrink to less than half its original size within the allotted time, it is deemed ‘stable’. Typically
30
there is little change in the domain size after 1000 timesteps, so we feel that 3000 timesteps isjustified and safe.
If a nucleus of size r is not stable, we increase r by 5% and try again, repeating until we find anapproximation for the minimum stable nucleus. Here, we examine a range of electric fields from0.1Ec to Ec, in increments of 0.1Ec. For these simulations, we decreased the system size to 300nmx 300nm; otherwise, the parameters used here are the same as in Part 1.
5.2.2 Results
In Figure 5.6, we demonstrate the results across a range of applied electric fields for two differentvalues of εb. Before discussion, we would like to refer the reader again to the discussion on LiTaO3background dielectric constants in Chapter 2, noting that the εb used here may be 3-4x too high,resulting in an inversely decreased electric field. However, adjusting εb here can still give us aqualitative idea of the effect of the charge screening.
As expected, we note that the stable nuclei size decreases with decreasing depolarization field.We also note an interesting shift between about 0.2Ec and 0.5Ec, in which the minimum nuclei sizedrops sharply with increasing Ea before staying relatively constant. We postulate that this indicatesa transition in the dominant energy form governing the nuclei size. When the applied field is lowand the nuclei small, the depolarization fields inside the domain are too great, requiring a verylarge domain in order to separate the charges far enough that the resulting depolarization field isrelatively low. As the applied field becomes larger, it compensates for increasing amounts of thedepolarization field, allowing the minimum nuclei size to decrease and the bound charges to comecloser together.
Once Ea is high enough that the depolarization field is sufficiently compensated, the Landauand gradient energy contributions dominate the nuclei size via their contribution to the domainwall energy.
31
Figure 5.6. Minimum size of stable nuclei vs applied field, show-ing also the effect of changing the background dielectric constant,εb, which sets the electric field resulting from bound charge (suchas at uncompensated domain walls). A larger εb means smallerresulting electric fields, and smaller stable nuclei.
32
Chapter 6
Conclusions
The primary goal of this work was to develop a better understanding of the processes and criticalparameters associated with the formation and stability of nuclei of inverse-polarity ferroelectric do-mains within a matrix of homogeneous polarization, both to investigate mechanisms proposed toexplain earlier experimental work and to guide future projects interested in controlling the highlynonlinear response of ferroelectric materials during the switching process. For example, as dis-cussed in more detail in Reference [1], reliable operation of high power ferroelectric openingswitches will require control of dynamic ferroelectric domain response to large electric fields.While not necessarily unexpected, quantifying the effects of mechanical damage on nucleationand switching behavior is important for cases in which surface-initiation of ferroelectric switchingis sufficient or desirable. The most important contribution of this work, however, is in elucidatingthe mechanisms by which optically-assisted nucleation can occur. Certainly, there is still a needfor better material parameter inputs before the model developed as part of this work can be fullypredictive, but even the limited results produced so far are valuable for the associated physical andmechanistic insights into the relative magnitudes of the contributions from direct optical (electric)fields and screening effects of free charges. This work introduced a new phase-field capability toSNL while providing valuable insight into the mechanisms associated with mechanical and opticaleffects on nucleation for ferroelectric polarization reversal.
33
34
References
[1] G. L. Brennecka, F. J. Zutavern, G. J. Dension, M. B. Sinclair, M. A. Blea-Kirby, G. E. Pena,and S. F. Glover. “Controlled Polarization Reversal for Ferroelectric Opening Switches.”[SAND2013-10422] (2013).
[2] W. J. Merz. “Domain Properties in BaTiO3.” Phys. Rev., 88 [2] 421–422 (1952).
[3] W. J. Merz. “Domain Formation and Domain Wall Motion in Ferroelectric BaTiO3 SingleCrystals.” Phys. Rev., 95 [3] 690–698 (1954).
[4] R. Landauer, D. Young, and M. Drougard. “Polarization Reversal in the Barium TitanateHysteresis Loop.” Journal of Applied Physics, 27 [7] 752–758 (1956).
[5] R. Landauer. “Electrostatic Considerations in BaTiO3 Domain Formation during PolarizationReversal.” Journal of Applied Physics, 28 [2] 227–234 (1957).
[6] V. Gopalan and T. E. Mitchell. “Wall velocities, switching times, and the stabilization mech-anism of 180◦ domains in congruent LiTaO3 crystals.” J. Appl. Phys., 83 [2] 941–954 (1998).
[7] V. Gopalan, Q. Jia, and T. E. Mitchell. “In situ video observation of 180◦ domain kinetics incongruent LiNbO3 crystals.” Appl. Phys. Lett., 75 [16] 2482–2484 (1999).
[8] V. Gopalan, S. S. A. Gertsl, A. Itagi, T. E. Mitchell, Q. Jia, T. E. Schlesinger, and D. D.Stancil. “Mobility of 180◦ domain walls in congruent LiTaO3 measured using real-timeelectro-optic imaging microscopy.” J. Appl. Phys., 86 [3] 1638–1646 (1999).
[9] K. Fujimoto and Y. Cho. “High-speed switching of nanoscale ferroelectric domains in con-gruent single-crystal LiTaO3.” Appl. Phys. Lett., 83 [25] 5265–5267 (2003).
[10] J. Li, B. Nagaraj, H. Liang, W. Cao, C. H. Lee, and R. Ramesh. “Ultrafast polarizationswitching in thin-film ferroelectrics.” Appl. Phys. Lett., 84 [7] 1174–1176 (2004).
[11] A. Gruverman, B. J. Rodriguez, C. Dehoff, J. D. Waldrep, A. I. Kingon, R. J. Nemanich,and J. S. Cross. “Direct studies of domain switching dynamics in thin film ferroelectriccapacitors.” Appl. Phys. Lett., 87 082902 (2005).
[12] A. Grigoriev, D.-H. Do, D. M. Kim, C.-B. Eom, B. Adams, E. M. Dufresne, and P. G. Evans.“Nanosecond Domain Wall Dynamics in Ferroelectric Pb(Zr,Ti)O3 Thin Films.” Phys. Rev.Lett., 96 18706 (2006).
[13] B. D. Huey, R. N. Premnath, S. Lee, and N. A. Polomoff. “High Speed SPM Applied forDirect Nanoscale Mapping of the Influence of Defects on Ferroelectric Switching Dynamics.”J. Am. Ceram. Soc., 95 [4] 1147–1162 (2012).
35
[14] L. Q. Chen. “Phase-Field Method of Phase Transitions/Domain Structures in FerroelectricThin Films: A Review.” Journal of the American Ceramic Society, 91 [6] 1835–1844 (2008).
[15] M. Marvan and J. Fousek. “Electrostatic Energy of Ferroelectrics with NonhomogeneousDistributions of Polarization and Free Charges.” Physica Status Solidi (B), 208 [2] 523–531(1998).
[16] D. Scrymgeour, V. Gopalan, A. Itagi, A. Saxena, and P. Swart. “Phenomenological theory ofa single domain wall in uniaxial trigonal ferroelectrics: lithium niobate and lithium tantalate.”Phys. Rev. B, 71 [18] 184110 (2005).
[17] S. Kim, V. Gopalan, and B. Steiner. “Direct x-ray synchrotron imaging of strains at 180◦
domain walls in congruent LiNbO3 and LiTaO3 crystals.” Applied Physics Letters, 77 [13]2051–2053 (2000).
[18] T. Jach, S. Kim, V. Gopalan, S. Durbin, and D. Bright. “Long-range strains and the effects ofapplied field at 180◦ ferroelectric domain walls in lithium niobate.” Phys. Rev. B, 69 064113(2004).
[19] K. Hassani, M. Sutton, M. Holt, Y. Zuo, and D. Plant. “X-ray diffraction imaging of strainfields in a domain-inverted LiTaO3 crystal.” Journal of Applied Physics, 104 043515 (2008).
[20] Y. Ishibashi and Y. Takagi. “Note on Ferroelectric Domain Switching.” J. Phys. Soc. Jpn,31 [2] 506–510 (1971).
[21] Y.-H. Shin, I. Grinberg, I.-W. Chen, and A. Rappe. “Nucleation and growth mechanism offerroelectric domain-wall motion.” Nature, 449 881–884 (2007).
[22] A.-Q. Jiang, H. Lee, C. Hwang, and T.-A. Tang. “Resolving the Landauer paradox in ferro-electric switching by high-field charge injection.” Phys. Rev. B, 80 [2] 024119 (2009).
[23] J. Fousek, M. Marvan, and R. Cudney. “Localized switching in photorefractive ferroelectricsinduced by spatially inhomogeneous electric fields.” Applied Physics Letters, 72 [4] 430(1998).
[24] C. Sones, M. Wengler, C. E. Valdivia, S. Mailis, R. W. Eason, and K. Buse. “Light-inducedorder-of-magnitude decrease in the electric field for domain nucleation in MgO-doped lithiumniobate crystals.” Appl. Phys. Lett., 86 212901 (2005).
[25] C. Sones, A. Miur, Y. Ying, S. Mailis, R. W. Eason, T. Jungk, A. Hoffman, and E. Soergel.“Precision nanoscale domain engineering of lithium niobate via UV laser induced inhibitionof poling.” Appl. Phys. Lett., 92 072905 (2008).
[26] K. Buse. “Light-induced charge transport processes in photorefractive crystals I: Models andexperimental methods.” Applied Physics B: Lasers and Optics, pages 273–291 (1997).
[27] K. Buse. “Light-induced charge transport processes in photorefractive crystals I: Materials.”Applied Physics B: Lasers and Optics, pages 391–407 (1997).
36
Appendix A
Material parameters for LiTaO3
The following material parameters were drawn from reference [16] and are used in the simulationsdescried herein:
Table A.1. Landau Parameters (in 109 Nm2/C2)
α1 1.11α3 -0.628α33 1.261
Table A.2. Elastic stiffness tensor components (in 1011 N/m2)
The electrostrictive tensor components are assumed to be zero (see phenomenological theorydiscussion). The background (static) dielectric constant (relative permittivity) is assumed to beisotropic and equal to a value of εb,11 = εb,22 = εb,33 = 45. Similarly, the gradient energy coefficientis also assumed to be isotropic, such that g11 = 2g44 = 2g′44, and g12 = 0. Finally, the kineticcoefficient L is implicitly taken to be 1.
37
DISTRIBUTION:
1 MS 0828 Steven N. Kempka, 15101 MS 1152 Steve F. Glover, 13531 MS 1181 Larry X. Schneider, 13501 MS 1411 Geoff L. Brennecka, 18161 MS 1411 Paul G. Clem, 18161 MS 1411 Amy C. Sun, 18141 MS 1411 Ben M. Winchester, 18141 MS 0899 Technical Library, 9536 (electronic copy)


![FERROELECTRIC RAM [FRAM]](https://static.documents.pub/doc/80x56/56816799550346895ddcd567/ferroelectric-ram-fram.jpg)


