Page 1
Simulation Study on Ventilation & Cooling for
Main Transformer Room of an Indoor Substation
Tingfang Yu and Huijuan Yang School of Mechanical and Electronic Engineering, Nanchang University, Nanchang, Jiangxi Province, China
Email: [email protected]
Rui Xu State Grid Jiangxi Electric Power Research Institute, Nanchang, China, 330006
Email: [email protected]
Chunhua Peng
School of Electrical & Electronics Engineering, East China Jiaotong University, Nanchang, Jiangxi Province, China
Email: [email protected]
Abstract—Based on natural ventilation design scheme for
main transformer room of an indoor substation, different
air distribution schemes were obtained by changing height
and size of air inlets and outlets. Three-dimensional
simulation of air distribution was conducted for the transformer room by using Computational Fluid Dynamics
(CFD) method. Ventilation & cooling effect of different
indoor ventilation schemes were simulated with software
FLUENT. By analyzing velocity fields and temperature
fields, influences of different design parameters on safety
and reliability of main transformer room of indoor
substation were compared and analyzed in details. Additionally, characteristics and change rules of air
distribution with different parameter variations were
concluded. Considerations of ventilation organization design
for main transformer room of indoor substation and
recommendation for better air distribution schemes were
provided. The research results also offered some guidance
for design and renovation of ventilation & cooling projects of transformer room.
Index Terms—CFD; Indoor Transformer Room; Ventilation
& Cooling; Simulation Study
I. INTRODUCTION
As electric power load of city center and difficulty of
land acquisition became more and more outstanding
problems in China, 110-220KV substations were more
arranged in an indoor manner [1, 2]. Heat dissipation and ventilation of indoor transformer were key problems for
rated output once the power transformers of high voltage
and large capacity were equipped indoors. In summer, existing indoor substations in many cities had problems
in ventilation and heat dissipation [3, 4]. Using empirical
formula for design and model test method were two
traditional ventilation design ways for indoor substations, however, the former one had poor computational
accuracy and the later one would increase cost of labor
and model for test equipment [2, 4]. In recent years,
continuous improvement of numerical simulation method
and rapid development of computing technology brought
more and more applications of Computational Fluid
Dynamics (CFD for short) in the field of fluid computation design. Wu Ming [5] discussed impact of
spacecraft flow field on stress and heat transfer of
spacecraft was analyzed by utilizing CFD technology,
and test time as well as design cost were reduced. Pan Sha [6] adopted CFD method to provide an effective way
of seakeeping prediction for ship sailing in oblique sea.
Zhou Jicheng [7] studied on the bubbly two-phase flow characteristics in twisted tube bundles, the method of
CFD was used out to analyze the effects which angles
between the major axis of the cylinder and vertical
direction (θ) and bubble diameters have on the motion behaviours of bubbly flow. Cheng Wei-Min[8] performed
research on eddy air-curtain dust controlled flow field in
hard rock mechanized driving face, mathematical model
of single-phase flow of gas was established based on the k- two-equation model and numerically simulated the
eddy air-curtain dust controlled flow field in hard rock
mechanized driving face with the help of FLUENT
software. With advantages of low cost, non-contact fluid field measurement and availability of detailed flow field
information, CFD was gradually applied in many other
aspects [9]. In the research field of indoor ventilation and
ventilation & cooling of indoor substation, Yi Jiang [10]
and Tang Zhen-chao [11] respectively used CFD to
analyze and calculate natural ventilation in buildings and conducted related study. With the aid of CFD method,
relevant analysis and study were conducted on indoor
ventilation & cooling of industrial building with residual
heat in reference [12]. Regarding to CFD application in design and analysis of ventilation schemes of substation,
related application studies were carried out to
underground and semi-underground substations in reference [13-16]. While references [17, 18] conducted
traditional analysis and comparison in aspects of
ventilation & cooling of urban indoor substations, but
1040 JOURNAL OF MULTIMEDIA, VOL. 9, NO. 8, AUGUST 2014
© 2014 ACADEMY PUBLISHERdoi:10.4304/jmm.9.8.1040-1047
Page 2
there were only a few studies using CFD numerical simulation means.
Xu Luwen [19] discussed a CFD (Computational Fluid
Dynamics) numerical model of the main transformer, and
analyzes the results with FLUENT software. The optimum heat dissipation effect with the optimum layout
of the air inlet and outlet was obtained by changing the
positions of the air inlet and outlet.T. vanHooff [20] Used the Computational Fluid Dynamics (CFD) to study
complex physical processes in the built environment
requires model validation by means of reduced-scale or
full-scale experimental data. CFD studies of natural ventilation of buildings in urban areas should be validated
concerning both the wind flow pattern around the
buildings and the indoor airflow driven by wind and buoyancy. R. Ramponi [21] presents the follow-up study
that focuses in more detail on validation with wind tunnel
measurements and on the effects of physical and
numerical diffusion on the cross-ventilation flow, validation of the coupled outdoor wind flow and indoor
air flow simulations is performed based on Particle Image
Velocimetry (PIV) measurements for four different
building configurations. In consideration of successful application of CFD in
various fields, using CFD numerical simulation
technology to carry out numerical simulation studies on ventilation & cooling air distribution for indoor
substations and to assist optimization design of
substations will be a new trend. With CFD method,
model modifications and simulation tests can be conveniently carried out according to electrical
equipment configurations, operation conditions, the
climate, terrain and surroundings of substations, to obtain
air flow fields and temperature fields of indoor substations under different design conditions and
optimize ventilation & cooling organization schemes as
well as verify the rationality of ventilation & cooling design schemes. Analysis bases for ventilation & cooling
system design of new indoor substations and for
ventilation & cooling optimization and renovation of
substations in service could be provided. In this study, Fluent, which is excellent CFD software,
was adopted to analyze the velocity field and temperature
field in the transformer room on the basis of natural
ventilation design schemes. Ventilation characteristics of different locations and sizes of air inlets and air outlets
were simulated. By changing boundary conditions of
various design parameters, a total of 22 groups working conditions were simulated and calculated to obtain
simulation results of each working condition. In this way,
change rules of impact of design parameter variations on
ventilation & cooling effect of the main transformer room in urban indoor substations were analyzed in accordance
with simulation results.
The rest of the paper is organized as follows: Section II describes natural ventilation design for the transformer
room, the parameters such as sizes and important
temperatures are given in table I. Section III describes
CFD numerical calculation model of the indoor substation, and boundary condition and parameter setting for
numerical simulation calculation are given. Section IV discusses numerical simulation results and comparison
analysis for different cases. Finally in Section V
conclusions are given.
II. NATURAL VENTILATION DESIGN FOR THE
TRANSFORMER ROOM
On the basis of Design Code for Substation (35kV-
110kV) (GB50059-92) [23], ventilation design was calculated for main transformer room of 110kV
substation. Design structural parameters of the
transformer room: the dimension of main transformer
room was 10m×10m×12m (length×width×height), the dimension of transformer was 5.42m×4.92m×5.63m
(length×width×height), and there were 16 sets of
radiators arranged in the same room with the transformer located in the center with a low arrangement. The lowest
location was 0.2m from the ground and was 2.29m from
the left and right walls and 2.54m from the front and back
walls. Figure 1 showed detailed structure of transformer room of the indoor substation.
Figure 1. Structure of transformer room
The natural ventilation design was based on thermal
pressure ventilation and ventilation design of the
transformer room was closely related to operation
parameters of the transformer. As stipulated in the national standard of China [23], for ventilation in
Summer, calculated temperature of the transformer room
should not exceed 35°C, air exhaust temperature should below 45°C and temperature difference between inlet and
outlet should not exceed 15°C. The original design
parameters were as below: for ventilation in Summer, the
design temperature was 30°C, the volume of ventilation and heat dissipation was 179.61kW and the air exhaust
temperature was 44°C.
Parameters such as sizes and locations of air inlets and
outlets, ventilation volume, temperature in working area and air exhaust temperature could be obtained in natural
ventilation design, see Table I for details.
Check results basing on measured data and air inlet temperature of 30°C showed that the natural ventilation
design could satisfy requirements of design standard; see
Table II for detailed check results.
JOURNAL OF MULTIMEDIA, VOL. 9, NO. 8, AUGUST 2014 1041
© 2014 ACADEMY PUBLISHER
Page 3
TABLE I. RESULTS SUMMARY OF NATURAL VENTILATION DESIGN
Item Calculated temperature
in Summer /°C
Height difference between
the air inlet and outlet /m
Location of
neutral plane /m
Dimension of the
air inlet /m Number of air inlets
Dimension of the
air outlet
Value 33 10 3.8 2.4×1.8 4 2.2×1.6
Item Number of air outlets Area ratio of the air inlet
and outlet
Air exhaust
temperature /°C m value
Average indoor
temperature /°C
Ventilation
volume kg/s
Value 4 1.24 44 0.6 42 17.78
TABLE II. RESULTS SUMMARY OF CHECKING CALCULATION
Check item Inlet air temperature /°C Location of neutral plane /m Air exhaust temperature /°C Ventilation volume kg/s
Checking result 30 3.8 39 19.8
TABLE III. THE SIMULATION RESULTS OF DIFFERENT OUTLET ELEVATION
Elevation C(8.8m) B(9.8m) A(design) D(roof)
Air exhaust temperature /K 314.4 313.73 312.64 312.65
Air exhaust volume /kg/s 7.81 8.34 9.28 9.18
Average temperature of upper working area /K 311.96 311.21 309.99 309.68
Average temperature of working area /K 304.44 304.42 304.41 304.42
Notes: air exhaust parameters were average parameters of cross section of air outlet and the working area refers to the area within 2.6m above the
ground
Figure 2. The calculation model
III. ESTABLISHMENT OF NUMERICAL CALCULATION
MODEL
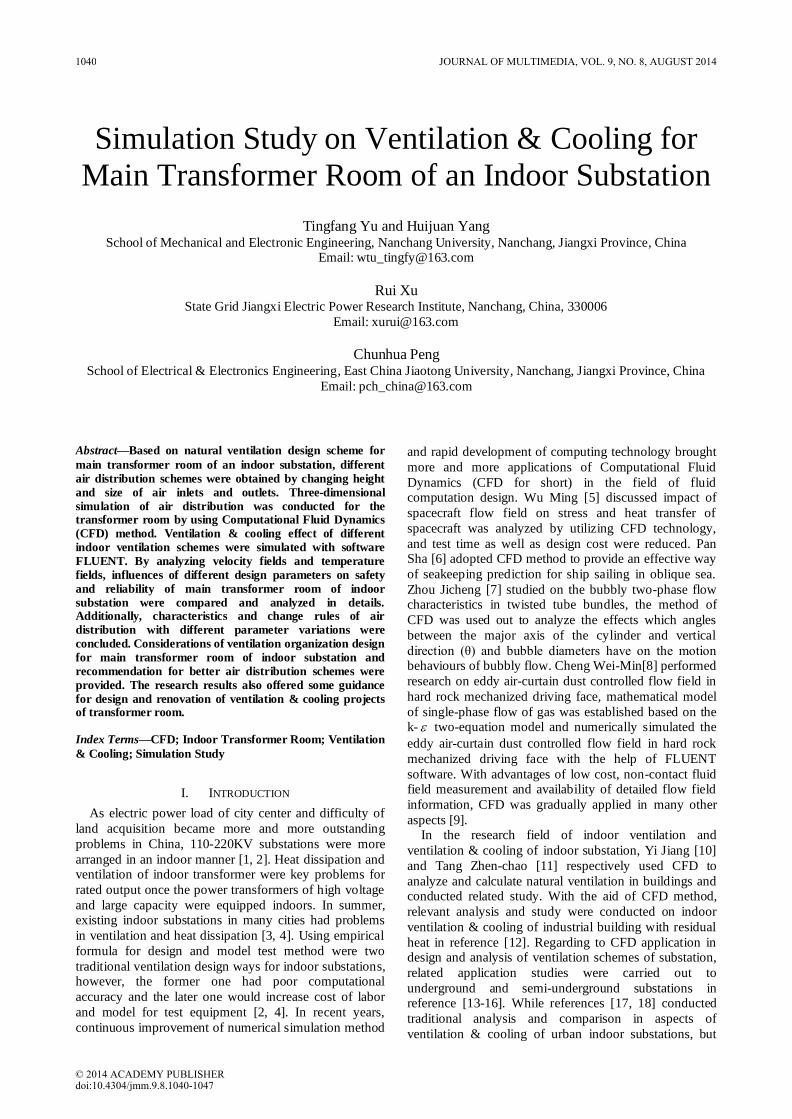
A. Simulation Object Analysis
In consideration of the symmetrical structure of the main transformer room and calculation amount, only half
of the physical computational model established was
considered here. Simplification was made to the transformer and radiator as the transformer was
complicated, see Figure 2 for three-dimensional diagram
of the computational model. As shown in the figure, there
were 4 air inlets symmetrically arranged in front and back walls, the size of the air inlet was 2.4m×1.8m×0.3m, area
of air inlet was 17.7m2, the distance between center lines
was 3m and the lower edge was 0.2m from the bottom.
There were 4 air outlets symmetrically arranged with 2 arranged in the front wall and 2 in the back wall, the size
of the air outlet was 2.2m×1.6m×0.3m, the distance
between center lines was 3.8m and the center line was 1.2m from the top.
Figure 2 was the 3D physical model established with
Gambit. Hexahedral grid was used to divide grids with
grid spacing of 0.1-0.2m.
B. Mathematical Model
Air ventilation and heat transfer problem of the main transformer in indoor substation is the object of our study,
the flow of air complied with the following basic
equation: a) Continuity equation:
0u v w
t x y z
(1)
b) Navier-Stokes equations:
2
2 2 2
2 2 2
2
2 2 2
2 2 2
2
2 2 2
2 2 2
( )
( )
(
x
y
z
uu uv uw
t x y z
p u u uF a
x x y z
vv uv vw
t x y z
p v v vF b
x x y z
ww uw vw
t x y z
p w w wF c
x x y z
)
(2)
where in, ρ is the fluid density, u, v, w is the velocity component of the fluid at the point of (x, y, z) under time
of t, p is pressure, μ is the fluid dynamic viscosity, Fx, Fy,
Fz are the mass force of x, y, z direction respectively .
c) Energy conservation equation
h
p p p
T uT vT wT
t x y z
T T TS
x c x y c y z c z
(3)
where in T is temperature, λ is the thermal conductivity of
the fluid, Cp is the specific heat capacity of fluid, Sk for the entry of the fluid within the heat source.
1042 JOURNAL OF MULTIMEDIA, VOL. 9, NO. 8, AUGUST 2014
© 2014 ACADEMY PUBLISHER
Page 4
X Y
Z
Temperature
330.00
328.96
327.92
326.88
325.85
324.81
323.77
322.73
321.69
320.65
319.62
318.58
317.54
316.50
315.46
314.42
313.38
312.35
311.31
310.27
309.23
308.19
307.15
306.12
305.08
304.04
303.00
X Y
Z
Temperature
330.00
328.96
327.92
326.88
325.85
324.81
323.77
322.73
321.69
320.65
319.62
318.58
317.54
316.50
315.46
314.42
313.38
312.35
311.31
310.27
309.23
308.19
307.15
306.12
305.08
304.04
303.00
X Y
Z
Temperature
330.00
328.96
327.92
326.88
325.85
324.81
323.77
322.73
321.69
320.65
319.62
318.58
317.54
316.50
315.46
314.42
313.38
312.35
311.31
310.27
309.23
308.19
307.15
306.12
305.08
304.04
303.00
X Y
Z
Temperature
330.00
328.96
327.92
326.88
325.85
324.81
323.77
322.73
321.69
320.65
319.62
318.58
317.54
316.50
315.46
314.42
313.38
312.35
311.31
310.27
309.23
308.19
307.15
306.12
305.08
304.04
303.00 (a) h=8.8m (b) h=9.8m (c) h=10.8m (d) top h=12m
Figure 3. Comparison of temperature field of x =3.4m cross section under different air out elevations
X Y
Z
Z Velocity
1.80
1.66
1.53
1.39
1.25
1.12
0.98
0.84
0.71
0.57
0.43
0.29
0.16
0.02
-0.12
-0.25
-0.39
-0.53
-0.66
-0.80
x=3.4 velocity field outlet in the top
X Y
Z
Z Velocity
1.80
1.65
1.51
1.36
1.21
1.06
0.92
0.77
0.62
0.47
0.33
0.18
0.03
-0.12
-0.26
-0.41
-0.56
-0.71
-0.85
-1.00
x=3.4 velocity field outlet in 10.8
X Y
Z
Z Velocity
1.80
1.63
1.46
1.29
1.13
0.96
0.79
0.62
0.45
0.28
0.12
-0.05
-0.22
-0.39
-0.56
-0.73
-0.89
-1.06
-1.23
-1.40
x=3.4 velocity field outlet in 9.8
X Y
Z
Z Velocity
1.80
1.64
1.48
1.33
1.17
1.01
0.85
0.69
0.54
0.38
0.22
0.06
-0.09
-0.25
-0.41
-0.57
-0.73
-0.88
-1.04
-1.20
x=3.4 velocity field outlet in 8.8
Figure 4. Comparison of velocity vector distribution of x =3.4m cross section under different air out elevations
X Y
Z
Temperature
327.923
324.808
321.692
318.577
315.462
312.346
309.231
306.115
303
x=3.1 temperature field ( design (2.2 X 1.6))
X Y
Z
Temperature
327.923
324.808
321.692
318.577
315.462
312.346
309.231
306.115
303
x=3.1 temperature field(2.2 X 1.8(up)
X Y
Z
Temperature
327.92324.81321.69318.58315.46312.35309.23306.12303.00
X Y
Z
Temperature
327.923
324.808
321.692
318.577
315.462
312.346
309.231
306.115
303
x =3.1 temperature field (2.2 X 1.4 (down ))
(a) Scheme (1) (b) Scheme (2) (c) Scheme (3) (d) Scheme (4)
Figure 5. Comparison of temperature field of x=3.4m cross section under different air outlet area
Y X
Z
Temperature
330
328.962
327.923
326.885
325.846
324.808
323.769
322.731
321.692
320.654
319.615
318.577
317.538
316.5
315.462
314.423
313.385
312.346
311.308
310.269
309.231
308.192
307.154
306.115
305.077
304.038
303
y=4 temperature field inlet Z= 0.4
Y X
Z
Temperature
330328.962327.923326.885325.846324.808323.769322.731321.692320.654319.615318.577317.538316.5315.462314.423313.385312.346311.308310.269309.231308.192307.154306.115305.077304.038303
y=4 temeprature field inelt Z=1.2
Y X
Z
Temperature
330.00
328.96
327.92
326.88
325.85
324.81
323.77
322.73
321.69
320.65
319.62
318.58
317.54
316.50
315.46
314.42
313.38
312.35
311.31
310.27
309.23
308.19
307.15
306.12
305.08
304.04
303.00
y=4 temperature field inlet Z=2.6
(a) h=0.4m (b) h=1.2m c) h=2.6m
Figure 6. Comparison of Temperature Field of Y=4m under Different Inlet Elevations
JOURNAL OF MULTIMEDIA, VOL. 9, NO. 8, AUGUST 2014 1043
© 2014 ACADEMY PUBLISHER
Page 5
TABLE IV. NUMERICAL SIMULATION RESULTS OF DIFFERENT AIR OUTLET AREAS
Air outlet cross section 2.2m×1.4m 2.2m×1.6m 2.4m×1.6m 2.2m×1.8m
Air exhaust volume /kg/s 8.795 9.280 9.678 9.989
Air exhaust temperature /K 313.146 312.641 312.203 311.867
Average temperature of working area /°C 304.413 304.415 304.395 304.386
Notes: air exhaust parameters were average parameters of cross section of air outlet and the working area refers to the area within 2.6m above the
ground
TABLE V. THE SIMULATION RESULTS IN DIFFERENT INLET AREA
Width (m)× height
(m)
Air exhaust volume
/kg/s
Air exhaust temperature
/K
Average temperature of upper working
area /K
Average temperature of the working
area /K
1.8m×1.8m 9.246 312.637 310.802 304.922
2.0m×1.8m 9.252 312.630 310.473 304.693
2.4m×1.6m 9.251 312.645 310.246 304.540
2.4m×1.8m 9.280 312.641 309.990 304.415
2.6m×1.8m 9.283 312.618 309.828 304.349
2.4m×2.0m 9.321 312.577 309.817 304.335
2.8m×1.8m 9.282 312.617 309.735 304.260
2.4m×2.2m 9.339 312.560 309.672 304.284
The CFD simulations are performed with the 3D steady Reynolds-Averaged Navier–Stokes (RANS)
approach with the standard k-ε turbulence model to
provide closure [22]. As follows:
d)Turbulent kinetic energy (TKE, k):
( ) ( )j ji t k i
i i k i j i i
u uku v x uv
x x x x x x
(4)
e) Energy dissipation rate (ε ):
2
1 2( ) ( )j ji t i
i i k i j i i
u uu v ukC v C
x x x k x x x k
(5)
The turbulent viscosity (vt) is calculated in terms of k and
by:
2
t
kv C
(6)
where in the modeling constants C1ε ,C2ε , Cμ , k , s
are 1.44, 1.92, 0.09, 1.0 and 1.3, respectively.
C. Boundary Condition and Parameter Setting
Indoor air flow was considered as 3D stable-state flow in this article and the driving force was thermal buoyancy
(i.e. natural convection) [24, 25]. In calculation, 3D
stable-state solution basing on separation solution was
applied, and standard k-ε turbulence model and Boussinesq model were used to treat buoyancy.
SIMPLEC velocity coupling method was adopted. In
addition, the default relaxation factor was used due to
flow of strong body forces. For pressure term, body force weighted schemes was used and the second upwind
scheme was used for remain spatial discretization
schemes to increase accuracy of the result. Boundary condition: to be conforming to the principle
of thermal pressure ventilation, pressure inlet of the air
inlet and pressure outlet of the air outlet were adopted.
For other boundaries, wall boundary condition was used.
Heat flux of the radiator wall was 1122w/m2 and other walls were adiabatic boundaries.
IV. NUMERICAL SIMULATION RESULTS AND ANALYSIS
To analyze the influence of sizes and locations of air
inlets and outlets on ventilation & cooling effect of the transformer room, 22 schemes were developed in this
article, including ventilation & cooling schemes of
changing height and size of air inlets and outlets. Characteristics of ventilation air distribution and change
rules of ventilation & cooling effect under various
parameter variations were analyzed in a detailed manner.
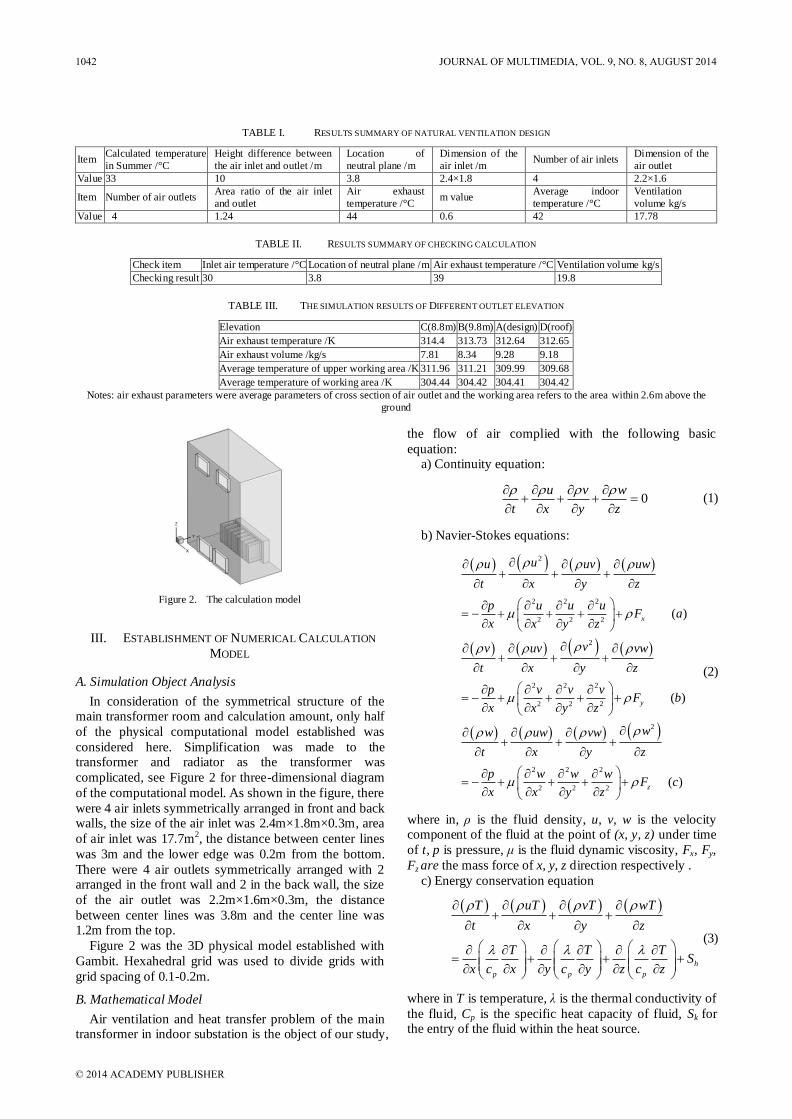
A. Impact of Air Outlet Elevation on Ventilation Effect
To compare impacts of air outlet elevation on indoor
ventilation & cooling, four types of air outlet elevation were simulated, including design parameters of 10.8m
(A), elevation 9.8m (B), elevation 8.8m (C) and building
roof elevation 12m (D). The numerical simulation results are listed in Table III and the temperature field and
velocity field are shown in Figures 3 and 4.
As data in Table III shows, in the case of arranging air
outlets at sides of walls (front and back walls), the air exhaust volume would increase and the air exhaust
temperature would reduce as elevation increased. The
main reason was thermal pressure, which was the main
driving force of natural ventilation, increased as elevation increased, thus air exhaust volume increased. It showed
that height increase would improve indoor ventilation &
cooling effect. The temperature field in Figure 3 and the velocity field
in Figure 4 showed that: 1) elevation reduction of air
outlets largely impacted the velocity field of the top area.
Local recirculation zone formed at the top due to high temperature air flow, which caused obvious differences in
temperature fields of the top area. The lower the air outlet
elevation was, the higher the overall temperature of the
top area would be; 2) it was mainly controlled by air inlet parameters in the working area, thermal plumes were not
intensively mixed, temperature of the working area was
therefore low; 3) neutral plane, which was a thermal
1044 JOURNAL OF MULTIMEDIA, VOL. 9, NO. 8, AUGUST 2014
© 2014 ACADEMY PUBLISHER
Page 6
separation layer, existed at a certain height. The layer increased as the air outlet location rose. Distinct
temperature gradient existed below the thermal separation
layer, while the temperature gradient above the layer was
small. Resistance of high temperature air flow elimination
reduced as air outlet height increased, which facilitated
air flow elimination and was conducive to indoor ventilation & cooling. Under the current building
structure, indoor high temperature air would form
vortexes when the air outlet was arranged too low, which
would increase overall temperature in indoor working area and enlarge the high temperature area. As a result,
air outlets should be arranged as high as possible during
design.
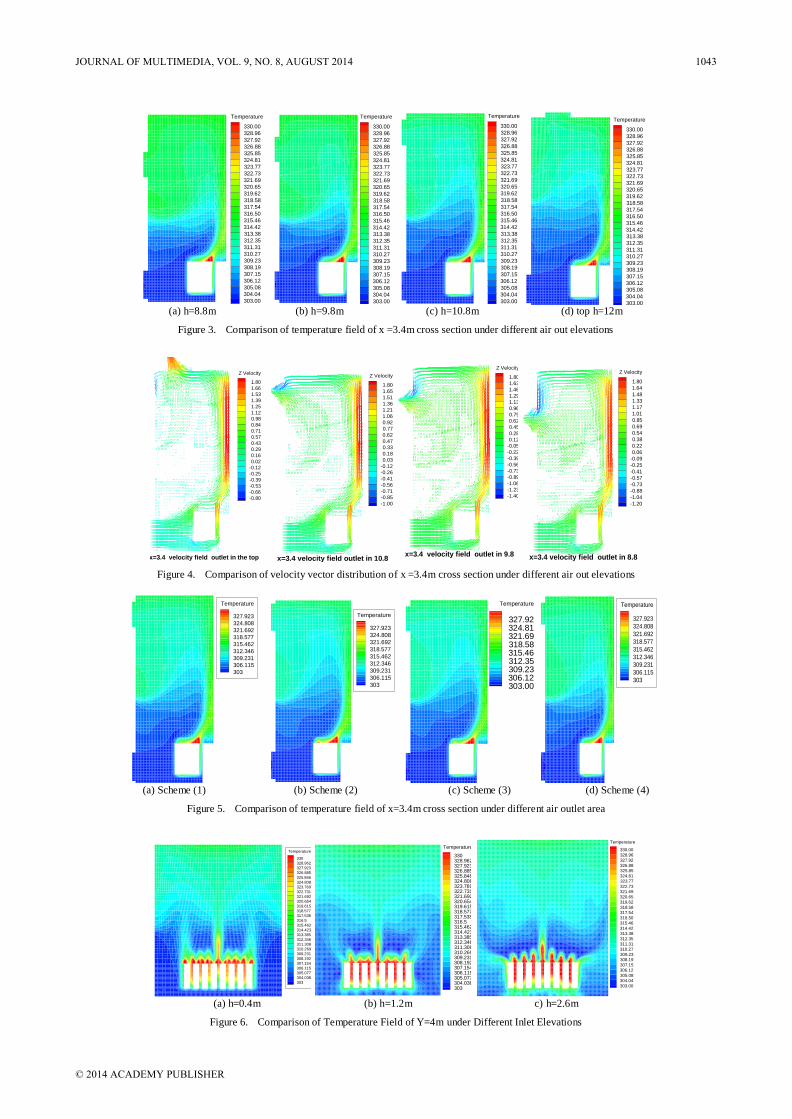
B. Impact of Air Outlet Area on Ventilation Effect
To obtain the impact of air outlet area on ventilation effect, working conditions under 4 different air outlet
areas (including the design scheme) were simulated.
Corresponding air outlet sizes are shown as follows:
(1) Design parameter 2.2m×1.6m (2) Cross section size 2.2m×1.8m
(3) Cross section size 2.4m×1.6m
(4) Cross section size 2.2m×1.4m
Numerical simulation results of different areas are shown in Table IV and Figure 5. As Table 4 shows, air
exhaust volume increased obviously as the area of air
outlet increased, as a result, temperature of indoor parts reduced. Additionally, air flow elimination resistance
reduced due to the increased area, residence time of high
temperature air flow in the room therefore reduced.
Vortexes around the air ports were weakened, which largely facilitated the improvement of indoor temperature
distribution.
It is observed from temperature field of X=3.4m cross section in Figure 5 that, temperature fields under different
air outlet areas differed obviously. Indoor high
temperature areas reduced as the air outlet area increased.
Downward backflow of high temperature air flow at the top was weakened and distinct difference existed between
temperature fields in the top area. Impact of air outlet
area on temperature fields in working area was small. As
the air outlet area increased, rising of thermal plumes would increase.
However, in actual projects, air outlets were in the type
of ventilation skylights. Larger air outlets cost more and noise suppression effect on the main transformer room
would reduce, thus outdoor noise would exceed limits.
This was an important consideration in practice.
C. Impact of Air Inlet Elevation on Ventilation Effect
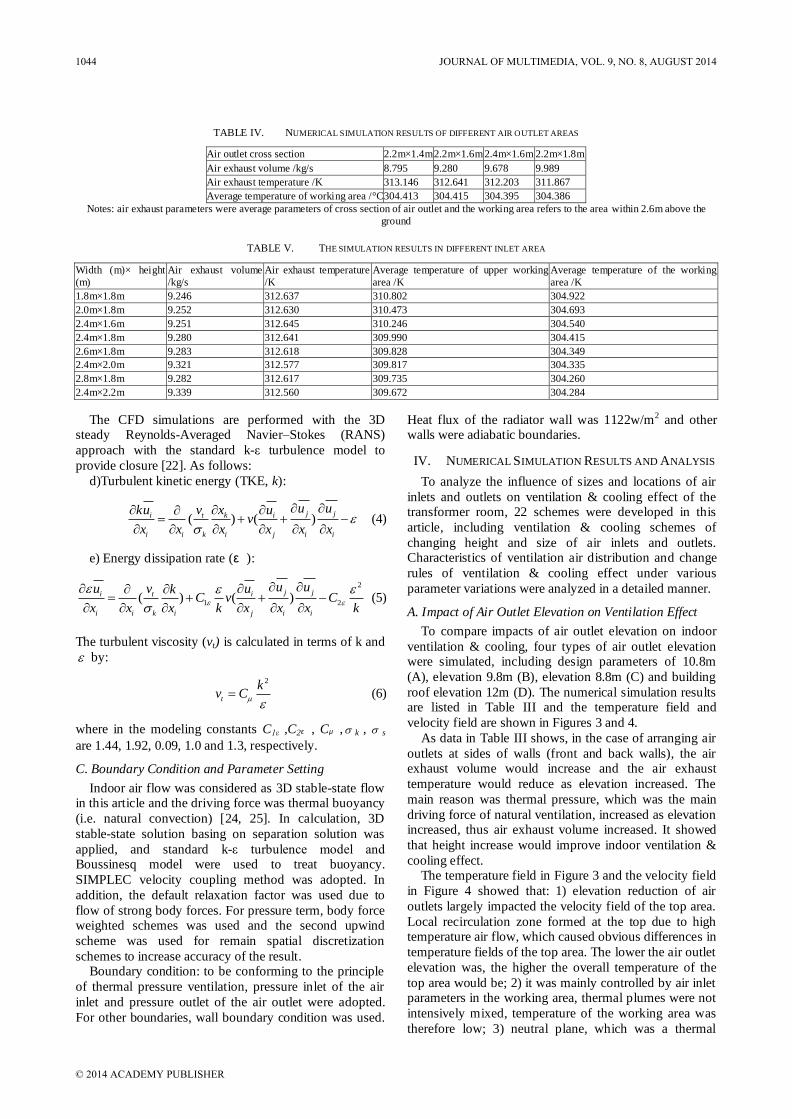
To analyze the impact of air inlet elevation on indoor
ventilation & cooling, 9 different air inlet elevations (height of air inlets above the ground) were simulated in
this article. Heights (m) of elevations above the ground
were within the range of 0.2m-2.6m. For simulation results of temperature fields and numerical simulation
trends, please refer to Figure 6 and 7 respectively.
Figure 6 is the comparison of temperature field of
Y=4m cross section under different inlet elevations. High
temperature areas around radiator in the working area enlarged as air inlet elevation increased. Vortexes of large
area emerged and high temperature area in the working
area expanded obviously. The overall temperature field
distribution was in a mess and sections existed in temperature distribution, which was bad for heat
discharge.
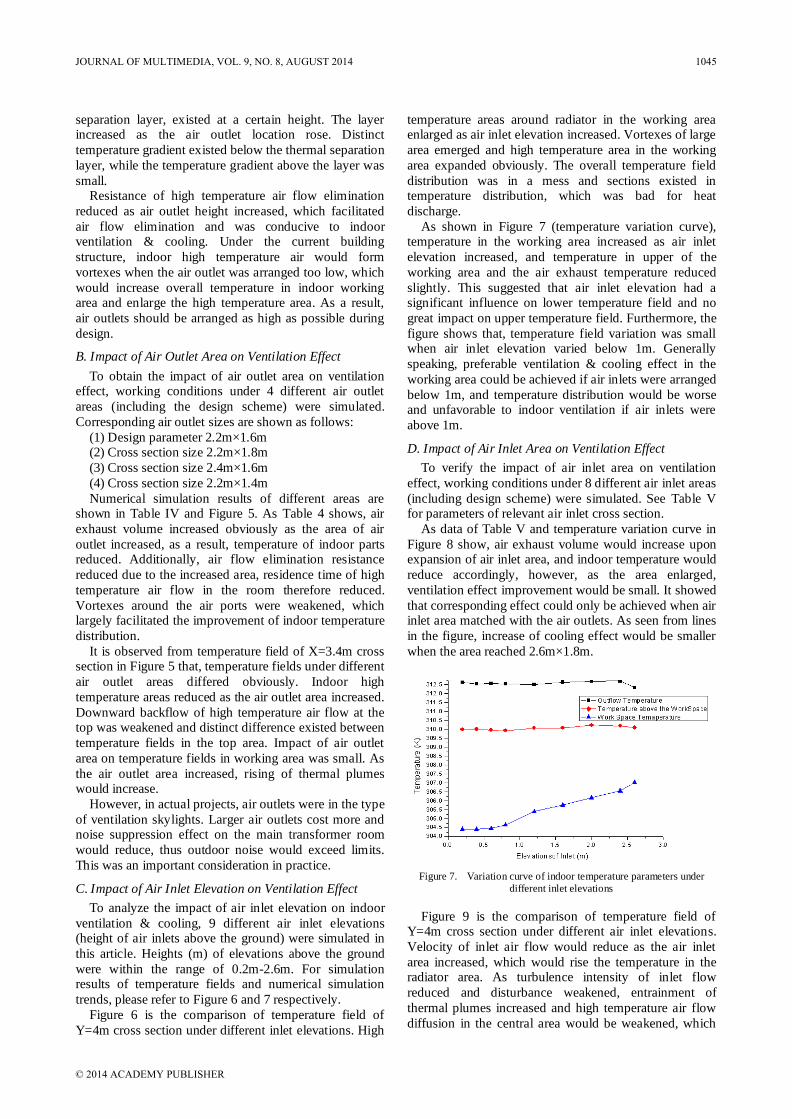
As shown in Figure 7 (temperature variation curve), temperature in the working area increased as air inlet
elevation increased, and temperature in upper of the
working area and the air exhaust temperature reduced
slightly. This suggested that air inlet elevation had a significant influence on lower temperature field and no
great impact on upper temperature field. Furthermore, the
figure shows that, temperature field variation was small when air inlet elevation varied below 1m. Generally
speaking, preferable ventilation & cooling effect in the
working area could be achieved if air inlets were arranged
below 1m, and temperature distribution would be worse and unfavorable to indoor ventilation if air inlets were
above 1m.
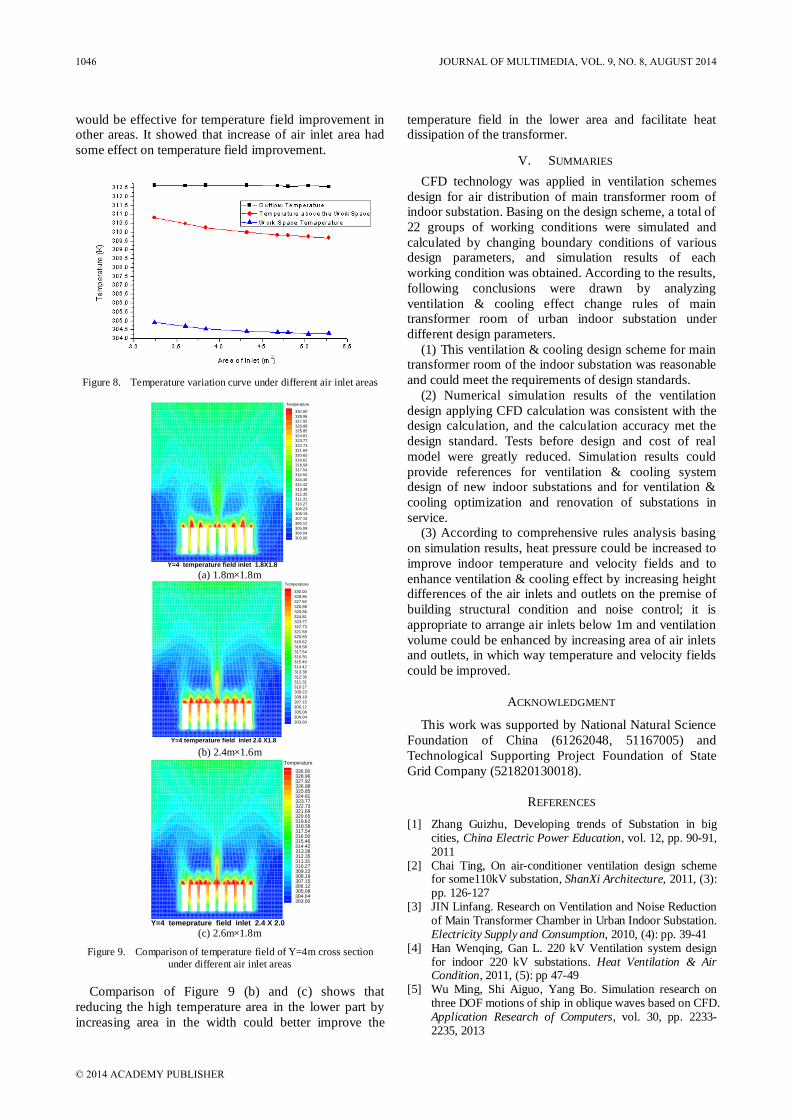
D. Impact of Air Inlet Area on Ventilation Effect
To verify the impact of air inlet area on ventilation
effect, working conditions under 8 different air inlet areas
(including design scheme) were simulated. See Table V for parameters of relevant air inlet cross section.
As data of Table V and temperature variation curve in
Figure 8 show, air exhaust volume would increase upon expansion of air inlet area, and indoor temperature would
reduce accordingly, however, as the area enlarged,
ventilation effect improvement would be small. It showed
that corresponding effect could only be achieved when air inlet area matched with the air outlets. As seen from lines
in the figure, increase of cooling effect would be smaller
when the area reached 2.6m×1.8m.
Figure 7. Variation curve of indoor temperature parameters under
different inlet elevations
Figure 9 is the comparison of temperature field of Y=4m cross section under different air inlet elevations.
Velocity of inlet air flow would reduce as the air inlet
area increased, which would rise the temperature in the radiator area. As turbulence intensity of inlet flow
reduced and disturbance weakened, entrainment of
thermal plumes increased and high temperature air flow
diffusion in the central area would be weakened, which
JOURNAL OF MULTIMEDIA, VOL. 9, NO. 8, AUGUST 2014 1045
© 2014 ACADEMY PUBLISHER
Page 7
would be effective for temperature field improvement in other areas. It showed that increase of air inlet area had
some effect on temperature field improvement.
Figure 8. Temperature variation curve under different air inlet areas
Y X
Z
Temperature
330.00
328.96
327.92
326.88
325.85
324.81
323.77
322.73
321.69
320.65
319.62
318.58
317.54
316.50
315.46
314.42
313.38
312.35
311.31
310.27
309.23
308.19
307.15
306.12
305.08
304.04
303.00
Y=4 temperature field inlet 1.8X1.8 (a) 1.8m×1.8m
Y X
ZTemperature
330.00
328.96
327.92
326.88
325.85
324.81
323.77
322.73
321.69
320.65
319.62
318.58
317.54
316.50
315.46
314.42
313.38
312.35
311.31
310.27
309.23
308.19
307.15
306.12
305.08
304.04
303.00
Y=4 temperature field inlet 2.6 X1.8 (b) 2.4m×1.6m
Y X
Z
Temperature
330.00328.96327.92326.88325.85324.81323.77322.73321.69320.65319.62318.58317.54316.50315.46314.42313.38312.35311.31310.27309.23308.19307.15306.12305.08304.04303.00
Y=4 temeprature field inlet 2.4 X 2.0 (c) 2.6m×1.8m
Figure 9. Comparison of temperature field of Y=4m cross section
under different air inlet areas
Comparison of Figure 9 (b) and (c) shows that
reducing the high temperature area in the lower part by
increasing area in the width could better improve the
temperature field in the lower area and facilitate heat dissipation of the transformer.
V. SUMMARIES
CFD technology was applied in ventilation schemes
design for air distribution of main transformer room of indoor substation. Basing on the design scheme, a total of
22 groups of working conditions were simulated and
calculated by changing boundary conditions of various design parameters, and simulation results of each
working condition was obtained. According to the results,
following conclusions were drawn by analyzing
ventilation & cooling effect change rules of main transformer room of urban indoor substation under
different design parameters.
(1) This ventilation & cooling design scheme for main transformer room of the indoor substation was reasonable
and could meet the requirements of design standards.
(2) Numerical simulation results of the ventilation
design applying CFD calculation was consistent with the design calculation, and the calculation accuracy met the
design standard. Tests before design and cost of real
model were greatly reduced. Simulation results could
provide references for ventilation & cooling system design of new indoor substations and for ventilation &
cooling optimization and renovation of substations in
service. (3) According to comprehensive rules analysis basing
on simulation results, heat pressure could be increased to
improve indoor temperature and velocity fields and to
enhance ventilation & cooling effect by increasing height differences of the air inlets and outlets on the premise of
building structural condition and noise control; it is
appropriate to arrange air inlets below 1m and ventilation
volume could be enhanced by increasing area of air inlets and outlets, in which way temperature and velocity fields
could be improved.
ACKNOWLEDGMENT
This work was supported by National Natural Science
Foundation of China (61262048, 51167005) and
Technological Supporting Project Foundation of State
Grid Company (521820130018).
REFERENCES
[1] Zhang Guizhu, Developing trends of Substation in big cities, China Electric Power Education, vol. 12, pp. 90-91, 2011
[2] Chai Ting, On air-conditioner ventilation design scheme for some110kV substation, ShanXi Architecture, 2011, (3): pp. 126-127
[3] JIN Linfang. Research on Ventilation and Noise Reduction of Main Transformer Chamber in Urban Indoor Substation. Electricity Supply and Consumption, 2010, (4): pp. 39-41
[4] Han Wenqing, Gan L. 220 kV Ventilation system design for indoor 220 kV substations. Heat Ventilation & Air Condition, 2011, (5): pp 47-49
[5] Wu Ming, Shi Aiguo, Yang Bo. Simulation research on three DOF motions of ship in oblique waves based on CFD. Application Research of Computers, vol. 30, pp. 2233-2235, 2013
1046 JOURNAL OF MULTIMEDIA, VOL. 9, NO. 8, AUGUST 2014
© 2014 ACADEMY PUBLISHER
Page 8
[6] Pan Sha, Li Hua, Xia Zhi-xun. High-Performance Parallel Computation Application for Aerospace CFD Numerical Simulation. Computer Engineering and Science, vol. 34, pp. 191-198, 2012
[7] Zhou Jicheng, Zhu Dongsheng. Study on bubbly two-phase flow across twisted tube bundles based on quasi 3D high speed video. Journal of Multimedia, vol. 8, n 6, pp. 823-829, 2013
[8] Cheng Wei-Min, Research on eddy air-curtain dust controlled flow field in hard rock mechanized driving face. Journal of Networks, vol. 8, n 2, pp. 453-460, February 2013
[9] Peng, Zhou. Implementation of optimal pacing scheme in xinjiang's oil and gas pipeline leak monitoring network, Journal of Networks, vol. 6, n 1, pp. 54-61, 2011
[10] Yi Jiang, Qinyan Chen. Study of natural ventilation in building by large eddy simulation. Journal of wind engineering and industrial aerodynamics, vol. 89, pp. 1155-1178., 2001
[11] Tang Zhen-chao, Zhan Jie-ming. Application of CFD to the Research of Air Flow in Room. 17th National Symposium hydrodynamic hydrodynamic Sixth National Conference Proceedings, 2003:8.
[12] Wan Xin. Numerieal Simulation of Natural Ventilation in Industrial Plant with Heat source. Mater Dissertation, Donghua University, 2008.
[13] Juan Carlos Ramos, Maximiliano Beiza, Jon Gastelurrutia, Alejandro Rivas, Raúl Antón, Gorka S. Larraona, Iván de Miguel, Numerical modeling of the natural ventilation of underground transformer substations, Applied Thermal Engineering, Vol. 51, Issues 1–2, pp. 852-863, March 2013.
[14] YANG Xiao-ping, LIU Gang, YANG Qi-cai. Numerical Simulation on Cooling and Ventilation of Transformer Room in Underground Transformer Substation. Building Energy&Environment, 2011, (1) pp. 94-96
[15] HUANG Qiang, LIU Xin, CHEN Lei. Study on Air Distribution in Transformer Plants of Substations of Metro Stations: Case Study on a Station of Tianjin Metro. Tunnel Construction, 2010, (4): pp. 396-401
[16] HU Wen-bin, LIU Li-na. Discussion of ventilation and air flow distribution in semi-underground transformer substation. Journal of Harbin University of Commerce ( Natural Sciences Edition), 2011, (3): pp. 346-349
[17] GUO Sheng, HUANG Wei, XUE Lin. Ventilation mode of indoor substation based on integrated environmental control technology. Journal Of Beijing Jiaotong University, 2013, (3): pp. 19-26
[18] SHU Li-fan, HU Wen-bin, CHEN Ming-lan, et al. Research on Hybrid Ventilation Mode of Indoor Substation. Building Science, 2012, (2): pp. 84-87
[19] XU Luwen, WANG Guochao, DING Jun et al. The CFD Numerical Simulation on Ventilation of Indoor Transformer Substation. Hydromechatronics Engineering, Vol. 41, No. 18: pp. 141-144., 2013
[20] T. vanHooff, B. Blocken. Full-scale measurements of indoor environmental conditions and natural ventilation in a large semi-enclosed stadium: Possibilities and limitations for CFD validation. Journal of Wind Engineering and Industrial Aerodynamics, 2012, (104-106): pp. 330-341.
[21] R. Ramponi, B. Blocken. CFD simulation of cross-ventilation flow for different isolated building configurations: Validation with wind tunnel measurements and analysis of physical and numerical diffusion effects. Journal of Wind Engineering and Industrial Aerodynamics, 104–106 (2012) : pp. 408–418
[22] James O. P. Cheung, Chun-Ho Liu. CFD simulations of natural ventilation behaviour in high-rise buildings in regular and staggered arrangements at various spacings.
Energy and Buildings, vol. 43, pp. 1149–1158, 2011
[23] PRC Ministry of Construction. GB50059-92 35~110kv Substation design specifications.
[24] Chen Yu Xu Zhihao Ma Guochuan. The Study about CFD Algorithms of Natural Ventilation. Refrigeration and Air Conditioning, 2011, (1): pp. 78-81
[25] Duan Shuangping, Zhang Guoqiang, Peng Jianguo, etal. Development in research of natural ventilation, Heat Ventilation & Air Condition, vol. 34, pp. 22-28, 2004
Tingfang Yu received the B. Tech degree in thermal power engineering from Shanghai University of Electric Power, Shanghai, China, 1991 and the M.S. and Ph.D. degrees in thermal power engineering from the Southeast University, Nanjin , China, in 1998 and 2004, respectively.
He is currently an Associate Professor of Thermal Power Engineering with the School of Mechanical and electronic Engineering, Nanchang University, Nanchang, China. He has authored or coauthored over 20 research papers in journals and conferences, His current research interests are in the field of coal-fired boiler combustion and optimization algorithm
Huijuan Yang received the B. Tech degree in Thermal Power Engineering from, Nanchang University, Nanchang, China, 2013. He is currently a graduate student of Thermal Power Engineering in Nanchang University, Nanchang, China.
JOURNAL OF MULTIMEDIA, VOL. 9, NO. 8, AUGUST 2014 1047
© 2014 ACADEMY PUBLISHER