Israel, West Bank, and Jordan Israel, West Bank, and Jordan E. Weinroth E. Weinroth , M. Luria, A. Ben-Nun, C. Emery, J. Kaplan, , M. Luria, A. Ben-Nun, C. Emery, J. Kaplan, M. Peleg M. Peleg and Y. Mahrer and Y. Mahrer Seagram Center for Soil and Water Sciences Faculty of Seagram Center for Soil and Water Sciences Faculty of Agriculture Agriculture The Hebrew University Rehovot 76100 Israel The Hebrew University Rehovot 76100 Israel [email protected][email protected]S. Kasakseh S. Kasakseh , Applied Research Institute Jerusalem , Applied Research Institute Jerusalem Bethlehem, West Bank Bethlehem, West Bank J. Safi, Environmental Protection Research J. Safi, Environmental Protection Research Institute Institute Gaza City, Gaza Gaza City, Gaza R. Bornstein R. Bornstein , Dept. of Meteorology, San Jose State , Dept. of Meteorology, San Jose State University, University, San Jose, CA, USA San Jose, CA, USA Atmospheric Sciences and Air Quality Conference Atmospheric Sciences and Air Quality Conference 27–29 April 2005, San Francisco, California 27–29 April 2005, San Francisco, California
Transcript
Simulations of ozone over Simulations of ozone over Israel, West Bank, and JordanIsrael, West Bank, and Jordan
E. WeinrothE. Weinroth, M. Luria, A. Ben-Nun, C. Emery, J. Kaplan, M. Peleg, M. Luria, A. Ben-Nun, C. Emery, J. Kaplan, M. Pelegand Y. Mahrerand Y. Mahrer
Seagram Center for Soil and Water Sciences Faculty of AgricultureSeagram Center for Soil and Water Sciences Faculty of AgricultureThe Hebrew University Rehovot 76100 IsraelThe Hebrew University Rehovot 76100 Israel
S. KasaksehS. Kasakseh, Applied Research Institute Jerusalem, Applied Research Institute JerusalemBethlehem, West BankBethlehem, West Bank
J. Safi, Environmental Protection Research InstituteJ. Safi, Environmental Protection Research InstituteGaza City, Gaza Gaza City, Gaza
R. BornsteinR. Bornstein, Dept. of Meteorology, San Jose State University, , Dept. of Meteorology, San Jose State University, San Jose, CA, USASan Jose, CA, USA
Atmospheric Sciences and Air Quality ConferenceAtmospheric Sciences and Air Quality Conference27–29 April 2005, San Francisco, California 27–29 April 2005, San Francisco, California
(4) Conduct field campaigns during periods conducive to poor regional AQ
(5) Apply (5) Apply RAMS & MM5 toRAMS & MM5 to CAMxCAMx to increase to increase understanding of current & future air understanding of current & future air quality problemsquality problems
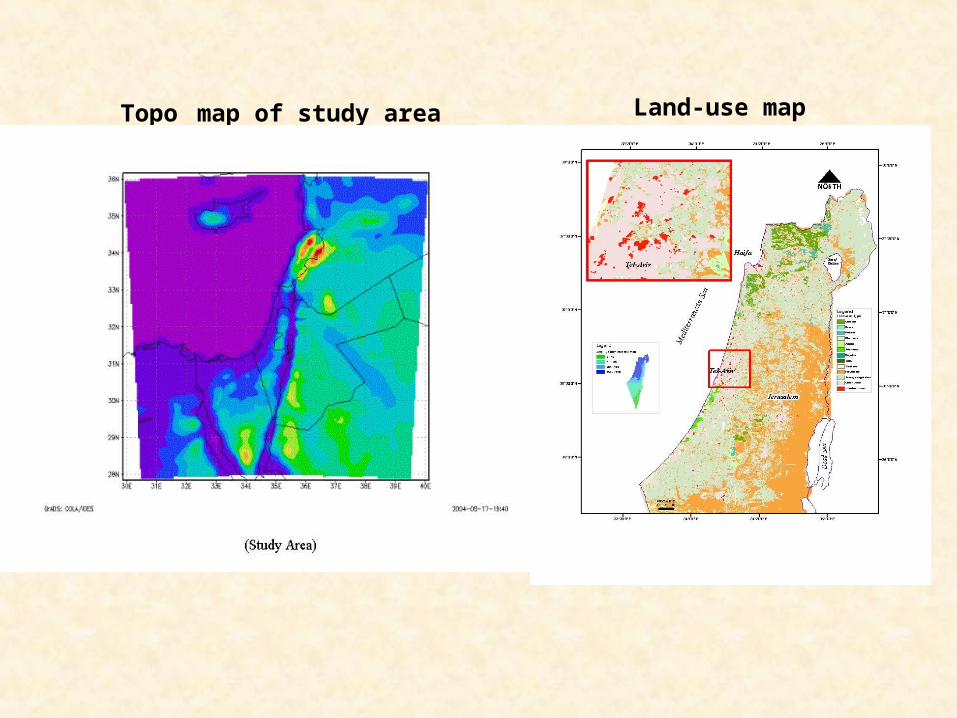
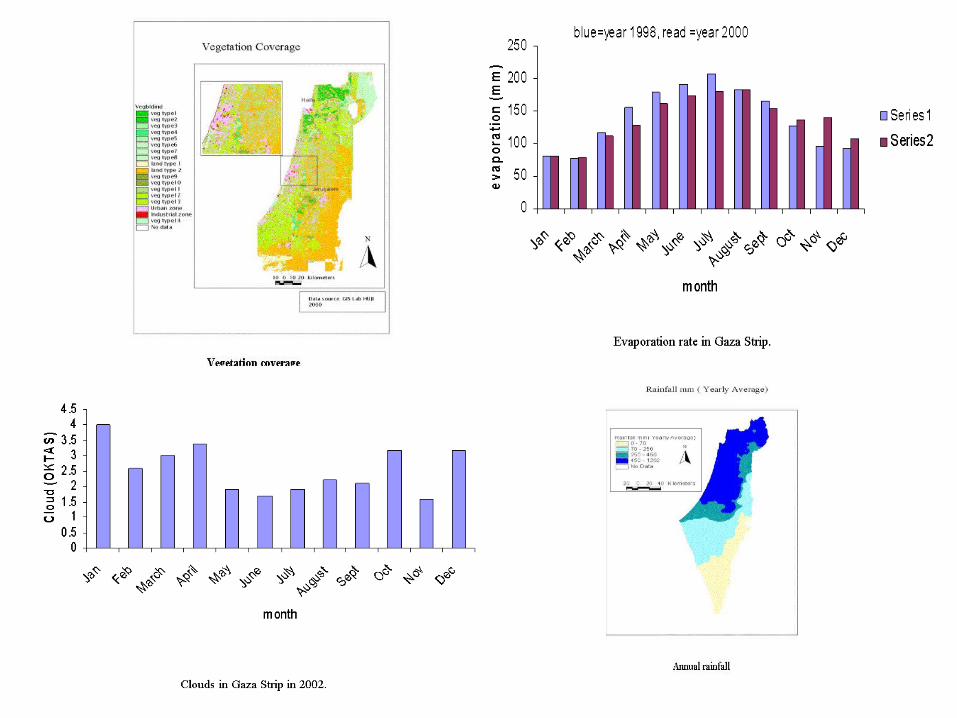
Topo map of study area Land-use map
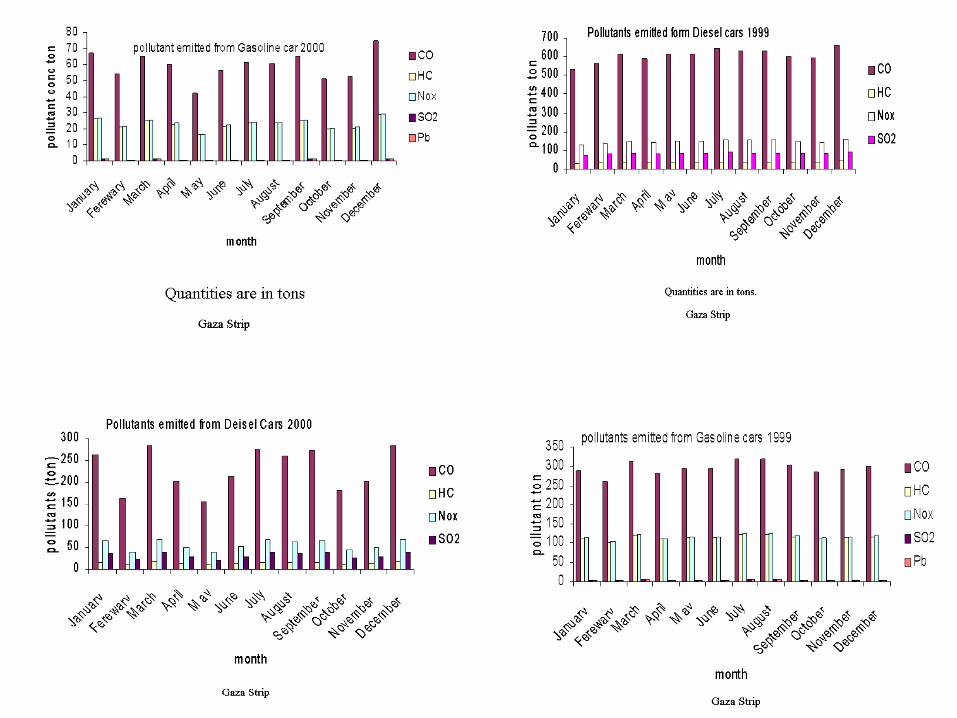
Emission Inventory: 1997- 8
• 15 Large Stationary (point) sources (58% fuel consumption)
• 400 Medium Stationary (point) sources (7%)• Small Stationary (area) sources (12%)• Solvents (area) sources• Biogenic Stationary (area) sources (isoprene
and monoterpene)• Mobile (area) sources, both ground based and
aerial (22%)
0
2
4
6
8
10
12
Percentage of pollution
00:00 03:00 06:00 09:00 12:00 15:00 18:00 21:00
Time
Average daily distribution of motor vehicle emissions in Israel
Weather Conditions
• Pre-episode: weak Persian trough slow V & low mixing depth high NOx
O3 titration (costal) • Episode:
trough strengthens increased surface HPG
augmented westerly sea breeze front
high inland O3 concentration
Med Sea
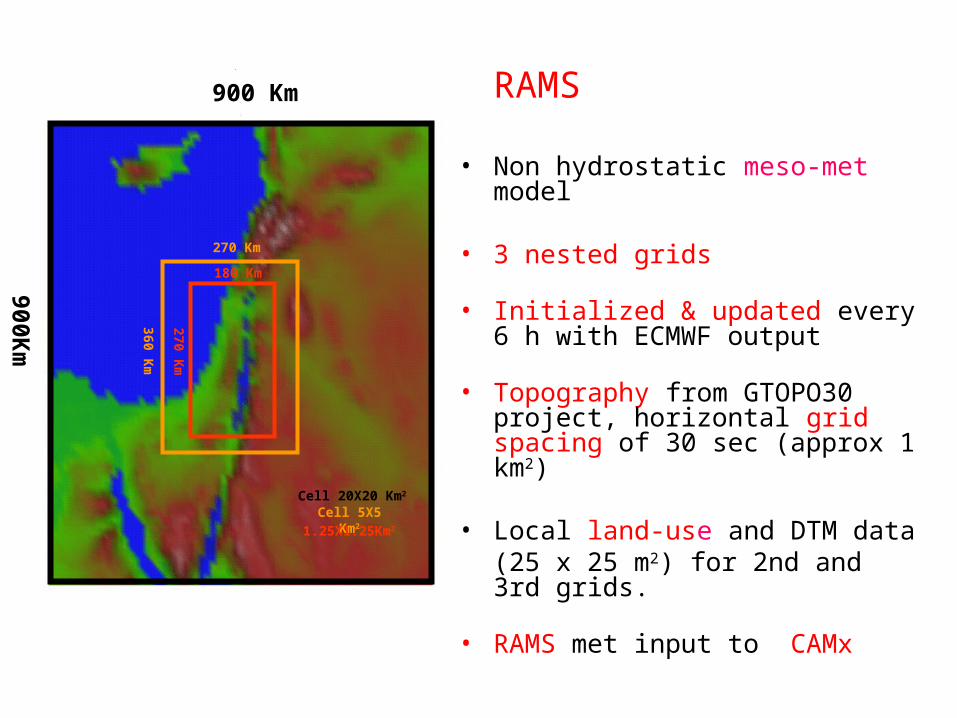
900Km
900 Km
270 Km
360 Km
180 Km
270 Km
Cell 20X20 Km2
Cell 5X5 Km2
1.25X1.25Km2
RAMS • Non hydrostatic meso-met model
• 3 nested grids
• Initialized & updated every 6 h with ECMWF output
• Topography from GTOPO30 project, horizontal grid spacing of 30 sec (approx 1 km2)
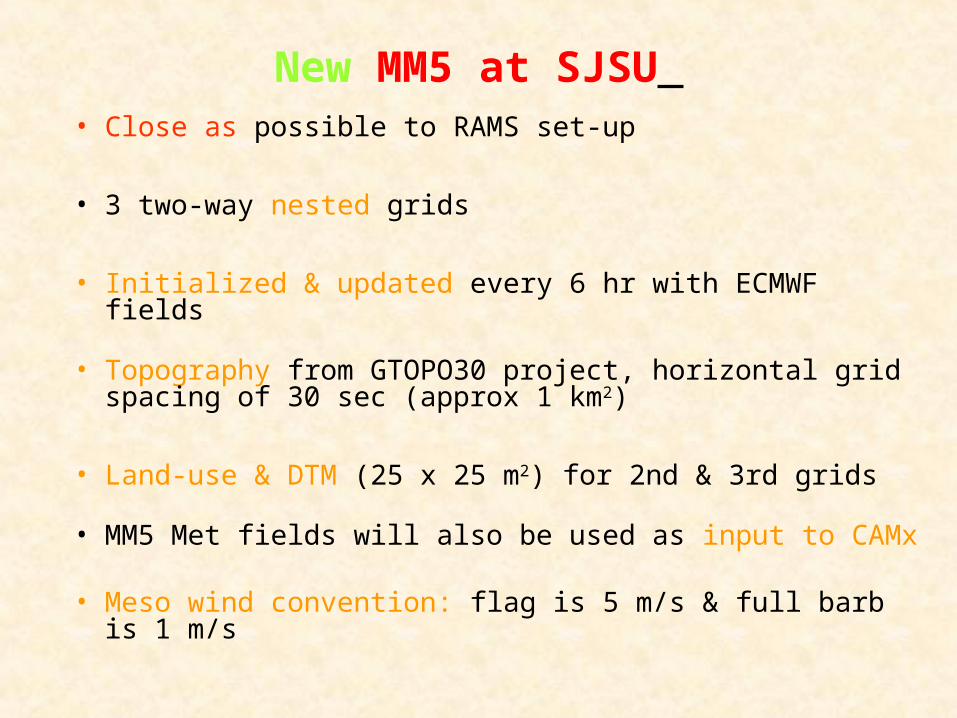
New MM5 at SJSU • Close as possible to RAMS set-up
• 3 two-way nested grids
• Initialized & updated every 6 hr with ECMWF fields
• Topography from GTOPO30 project, horizontal grid spacing of 30 sec (approx 1 km2)
• Land-use & DTM (25 x 25 m2) for 2nd & 3rd grids
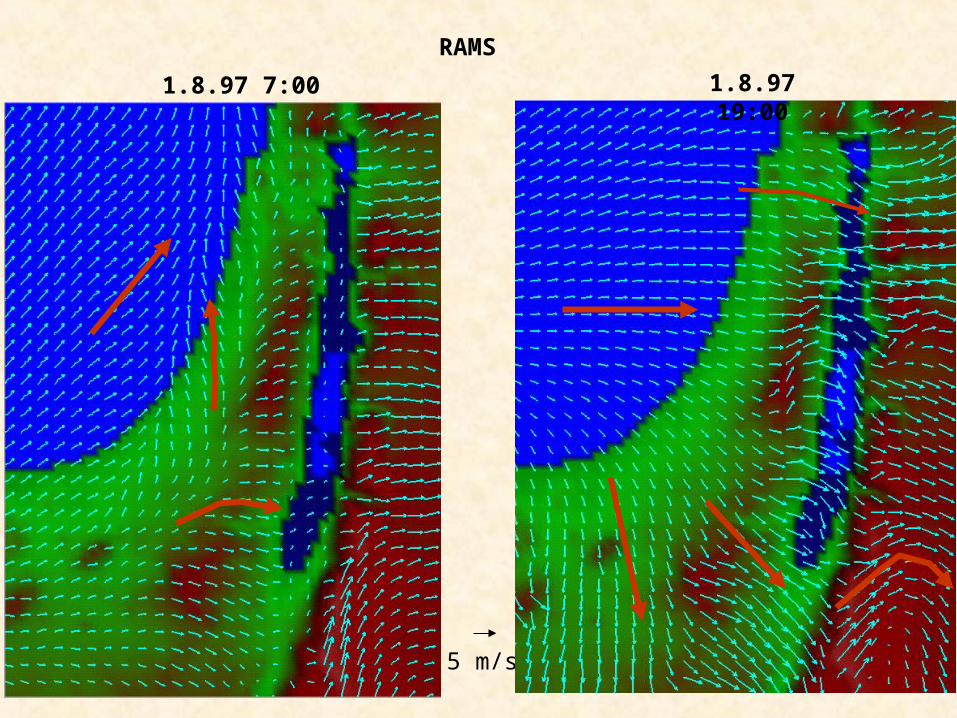
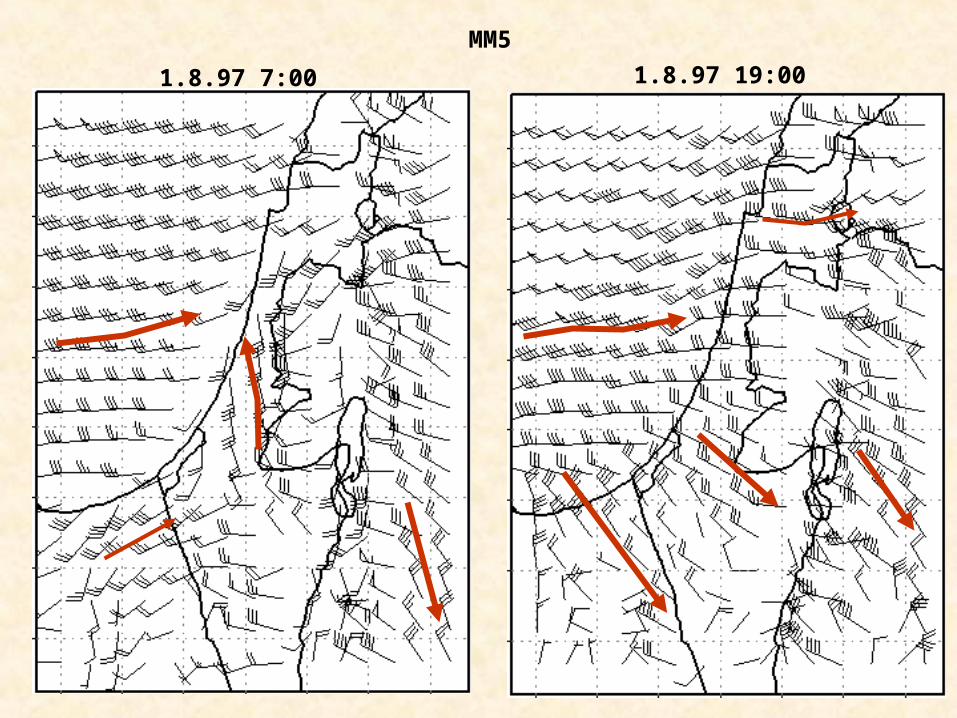
• MM5 Met fields will also be used as input to CAMx • Meso wind convention: flag is 5 m/s & full barb is 1 m/s
1.8.97 19:001.8.97 7:00
MM5
CAMx
• Map projection: Polar Stereographic
• Grid area: 270 x 370 km2 cells at 5 X 5 km2
• Transport algorithm: area preserving flux-form advection solver (Bott 1989)
• CBM-IV: Carbon Bond Mechanism + CMC fast solver
• Plume-in-grid: sub model for main stationary sources; maturity parameters 2500 m or 12 h
CAMx model
Jerusalem
Jerusalem
Flight Path
0
0-20
20-40
40-60
60-70
70-80
80-90
90-95
95-105
105-120
מקראO3 ppb
1.8.97 15:00
RAMS/Camx Results vs Airborne Measurements: 300 m AGL
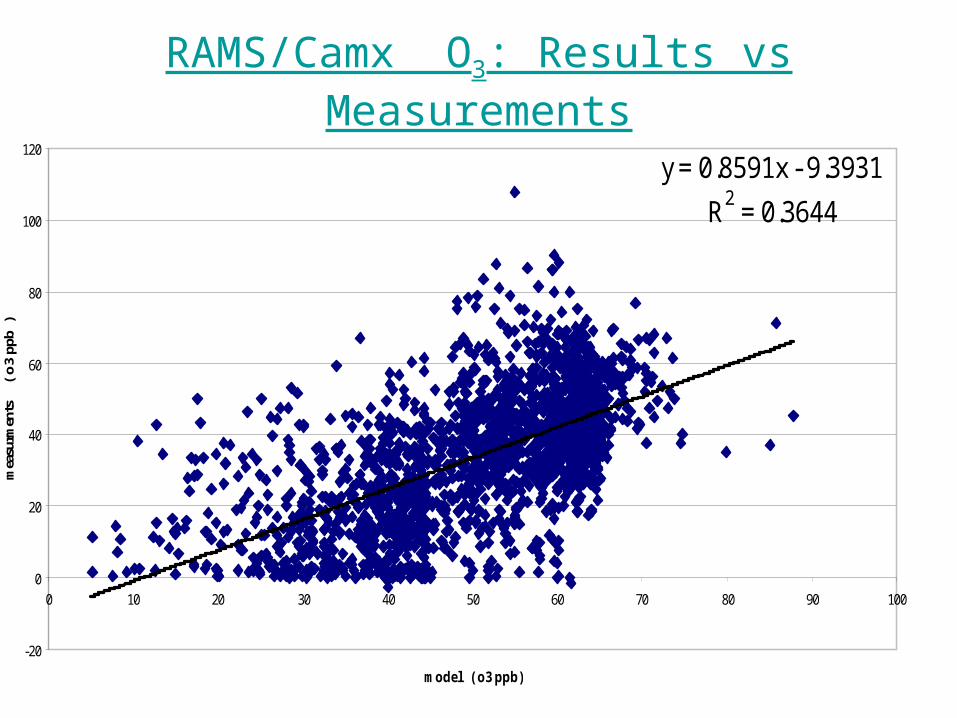
Measurments versus Model results
y = 0.8591x - 9.3931
R2 = 0.3644
-20
0
20
40
60
80
100
120
0 10 20 30 40 50 60 70 80 90 100
model ( o3 ppb)
mea
surm
ents
(
o3
ppb
)
RAMS/Camx O3: Results vs Measurements
All emission sources
1.8.97 15:00
0
0-20
20-40
40-60
60-70
70-80
80-90
90-95
95-105
105-120
LegendO3 ppb
All industry sources Without industry sources
1.8.97 15:00 1.8.97 15:00
1. All emission sources
2. All Industry sources
3. Main (large) Industry sources
4. Medium and small (low) industry
5. Without Industry; only Vehicles, Solvents & Vegetation
6. Vehicles only
7. Without vehicles = All Industry, Solvents & Vegetation
8. Without emissions (initial and boundary conditions)
8 Emission Input Scenarios
1.8.97 15:00
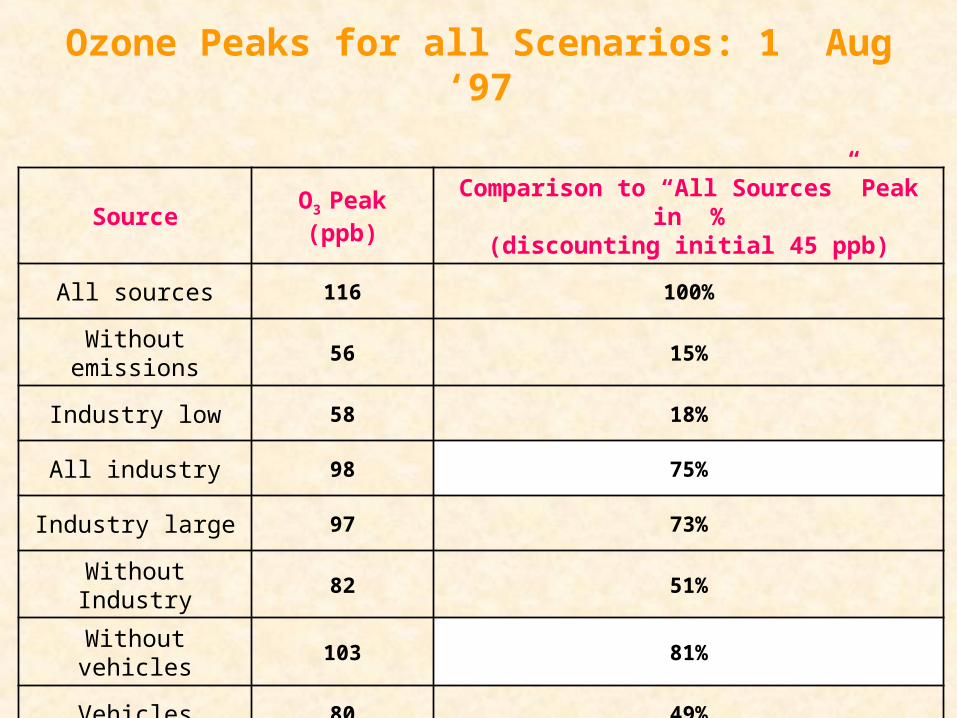
Ozone Peaks for all Scenarios: 1 Aug ‘97
SourceO3 Peak(ppb)
Comparison to “All Sources” Peak in %(discounting initial 45 ppb)
All sources 116 100%
Without emissions 56 15%
Industry low 58 18%
All industry 98 75%
Industry large 97 73%
Without Industry 82 51%
Without vehicles 103 81%
Vehicles 80 49%
Summary of results: • Temporal & spatial emission patterns reflect
land use patterns
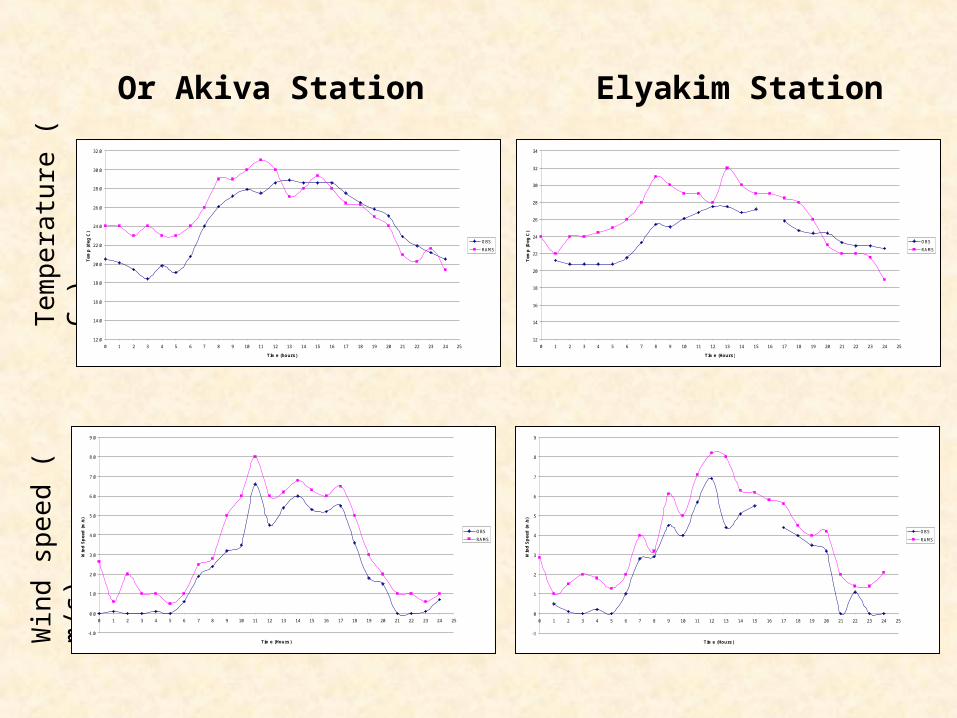
• Spatial & temporal variations in met factors & air quality concentrations were reproduced
• RAMS & MM5 reproduce observed transport patterns
• CAMx ozone reproduces transboundary transport patterns observed by aircraft
Current Efforts:• CAMx + current emissions + RAMS or MM5
• ARIJ, EPRI, & HUJI planners to identify future emission scenarios for CAMx from 2010 & 2020 population conditions (when regional populations will have doubled present values)
• Jordanian scientists joined project
Acknowledgment
• Israel Ministry of Infrastructure • Israel Ministry of Environment • HUJI: H. Leshner, Prof. A. Danin,
Dr. R. Kadmon, I. levy• SJSU: T. Michaels, J. Wilkinson • Israel CBS: Dr. R. Shishinski,
S. Kats, O. Stone • INNPPA: Y.Magal, Y. Taober-
FUNDING: USAID/MERC PROGRAMFUNDING: USAID/MERC PROGRAM