BNL-94204-2011-CP Simulations of the LHC high luminosity monitors at beam energies 3.5 TeV to 7.0 TeV H.S. Mattis, P. Humphreys, A. Ratti, C. Turner, Lawrence Berkeley Laboratory, Berkeley, CA R. Miyamoto Brookhaven National Laboratory, Upton NY J. Stiller Heidelberg University, Heidelberg, Germany Presented at the 2011 Particle Accelerator Conference (PAC’11) New York, N.Y. March 28 – April 1, 2011 Collider-Accelerator Department Brookhaven National Laboratory U.S. Department of Energy Office of Science Notice: This manuscript has been authored by employees of Brookhaven Science Associates, LLC under Contract No. DE-AC02-98CH10886 with the U.S. Department of Energy. The publisher by accepting the manuscript for publication acknowledges that the United States Government retains a non-exclusive, paid-up, irrevocable, world-wide license to publish or reproduce the published form of this manuscript, or allow others to do so, for United States Government purposes. This preprint is intended for publication in a journal or proceedings. Since changes may be made before publication, it may not be cited or reproduced without the author’s permission.
Transcript
BNL-94204-2011-CP
Simulations of the LHC high luminosity monitors at beam energies 3.5 TeV to 7.0 TeV
H.S. Mattis, P. Humphreys, A. Ratti, C. Turner,
Lawrence Berkeley Laboratory, Berkeley, CA
R. Miyamoto Brookhaven National Laboratory, Upton NY
J. Stiller
Heidelberg University, Heidelberg, Germany
Presented at the 2011 Particle Accelerator Conference (PAC’11) New York, N.Y.
March 28 – April 1, 2011
Collider-Accelerator Department
Brookhaven National Laboratory
U.S. Department of Energy Office of Science Notice: This manuscript has been authored by employees of Brookhaven Science Associates, LLC under Contract No. DE-AC02-98CH10886 with the U.S. Department of Energy. The publisher by accepting the manuscript for publication acknowledges that the United States Government retains a non-exclusive, paid-up, irrevocable, world-wide license to publish or reproduce the published form of this manuscript, or allow others to do so, for United States Government purposes. This preprint is intended for publication in a journal or proceedings. Since changes may be made before publication, it may not be cited or reproduced without the author’s permission.
DISCLAIMER
This report was prepared as an account of work sponsored by an agency of the United States Government. Neither the United States Government nor any agency thereof, nor any of their employees, nor any of their contractors, subcontractors, or their employees, makes any warranty, express or implied, or assumes any legal liability or responsibility for the accuracy, completeness, or any third party’s use or the results of such use of any information, apparatus, product, or process disclosed, or represents that its use would not infringe privately owned rights. Reference herein to any specific commercial product, process, or service by trade name, trademark, manufacturer, or otherwise, does not necessarily constitute or imply its endorsement, recommendation, or favoring by the United States Government or any agency thereof or its contractors or subcontractors. The views and opinions of authors expressed herein do not necessarily state or reflect those of the United States Government or any agency thereof.
SIMULATIONS OF THE LHC HIGH LUMINOSITY MONITORS AT BEAM ENERGIES 3.5 TEV TO 7.0 TEV*
H. S. Matis#, P. Humphreys, A. Ratti, W. C. Turner, LBNL, Berkeley, CA, U.S.A., R. Miyamoto, BNL, Upton, NY, U.S.A., J. Stiller, Heidelberg University, Heidelberg, Germany
Abstract We have constructed two pairs of fast ionization
chambers (BRAN) for measurement and optimization of luminosity at IR1 and IR5 of the LHC. These devices are capable of monitoring the performance of the LHC at low luminosity 1028 cm-2s-1 during beam commissioning all the way up to the expected full luminosity of 1034 cm-2s-1 at 7.0 TeV. The ionization chambers measure the intensity of hadronic/electromagnetic showers produced by the forward neutral particles of LHC collisions. To predict and improve the understanding of the BRAN performance, we created a detailed FLUKA model of the detector and its surroundings. In this paper, we describe the model and the results of our simulations including the detector’s estimated response to pp collisions at beam energies of 3.5, 5.0, and 7.0 TeV per beam. In addition, these simulations show the sensitivity of the BRAN to the crossing angle of the two LHC beams. It is shown that the BRAN sensitivity to the crossing angle is proportional to the measurement of crossing angle by the LHC beam position monitors.
INTRODUCTION Figure 1 is a schematic layout of a typical high
luminosity Intersection Region (IR). A neutral particle absorber (TAN) protects the beam separation dipole (D2) behind it from forward neutral particles produced in pp collisions [1]. These neutral particles produce (hadronic/electromagnetic) showers inside the TAN with a rate proportional to the pp collision rate. The LHC luminosity detector, BRAN, inside the TAN detects these showers by measuring the ionization in the gas and thus monitors relative changes in the pp collision rate.
Numerical studies of the BRAN in the past focused on estimating the average pulse height per bunch crossing to the maximum 7 TeV beams at full luminosity 1034 cm-2s-1. Under these conditions the mean number of pp collisions per bunch crossing is approximately 25, so pulse height rather than counting rate must be used for measurement of that luminosity. However for the 3.5 TeV beams in 2010, the number of pp interactions per bunch crossing did not exceed two, so we were able use a pulse counting mode above a selected threshold to measure luminosity. To prepare for the time when the number of detected pp interactions exceeded one per bunch crossing, we estimated the detector’s performance from the current operating conditions to the maximum. In the following sections, we describe our previous simulations and describe the recent improvements.
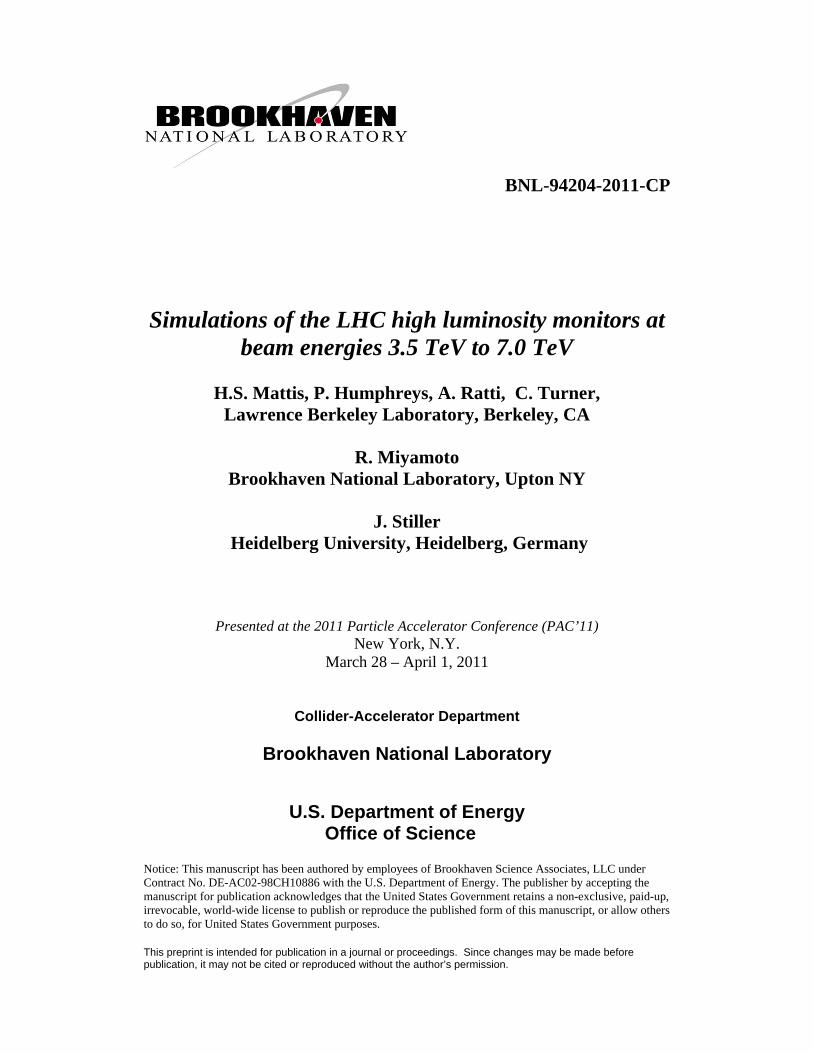
Figure 1: Schematic of the Interaction Region. The upper figure shows the incident beams, the Front Quadruple Absorbers (TAS) and the Neutral Particle Absorbers (TAN). The lower figure shows a hypothetical particle shower resulting from an interaction. This drawing is not to scale. The BRAN is represented by the solid blue rectangle. The Intersection Point (IP) is in the center of the region.
IMPROVED MODEL In a previous publication [2], we showed, using the
FLUKA Monte Carlo code [3, 4] that at 3.5 TeV beam energy approximately one in ten pp interactions would give a count in the BRAN while at 7.0 TeV approximately one in three. In addition to this work, we compared [5] these simulations to the actual performance of the detector.
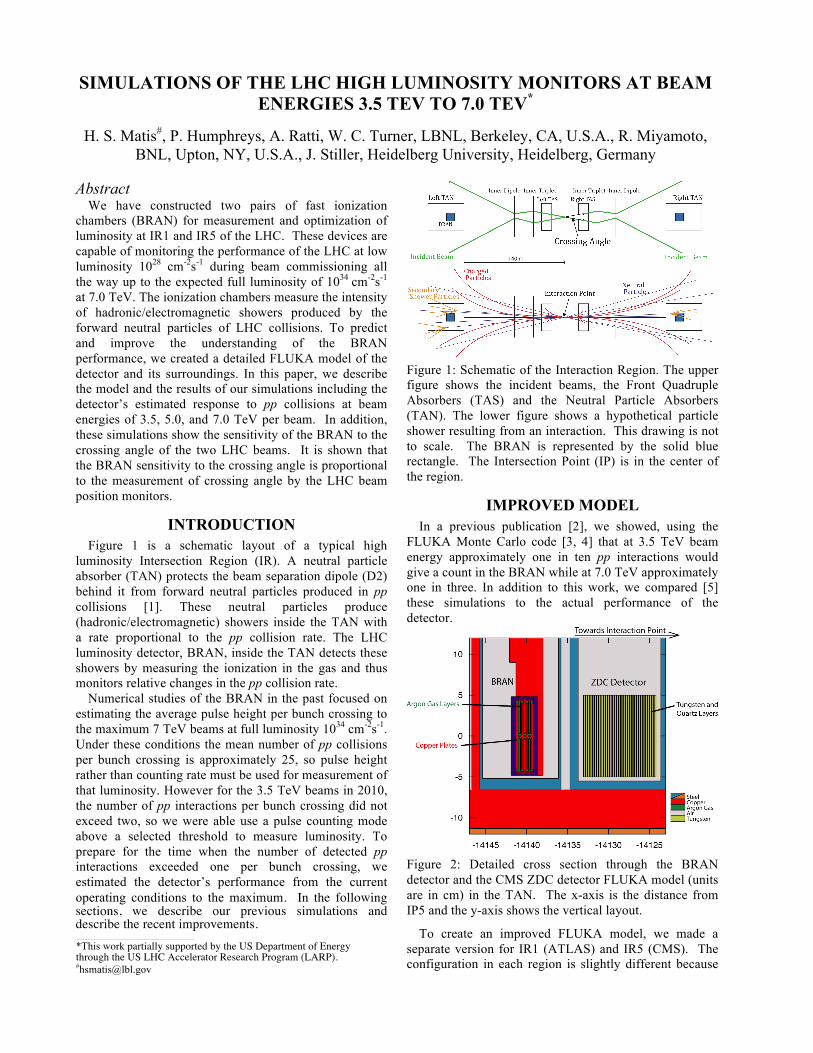
Figure 2: Detailed cross section through the BRAN detector and the CMS ZDC detector FLUKA model (units are in cm) in the TAN. The x-axis is the distance from IP5 and the y-axis shows the vertical layout.
To create an improved FLUKA model, we made a separate version for IR1 (ATLAS) and IR5 (CMS). The configuration in each region is slightly different because
____________________________________________
*This work partially supported by the US Department of Energy through the US LHC Accelerator Research Program (LARP). #[email protected]
the Zero Degree Calorimeters (ZDCs) in front of BRANs are not identical in IR1 and IR5. We also note that the ZDCs [6] in front of the BRAN at ATLAS are asymmetric, as there is an extra component in the right side TAN (right is defined as the direction seen by an observer standing inside ring). This leads to a slight change in the measured energy deposition in the BRAN. The CMS TANs [7] have symmetric ZDCs, but they are of a different design than the ATLAS ZDCs.
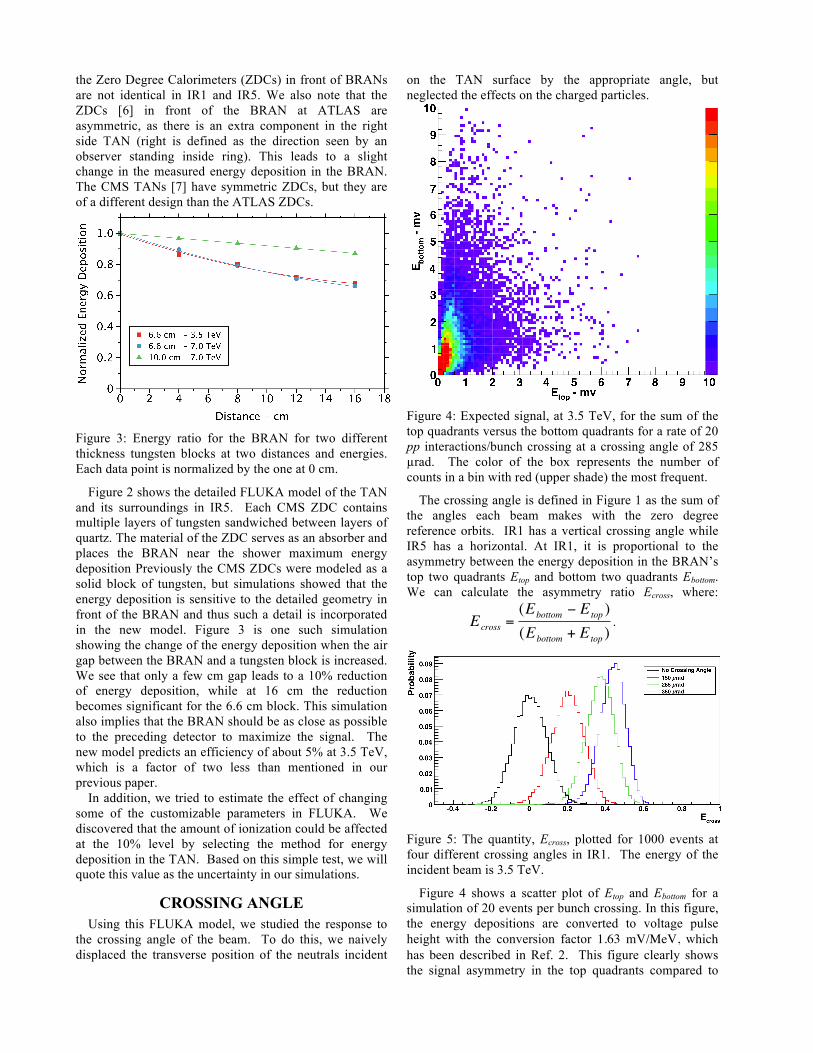
Figure 3: Energy ratio for the BRAN for two different thickness tungsten blocks at two distances and energies. Each data point is normalized by the one at 0 cm.
Figure 2 shows the detailed FLUKA model of the TAN and its surroundings in IR5. Each CMS ZDC contains multiple layers of tungsten sandwiched between layers of quartz. The material of the ZDC serves as an absorber and places the BRAN near the shower maximum energy deposition Previously the CMS ZDCs were modeled as a solid block of tungsten, but simulations showed that the energy deposition is sensitive to the detailed geometry in front of the BRAN and thus such a detail is incorporated in the new model. Figure 3 is one such simulation showing the change of the energy deposition when the air gap between the BRAN and a tungsten block is increased. We see that only a few cm gap leads to a 10% reduction of energy deposition, while at 16 cm the reduction becomes significant for the 6.6 cm block. This simulation also implies that the BRAN should be as close as possible to the preceding detector to maximize the signal. The new model predicts an efficiency of about 5% at 3.5 TeV, which is a factor of two less than mentioned in our previous paper.
In addition, we tried to estimate the effect of changing some of the customizable parameters in FLUKA. We discovered that the amount of ionization could be affected at the 10% level by selecting the method for energy deposition in the TAN. Based on this simple test, we will quote this value as the uncertainty in our simulations.
CROSSING ANGLE Using this FLUKA model, we studied the response to
the crossing angle of the beam. To do this, we naively displaced the transverse position of the neutrals incident
on the TAN surface by the appropriate angle, but neglected the effects on the charged particles.
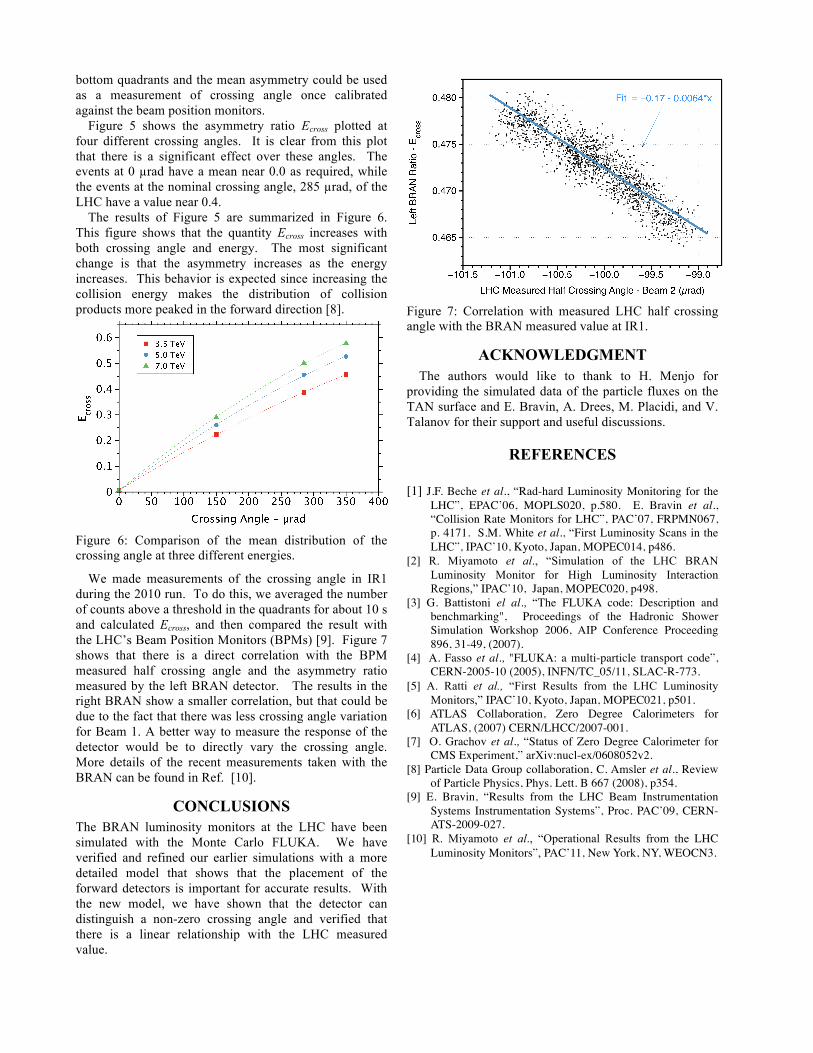
Figure 4: Expected signal, at 3.5 TeV, for the sum of the top quadrants versus the bottom quadrants for a rate of 20 pp interactions/bunch crossing at a crossing angle of 285 µrad. The color of the box represents the number of counts in a bin with red (upper shade) the most frequent.
The crossing angle is defined in Figure 1 as the sum of the angles each beam makes with the zero degree reference orbits. IR1 has a vertical crossing angle while IR5 has a horizontal. At IR1, it is proportional to the asymmetry between the energy deposition in the BRAN’s top two quadrants Etop and bottom two quadrants Ebottom. We can calculate the asymmetry ratio Ecross, where:
€
Ecross =(Ebottom − Etop )(Ebottom + Etop )
.
Figure 5: The quantity, Ecross, plotted for 1000 events at four different crossing angles in IR1. The energy of the incident beam is 3.5 TeV.
Figure 4 shows a scatter plot of Etop and Ebottom for a simulation of 20 events per bunch crossing. In this figure, the energy depositions are converted to voltage pulse height with the conversion factor 1.63 mV/MeV, which has been described in Ref. 2. This figure clearly shows the signal asymmetry in the top quadrants compared to
bottom quadrants and the mean asymmetry could be used as a measurement of crossing angle once calibrated against the beam position monitors.
Figure 5 shows the asymmetry ratio Ecross plotted at four different crossing angles. It is clear from this plot that there is a significant effect over these angles. The events at 0 µrad have a mean near 0.0 as required, while the events at the nominal crossing angle, 285 µrad, of the LHC have a value near 0.4.
The results of Figure 5 are summarized in Figure 6. This figure shows that the quantity Ecross increases with both crossing angle and energy. The most significant change is that the asymmetry increases as the energy increases. This behavior is expected since increasing the collision energy makes the distribution of collision products more peaked in the forward direction [8].
Figure 6: Comparison of the mean distribution of the crossing angle at three different energies.
We made measurements of the crossing angle in IR1 during the 2010 run. To do this, we averaged the number of counts above a threshold in the quadrants for about 10 s and calculated Ecross, and then compared the result with the LHC’s Beam Position Monitors (BPMs) [9]. Figure 7 shows that there is a direct correlation with the BPM measured half crossing angle and the asymmetry ratio measured by the left BRAN detector. The results in the right BRAN show a smaller correlation, but that could be due to the fact that there was less crossing angle variation for Beam 1. A better way to measure the response of the detector would be to directly vary the crossing angle. More details of the recent measurements taken with the BRAN can be found in Ref. [10].
CONCLUSIONS The BRAN luminosity monitors at the LHC have been simulated with the Monte Carlo FLUKA. We have verified and refined our earlier simulations with a more detailed model that shows that the placement of the forward detectors is important for accurate results. With the new model, we have shown that the detector can distinguish a non-zero crossing angle and verified that there is a linear relationship with the LHC measured value.
Figure 7: Correlation with measured LHC half crossing angle with the BRAN measured value at IR1.
ACKNOWLEDGMENT The authors would like to thank to H. Menjo for
providing the simulated data of the particle fluxes on the TAN surface and E. Bravin, A. Drees, M. Placidi, and V. Talanov for their support and useful discussions.
REFERENCES [1] J.F. Beche et al., “Rad-hard Luminosity Monitoring for the
LHC”, EPAC’06, MOPLS020, p.580. E. Bravin et al., “Collision Rate Monitors for LHC”, PAC’07, FRPMN067, p. 4171. S.M. White et al., “First Luminosity Scans in the LHC”, IPAC’10, Kyoto, Japan, MOPEC014, p486.
[2] R. Miyamoto et al., “Simulation of the LHC BRAN Luminosity Monitor for High Luminosity Interaction Regions,” IPAC’10, Japan, MOPEC020, p498.
[3] G. Battistoni el al., “The FLUKA code: Description and benchmarking", Proceedings of the Hadronic Shower Simulation Workshop 2006, AIP Conference Proceeding 896, 31-49, (2007).
[4] A. Fasso et al., "FLUKA: a multi-particle transport code”, CERN-2005-10 (2005), INFN/TC_05/11, SLAC-R-773.
[5] A. Ratti et al., “First Results from the LHC Luminosity Monitors,” IPAC’10, Kyoto, Japan, MOPEC021, p501.
[6] ATLAS Collaboration, Zero Degree Calorimeters for ATLAS, (2007) CERN/LHCC/2007-001.
[7] O. Grachov et al., “Status of Zero Degree Calorimeter for CMS Experiment,” arXiv:nucl-ex/0608052v2.
[8] Particle Data Group collaboration, C. Amsler et al., Review of Particle Physics, Phys. Lett. B 667 (2008), p354.
[9] E. Bravin, “Results from the LHC Beam Instrumentation Systems Instrumentation Systems”, Proc. PAC’09, CERN-ATS-2009-027.
[10] R. Miyamoto et al., “Operational Results from the LHC Luminosity Monitors”, PAC’11, New York, NY, WEOCN3.