DOI 10.1515/joc-2013-0018 J. Opt. Commun. 2013; aop Theory Naresh Kumar* and Ashwani Kumar Rana Simulative Analysis of Various Parameters on Free Space Optical Communication System Abstract: The Free Space Optical (FSO) communication system provides a high bandwidth, small size, light weight, low power and low cost alternative to present mi- crowave systems. In this paper, we have designed a model of FSO system using OPTISYSTEM TM simulator to establish an FSO link by a range of 5 km with BER ~ 10 −6 achieved and reported analysis of different parameter that play im- portant role in FSO communication system. Keywords: free-space optics, bit-error rate, signal noise ratio, beam divergence angle, attenuation PACS ® (2010). 84.40.Ua *Corresponding author: Naresh Kumar: National Institute of Technology, Hamirpur, India. E-mail: [email protected]Ashwani Kumar Rana: National Institute of Technology, Hamirpur, India 1 Introduction Free space optical (FSO) communication links have some distinct advantages over conventional microwave and optical fiber communication systems by virtue of their high carrier frequencies that permit large capacity, en- hanced security, high data rate and so on [1–2]. In tele- communications, FSO is an optical communication tech- nology that uses light propagating in free space to transmit data between two points. The technology is useful where the physical connection by the means of fiber optic cables is impractical. It is similar to fiber optic communications in that data is transmitted by modulated laser light. Instead of containing the pulses of light with in a glass fiber, these are transmitted in a narrow beam through the atmosphere. Light travels through air faster than it does through glass, so it is fair to classify FSO as optical com- munications at the speed of light. The stability and quality of the link is highly dependent on atmospheric factors such as rain, fog, dust and heat. FSO systems are being considered for military systems because of their inherent benefits as most of the systems are rated for greater than 1 km in three or more lasers operating in parallel to miti- gate distance-related issues. The quality of the transmis- sion is characterized by the realized bit-error rate (BER) [3]. Today, FSO communication has not seen widespread use in the military. With the bandwidth available to FSO anywhere from 100 to 100,000 times higher than other radio frequency or microwave transmitters, use of FSO technology could give a military force much leverage over their rivals. While the technology has somewhat matured for fixed site commercial deployments, FSO technology would be very much more useful to the military if it could be deployed on mobile platforms. This focused the impact of transmission power and attenuation in free space optical communication system. It has been shown in [4] that BER of received data increases when transmission power decreases. While it increases with increase in atten- uation. Here investigated the impact of with and without Forward error correction in free space optics communica- tion for different bit rates. It had shown that forward error correction technique yields the highest Q value and lowest BER in FSO communication [5]. Performance evaluation of free space optical communication link with different parameters has been observed in this [6]. Author have achieved BER 10 −7 at 1.6 km with bit rate of 2.50 Gbit/s and BER 10 −12 at 2 km with divergence angle 2 mrad in free space optical communication link. In our work, we have presented the simulative investigation of FSO trans- mission system at different parameter like receiver aper- ture diameter, beam divergence, transmission power and attenuation with highest distance of 5 km. The rest of the paper is organized as follows. Design of free space optics communication is described in Section 2. The results are presented in Section 3. Finally, conclusions are discussed in Section 4. 2 System discription In this design we considered a typical FSO link consisting of a transmitter, FSO channel, and receiver. Figure 1 shows a design of FSO link under study [7–9]. The transmitter consists of a PRBS generator at bit rate 1.25 Gbit/s, an NRZ Brought to you by | Heinrich Heine Universität Düsseldorf Authenticated | 93.180.53.211 Download Date | 9/9/13 7:01 PM
Transcript
DOI 10.1515/joc-2013-0018 J. Opt. Commun. 2013; aop
Theory
Naresh Kumar* and Ashwani Kumar Rana
Simulative Analysis of Various Parameters on Free Space Optical Communication System
Abstract: The Free Space Optical (FSO) communication system provides a high bandwidth, small size, light weight, low power and low cost alternative to present mi-crowave sys tems. In this paper, we have designed a model of FSO system using OPTISYSTEMTM simulator to establish an FSO link by a range of 5 km with BER ~ 10−6 achieved and reported analysis of different parameter that play im-portant role in FSO communication system.
*Corresponding author: Naresh Kumar: National Institute of Technology, Hamirpur, India. E-mail: [email protected] Kumar Rana: National Institute of Technology, Hamirpur, India
1 IntroductionFree space optical (FSO) communication links have some distinct advantages over conventional microwave and optical fiber communication systems by virtue of their high carrier frequencies that permit large capacity, en-hanced security, high data rate and so on [1–2]. In tele-communications, FSO is an optical communication tech-nology that uses light prop agating in free space to transmit data between two points. The technology is useful where the physical connection by the means of fiber optic cables is impractical. It is similar to fiber optic communications in that data is transmitted by modulated laser light. Instead of containing the pulses of light with in a glass fiber, these are transmitted in a narrow beam through the atmosphere. Light travels through air faster than it does through glass, so it is fair to classify FSO as optical com-munications at the speed of light. The stability and quality of the link is highly dependent on atmospheric factors such as rain, fog, dust and heat. FSO systems are being con sidered for military systems because of their inherent benefits as most of the systems are rated for greater than
1 km in three or more lasers operating in parallel to miti-gate distance- related issues. The quality of the transmis-sion is characterized by the realized bit-error rate (BER) [3]. Today, FSO communication has not seen widespread use in the military. With the bandwidth available to FSO anywhere from 100 to 100,000 times higher than other radio frequency or microwave transmitters, use of FSO technology could give a military force much leverage over their rivals. While the technology has somewhat matured for fixed site commercial deployments, FSO technology would be very much more useful to the military if it could be deployed on mobile platforms. This focused the impact of transmission power and attenuation in free space optical communication system. It has been shown in [4] that BER of received data increases when transmission power decreases. While it increases with increase in atten-uation. Here investigated the impact of with and without Forward error correction in free space optics communica-tion for different bit rates. It had shown that forward error correction technique yields the highest Q value and lowest BER in FSO communication [5]. Performance eval uation of free space optical communication link with different parameters has been observed in this [6]. Author have achieved BER 10−7 at 1.6 km with bit rate of 2.50 Gbit/s and BER 10−12 at 2 km with divergence angle 2 mrad in free space optical communication link. In our work, we have presented the simulative investigation of FSO trans-mission system at different parameter like receiver aper-ture diameter, beam divergence, transmission power and attenuation with highest distance of 5 km.
The rest of the paper is organized as follows. Design of free space optics communication is described in Section 2. The results are presented in Section 3. Finally, conclusions are discussed in Section 4.
2 System discriptionIn this design we considered a typical FSO link consisting of a transmitter, FSO channel, and receiver. Figure 1 shows a design of FSO link under study [7–9]. The transmitter consists of a PRBS generator at bit rate 1.25 Gbit/s, an NRZ
Brought to you by | Heinrich Heine Universität DüsseldorfAuthenticated | 93.180.53.211
Download Date | 9/9/13 7:01 PM
2 N. Kumar and A. K. Rana, Simulative Analysis of FSO Communication System
driver, and a directly modulated DML at 785 nm. Optical power out of the transmitter is 3 dBm. The FSO link has a 5 km range with a beam divergence angle of 0.25 mrad. The receiver is a photo-detector and is followed by a BER tester.
3 Result and discussionThe analysis in this paper is going to be performed by observing four cases: Case (I) described analysis of free space optical communication with receiver aperture diam-eter, Case (II) described analysis of free space optical com-munication with beam divergence, Case (III) described analysis of free space optical communication with trans-mitter power and Case (IV) gave us analysis of free space optical communication with Attenuation.
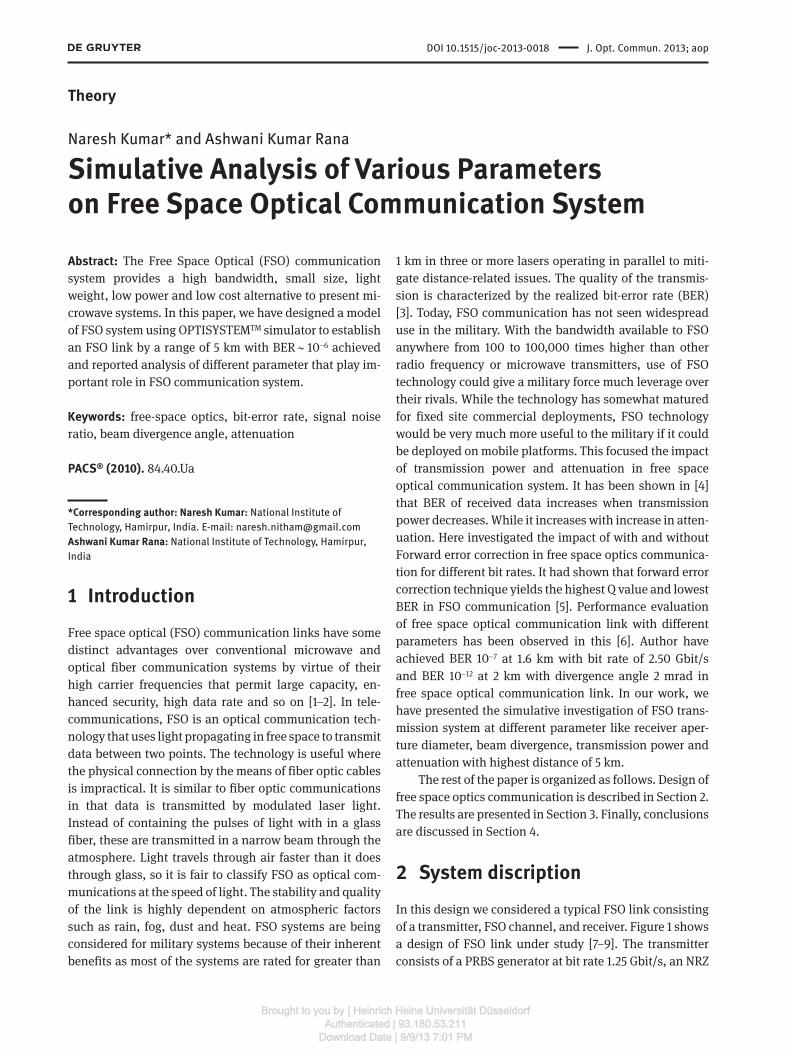
Case I. Performance analysis of free space optical communication with different receiver aperture diameter
The parameter used in this case are transmission length 5 km, wavelength 785 nm, transmitter aperture diameter 10 cm, receiver aperture diameter 25 cm, beam divergence 0.25 mrad, transmitter power 36 mW, attenuation 3 dBm.
Figure 2 (a, b & c) depicts the measurement of optical signal to noise ratio (OSNR), signal power and Q factor versus transmission range with different receiver aperture diameter. It has been observed that OSNR reduces from 98 dB to 74 dB in the range of 1 km to 5 km at receiver ap-erture diameter 10 cm and these value reduces from 92 dB to 68 dB in the range of 1 km to 5 km at receiver aperture diameter 5 cm. It means that as we increase the receiver aperture diameter, it increase the transmission range. Further, it has been observed that the signal power of FSO as depicted in Figure 2(b) and revealed that an improve-ment of −2 dBm is achieved in signal power recieved at re-ceiver aperture diameter 10 cm. It is computed as {−2 dBm, −16 dBm and −34 dBm} after a FSO range of {1 km, 3 km and 5 km} at receiver aperture diameter 10 cm and {−8 dBm, −18 dBm and −28 dBm} after a range of {1 km, 3 km and
5 km} at receiver aperture diameter 5 cm respectively. Further it has also been observed that the Q factor received at FSO as shown in Figure 2(c). It has been also observed that Q factor reduces from 1220 to 0 in the range of 1 km to 5 km in FSO at receiver aperture diameter 10 cm. alterna-tively; Q factor varies in the range of 620 to 0 in the range of 1 km to 4 km in FSO at receiver aperture diameter 5 cm.
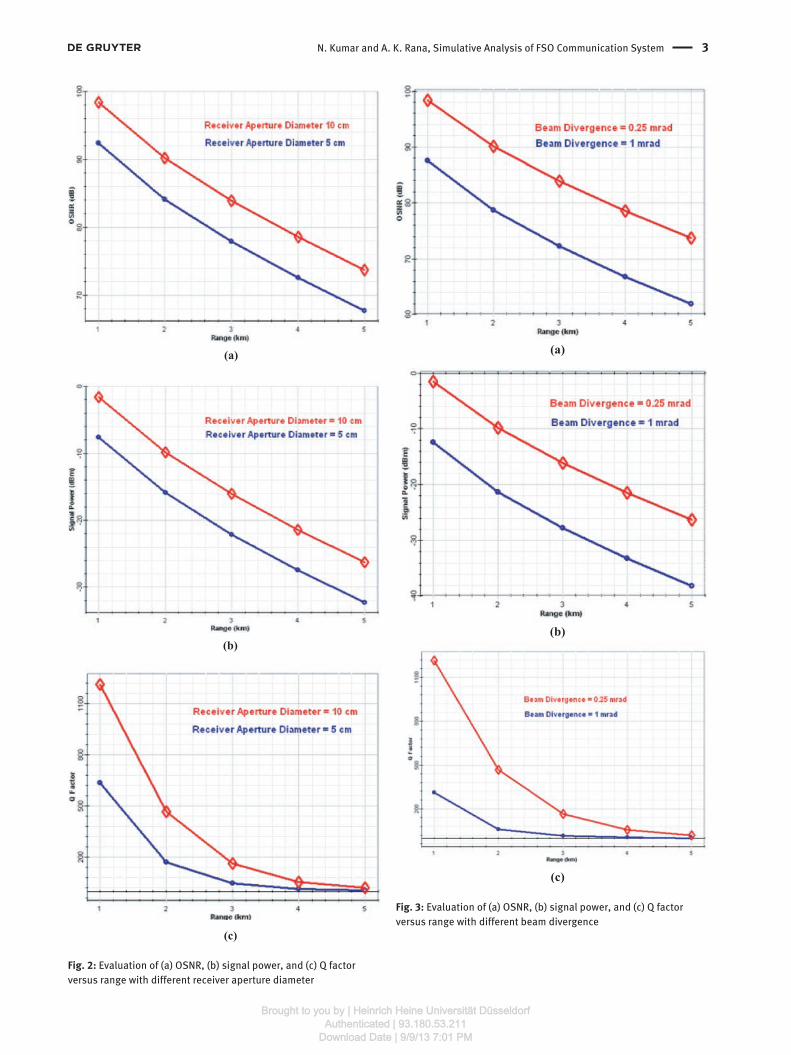
Case II. Performance analysis of free space optical communication with different beam divergence
Figure 3 (a, b & c) depicts the measurement of OSNR, signal power and Q factor versus FSO range with different beam divergence. It has been observed that OSNR reduces from 98 dB to 74 dB in the range of FSO is 1 km to 5 km at beam divergence of 0.25 mrad. Alternatively; OSNR varies in the range of 88 dB to 62 dB in the range of 1 km to 5 km at beam divergence of 1 mrad as shown in Figure 3(a). It means that as we move to higher beam divergence, range of FSO reduces.
Further, it has been observed that the signal power of FSO as depicted in Figure 3(b) and reveals that an im-provement of −2 dBm is achieved in signal power recieved at beam divergence of 0.25 mrad. It is computed as {−2 dBm, −16 dBm and −26 dBm} after a FSO range of {1 km, 3 km and 5 km} at beam divergence of 0.25 mrad and {−8 dBm and −38 dBm} after a FSO range of {1 km and 5 km} at beam divergence of 1 mrad, respectively. Further it has also been observed that the Q factor received at FSO as shown in Figure 3(c). It has been also observed that Q factor reduces from 1220 to 0 in the range of 1 km to 5 km in FSO at beam divergence of 0.25 mrad. Alternatively, Q factor varies in the range of 320 to 0 in the range of 1 km to 4 km in FSO at beam divergence of 1 mrad.
Case III. Performance analysis of free space optical communication with different transmitter power
Figure 4 (a, b & c) depicts the measurement of OSNR, signal power and Q factor versus FSO range with different
Fig. 1: Design of FSO link
Brought to you by | Heinrich Heine Universität DüsseldorfAuthenticated | 93.180.53.211
Download Date | 9/9/13 7:01 PM
N. Kumar and A. K. Rana, Simulative Analysis of FSO Communication System 3
Fig. 2: Evaluation of (a) OSNR, (b) signal power, and (c) Q factor versus range with different receiver aperture diameter
Fig. 3: Evaluation of (a) OSNR, (b) signal power, and (c) Q factor versus range with different beam divergence
Brought to you by | Heinrich Heine Universität DüsseldorfAuthenticated | 93.180.53.211
Download Date | 9/9/13 7:01 PM
4 N. Kumar and A. K. Rana, Simulative Analysis of FSO Communication System
transmitter power. It has been observed that OSNR reduces from 98 dB to 74 dB in the range of FSO is 1 km to 5 km at transmitter power 36 mW. Alternatively; OSNR varies in the range of 93 dB to 68 dB in the range of 1 km to 5 km at transmitter power 10 mW as shown in Figure 4(a). It means that as we move to higher transmitter power, range of FSO increases.
Further, it has been observed that the signal power of FSO as depicted in Figure 4(b) and reveals that an improvement of −2 dBm is achieved in signal power recieved at transmitter power 36 mW. It is computed as {−2 dBm, −16 dBm and −26 dBm} after a FSO range of {1 km, 3 km and 5 km} at transmitter power 36 mW and {−7 dBm, 18 dBm and −28 dBm} after a FSO range of {1 km, 3 km and 5 km} at transmitter power 10 mW re-spectively. Further it has also been observed that the Q factor received at FSO as shown in Figure 4(c). It has been also observed that Q factor reduces from 1220 to 0 in the range of 1 km to 5 km in FSO at transmitter power 36 mW. Alternatively, Q factor varies in the range of 680 to 0 in the range of 1 km to 5 km in FSO at transmitter power 10 mW.
Case IV. Performance analysis of free space optical communication with different attenuation
Figure 5 (a, b & c) depicts the measurements of OSNR, signal power and Q factor versus FSO range with different attenuation. It has been observed that OSNR reduces from 98 dB to 76 dB in the range of FSO is 1 km to 5 km at an attenuation of 3 dB/km. alternatively; OSNR varies in the range of 92 dB to 38 dB in the range of 1 km to 5 km at an attenuation of 10 dB/km as shown in Figure 5(a). It means that as we move to higher attenuation, range of FSO reduces.
Further, it has been observed that the signal power of FSO as depicted in Figure 5(b) and reveals that an im-provement of −2 dBm is achieved in signal power recieved an attenuation of 3 dB/km. It is computed as {−2 dBm, −16 dBm and −26 dBm} after a FSO range of {1 km, 3 km and 5 km} at attenuation of 3 dB/km and {−8 dBm and −60 dBm} after a FSO range of {1 km and 3 km} at attenua-tion of 10 dB/km, respectively. Further it has also been ob-served that the Q factor received at FSO is shown in Figure 5(c). It has been also observed that Q factor reduces from 1220 to 0 in the range of 1 km to 5 km in FSO at attenuation of 3 dB/km. Alternatively, Q factor varies in the range of 560 to 0 in the range of 1 km to 3 km in FSO at attenuation of 10 dB/km.
Fig. 4: Evaluation of (a) OSNR, (b) signal power, and (c) Q factor versus range with different transmitter power
Brought to you by | Heinrich Heine Universität DüsseldorfAuthenticated | 93.180.53.211
Download Date | 9/9/13 7:01 PM
N. Kumar and A. K. Rana, Simulative Analysis of FSO Communication System 5
4 ConclusionIn this work, we have designed a FSO system to establish a FSO link of 5 km length between transmitter and receiver at data rate of 2.50 Gbit/s. It is concluded from our simu-lated FSO system using OPTISYSTEMTM simulator to estab-lish a FSO link by a range of 5 km with BER ~ 10−6 can be achieved with transmitted power of 36 mW. Above results reported the impact of various parameter such as receiver aperture diameter, beam divergence, transmitter power and attenuation was studied and it is concluded that (i) as we increase the receiver aperture diameter, it increase the transmission range, (ii) increasing the beam diver-gence has reduces the transmission range, (iii) transmis-sion range also increases with the increase in transmitter power, and (iv) further it is also shown that higher attenu-ation results in lowering of FSO transmission range.
Received: December 6, 2012. Accepted: March 20, 2013.
References[1] H. Willebrand, B.S. Ghuman, Free-Space Optics: Enabling
Optical Connectivity in Today’s Networks, Sams Publishing, 2002.
[2] L. Andrews, R.L. Phillips and C.Y. Hopen, Laser Beam Scintillation with Applications, SPIE Press, 2001.
[3] P.A. Humblet, “On the Bit Error Rate of Light wave Systems with Optical Amplifiers”, Journal of Lightwave Technology, Vol. 9, No. 11 (1991), pp. 1576–1582.
[4] J. Singh, V. Kapoor, N. Kumar, “Performance Evaluation of High Speed Optical Wireless Communication System”, International Conference on Recent Advances and Future Trends in Information Technology (iRAFIT2012) Proceedings published in International Journal of Computer Application (IJCA), (2012) 11–14.
[5] N. Kumar, A.K. Sharma, V. Kapoor, “Performance Analysis of Free Space Optics Communication System in the Presence of Forward Error Correction Technique”, Journal of Optical Communications, Vol. 32, No. 4 (2011), pp. 231–235.
[6] J. Singh, V. Kapoor, “Design and Analysis of High Speed Free Space Optical Communication Link with Different Parameter”, International Journal of Computer Applications on Communication and Networks, No. 6 (2011), pp. 24–27.
[7] S. Bloom, Physics of FSO, www.freespaceoptics.com.[8] G. Hansel, E. Kube, J. Becker, J. Haase, P. Schwarz, “Simulation
in the design process of free space optical transmission systems”, Proc. 6th Workshop, Optics in Computing Technology, pp. 45–53, 2001.
[9] Pham Tien Dat, Abdemoula Bekkali, “Studies on characterizing the transmission of RF signals over a turbulent FSO link”, Optics Express, Vol. 17, No. 10 (2008), pp. 7731–7743.
Fig. 5: Evaluation of (a) OSNR, (b) signal power, and (c) Q factor versus range with different attenuation
Brought to you by | Heinrich Heine Universität DüsseldorfAuthenticated | 93.180.53.211