Page 1
Date: February 23, 2009 1
Submitted to: Applied and Environmental Microbiology 2
3
Simultaneous cellulose degradation and electricity production by Enterobacter 4
cloacae in an MFC 5
6
Farzaneh Rezaei1, Defeng Xing
2, Rachel Wagner
2, John M Regan
2, Tom L. Richard
1, and Bruce 7
E. Logan2* 8
9 1Dept. of Agricultural and Biological Engineering,
2Dept. of Civil and Environmental 10
Engineering, The Pennsylvania State University, University Park, PA, 16802, U.S.A. 11 *Corresponding Author- Email: [email protected] , Phone: 814-863-7908 12
13
14
Abstract 15
Electricity can be directly generated by bacteria in microbial fuel cells (MFCs) from many 16
different biodegradable substrates. When cellulose is used as the substrate, electricity generation 17
requires a microbial community with both cellulolytic and exoelectrogenic activity. Cellulose 18
degradation with electricity production by a pure culture has not been previously demonstrated 19
without addition of an exogenous mediator. Using a specially designed U-tube MFC, we 20
enriched a consortium of exoelectrogenic bacteria capable of using cellulose as the sole electron 21
donor. After 19 dilution-to-extinction serial transfers of the consortium, 16S rRNA gene-based 22
community analysis using denaturing gradient gel electrophoresis and band sequencing revealed 23
that the dominant bacterium was Enterobacter cloacae. An isolate designated E. cloacae FR 24
from this enrichment was found to be 100% identical to the type strain Enterobacter cloacae 25
13047 based on a partial 16S rRNA sequence. In polarization tests using the U-tube MFC and 26
Copyright © 2009, American Society for Microbiology and/or the Listed Authors/Institutions. All Rights Reserved.Appl. Environ. Microbiol. doi:10.1128/AEM.02600-08 AEM Accepts, published online ahead of print on 3 April 2009
on July 6, 2018 by guesthttp://aem
.asm.org/
Dow
nloaded from
Page 2
2
cellulose as a substrate, strain FR produced 4.9 ± 0.01 mW/m2 compared to 5.4 ± 0.3 mW/m
2 for 27
strain 13047. These results demonstrate for the first time that it is possible to generate electricity 28
from cellulose using a single bacterial strain without the need for exogenous mediators. 29
30
Introduction 31
Exoelectrogenic microorganisms can release electrons to electron acceptors outside the cell, such 32
as iron oxides or carbon anodes in microbial fuel cells (MFCs). Many different genera have been 33
shown to produce electricity in an MFC, including Rhodoferax (6), Shewanella (13, 14), 34
Pseudomonas (29), Aeromonas (28), Geobacter (2), Geopsychrobacter (10), Desulfuromonas (1), 35
Desulfobulbus (9), Clostridium (27), Geothrix (3), Ochrobactrum (40), and Rhodopseudomonas 36
(38). These bacteria have been grown on simple soluble substrates, such as glucose or acetate 37
that can be directly taken into the cell and used for energy production. 38
Cellulose is the most abundant biopolymer in the world and there is great interest in using 39
this material as a substrate in an MFC. However, the use of a particulate substrate in an MFC has 40
not been well investigated. Cellulose must first be hydrolyzed to a soluble substrate that can be 41
taken into the cell. In previous MFC tests this has required the use of enzymes to first hydrolyze 42
the cellulose into sugars or the use of co-cultures or mixed cultures (32, 33, 35). For example, 43
Ren et al. (32) used a co-culture of the cellulose fermentor Clostridium cellulolyticum and the 44
exoelectrogen Geobacter sulfurreducens to generate electricity in an MFC fed with cellulose. 45
Analysis of the anode microbial communities in other cellulose-fed MFC studies found that 46
Clostridium spp. (in biofilm) and Comamonadaceae (in suspension) were predominant when 47
using rumen contents as an inoculum (35), while a rice paddy soil inoculum (12) converged to a 48
Rhizobiales-dominated anode community (more than 30% of the population). To date, it has not 49
on July 6, 2018 by guesthttp://aem
.asm.org/
Dow
nloaded from
Page 3
3
been demonstrated that a single microbe could accomplish both cellulose degradation and current 50
generation. 51
Conventional methods of isolating exoelectrogenic microorganisms are primarily based 52
on identifying microorganisms that can respire using soluble or insoluble metal oxides in agar 53
plates (20-22). However, not all dissimilatory metal oxide reducing bacteria (DMRB) are capable 54
of producing electricity in an MFC, and not all bacteria that produce current in an MFC can grow 55
using metal oxides (5, 34). Therefore, these methods may miss important electrochemically 56
active strains of microorganisms. A new method to isolate exoelectrogenic microorganisms was 57
recently developed (40) based on dilution-to-extinction and a specially designed U-tube MFC 58
that enriches exoelectrogenic bacteria on the anode. Using this method, a bacterium was isolated 59
that could produce electricity in an MFC but not respire using iron (40). 60
The main objective of this study was to isolate a bacterium capable of producing current 61
from particulate cellulose. A cellulose-degrading consortium was diluted and serially transferred 62
into U-tube MFCs using cellulose as the sole electron donor. Community analysis demonstrated 63
the predominance of a single bacterium that was then isolated and compared to a culture 64
collection strain for current generation in the MFC. 65
66
Methods 67
MFC Construction and Operation. U-tube MFCs had a 10 mL anode chamber and a 30 mL 68
cathode chamber constructed from glass anaerobic culture tubes as described previously (40). 69
The two chambers were separated by a cation exchange membrane (CMI 7000, Membranes 70
International Inc, USA; 1.77 cm2) and held together by a C-type clamp. The anode was 71
ammonia-treated carbon cloth (type A, E-Tek, USA) with a total surface area of Aan= 1.13 cm2. 72
on July 6, 2018 by guesthttp://aem
.asm.org/
Dow
nloaded from
Page 4
4
The cathode was made of five tow strands of 15 cm-long carbon fiber (GRANOC, Nippon 73
Graphite Fiber Corporation, Japan) that were joined together at the top end using titanium wire. 74
The anode solution (9 mL) consisted of a 50 mM phosphate buffer (PBS; 2.45 g/L 75
NaH2PO4·H2O and 4.576 g/L Na2HPO4), 0.31 g/L NH4Cl, 0.13 g/L KCl, and mineral (12.5 76
mL/L) and vitamin (12.5 mL/L) solutions (23). To provide better nutrition media for enrichment 77
of cellulolytic bacteria, autoclaved rumen fluid (30%, v/v) was added to the anode solution for 78
the first 15 cycles. Plant origin pure cellulose (type 50-50, cotton linters, 50-µm particle size; 79
Sigmacell®, Sigma-Aldrich Co, USA) was the primary substrate (0.4 %), consisting of 15 % 80
amorphous cellulose and 85% crystalline cellulose (7). This model substrate represents the 81
structure of natural cellulose but provides particles of a defined size and composition for study. 82
The catholyte solution (29 mL) was 100 mM potassium ferricyanide, K3Fe(CN)6, in PBS (100 83
mM). After assembling the reactor, both chambers were sparged with N2 gas, sealed with a 84
rubber stopper and an aluminum crimp top, and autoclaved prior to use for each fed-batch cycle. 85
Enrichment Procedure. Wastewater used for the initial inoculum was obtained from a 86
paper recycling plant (American Eagle Paper Company, Tyrone, Pennsylvania). A dilution-to-87
extinction method was used to enrich exoelectrogenic and cellulolytic bacteria. Experiments 88
were repeated until the community (numbers and intensity of bands) did not change for at least 89
two consecutive cycles. U-tubes were initially inoculated with wastewater diluted to 10-1
, 10-2
, 90
10-3
, and 10-4
with medium and connected to the circuit with a fixed resistance (1000 Ω). After 91
each cycle, the anode chamber suspension and the anode were transferred from each MFC into a 92
sterile 15 mL tube (FALCON, Becton Dickenson Labware, USA) containing sterilized glass 93
beads, and vortexed. In each subsequent transfer, homogenized suspension from the most dilute 94
reactor that generated electricity was used to inoculate new batches. Samples were diluted at 10-1
, 95
on July 6, 2018 by guesthttp://aem
.asm.org/
Dow
nloaded from
Page 5
5
10-2
, 10-3
, and 10-4
for transfers 2 through 15, and 10-2
, 10-4
, 10-6
, and 10-8
for transfers 16 to 19. 96
An additional sterile reactor (no inoculation) was used to monitor for possible contamination of 97
the growth medium during each transfer. The remaining suspension in each tube was preserved 98
at -20 °C for further analysis. 99
DNA Extraction, PCR, and DGGE. DNA was extracted from the preserved anode 100
suspension of the most diluted reactor showing power from each cycle using the PowerSoil™ 101
DNA isolation kit (MO BIO Laboratories, US) according to the manufacturer’s instructions. 102
DNA integrity was verified using a 1% agarose gel. PCR was then performed using an iCycler 103
iQTM
thermocycler (Bio-Rad Laboratories, US) to amplify the V6-V8 region of the 16S rRNA 104
gene (rDNA) using the following primers (37), which included a GC clamp on the forward 105
primer for subsequent denaturing gradient gel electrophoresis (DGGE) analysis: GC968F (5′-106
CGCCCGCCGCGCCCCGCGCCCGGCCCGCCGCCCCCGCCCCAACGCGAAGAACCTTA107
C-3′) and 1401R (5′-CGGTGTGTACAAGACCC-3′). The PCR conditions were as described 108
previously (40). PCR products then were separated by DGGE using a DCode universal mutation 109
detection system (Bio-Rad Laboratories, US) as described previously (31, 40) . 110
Serial transfers were performed until the DGGE gel showed five bands that were 111
consistent for more than two transfers. Each of these bands was excised from the gel using a 112
sterile pipette tip and transferred to a sterile microcentrifuge tube. DNA was eluted from the 113
bands by adding 40 µL deionized water, crushing the gel against the tube side using a pipette tip, 114
and then incubating the tubes at 4°C overnight. DNA integrity was verified using a 1% agarose 115
gel. Two sets of PCR were performed with this eluted DNA, the first to check the purity of each 116
band using the same PCR and DGGE conditions described above (31). After confirming there 117
was only one band, a second PCR was performed to re-amplify the bands for subsequent 118
on July 6, 2018 by guesthttp://aem
.asm.org/
Dow
nloaded from
Page 6
6
sequencing using the same PCR primers, except the forward primer lacked the GC clamp (968F: 119
5′-AACGCGAAGAACCTTAC-3′), with the following conditions: 95°C for 5 min; 35 cycles of 120
95°C for 1 min, 60°C for 30 s, and 72°C for 1.5 min; and finally 72°C for 7 min. PCR products 121
then were purified using a QIAquick PCR purification kit (QIAGEN, USA) according to the 122
manufacturer’s instructions and sequenced using an ABI 3730XL DNA sequencer (Applied 123
Biosystems, US). 124
Cloning and Sequence Analysis. In addition to the DGGE analysis, extracted DNA from 125
the last cycle was amplified using the following PCR primers to amplify nearly complete 16S 126
rDNA: 27F (5′-AGAGTTTGATCCTGGCTCAG-3′) and 1541R (5′-127
AAGGAGGTGATCCAGCC-3′) as described previously (31, 40). The PCR condition was 95°C 128
for 5 min; 35 cycles of 95°C for 1 min, 60°C for 30 s, and 72°C for 1.5 min; and finally 72°C for 129
7 min. PCR products were then cloned using a TOPO TA cloning kit (Invitrogen, US) according 130
to the manufacturer’s instructions. The plasmid of clones was extracted and purified using a 131
QIAprep Spin Miniprep Kit (QIAGEN, USA) and sequenced in both directions using an ABI 132
3730XL DNA sequencer (Applied Biosystems, US). Sequences were analyzed in GenBank using 133
the BLAST program, and a neighbor-joining phylogenetic tree was constructed according to 134
Kimura’s two-parameter method using the Molecular Evolutionary Genetics Analysis package 135
(MEGA version 3)(15). 136
Bacteria Isolation and Characterization. Once the dominant bacterium was 137
determined based on DGGE band sequences and nearly complete cloned 16S rDNA sequences, 138
the corresponding type strain Enterobacter cloacae 13047T was purchased from the American 139
Type Culture Collection (ATCC) and grown based on their instructions. At the same time, we 140
tried to isolate the bacterium directly from mixed culture of the last cycle by plating it on the 141
on July 6, 2018 by guesthttp://aem
.asm.org/
Dow
nloaded from
Page 7
7
nutrition suggested by ATCC and growing it overnight. Six colonies with the same colony 142
morphology as the culture collection strain were selected and grown on nutrition broth overnight. 143
To confirm the purity and similarity of the selected colonies to the determined dominant 144
bacterium, DNA from each overnight suspension was extracted and nearly complete 16S rDNA 145
was amplified and sequenced as described earlier. 146
Carbon utilization characteristics of Enterobacter cloacae 13047T and the isolated 147
bacterium were determined using BIOLOG GN2 MicroPlates following the manufacturer’s 148
instructions. The ability of the isolated strain to reduce iron was determined using insoluble 149
hydrous ferric oxide (HFO; 100 mM) (8), in 1 g/L cellulose and 1 g/L glucose in anaerobic tubes 150
over 7 days at 30°C (triplicate tests). Uninoculated tubes (duplicate) were run as controls for 151
contamination. Reduction of Fe (III) was measured using a ferrozine colorimetric method as 152
described previously (24). 153
Electricity Generation and Analyses. Current and power generation in the MFCs were 154
determined by measuring the voltage (V) every 20 minutes across a fixed external resistance 155
(R=1000 Ω, except as noted) using a data acquisition system (Keithley, 2700, USA). Current was 156
calculated as I=V/R and power was calculated as P=IV. Power density and current density were 157
normalized to the projected area of the anode. Polarization curves were obtained by using a 158
single resistor for two complete batch cycles (250 Ω to open circuit). 159
The cellulose concentration remaining at the end of each batch cycle was measured using 160
a colorimetric method (32, 33). Volatile fatty acids (VFAs) were measured at the end of each 161
cycle using gas chromatography (19). Coulombic efficiency (ratio of the recovered electrons as 162
current to the total available electrons from the substrate) was calculated at the end of a cycle 163
based on cellulose removal as described previously (33). 164
on July 6, 2018 by guesthttp://aem
.asm.org/
Dow
nloaded from
Page 8
8
Enterobacter cloacae 13047T cultures grown overnight were also examined for electricity 165
generation using different carbon sources in PBS media [inoculant portion was 10% (v/v)]. The 166
carbon sources tested were cellulose, glucose, lactate, N-acetyl-D-glucosamine, glycerol, and 167
sucrose. Two controls were run, an uninoculated reactor (using the same medium and 0.4% 168
cellulose) to ensure there was no contamination, and an inoculated reactor without substrate to 169
monitor the possibility of electricity generation from the working medium. All media were 170
autoclaved prior to experiments. 171
172
Results 173
Exoelectrogenic/Cellulolytic Enrichment. U-tube reactors were run for 19 cycles after 174
wastewater inoculation until the community was stable over at least two consecutive cycles. For 175
cycles 1 to 15, the 10-4
dilution (the most diluted solution) produced electricity each time, and 176
therefore the MFC with this dilution was used to inoculate the next series of reactors (Figure 1A). 177
When higher dilutions were used (cycles 16 to 19), the highest dilution (10-8
) did not show any 178
power generation, therefore the next most dilute solution (10-6
) was used to inoculate the 179
subsequent batch (Figure 1B). For all 19 cycles, no power was generated with reactors lacking an 180
inoculum. 181
Phylogenetic Analysis. After 16 cycles, the community composition as indicated by the 182
number and intensity of bands in the DGGE gels was constant over the next three cycles (Figure 183
2). Analysis of the sequences from each of the five bands from the last cycle indicated that the 184
top three bands were derived from members of the family Enterobacteriaceae, while bands four 185
and five were 100% identical to Stenotrophomonas sp. and Exiguobacterium sp., respectively 186
(Table 1, Figure 3). The first band was 100% identical to Klebsiella pneumonia, a strain recently 187
on July 6, 2018 by guesthttp://aem
.asm.org/
Dow
nloaded from
Page 9
9
found to be exoelectrogenic (39). Bands 2 and 3 were respectively 99% and 100% similar to 188
Enterobacter cloacae (Figure 3). 189
Sequences from the clone library of the last cycle were also analyzed to further identify 190
the dominant bacterium. Phylogenic analysis of the clone library from cycle 19 showed that all 191
the analyzed cloned fragments belonged to Enterobacter species, with Enterobacter cloacae 192
ATCC 13047T (100% identity) as the dominant bacterium (Figure 3). An isolate obtained from 193
the mixed culture using suspension from the last cycle had a colony morphology similar to that 194
observed for the culture collection strain E. cloacae 13047T, and the nearly full length 16S rDNA 195
sequence was identical to that of E. cloacae 13047T. The isolate was designated as E. cloacae FR, 196
and the sequence was entered into the GenBank database (accession number EU849019). 197
Biochemical, Physiological, and Electrochemical Characteristics of E. cloacae 198
13047T and E. cloacae FR. E. cloacae ATCC 13047
T is a gram negative, facultative anaerobic, 199
rod-shaped bacterium that is motile with peritrichous flagella (4). Results from biochemical 200
characterization of E. cloacae 13047T
and E. cloacae FR
showed identical substrate versatility 201
(Table 2). 202
Although, E. cloacae 13047T was electrochemically active in an MFC, it did show Fe (III) 203
reduction using insoluble iron (HFO) with either glucose or cellulose as carbon sources. 204
Electricity was rapidly generated from cellulose in MFCs inoculated with E. cloacae 205
13047T or E. cloacae FR. The maximum current density at a fixed resistance was 119 ± 2.2 206
mA/m2 (1.6 ± 0.006 mW/m
2; R=1000 Ω) for E. cloacae 13047, which was slightly less than that 207
produced by E. cloacae FR of 127 ± 14 mA/m2 (1.8 ± 0.02 mW/m
2; R=1000 Ω). The current 208
density produced by the mixed culture from the last cycle was 221 ± 16 mA/m2 (5.5 ± 0.03 209
mW/m2), which was about twice that produced by either pure culture at the same resistance. 210
on July 6, 2018 by guesthttp://aem
.asm.org/
Dow
nloaded from
Page 10
10
Polarization curves showed that the maximum power density produced by the two strains 211
was similar, with 5.4 ± 0.3 mW/m2 for E. cloacae 13047
T and 4.9 ± 0.01 mW/m
2 for E. cloacae 212
FR. Both values were lower than that produced by the mixed culture from the last cycle (18 ± 2.2 213
mW/m2) (Figure 4). In all cases, the maximum power density was produced using a 5000 Ω 214
resistor. 215
Coulombic efficiency (CE) was calculated based on cellulose removal for E. cloacae 216
13047T
and the mixed culture from the last cycle. Cellulose decreased from 4 g/L to 2.8 g/L for E. 217
cloacae 13047T, with an overall CE of 14%. VFA analyses indicated that acetic acid (119 ± 14 218
ppm) was the primary constituent of organic matter in solution at the end of the batch, with lower 219
concentrations of ethanol (17 ± 1.1 ppm) and propanol (19 ± 3.5 ppm). For the mixed culture, 220
3.1 g/L of the cellulose remained at the end of cycle, and the CE was 26%. 221
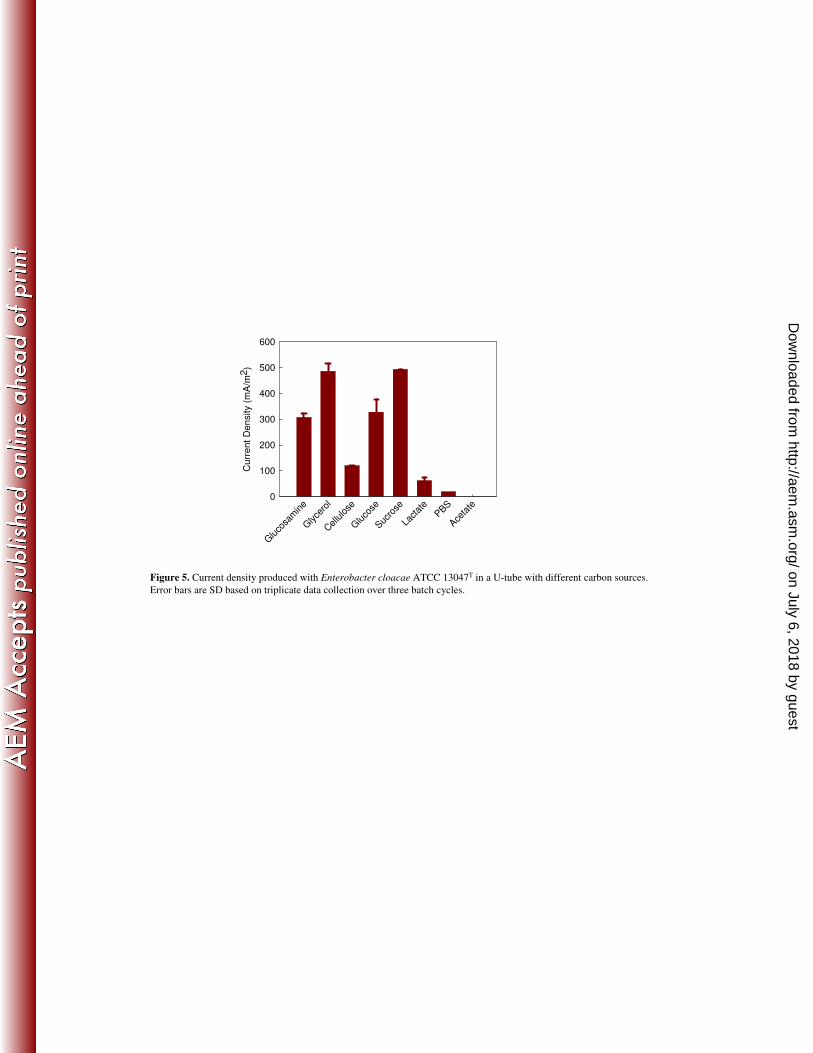
The ability of E. cloacae 13047T to produce electricity using other carbon sources was 222
monitored at an initial concentration of 4 g/L for each substrate over three complete cycles. The 223
maximum current density of 493 ± 0.8 mA/m2 was obtained with sucrose. Maximum current 224
densities were 486 ± 30 mA/m2 for glycerol, 328 ± 47 mA/m
2 for glucose, and 307 ± 15 mA/m
2 225
for N-acetyl-D-glucosamine. These values were all larger than that obtained with cellulose (119 226
± 2.2 mA/m2) suggesting that cellulose hydrolysis rates limited power generation (Figure 5). E. 227
cloacae 13047T generated a much lower current density with lactate (62 ± 12 mA/m
2), and no 228
current was produced with acetate. There was a small current density (18.5 mA/m2) generated 229
using only PBS, likely due to microbial decay (11) (Figure 5). There was no power generated in 230
any test with reactors that were not inoculated. 231
232
Discussion 233
on July 6, 2018 by guesthttp://aem
.asm.org/
Dow
nloaded from
Page 11
11
The conversion of cellulose to electricity in MFCs has previously required mixed cultures 234
or separate microorganisms to hydrolyze cellulose and generate electricity. It was demonstrated 235
here for the first time that E. cloacae could be used as the sole microorganism to accomplish 236
both cellulose degradation and electricity generation. E. cloacae has been found to have endo-1, 237
4-β-D-glucanase activity, and therefore it is able to degrade cellulose (36). However, it was not 238
previously known that E. cloacae could produce electricity in an MFC in the absence of 239
exogenous mediators. E. cloacae FR, isolated from a cellulose-degrading MFC here, generated 240
about the same amount of power as an authenticated strain (E. cloacae 13047T). It was 241
previously reported that E. cloacae II-BT 08 could produce power in an MFC from a complex 242
medium (Malt extract 1%, Yeast extract 0.4%, Glucose 1%). However, the current production by 243
E. cloacae II-BT 08 was only examined using exogenous mediators (methylene blue and 244
methylene viologen) (25). Thus, there was no evidence of current generation in a mediator-less 245
MFC or growth on cellulose. Although these two strains produced similar power densities, 246
isolates from MFCs do not always have the same properties as cultivated strains. For example, 247
Xing et al. (38) found that Rhodopseudomonas palustris DX-1 isolated from an MFC was 248
capable of high power generation in an MFC, but an ATCC culture collection strain R. palustris 249
17001 was not. 250
E. cloacae ATCC 13047T was found to be capable of power generation using two 251
different sugars (glucose and sucrose) as well as glycerol. Furthermore, E. cloacae can produce 252
hydrogen from fermentation of various substrates including glucose, sucrose, and cellobiose (18). 253
However, it was found using single substrates in U-tube MFC tests that this strain could not 254
produce much current from a common fermentation end product (lactate), and it did not utilize 255
acetate or butyrate. It was also observed that the growth of the pure cultures on cellulose resulted 256
on July 6, 2018 by guesthttp://aem
.asm.org/
Dow
nloaded from
Page 12
12
in the accumulation of various volatile fatty acids and solvents, with acetate being the 257
predominant product. Therefore, while this strain can both degrade cellulose and produce 258
electricity, it cannot fully utilize some breakdown products for power generation. Complete 259
utilization of the carbon sources in an MFC would therefore still require the addition of other 260
microbial strains to the culture, or genetic modification of E. cloacae to use these substrates. 261
While E. cloacae 13047T was able to generate electricity in an MFC, it was unable to 262
reduce solid Fe(III) oxide (HFO), and therefore it is not a DMRB (20-22). This is not the first 263
observation of current generation by a bacterium that is incapable of dissimilatory iron reduction. 264
For example, two mutants of Shewanella oneidensis MR-1 (SO4144, SO4572) were shown to 265
produce electricity in an MFC but were not able to reduce Fe(III) oxide (5). In another study, 266
Ochrobactrum anthropi YZ-1 was shown to produce electricity in an MFC but similarly lacked 267
an ability for respiration using iron (40). These findings reinforce the need to identify important 268
electricity-generating bacteria in MFCs by using techniques that isolate bacteria based on their 269
ability to generate current, and not just their ability for dissimilatory iron reduction. Although, E. 270
cloacae could not reduce Fe(III), it has been reported that this strain can reduce soluble chromate 271
ion to Cr(III) and selenate to selenium (16, 17). 272
Current densities produced using the mixed culture during the last three serial transfers 273
was higher than that produced by either strain of E. cloacae. The reason for this is not known, 274
but it is likely that other bacteria in the mixed community were able to use breakdown products 275
produced by E. cloacae for power generation. For instance, Klebsiella pneumonia, one of the 276
bacteria present in the mixed culture has been recently shown to produce electricity using starch 277
or glucose (39). It is also possible that there was a synergistic effect of multiple bacteria on 278
power generation. Pure cultures have been found to produce both more (26, 38) or less (29, 30, 279
on July 6, 2018 by guesthttp://aem
.asm.org/
Dow
nloaded from
Page 13
13
40) power than the mixed cultures from which they were isolated, depending on the strain and 280
the specific MFCs used (26). Additional research is needed to understand the effects of 281
additional bacteria on power production by certain strains of bacteria in MFCs. 282
283
Acknowledgments: 284
Support was provided in-part by the Pennsylvania Experiment Station, National Renewable 285
Energy Laboratory contract RFH-7-77623-01, and a grant from the Air Force Office of Scientific 286
Research. The authors thank D. W. Jones for his help in analytical measurements. 287
288
Literature Cited: 289
1. Bond, D. R., D. E. Holmes, L. M. Tender, and D. R. Lovley. 2002. Electrode-Reducing 290
Microorganisms That Harvest Energy from Marine Sediment. Sci. 295:483-485. 291
2. Bond, D. R., and D. R. Lovley. 2003. Electricity production by Geobacter 292
sulfurreducens attached to electrodes. Appl. Environ. Microbiol. 69:1548-1555. 293
3. Bond, D. R., and D. R. Lovley. 2005. Evidence for Involvement of an Electron Shuttle 294
in Electricity Generation by Geothrix fermentans. Appl. Environ. Microbiol. 71:2186-295
2189. 296
4. Boye, K., and D. Hansen. 2003. Sequencing of 16S rDNA of Klebsiella: taxonomic 297
relations within the genus and to other Enterobacteriaceae. Int. J. Med. Microbiol. 298
292:495-503. 299
5. Bretschger, O., A. Obraztsova, C. A. Sturm, I. S. Chang, Y. A. Gorby, S. B. Reed, D. 300
E. Culley, C. L. Reardon, S. Barua, M. F. Romine, J. Zhou, A. S. Beliaev, R. 301
Bouhenni, D. Saffarini, F. Mansfeld, B. Kim, J. K. Fredrickson, and K. H. Nealson. 302
2007. Current production and metal oxide reduction by Shewanella oneidensis MR-1 303
wild type and mutants. Appl. Environ. Microbiol. 73:7003-7012. 304
6. Chaudhuri, S. K., and D. R. Lovley. 2003. Electricity generation by direct oxidation of 305
glucose in mediatorless microbial fuel cells. Nat. Biotechnol. 21:1229-1232. 306
on July 6, 2018 by guesthttp://aem
.asm.org/
Dow
nloaded from
Page 14
14
7. Fan, L. T., Y.-H. Lee, and D. H. Beardmore. 1980. Mechanism and enzymatic 307
hydrolysis of cellulose: effects of major structural features of cellulose on enzymatic 308
hydrolysis. Biotechnol. Bioeng. 4:177-199. 309
8. Fredrickson, J. K., S. Kota, R. K. Kukkadapu, C. Liu, and J. M. Zachara. 2003. 310
Influence of electron donor/acceptor concentrations on hydrous ferric oxide (HFO) 311
bioreduction. Biodegradation 14:91-103. 312
9. Holmes, D. E., D. R. Bond, and D. R. Lovley. 2004. Electron transfer by Desulfobulbus 313
propionicus to Fe(III) and graphite electrodes. Appl. Environ. Microbiol. 70:1234-1237. 314
10. Holmes, D. E., J. S. Nicoll, D. R. Bond, and D. R. Lovley. 2004. Potential role of a 315
novel psychrotolerant member of the family Geobacteraceae, Geopsychrobacter 316
electrodiphilus gen. nov., sp. nov., in electricity production by a marine sediment fuel 317
cell. Appl. Environ. Microbiol. 70:6023-6030. 318
11. Hu, A. 2008. Electrochemical determination of anaerobic microbial decay coefficients. 319
Chemosphere 72:312-318. 320
12. Ishii, S., T. Shimoyama, Y. Hotta, and K. Watanabe. 2008. Characterization of a 321
filamentous biofilm community established in a cellulose-fed microbial fuel cell. BMC 322
Microbiol. 8:6. 323
13. Kim, B. H., H. J. Kim, M. S. Hyun, and D. S. Park. 1999. Direct electrode reaction of 324
Fe(III) reducing bacterium, Shewanella putrefaciens. J. Microbiol. Biotechnol. 9:127-325
131. 326
14. Kim, H. J., H. S. Park, M. S. Hyun, I. S. Chang, M. Kim, and B. H. Kim. 2002. A 327
mediator-less microbial fuel cell using a metal reducing bacterium, Shewanella 328
putrefaciens. Enzyme Microb. Technol. 30:145-152. 329
15. Kimura, M. 1980. A simple method for estimating evolutionary rates of base 330
substitutions through comparative studies of nucleotide sequences. J. Mol. Evol. 16:111-331
120. 332
16. Komori, K., R. Rivas, K. Toda, and H. Ohtake. 1990. Biological removal of toxic 333
chromium using an Enterobacter cloacae strain that reduces chromate under anaerobic 334
conditions. Biotechnol. Bioeng. 35:951-954. 335
17. Komori, K., P. Wang, K. Toda, and H. Ohtake. 1989. Factors affecting chromate 336
reduction in Enterobacter cloacae strain HO1. Appl. Microbiol. Biotechnol. 31:567-570. 337
18. Kumar, N., and D. Das. 2000. Enhancement of hydrogen production by Entrobacter 338
cloacae IIT-BT 08. Process Biochem. 35:589-593. 339
19. Liu, H., and B. E. Logan. 2004. Electricity generation using an air-cathode single 340
chamber microbial fuel cell in the presence and absence of a proton exchange membrane. 341
Environ. Sci. Technol. 38:4040-4046. 342
on July 6, 2018 by guesthttp://aem
.asm.org/
Dow
nloaded from
Page 15
15
20. Logan, B. E. 2008. Microbial Fuel Cells. John Wiley & Sons, Inc 343
New Jersey, NY. 344
21. Logan, B. E., and J. M. Regan. 2006. Electricity-producing bacterial communities in 345
microbial fuel cells. Trend. Microbiol 14:512-518. 346
22. Lovley, D. R. 2006. Bug juice: harvesting electricity with microorganisms. Nat. Rev. 347
Microbiol 4. 348
23. Lovley, D. R., and E. J. P. Philips. 1988. Novel mode of microbial energy metabolism: 349
Organism carbon oxidation coupled to dissililatory reduction of iron and manganese. 350
Appl. Environ. Microbiol 54:1472-1480. 351
24. Lovley, D. R., and E. J. P. Philips. 1986. Organic Matter Mineralization with Reduction 352
of Ferric Iron in Anaerobic Sediments. Appl. Environ. Microbiol 51:683-689. 353
25. Mohan, Y., S. M. M. Kumar, and D. Das. 2008. Electricity generation using microbial 354
fuel cells. Int. J. Hydrogen Energy 33:423-426. 355
26. Nevin, K. P., H. Richter, S. F. Covalla, J. P. Johnson, T. L. Woodard, A. L. Orloff, 356
H. Jia, M. Zhang, and D. R. Lovley. 2008. Power output and columbic efficiencies 357
from biofilms of Geobacter sulfurreducens comparable to mixed community microbial 358
fuel cells. Environ. Microbiol. 10:2505-2514. 359
27. Park, H. S., B. H. Kim, H. S. Kim, H. J. Kim, G. T. Kim, M. Kim, I. S. Chang, Y. K. 360
Park, and H. I. Chang. 2001. A novel electrochemically active and Fe(III)-reducing 361
bacterium phylogenetically related to Clostridium butyricum isolated from a Microbial 362
Fuel Cell. Anaerobe 7:297-306. 363
28. Pham, C. A., S. J. Jung, N. T. Phung, J. Lee, I. S. Chang, B. H. Kim, H. Yi, and J. 364
Chun. 2003. A novel electrochemically active and Fe(III)-reducing bacterium 365
phylogenetically related to Aeromonas hydrophila, isolated from a microbial fuel cell. 366
FEMS Microbiol. Lett. 223:129-134. 367
29. Rabaey, K., N. Boon, S. D. Siciliano, M. Verhaege, and W. Verstraete. 2004. Biofuel 368
cells select for microbial consortia that self-mediate electron transfer. Appl. Environ. 369
Microbiol 70:5373-5382. 370
30. Rabaey, K., N. Boon, S. D. Siciliano, M. Verhaege, and W. Verstraete. 2005. 371
Microbial phenazine production enhances electron transfer in biofuel cells. Environ. Sci. 372
Technol 70:3401-3408. 373
31. Ren, N., D. Xing, B. E. Rittmann, L. Zhao, T. Xie, and X. Zhao. 2007. Microbial 374
community structure of ethanol type fermentation in bio-hydrogen production. Environ. 375
Microbiol 9:1112-1125. 376
32. Ren, Z., T. E. Ward, and J. M. Regan. 2007. Electricity production from cellulose in a 377
microbial fuel cell using a defined binary culture. Environ. Sci. Technol. 14:4781-4786. 378
on July 6, 2018 by guesthttp://aem
.asm.org/
Dow
nloaded from
Page 16
16
33. Rezaei, F., T. L. Richard, and B. E. Logan. 2008. Enzymatic hydrolysis of cellulose 379
coupled with electricity generation in a microbial fuel cell. Biotechnol. Bioeng. 380
101:1163-1169. 381
34. Richter, H., M. Lanthier, K. P. Nevin, and D. R. Lovley. 2007. Lack of electricity 382
production by Pelobacter carbinolicus indicates that the capacity for Fe(III) oxide 383
reduction does not necessarily confer electron transfer ability to fuel cell anodes.. Applied 384
Environmental and Microbiology 73:5347-5353. 385
35. Rismani-Yazdi, H., A. D. Christy, B. A. Dehority, M. Morrison, Z. Yu, and O. H. 386
Tuovinen. 2007. Electricity generation from cellulose by rumen microorganisms in 387
Microbial Fuel Cells. Biotech. Bioeng 97:1398-1407. 388
36. Sami, A. J., M. Awais, and A. R. Shakoori. 2008. Preliminary studies on the production 389
of the endo-1, 4-?-D-glucanases activity produced by Enterobacter cloacae. Afr. J. 390
Biotechnol 7:1318-1322. 391
37. Watanabe, K., Y. Kodama, and S. Harayama. 2001. Design and evaluation of PCR 392
primers to amplify bacterial 16S ribosomal DNA fragments used for community 393
fingerprinting. J. Microbiol. Methods 44:253-262. 394
38. Xing, D., Y. Zuo, S. Cheng, J. M. Regan, and B. E. Logan. 2008. Electricity 395
generation by Rhodopseudomonas palustris DX-1. Environ. Sci. Technol 42:4146-4151. 396
39. Zhang, L., s. Zhou, L. Zhuang, W. Li, J. Zhang, N. Lu, and L. Deng. 2008. Microbial 397
fuel cell based on Klebsiella pneumoniae biofilm Electrochem Commun 10:1641-1643. 398
40. Zuo, Y., D. Xing, J. M. Regan, and B. E. Logan. 2008. Isolation of the exoelectrogenic 399
bacterium Ochrobactrum anthropi YZ-1 by using a U-tube microbial fuel cell. Appl. 400
Environ. Microbiol. 74:3130-3137. 401
402
403
404
on July 6, 2018 by guesthttp://aem
.asm.org/
Dow
nloaded from
Page 17
17
List of Figures: 405
Figure 1. Power generation from (A) the first cycle of U-tube using four different dilutions and 406
(B) the last (19th
) cycle of U-tube using four different dilutions. 407
Figure 2. DGGE bands of the 19 cycles from the most diluted U-tube that produced electricity. 408
Bands 1 to 5 were extracted from the gel for sequencing. 409
410
Figure 3. Phylogenetic tree of extracted bands from last cycle of DGGE and closely related 411
species of 16S rRNA gene. The tree was constructed using the neighbor-joining method. 412
Bootstrap values at nodes were calculated using 1000 replicates (only values >50% are 413
indicated). The scale bar represents 2 % divergence. 414
415
Figure 4. Polarization curve to measure maximum power density generated in reactors 416
inoculated with pure Enterobacter cloacae ATCC 13047T, isolate Enterobacter cloacae FR, and 417
mixed culture from last cycle. 418
419
Figure 5. Current density produced with pure culture Enterobacter cloacae ATCC 13047T in a 420
U-tube with different carbon sources. 421
422
on July 6, 2018 by guesthttp://aem
.asm.org/
Dow
nloaded from
Page 18
18
Table 1. Closest reported strains to the sequence of the last cycle’s bands from GenBank from 423
closest cultivated relatives. 424
Band# BLAST Results Identity (%)
1 Klebsiella pneumoniae 100
2 Enterobacter cloacae strain E717 99
3 Enterobacter cloacae partial, strain ATCC13047T 100
4 Stenotrophomonas sp. SWCH-5 100
5 Exiguobacterium sp. ZM-2 100
425
Table 2. Biochemical characteristics of Enterobacter Cloacae ATCC13047T and strain 426
Enterobacter Cloacae FR 427
428
429
430
431
432
433
434
435
436
437
438
a weak 439
Carbon source and electron donor Enterobacter
cloacae
Isolate FR
Dextrin + +
Glycogen +a
+a
N-Acetyl-D-glucosamine + +
D-Cellobiose + +
L-Arabinose + +
Gentiobiose +a +
a
D-Glucose +a +
a
D-Lactose + +
Sucrose + +
Acetic Acid +a +
a
Cis-Acontic Acid + +
Citric Acid + +
Formic Acid +a +
a
Lactic Acid + +
Glycerol + +
on July 6, 2018 by guesthttp://aem
.asm.org/
Dow
nloaded from
Page 19
Time (day)
0 2 4 6 8 10 12
Voltage (
V)
0.00
0.01
0.02
0.03
0.04
0.05
10-2
10-4
10-6
10-8
Time (Day)
0.0 0.5 1.0 1.5 2.0 2.5 3.0
Voltage (
V)
0.00
0.02
0.04
0.06
0.08
10-1
10-2
10-3
10-4
Blank
A
B
Figure 1. Power generation from (A) the first cycle of U-tube using four different dilutions and (B) the last (19th) cycle of
U-tube using four different dilutions
on July 6, 2018 by guesthttp://aem
.asm.org/
Dow
nloaded from
Page 20
M 1 2 3 4 5 6 7 8 9 10 11 12 13 14 15 16 17 18 19
12
3
5
4
Figure 2. DGGE bands of the 19 cycles of the most diluted U-tube that produced electricity. Bands 1 to5
was extracted from the gel for sequencing.
on July 6, 2018 by guesthttp://aem
.asm.org/
Dow
nloaded from
Page 21
Figure 3. Phylogenetic tree of extracted bands from last cycle of DGGE and dominant bacterium in clone library and closely related
species of 16S rRNA gene. and closely related species of 16S rRNA gene. The tree was constructed using the neighbor-joining method.
Bootstrap values at nodes were calculated using 1000 replicates (only values >50% are indicated). The scale bar represents 2 % divergence.
Enterobacter cowanii CIP 107300 (AJ508301)
Enterobacter radicincitans D5/23 (AY563134)
Shigella dysenteriae ATCC 13313 (X96966)
Escherichia fergusonii ATCC 35469 (AF530475)
Salmonella enterica ATCC 19430 (Z47544)
Enterobacter cloacae ATCC 13047 (AJ251469)
Band 3, U-tube Enterobacter cloacae FR (EU849019)
Band 2
Citrobacter farmeri CDC 299-81 (AF025371)
Serratia liquefaciens JCM1245 (AB004752)
Klebsiella variicola F2R9 (AJ783916)
Klebsiella pneumoniae ATCC 13883 (Y17656)
Band 1
Enterobacter kobei CIP 105566 (AJ508301)
Enterobacter asburiae JCM 6051 (AB004744)
Enterobacter hormaechei CIP 103441 (AJ508302)
Enterobacter aerogenes JCM 1235 (AB004750)
Citrobacter werkmanii CDC 0876-58 (AF025373)
Citrobacter braakii CDC 080-58 (AF025368)
Citrobacter murliniae CDC 2970-59 (AF025369)
Stenotrophomonas maltophilia ATCC 13637 (AB008509)
Band 4
Exiguobacterium aestuarii TF-16 (AY594264)
Band 5
91
83
82
52
62
50
50
100
100
100
0.02
on July 6, 2018 by guesthttp://aem
.asm.org/
Dow
nloaded from
Page 22
Figure 4. Polarization curve to measure maximum power density generated in reactors inoculated with pure
Enterobacter cloacae ATCC 13047T, isolate Enterobacter cloacae FR and mixed culture from last cycle.
bars are SD based on duplicate data collection over two batch cycles.
Current Density (mA/m2)
0 100 200 300 400 500 600
Voltage (
mV
)
0
100
200
300
400
5000 100 200 300 400 500 600
Pow
er
Density (
mW
/m2)
0
5
10
15
20
25
Enterobacter Cloacae ATCC 13047T
Mixed culture
Enterobacter Cloacae FR
on July 6, 2018 by guesthttp://aem
.asm.org/
Dow
nloaded from
Page 23
Gluco
sam
ine
Glyce
rol
Cellulose
Gluco
se
Sucro
se
Lactat
ePBS
Aceta
te
Curr
ent D
ensity (
mA
/m2)
0
100
200
300
400
500
600
Figure 5. Current density produced with Enterobacter cloacae ATCC 13047T in a U-tube with different carbon sources.
Error bars are SD based on triplicate data collection over three batch cycles.
on July 6, 2018 by guesthttp://aem
.asm.org/
Dow
nloaded from