p 1 Simultaneous Characterization of Highly Polar, Polar and Nonpolar Compounds in River Water using Serial Coupled RPLC and HILIC with a QTRAP ® 5500 LC-MS/MS Identification using MRM Ratios and Enhanced Product Ion Scanning (EPI) Andrea Boltner 1 , Wolfgang Schröder 1 , Sylvia Grosse 1 , André Schreiber 2 , and Thomas Letzel 1 1 Technical University of Munich, Chair of Urban Water Systems and Engineering, Garching (Germany); 2 SCIEX Concord, Ontario (Canada) Introduction Liquid Chromatography using reversed phase columns (RPLC) coupled to tandem Mass Spectrometry has become a preferred tool for the identification and quantitation of hydrophobic compounds in environmental samples, such as wastewater and surface water. However, water research lacks information about highly polar and hydrophilic compounds present in water. In this application note we describe an easy and efficient method based on the serial coupling of RPLC and zwitterionic Hydrophilic Interaction Liquid Chromatography (HILIC) to simultaneously separate polar and nonpolar compounds occurring in wastewater. 1, 2 Pharmaceuticals, pesticides and industrial chemicals were detected and identified using a SCIEX QTRAP ® 5500 LC-MS/MS system operated in MRM-IDA-EPI scanning mode. Information Dependent Acquisition (IDA) combining MRM and EPI enables compound identification based on MRM ratios but also using full scan MS/MS spectra for library searching. Quantitative results were achieved by processing MRM data acquired using the Scheduled MRM™ algorithm. Experimental Chemicals Water (LC/MS-grade) was obtained from Sigma Aldrich and acetonitrile (HiPerSolv) was obtained from VWR. Chemical standards were purchased from different sources: ammonium acetate, acesulfame K, betaine, carbamazepine, diclofenac sodium, gabapentin, ɤ-aminobutyric acid, glyphosate, ibuprofen, isopentylamine, melamine, and vigabatrin from Sigma Aldrich; cyanuric acid and metformin hydrochloride from Fluka, acetylcholinechloride from Acros Organics, and methylparaben from IjSP Biochema Schwaben GmbH. Sample Preparation SPE cartridges Strata C18-E (500 mg / 3mL) were obtained from Phenomenex and SPE cartridges ZIC-HILIC (1g / 6 mL) from DiChrom. Prior to analysis the samples were filtered through a 0.22 μm PVDF filter.
Transcript
p 1
Simultaneous Characterization of Highly Polar, Polar and Nonpolar Compounds in River Water using Serial Coupled RPLC and HILIC with a QTRAP® 5500 LC-MS/MS Identification using MRM Ratios and Enhanced Product Ion Scanning (EPI)
Andrea Boltner1, Wolfgang Schröder1, Sylvia Grosse1, André Schreiber2, and Thomas Letzel1 1Technical University of Munich, Chair of Urban Water Systems and Engineering, Garching (Germany); 2SCIEX Concord, Ontario (Canada)
Introduction Liquid Chromatography using reversed phase columns (RPLC) coupled to tandem Mass Spectrometry has become a preferred tool for the identification and quantitation of hydrophobic compounds in environmental samples, such as wastewater and surface water.
However, water research lacks information about highly polar and hydrophilic compounds present in water.
In this application note we describe an easy and efficient method based on the serial coupling of RPLC and zwitterionic Hydrophilic Interaction Liquid Chromatography (HILIC) to simultaneously separate polar and nonpolar compounds occurring in wastewater.1, 2
Pharmaceuticals, pesticides and industrial chemicals were detected and identified using a SCIEX QTRAP® 5500 LC-MS/MS system operated in MRM-IDA-EPI scanning mode. Information Dependent Acquisition (IDA) combining MRM and EPI enables compound identification based on MRM ratios but also using full scan MS/MS spectra for library searching. Quantitative results were achieved by processing MRM data acquired using the Scheduled MRM™ algorithm.
Experimental Chemicals
Water (LC/MS-grade) was obtained from Sigma Aldrich and acetonitrile (HiPerSolv) was obtained from VWR.
Chemical standards were purchased from different sources: ammonium acetate, acesulfame K, betaine, carbamazepine, diclofenac sodium, gabapentin, ɤ-aminobutyric acid, glyphosate, ibuprofen, isopentylamine, melamine, and vigabatrin from Sigma Aldrich; cyanuric acid and metformin hydrochloride from Fluka, acetylcholinechloride from Acros Organics, and methylparaben from IjSP Biochema Schwaben GmbH.
Sample Preparation
SPE cartridges Strata C18-E (500 mg / 3mL) were obtained from Phenomenex and SPE cartridges ZIC-HILIC (1g / 6 mL) from DiChrom. Prior to analysis the samples were filtered through a 0.22 µm PVDF filter.
p 2
150 mL aliquots of river water samples from a sewage treatment plant were cleaned up and concentrated (300x) using SPE prior to LC-MS/MS analysis.
LC Separation
Two Agilent 1260 Infinity LC systems, consisting of a binary pump, an on-line degasser, and a mixing chamber, were used for pumping independent LC gradients for the HILIC column and the RPLC column (Figure 1).
Figure 1. Setup of RPLC and HILIC coupled to MS/MS
For RPLC an Agilent C18 Poroshell (50 x 3 mm, 2.7 µm) column was used with a gradient of water and acetonitrile with 10 mM ammonium acetate.
For HILIC a ZIC-HILIC (150 x 2.1 mm, 5 µm) column was used with a gradient of acetonitrile and water. The LC was kept at ambient temperature and the injection volume was set to 10 µL.
The gradient profile and flow rates are described in detail in Table 1.
Table 1. LC gradient for RPLC and HILIC
RPLC HILIC
Time (min) Flow (mL/min) B (%) Flow
(mL/min) B (%)
0.0 0.05 0 0.4 0
6.0 - - 0.4 0
7.0 0.05 0 - -
12.0 0.05 50 - -
13.0 0.10 50 0.4 40
22.0 0.10 100 - -
32.0 0.10 100 0.4 40
33.0 0.10 0 0.8 0
53.0 0.10 0 0.8 0
54.0 0.05 0 0.4 0
58.0 0.05 0 0.4 0
MS/MS Detection
A SCIEX QTRAP® 5500 system equipped with Turbo V™ source and an Electrospray Ionization (ESI) probe was used to detect target compounds. The mass spectrometer was operated in Multiple Reaction Monitoring (MRM) mode using the Scheduled MRM™ algorithm and positive and negative polarity with a settling time of 50 msec.
Details of the MRM method are described in Table 2. The MRM detection window was 60 sec with a target scan time of 1 sec.
Positive polarity and negative polarity MRM experiments were combined with positive and negative polarity EPI scanning using Information Dependent Acquisition (IDA) to utilize MRM ratios and MS/MS spectra for compound identification. IDA criteria were set to acquire the MS/MS spectrum of the most intense peak of the MRM survey. Dynamic background subtraction was activated and the IDA threshold was set to 1000 CPS. EPI scanning was performed with a scan speed of 10000 Da/sec. The Collision Energy (CE) was set to 40 V with a Collision Energy Spread (CES) of 20 V.
For all four experiments the following ion source settings were used: Curtain Gas (CUR) = 40 psi, IonSpray voltage (IS) = ±1500 V, nebulizer gas (GS1) = 70 psi, heater gas (GS2) = 50 psi, and source temperature (TEM) = 600ºC.
p 3
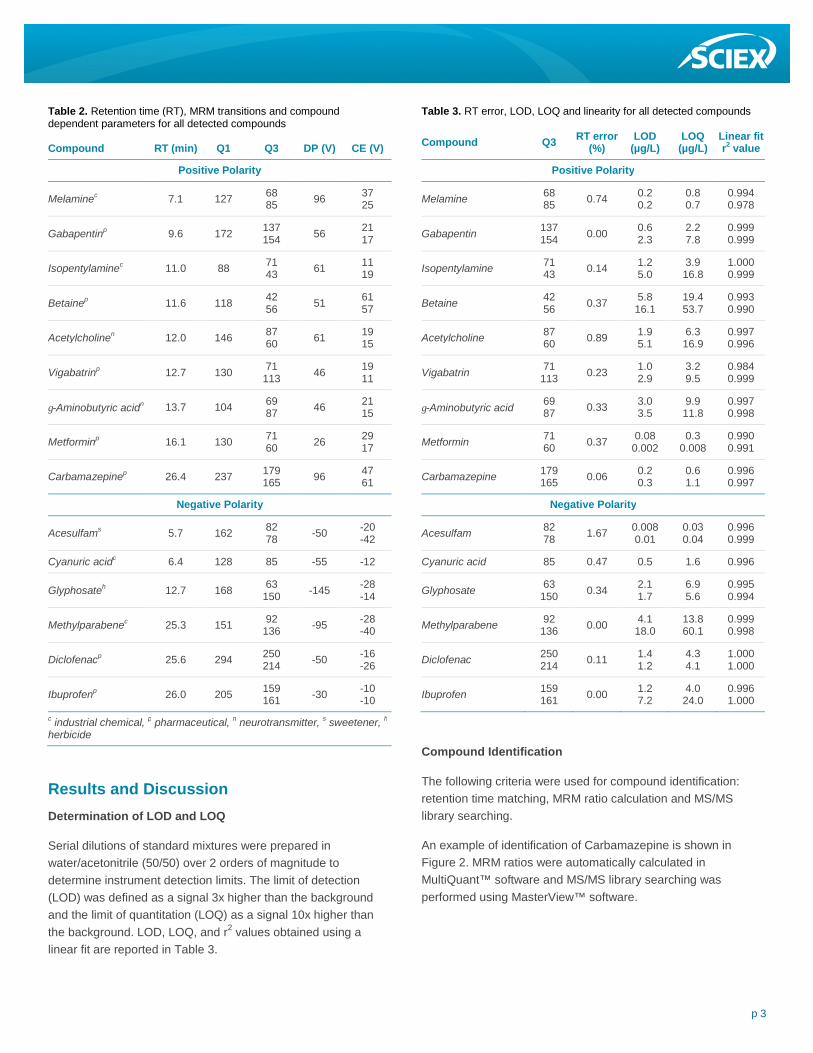
Table 2. Retention time (RT), MRM transitions and compound dependent parameters for all detected compounds
Compound RT (min) Q1 Q3 DP (V) CE (V)
Positive Polarity
Melaminec 7.1 127 68 85 96 37
25
Gabapentinp 9.6 172 137 154 56 21
17
Isopentylaminec 11.0 88 71 43 61 11
19
Betainep 11.6 118 42 56 51 61
57
Acetylcholinen 12.0 146 87 60 61 19
15
Vigabatrinp 12.7 130 71 113 46 19
11
γ-Aminobutyric acidn 13.7 104 69 87 46 21
15
Metforminp 16.1 130 71 60 26 29
17
Carbamazepinep 26.4 237 179 165 96 47
61
Negative Polarity
Acesulfams 5.7 162 82 78 -50 -20
-42
Cyanuric acidc 6.4 128 85 -55 -12
Glyphosateh 12.7 168 63 150 -145 -28
-14
Methylparabenec 25.3 151 92 136 -95 -28
-40
Diclofenacp 25.6 294 250 214 -50 -16
-26
Ibuprofenp 26.0 205 159 161 -30 -10
-10 c industrial chemical, p pharmaceutical, n neurotransmitter, s sweetener, h herbicide
Results and Discussion Determination of LOD and LOQ
Serial dilutions of standard mixtures were prepared in water/acetonitrile (50/50) over 2 orders of magnitude to determine instrument detection limits. The limit of detection (LOD) was defined as a signal 3x higher than the background and the limit of quantitation (LOQ) as a signal 10x higher than the background. LOD, LOQ, and r2 values obtained using a linear fit are reported in Table 3.
Table 3. RT error, LOD, LOQ and linearity for all detected compounds
Compound Q3 RT error (%)
LOD (µg/L)
LOQ (µg/L)
Linear fit r2 value
Positive Polarity
Melamine 68 85 0.74 0.2
0.2 0.8 0.7
0.994 0.978
Gabapentin 137 154 0.00 0.6
2.3 2.2 7.8
0.999 0.999
Isopentylamine 71 43 0.14 1.2
5.0 3.9 16.8
1.000 0.999
Betaine 42 56 0.37 5.8
16.1 19.4 53.7
0.993 0.990
Acetylcholine 87 60 0.89 1.9
5.1 6.3 16.9
0.997 0.996
Vigabatrin 71 113 0.23 1.0
2.9 3.2 9.5
0.984 0.999
γ-Aminobutyric acid 69 87 0.33 3.0
3.5 9.9 11.8
0.997 0.998
Metformin 71 60 0.37 0.08
0.002 0.3
0.008 0.990 0.991
Carbamazepine 179 165 0.06 0.2
0.3 0.6 1.1
0.996 0.997
Negative Polarity
Acesulfam 82 78 1.67 0.008
0.01 0.03 0.04
0.996 0.999
Cyanuric acid 85 0.47 0.5 1.6 0.996
Glyphosate 63 150 0.34 2.1
1.7 6.9 5.6
0.995 0.994
Methylparabene 92 136 0.00 4.1
18.0 13.8 60.1
0.999 0.998
Diclofenac 250 214 0.11 1.4
1.2 4.3 4.1
1.000 1.000
Ibuprofen 159 161 0.00 1.2
7.2 4.0 24.0
0.996 1.000
Compound Identification
The following criteria were used for compound identification: retention time matching, MRM ratio calculation and MS/MS library searching.
An example of identification of Carbamazepine is shown in Figure 2. MRM ratios were automatically calculated in MultiQuant™ software and MS/MS library searching was performed using MasterView™ software.
p 4
Figure 2. Confident identification of carbamazepine using MRM ratio calculation and MS/MS library searching based on the information saved into the IDA data file
Analysis of River Water Sample
A water sample was extracted and analyzed in triplicate. Four compounds were successfully identified and quantified.
Melamine and Metformin, both separated on the HILIC phase, and Carbamazepine and Methylparabene, both separated on the RPLC phase, were present at sub µg/L concentrations
All 4 compounds were identified with high confidence based on their MRM ratio and by MS/MS library searching (Table 4 and Figures 3a to 3d).
Table 4. Compounds detected in river water (analysis in triplicate, quantitation based on quantifier MRM transition)
Compound Conc. (µg/L)
RT error (min) Ion ratio Ion ratio
error Library FIT (%)
HILIC
Melamine 0.05 0.04 0.567 0.58% 98.0
Metformin 0.09 0.04 0.754 2.01% 98.8
RPLC
Carbamazepine 0.001 0.00 0.719 1.97% 98.7
Methylparabene 0.04 0.02 0.0009 14.3% 100.0
Figure 3a. Identification of Melamine in a river water sample using MasterView™ software
Figure 3b. Identification of Metformin in a river water sample using MasterView™ software
Figure 3c. Identification of Carbamazepine in a river water sample using MasterView™ software
The trademarks mentioned herein are the property of AB Sciex Pte. Ltd. or their respective owners. AB SCIEX™ is being used under license.
Publication number: RUO-MKT-02-3765-A Headquarters International Sales 500 Old Connecticut Path, Framingham, MA 01701 USA For our office locations please call the division Phone 508-383-7700 headquarters or refer to our website at www.sciex.com www.sciex.com/offices
Figure 3d. Identification of Methylparabene in a river water sample using MasterView™ software
FOR-IDENT
Compounds of emerging concern, such as the examples studied in this project, can be observed with non-target screening strategies as currently presented by various laboratories participating in the FOR-IDENT project.
The objective of the FOR-IDENT project is to improve the identification of organic trace substances by standardization of suspect- and non-target screening workflows linking results with open access tools and databases.3
For details visit: http://for-ident.hswt.de/
Summary Here we presented an easy and efficient LC-MS/MS method for the identification and quantitation of hydrophobic and hydrophilic compounds of environmental concern. The LC separation was based on the serial coupling of a RPLC and zwitterionic HILIC column and mobile phase setup. The detection method used a QTRAP® 5500 system operated in IDA mode to combine selective MRM quantitation with identification using MRM ratios and MS/MS library searching.
References 1 G. Greco, S. Grosse, T. Letzel: ‘Serial coupling of reversed-
phase and zwitterionic hydrophilic interaction LC/MS for the analysis of polar and nonpolar phenols in wine’ J Sep Sci. 36 (2013) 1379-1388
2 G. Greco, T. Letzel: ‘Main Interactions and Influences of the Chromatographic Parameters in HILIC Separations’ J Chromatogr. Sci. 51 (2013) 684-693
3 T. Letzel, A. Bayer, W. Schulz, A. Heermann, T. Lucke, G. Greco, S. Grosse, W. Schüssler, M. Sengl, M. Letzel: ‘LC-MS Screening Techniques for Waste Water Analysis and Analytical Data Handling Strategies: Sartans and Their Transformation Products as an Example’ Chemosphere 137 (2015) 198-206