. INTRODUCTIONptical coherence tomography (OCT) is an imaging tech-ique that allows cross sectional visualization of retinaltructure in vivo.1,2 It has been shown to be useful in theiagnosis and management of a wide variety of ocularonditions.3–5 Different varieties of OCT technology exist.ime domain systems produce A-scans by varying the op-ical path difference between the sample and the refer-nce mirror of an interferometer.1,2 The most commonime domain systems collect multiple A-scans to construct-scans analogous to ultrasound B-scans. A recent ad-ance in time domain OCT technology is the developmentf the OCT scanning laser ophthalmoscope (OCT/SLO)Ophthalmic Technologies Inc. (OTI), Toronto,anada].6–10 This instrument uses transverse scanners tocan in a direction perpendicular to the A-scan to create-scans. B-scans can be generated from multiple T-scans.n face, or coronal (C-scan), images can also be con-tructed from multiple T-scans. Coronal scanning haseen shown to provide valuable additional information onhe pathology of many conditions, including central se-ous retinopathy,11 macular hole,12 and cystoid maculardema.12 Current time domain OCT systems typicallyave a depth resolution of approximately 8 �m; however,ub-3-�m resolution (ultrahigh-resolution OCT; UHR-CT) has now been achieved due to the introduction ofide-bandwidth light sources.13 Fourier domain OCT isn alternative technique where the interferometer outputs analyzed by an optical spectrometer, enabling ultrafastcan acquisition.14,15 A recent development in Fourier do-ain OCT technology is swept source OCT, which uses a
aser source instead of the broadband source of the otherystems.16,17 The laser frequency has to be swept throughn equivalent frequency band of the broadband source inime domain OCT.
Conditions affecting the structure of the retina usuallylter the function of the area involved.18,19 A well-stablished technique used to objectively assess retinalunction at multiple sites is multifocal electroretinogra-hy (mfERG). This technique was first described by Sut-er and Tran20 and has since been documented to be aseful tool in the assessment of many conditions affectingetinal function.21,22 The technique is now well estab-ished and is used as a standard investigative tool in
any electrophysiology clinics worldwide. Multiple vari-ties of the technology exist, including VERIS (Electro-iagnostic Imaging, San Mateo, California, USA), Reti-
CAN (Roland Consult, Wiesbaden, Germany), and customuilt systems.23
Advances in pharmacological and surgical interven-ions for macular disorders mean it is increasingly impor-ant to be able to objectively assess macular structure andunction accurately and at high resolution in order to pro-ide vital feedback on the success of these interventions.tudies have been conducted using OCT and mfERG tossess macular structural and functional changes in re-ponse to surgical or pharmacological interventions forarious macular pathologies.18,19 While these studiesave proved valuable, they have the limitation of havingo means of accurately correlating the structural andunctional changes observed.
While mfERG is a useful method of objectively assess-
007 Optical Society of America
idrrctefoascodsfim
amattoslpsc
2Twwitawfilmeootm
AMstTcschhcgr
ccogsd3aDdtd
(sghB
BMIttmmps
tobdmf
P
a
Dudgeon et al. Vol. 24, No. 5 /May 2007/J. Opt. Soc. Am. A 1395
ng retinal function, it can lack the spatial resolution toetect subtle macular dysfunction. Improving the spatialesolution by increasing the number of areas stimulatedequires accurate fixation monitoring to ensure that spe-ific focal assessment of function is achieved without con-amination from neighboring areas. It is also important tonsure accurate assessment of changes in focal retinalunction in subsequent tests. A system has been devel-ped that combines mfERG with confocal SLO (cSLO) tollow high-resolution assessment of retinal function withimultaneous fundus monitoring.24 However, the mono-hromatic light source and relatively slow scanning speedf the cSLO means that the strength of the response is re-uced and the effect of nonlinear contributions to the re-ponse is limited.25 Also, although the technique allowsunctional assessment of the retina while simultaneouslymaging the retinal surface, it does not provide any infor-
ation on cross-sectional retinal structure.This paper describes a new technique, multimodal im-
ging (MMI), that combines an OCT ophthalmoscope withfERG to allow simultaneous structural and functional
ssessment of the macula. The technique allows func-ional information to be collected at higher resolutionhan conventional mfERG and has the added advantagef simultaneously capturing en face and transverse OCTcans of the areas stimulated. MMI provides direct corre-ation between macular structure and function and couldrove a significant new breakthrough in the accurate as-essment and monitoring of a wide variety of macularonditions.
. METHODSo evaluate multimodal imaging (MMI), five patientsith a relatively common retinal disorder, macular hole,ere assessed using the technique. The patients ranged
n age from 59 to 74 years and had visual acuities of be-ween 20/80 and 20/200. The individual patient detailsre listed in Table 1. Patients’ pupils were fully dilatedith 1% tropicamide. Each patient then underwent wide-eld multifocal electroretinography (WF-mfERG) fol-
owed by MMI, where a higher-resolution mfERG (“micro-fERG”) stimulus was projected onto an organic light-
mitting diode (OLED) display integrated into the opticsf a prototype OCT ophthalmoscope (OCT/SLO; OTI, Tor-nto, Canada) device. Micro-mfERG recordings were ob-ained without affecting the function of the OCT ophthal-oscope.
. Multifocal ERG Recordingultifocal ERGs were recorded using a custom built
ystem.26 Disposable skin electrodes (Neuroline) were at-ached to the temples (reference) and forehead (ground).he active electrodes used were (Dawson–Trick–Litzkow)orneal electrodes (Diagnosys LLC, Littleton, Massachu-etts, USA). The room lights were dimmed. The multifo-al ERG stimulus used was an array of empirically scaledexagonal elements with a central fixation cross. Theexagons were scaled with eccentricity to take into ac-ount photoreceptor topography, projection luminanceradient, and photoadaptive response profile. A pseudo-andom binary m-sequence of length 215−1 was used to
ontrol the on/off state of the elements. The sequence washecked to ensure that when decimated it would providerthogonality between higher-order contributions to de-ree 3. The recording time was 8 min, split into 16 equalegments of 30 s to help ensure good patient complianceuring the test. A dual high/low-pass filter of 10–100 and–300 Hz was used with an amplifier gain of 100,000 andn analog-to-digital (ADC) digitization rate of 1200 Hz.uring the recording, the raw data were visible, and in-ividual segments were deleted and recorded again ifhere was evidence of poor fixation or excessive saturationue to eye movements or blinking.Patients were first assessed with wide-field mfERG
WF-mfERG). During WF-mfERG recording, the patientat 30 cm from a LCD backprojected screen. Ninety de-rees of the visual field was stimulated using a 61-exagonal-element array with a central fixation cross.19
oth eyes were tested simultaneously.
. Multimodal Imaging (MMI) Using Combinedicro-mfERG and an OCT Ophthalmoscope
mmediately following the wide-field mfERG recording,he patient was assessed with the MMI technique. Pa-ients’ pupils remained dilated, and the room lighting re-ained dim. MMI was performed using the custom builtfERG system described above, which was linked to the
rototype OCT ophthalmoscope. The system setup ishown in Fig. 1.
The OCT ophthalmoscope is a time domain OCT sys-em that uses light emitted by a superluminescent diodeperating at an infrared wavelength of 820 nm (20 nmandwidth). The light beam is split with one portion beingirected to the retina and the other portion to a referenceirror. An interferometer combines the reflected light
rom the retina and the reference mirror and measures
Table 1. Patient Detailsa
atient Age Eye Tested Visual Acuity
1 59 Left 20/802 70 Right 20/1203 64 Left 20/2004 74 Right 20/2005 76 Left 20/200
aIndividual details of patients 1–5 including age, eye affected by macular hole,nd visual acuity in the affected eye.
Fig. 1. MMI setup.
tnfiBsndAndpvilt
fctTOhmsvtgaOivudsaamf
WswmmcttTmfioDtruratTa
3AOfiitBs(mcvsof°aaaO27
BAsTptblhermt
FscWstsmcda1fiev
1396 J. Opt. Soc. Am. A/Vol. 24, No. 5 /May 2007 Dudgeon et al.
he interference patterns produced to create an OCT sig-al. The OCT ophthalmoscope scans in an X–Y plane at axed Z coordinate, generating transverse scans (T-scan).-scans or coronal “en-face” (C-scan) images can be con-tructed from multiple T-scans by moving the Z coordi-ate. A small part of the light reflected from the retina isiverted to a photomultiplier to produce a confocal signal.s the OCT and confocal signals are captured simulta-eously through the same optics, the resultant images areisplayed concurrently on a computer screen and areixel-to-pixel correspondent. The images are recorded inideo format and can be reviewed at the end of the record-ng time. The system has an axial and longitudinal reso-ution of 8 �m and a transverse resolution of 20 �m. Theechnology is described in more detail elsewhere.6–10
During preparation for MMI recording, the patient satacing the OCT ophthalmoscope with the chin resting on ahin rest and forehead pressed against a bar to ensurehat the head remained static throughout the recording.he micro-mfERG stimulus array was projected onto anLED (eMagin, Bellevue, Washington, USA) display thatad been integrated into the optics of the OCT ophthal-oscope. OLEDs are thin-film LEDs in which the emis-
ive layer is an organic compound, so they have the ad-antage of not requiring a backlight to function, meaninghey are truly black when off. This feature is advanta-eous when presenting the mfERG stimulus, as it allowshigh contrast between the on and off components. TheLED display also has other characteristics that make it
deal for micro-mfERG recording. It has a 24° field ofiew, high luminance of up to 820 cdm−2, a refresh rate ofp to 85 Hz, a rapid 1 ms rise time, and also retains theigital aspect of the stimulus. Twenty degrees of the vi-ual field was stimulated using a 19-hexagonal-elementrray. This stimulus pattern was chosen, as it providedpproximately 3 times the spatial resolution of WF-fERG while allowing the acquisition of robust signals
or clinical interpretation. A comparison of the
ig. 2. Multifocal ERG stimulus patterns. (A) The WF-mfERGtimulus consists of 61 empirically scaled hexagonal elementsovering 90° of the visual field. (B) The central 7 elements of theF-mfERG stimulus cover 22° of the field, approximately the
ame field covered by (C), the micro-mfERG stimulus. Note thathe micro-mfERG stimulus pattern is composed of 19 empiricallycaled hexagonal elements and therefore stimulates at approxi-ately 3 times higher resolution than the WF-mfERG. The gray
ircles overlying the stimulus pattern in (B) and (C) illustrate theifference in hexagon size with retinal eccentricity for the WF-nd micro-mfERG stimuli, respectively. In the WF-mfERG, ring(the central element) stimulates the central 6° of the visual
eld, and ring 2 stimulates the central 22°. Ring 1 (the centrallement) in the micro-mfERG stimulates the central 2.6° of theisual field, ring 2 stimulates 10°, and ring 3 stimulates 20°.
F-mfERG and micro-mfERG stimulus patterns ishown in Fig. 2. The patient was tested unilaterally andas instructed to fixate on a cross in the center of theicro-mfERG array. The OCT ophthalmoscope and micro-fERG recording were then commenced. During the re-
ordings, the operator monitored the patient’s fixation viahe confocal fundus image, which was displayed in realime in video format at a rate of 2 frames per second.hey also assessed the raw data input from the micro-fERG. Segments were rejected and recorded again ifxation was lost or saturation of the micro-mfERG signalccurred due to eye movements or excessive blinking.uring the 8 min micro-mfERG recording time, OCT oph-
halmoscope images were recorded in video format at aate of 2 frames per second. A scan depth of 1.125 mm wassed for all patients. Coronal (C-scan) OCT images wereecorded at multiple depths. Transverse (B-scan) OCT im-ges were collected at multiple adjacent sites throughouthe central 20° in both a horizontal and a vertical plane.his ensured that OCT images were obtained of all thereas stimulated by the micro-mfERG.
. RESULTS. OCT Ophthalmoscope ImagingCT ophthalmoscope imaging confirmed the presence of a
ull-thickness macular hole in all five patients. As shownn Fig. 3, the full-thickness macular hole could be visual-zed on the confocal fundus image as a circular lesion athe central macula surrounded by a darker ring. OCT-scanning showed a full-thickness defect in the neuro-ensory retina with an intact retinal pigment epitheliumRPE). In four of the five patients, the full-thicknessacular hole was surrounded by a cuff of intraretinal
ysts of various sizes. Coronal scanning enabled accurateisualization of the extent of the macular hole and theurrounding cuff of intraretinal fluid. The basal diameterf the hole was measured from OCT B-scans and rangedrom 0.8 to 2.1 mm (mean 1.3±0.46). Since 1 mm equals 3of visual angle, the holes therefore covered between 2.4°nd 6.3° (mean 4.0±1.4). The diameter of the total areaffected by the macular hole (including the cuff of intr-retinal fluid where present) was also measured from theCT B-scans and ranged from 1.7 to 4.2 mm (mean.4±1.0). This was equivalent to 4.2° to 12.6° (mean.1±3.1).
. Wide-Field mfERG/Micro-mfERGs shown in Fig. 2, the central element of the WF-mfERGtimulates 6° of the visual field and ring 2 stimulates 22°.herefore for the WF-mfERG data, only these rings (com-osed of seven hexagonal elements) were analyzed, ashese stimulated approximately the same area stimulatedy the micro-mfERG. Figure 2 also shows the higher reso-ution of the micro-mfERG stimulus and the difference inexagon size with retinal eccentricity, with the central el-ment (ring 1) covering the central 2.6° of the visual field,ing 2 covering 10° and ring 3 covering 20°. The recom-ended way to present mfERG data is to analyze ampli-
ude and latency values of the P1 component of the
r((WfP2mmTmci
amhnatw
CFPb
sTt(l2dmoew
t6rhsiit
atfhm
Fad
Fr
Dudgeon et al. Vol. 24, No. 5 /May 2007/J. Opt. Soc. Am. A 1397
esponses and compare these with the normal range27
see Fig. 4). Normative amplitude and latency ranges5%–95% confidence interval) for the P1 component of the
F-mfERG and micro-mfERG responses were calculatedrom a cohort of 14 healthy control eyes. The normative1 amplitude range was 30–88 nV for WF-mfERG and7–55 nV for micro-mfERG. In both wide-field and micro-fERG data analysis, amplitudes were considered abnor-al if they were lower than the 5% confidence interval.he normative P1 latency range was 37–43 ms for WF-fERG and 40–44 ms for micro-mfERG. Latency was
onsidered abnormal if it was above the 95% confidencenterval.
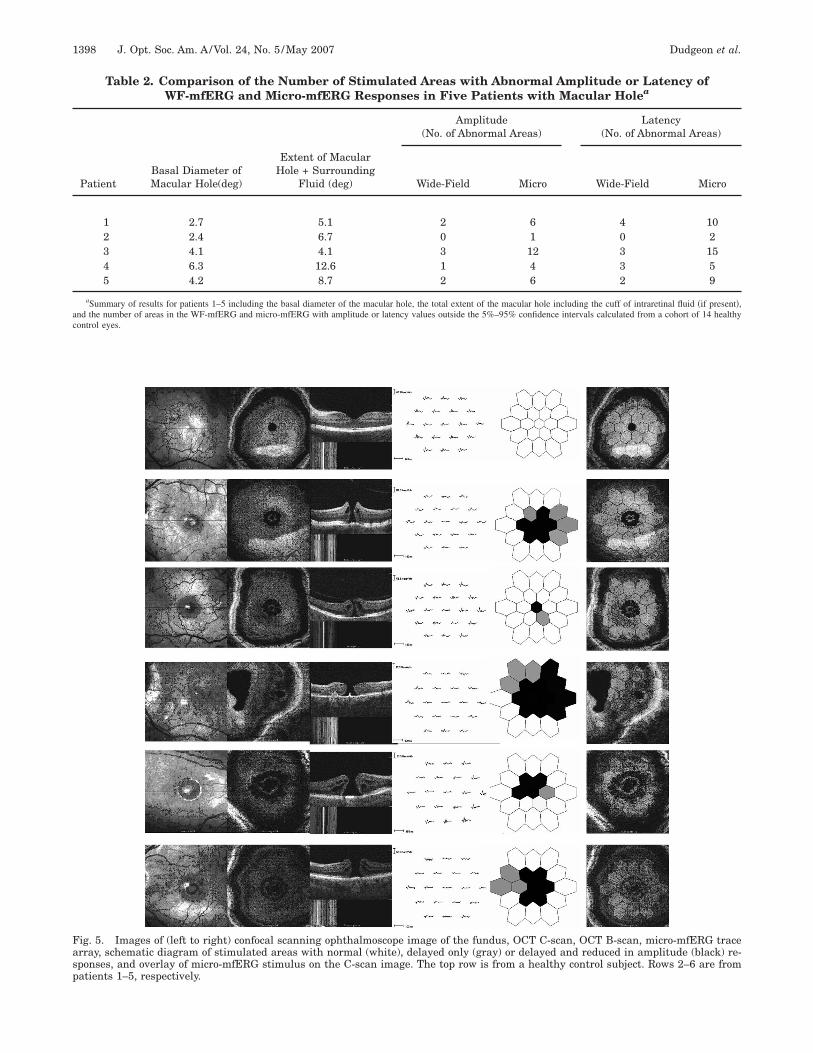
As seen in Table 2, micro-mfERG revealed functionalbnormalities in a larger number of areas than did WF-fERG in all patients due to the approximately threefold
igher spatial resolution of the stimulus. In all cases, ab-ormalities in responses latencies existed over a widerrea than that of response amplitudes. In one case, pa-ient 2, the micro-mfERG revealed abnormalities thatere not detected by the WF-mfERG.
. MMI: Correlations Between Macular Structure andunctionatient 1. Patient 1 had a narrow macular hole with aasal diameter of 2.6° which correlated with the area
ig. 3. (Color online) Annotated (A) confocal scanning ophthalmpatient with full thickness macular hole. FTMH, full thick
etachment.
ig. 4. 61-element multifocal ERG trace array with a close-up oesponse.
timulated by the central element of the micro-mfERG.he response was delayed and reduced in amplitude in
his area. As seen in Fig. 5, the cuff of intraretinal fluiddiameter 5.1°) extended partially into the area stimu-ated by ring 2 of the micro-mfERG. All responses in ring
of the micro-mfERG were delayed, and five were re-uced in amplitude. However, although structural abnor-alities were observed only in the central 5°, three areas
f ring 3 (outside the central 10°) of the micro-mfERG alsoxhibited delays, therefore function was affected over aider area than structure.Patient 2. Patient 2 had a macular hole of size similar
o that of patient 1 (basal diameter 2.4°, total diameter.7°). The central element of the micro-mfERG, which cor-elated approximately with the basal diameter of theole, was delayed and reduced in amplitude. However, aseen in Fig. 5, although the total diameter of the cuff ofntraretinal fluid surrounding the hole extended partiallynto all the areas stimulated by the elements of ring 2 ofhe micro-mfERG, only one element of ring 2 was delayed.
Patient 3. Patient 3 had a macular hole with a basal di-meter of 4.1° and had no intraretinal fluid surroundinghis and therefore had the smallest total diameter of de-ect. As seen in Fig. 5, the area covered by the macularole was stimulated by the central element of the micro-fERG and approximately half of the elements in ring 2.
image of the fundus, (B) OCT C-scan and (C) OCT B-scan fromacular hole; IRF, intraretinal fluid; PVD, posterior vitreous
f the waveforms showing the N1, P1, and N2 components of the
oscopeness m
f one o
ac
Fasp
1398 J. Opt. Soc. Am. A/Vol. 24, No. 5 /May 2007 Dudgeon et al.
Table 2. Comparison of the Number of Stimulated Areas with Abnormal Amplitude or Latency ofWF-mfERG and Micro-mfERG Responses in Five Patients with Macular Holea
aSummary of results for patients 1–5 including the basal diameter of the macular hole, the total extent of the macular hole including the cuff of intraretinal fluid �if present�,nd the number of areas in the WF-mfERG and micro-mfERG with amplitude or latency values outside the 5%–95% confidence intervals calculated from a cohort of 14 healthyontrol eyes.
ig. 5. Images of (left to right) confocal scanning ophthalmoscope image of the fundus, OCT C-scan, OCT B-scan, micro-mfERG tracerray, schematic diagram of stimulated areas with normal (white), delayed only (gray) or delayed and reduced in amplitude (black) re-ponses, and overlay of micro-mfERG stimulus on the C-scan image. The top row is from a healthy control subject. Rows 2–6 are fromatients 1–5, respectively.
Htiea
btohpmfoepa
acpsites
4Thvftsbtoeisbe
ahlrftTostcWcslefc
ffs
tiacmanoggt
fistatcwrtaLtbohlptdoptslgilmdd
bsnlrtittitmfnw
Dudgeon et al. Vol. 24, No. 5 /May 2007/J. Opt. Soc. Am. A 1399
owever, this patient exhibited the largest extent of func-ional loss, with all elements in rings 1 and 2 (10°) exhib-ting reduced and delayed responses and over half the el-ments in ring 3 (over 10°) showing functionalbnormalities.Patient 4. As seen in Table 2, patient 4 had the widest
asal diameter (6.3°) of macular hole. As seen in Fig. 5,his extended partially into the area stimulated by ring 2f the micro-mfERG. The cuff of intraretinal fluid alsoad the largest diameter (12.6°) and therefore extendedartially into the area stimulated by ring 3 of the micro-fERG. However, this patient exhibited relatively little
unctional loss, with micro-mfERG abnormalities beingbserved only in the central element and in four of the sixlements in ring 2. Despite the cuff of intraretinal fluidartially extending into ring 3, responses in ring 3 werell within normal limits.Patient 5. Patient 5 had a macular hole with a basal di-
meter of 4.2°, which was therefore stimulated by theentral element of the micro-mfERG (2.6°) and extendedartially into the area stimulated by ring 2 (10°). All re-ponses in rings 1 and 2 were abnormal. However, as seenn Fig. 5, the functional abnormalities in this patient ex-ended beyond the area of structural alterations, with twolements in ring 3 (over 10°) exhibiting delayed re-ponses.
. DISCUSSIONhe results obtained with MMI show that micro-mfERGas approximately 3 times the spatial resolution of con-entional wide-field mfERG. In all but one patient, dys-unction extended over an area significantly wider thanhe area stimulated by the central element alone. This re-ult differs from a study assessing macular hole with com-ined cSLO and mfERG where the authors found a sta-istically significant reduction in macular function fromnly the area stimulated by the central element.28 How-ver, as previously mentioned, this technique may be lim-ted by the monochromatic light source and relativelylow scanning speed of the cSLO, causing a reduction inoth the strength of the response and the effect of nonlin-ar contributions.25
Studies using OCT and mfERG to assess structuralnd functional changes elicited by macular pathologiesave shown good correlation between alterations in macu-
ar structure with functional loss.18,19 However, accu-ately comparing any changes observed in structure andunction in subsequent visits would prove difficult due tohe absence of fixation monitoring during the mfERG.he importance of accurate fixation for reliable analysisf stimulation with recovered response has been demon-trated using SLO microperimetry and mfERG.29 Fixa-ion loss resulted in artificial correlation between the re-orded amplitudes with the expected areas of stimulation.ith MMI, accurate fixation monitoring using the confo-
al scanning ophthalmoscope images of the fundus whileimultaneously recording the micro-mfERG response al-ows confidence that the responses derived are from thexpected areas. This should allow reliable comparison ofocal retinal function between tests. It should also provideonfidence in the accuracy of correlation between this
unctional information and the structural informationrom corresponding areas imaged by the OCT ophthalmo-cope.
Advances in surgical and pharmacological interven-ions for macular disorders mean that it is increasinglymportant to have a means of accurately and objectivelyssessing the success of these treatments. MMI providesorrelation of structural and functional information atultiple macular sites with confidence in accurate repeat-
bility between visits. It could therefore prove a valuableew technique in studies assessing the effect of surgicalr pharmacological intervention on a variety of patholo-ies affecting the macula, such as age-related macular de-eneration, diabetic retinopathy, uveitis, and retinal de-achment.
OCT ophthalmoscope assessment of the patients con-rmed the presence of a full-thickness macular hole. Thetructural features associated with the holes were consis-ent with previous findings of OCT ophthalmoscope visu-lization of macular holes.12 In comparison of the struc-ural changes elicited by the macular hole with theorresponding changes in macular function, the findingsere interesting. Macular function was most significantly
educed in the central 2.6° in all patients, but in three ofhe five patients, function was significantly reduced over
wider area than that structurally altered by the hole.atency was affected over a wider area than was ampli-
ude in all patients. Additionally, there was no correlationetween macular hole size and the level of functional lossbserved in these patients. For example, patients 1 and 2ad similar-size macular holes, but the level of functional
oss was significantly greater in patient 1. The results foratient 3 are difficult to explain, as the extent of func-ional loss exhibited by this patient was the most severeespite the patient having the smallest overall diameterf structural alterations. It may therefore be possible thisatient had an unknown retinal pathology in addition tohe macular hole. It has been suggested that macular holeize may be an important indicator of visual outcome fol-owing macular hole surgery.30 Studies have also sug-ested macular function may be an important prognosticndicator in these patients.31–34 We plan to follow up aarger number of patients with macular holes to deter-
ine whether structural alterations, degree of functionaleficits, or duration of symptoms are better prognostic in-icators.In MMI, a 19-hexagonal-element stimulus was chosen
ecause it allows high-resolution mfERG recording whentimulating a 20 degree field while providing robust sig-als for clinical interpretation. We also chose this stimu-
us pattern to avoid spatial averaging, where individualesponses are averaged with their neighbors to improvehe quality and strength of the response. Spatial averag-ng would negate the purpose of high-resolution func-ional imaging. We are currently investigating increasinghe spatial resolution of the technique further while aim-ng to retain a good signal-to-noise ratio and avoiding spa-ial averaging. We have experimented with up to 103 areaicro-mfERG recordings,35 but the signals recovered so
ar are small and may require “smart filtering” tech-iques such as wavelet analysis (e.g., discrete Daubechiesavelet analysis36) to be clinically useful.
5MlstvhfimtSsvptihm
ATt
pe
R
1
1
1
1
1
1
1
1
1
1
2
2
2
2
2
2
2
2
2
2
3
3
3
1400 J. Opt. Soc. Am. A/Vol. 24, No. 5 /May 2007 Dudgeon et al.
. CONCLUSIONSultimodal imaging (MMI) is a viable new technology al-
owing simultaneous high-resolution imaging of maculartructure and function. The accurate correlation of struc-ural and functional information in our preliminary in-estigations using the technique in patients with macularole showed that functional loss is not necessarily con-ned to the area of structural alterations. High-resolutiononitoring of macular function in these patients may
herefore be more important than structural monitoring.ince MMI provides accurate correlation of maculartructure at multiple sites throughout the macula, we en-ision it being useful in investigating the effect of diseaserocesses on the macula and also in accurately and objec-ively assessing the success of surgical or pharmacologicalnterventions for various macular pathologies. MMI mayave the potential to eventually supersede conventionalfERG in the assessment of certain macular disorders.
CKNOWLEDGMENTShe authors thank John A. Rogers and Justin Pedro forheir technical assistance.
Stuart Parks (corresponding author) may be reached byhone, 44(0)141-211-0091; fax, 44(0)141-211-6746; and-mail, [email protected].
EFERENCES1. D. Huang, E. A. Swanson, C. P. Lin, J. S. Schuman, W. G.
Stinson, W. Chang, M. R. Hee, T. Flotte, K. Gregory, C. A.Puliafito, and J. G. Fujimoto, “Optical coherencetomography,” Science 254, 1178–1181 (1991).
2. E.A.Swanson, J. Izatt, M. Hee, D. Huang, C. Lin, J.Schuman, C. Puliafito, and J. Fujimoto, “In vivo retinalimaging by optical coherence tomography,” Opt. Lett. 18,1864–1866 (1993).
3. C. A. Puliafito, M. R. Hee, C. P. Lin, E. Reichel, J. S.Schuman, J. S. Duker, J. A. Izatt, E. A. Swanson, and J. G.Fujimoto, “Imaging macular diseases with opticalcoherence tomography,” Ophthalmology 102, 217–229(1995).
4. D. S. Chauhan and J. Marshall, “The interpretation ofoptical coherence tomography images of the retina,” Invest.Ophthalmol. Visual Sci. 40, 2332–2342 (1999).
5. J. S. Schuman, C. A. Puliafito, and J. G. Fujimoto, OpticalCoherence Tomography of Ocular Diseases (Slack, 2004).
6. A. G. Podoleanu, G. M. Dobre, M. Seeger, D. J. Webb, D. A.Jackson, F. W. Fitzke, and A. S. Halfyard, “Low coherenceinterferometry for en-face imaging of the retina,” LasersLight 8, 187–192 (1998).
7. A. G. Podoleanu, M. Seeger, G. M. Dobre, D. J. Webb, D. A.Jackson, and F. W. Fitzke, “Transversal and longitudinalimages from the retina of the living eye using lowcoherence reflectometry,” J. Biomed. Opt. 3, 12–20 (1998).
8. J. A. Rogers, A. G. Podoleanu, G. M. Dobre, D. Jackson, andF. Fitzke, “Topography and volume measurements of theoptic nerve using en-face optical coherence tomography,”Opt. Express 9, 533–545 (2001).
9. A. G. Podoleanu and D. A. Jackson, “Combined opticalcoherence tomography and scanning laserophthalmoscopy,” Electron. Lett. 34, 1088–1090 (2002).
0. A. G. Podoleanu, G. M. Dobre, R. C. Cucu, R. Rosen, P.Garcia, J. Nieto, D. Will, R. Gentile, T. Muldoon, J. Walsh,L. Yannuzzi, Y. Fisher, D. Orlock, R. Weitz, J. A. Rogers, S.Dunne, and A. Boxer, “Combined multiplanar opticalcoherence tomography and confocal scanningophthalmoscopy,” J. Biomed. Opt. 9, 86–93 (2004).
1. M. E. J. van Velthoven, F. D. Verbraak, P. M. Garcia, R. O.
Schlingemann, R. B. Rosen, and M. D. de Smet,“Evaluation of central serous retinopathy with en faceoptical coherence tomography,” Br. J. Ophthamol. 89,1483–1488 (2005).
2. M. E. J. van Velthoven, F. D. Verbraak, L. A. Yannuzzi, R.B. Rosen, A. G. Podoleanu, and M. G. de Smet, “Imaging ofthe retina by en face optical coherence tomography,” Retina26, 129–136 (2006).
3. W. Drexler, “Ultra-high resolution optical coherencetomography,” J. Biomed. Opt. 9, 47–71 (2004).
4. A. F. Fercher, C. K. Hitzenberger, and S. Y. El-Zaiat,“Measurement of intraocular distances by backscatteringspectral interferometry,” Opt. Commun. 117, 43–48 (1995).
5. R. Leitgeb, C. K. Hitzenberger, A. F. Fercher, and M.Kulhavy, “Performance of fourier domain vs. time domainoptical coherence tomography,” Opt. Express 11, 889–894(2003).
6. S. R. Chinn, E. A. Swanson, and J. G. Fujimoto, “Opticalcoherence tomography using a frequency-tunable opticalsource,” Opt. Lett. 22, 340–342 (1997).
7. S. H. Yun, C. Boudoux, G. J. Tearney, and B. E. Bouma,“High-speed wavelength-swept semiconductor laser with apolygon-scanner-based wavelength filter,” Opt. Lett. 28,1981–1983 (2003).
8. S. Yamamoto, T. Yamamoto, M. Hayashi, and S. Takeuchi,“Morphological and functional analyses of diabetic macularedema by optical coherence tomography and multifocalelectroretinograms,” Graefe’s Arch. Clin. Exp. Ophthalmol.239, 96–101 (2001).
9. D. Li, M. Horiguchi, and K. Shoji, “Tomographic andmultifocal electroretinographic features of idiopathicepiretinal membranes,” Arch. Ophthalmol. (Chicago) 122,1462–1467 (2004).
0. E. E. Sutter and D. Tran, “The field topography of ERGcomponent in man. Part 1. The photopic luminanceresponse,” Vision Res. 32, 433–446 (1992).
1. M. Kondo, Y. Miyake, M. Horiguchi, S. Suzuki, and A.Tanikawa, “Clinical evaluation of multifocalelectroretinogram,” Invest. Ophthalmol. Visual Sci. 36,2146–2150 (1995).
2. D. C. Hood, “Assessing retinal function with the multifocaltechnique,” Prog. Retin Eye Res. 19, 607–646 (2000).
3. D. Keating, S. Parks, and A. L. Evans, “Technical aspects ofmultifocal ERG recording,” Doc. Ophthalmol. 100, 77–98(2000).
4. M. W. Seeliger, K. Narfstrom, J. Reinhard, E. Zrenner, andE. Sutter, “Continuous monitoring of the stimulated areain multifocal ERG,” Doc. Ophthalmol. 100, 167–184 (2000).
5. S. Parks and D. Keating, “The multifocalelectroretinogram,” in Disorders of Visual Processing, G.Celesia, ed. (Elsevier, 2005), Chap. 5.
6. F. M. Dolan, S. Parks, D. Keating, G. N. Dutton, and A. L.Evans, “Multifocal electroretinographic features of centralretinal vein occlusion,” Invest. Ophthalmol. Visual Sci. 44,4954–4959 (2003).
7. M. F. Marmor, D. C. Hood, D. Keating, M. Kondo, M. W.Seeliger, and Y. Miyake, “Guidelines for basic multifocalelectroretinography (mfERG),” Doc. Ophthalmol. 106,105–15 (2003).
8. G. Rudolph, P. Kalpadakis, M. Bechmann, C. Haritoglou,and A. Kampik, “Scanning laser ophthalmoscope-evokedmultifocal ERG (SLO-mfERG) in patients with macularholes and normal individuals,” Eye 17, 801–808 (2003).
9. K. Rohrschneider and S. Bueltmann, “Correlation betweenfundus perimetry and multifocal ERG using the scanninglaser ophthalmoscope,” Invest. Ophthalmol. Visual Sci. 42,Abstract S69 (2001).
0. S. Ullrich, C Haritoglou, C. Gass, M. Schaumberger, M. W.Ulbig, and A. Kampik, “Macular hole size as a prognosticfactor in macular hole surgery,” Br. J. Ophthamol. 86,390–393 (2002).
1. J.-E. Guez, J.-F. Le Gargasson, P. Massin, F. Rigaudiere, Y.Grall, and A. Gaudric, “Functional assessment of macularhole surgery by scanning laser ophthalmoscopy,”Ophthalmology 105, 694–699 (1998).
2. Y-J. Si, S. Kishi, and K. Aoyagi, “Assessment of macular
3
3
3
3
Dudgeon et al. Vol. 24, No. 5 /May 2007/J. Opt. Soc. Am. A 1401
function by multifocal electroretinogram before and aftermacular hole surgery,” Br. J. Ophthamol. 83, 420–424(1999).
3. T. Hikichi, S. Ishiko, A. Takamiya, E. Sato, and F. Mori,“Scanning laser ophthalmoscope correlations withbiomicroscopic findings and foveal function after macularhole closure,” Arch. Ophthalmol. (Chicago) 118, 193–197(2000).
4. F. Amari, K. Ohta, H. Kojima, and N. Yoshimura,
“Predicting visual outcome after macular hole surgery
using scanning laser ophthalmoscope microperimetry,” Br.J. Ophthamol. 85, 96–98 (2001).
5. S. M. Dudgeon, D. Keating, and S. Parks, “Multimodalimaging with the combined SLO/OCT and micro-multifocalERG,” Invest. Ophthalmol. Visual Sci. 47, E-Abstract 3317(2006).
6. I. Daubechies, “The wavelet transform, time frequencylocalization and signal analysis,” IEEE Trans. Inf. Theory36, 961–1005 (1990).