1 SINARMAS LAND LIMITED (REG. NO. 199400619R) Full Year Financial Statement And Dividend Announcement PART I - INFORMATION REQUIRED FOR QUARTERLY (Q1, Q2 & Q3), HALF-YEAR AND FULL YEAR ANNOUNCEMENTS 1(a) An income statement and statement of comprehensive income for the group, together with a comparative statement for the corresponding period of the immediately preceding financial year UNAUDITED CONSOLIDATED INCOME STATEMENT FOR THE YEAR ENDED 31 DECEMBER 2017 Full Year 2017 Full Year 2016 Change 4th Qtr 2017 4th Qtr 2016 Change S$’000 S$’000 % S$’000 S$’000 % Revenue 1,296,442 879,098 47.5 560,419 328,086 70.8 Cost of sales (362,161) (294,025) 23.2 (172,757) (124,515) 38.7 Gross profit 934,281 585,073 59.7 387,662 203,571 90.4 Operating expenses Selling expenses (99,487) (85,069) 16.9 (30,574) (24,020) 27.3 General and administrative expenses (176,956) (151,824) 16.6 (56,291) (48,014) 17.2 Total operating expenses (276,443) (236,893) 16.7 (86,865) (72,034) 20.6 Operating profit 657,838 348,180 88.9 300,797 131,537 128.7 Other income/(expenses) Finance income 33,448 28,672 16.7 12,320 7,770 58.6 Finance costs (71,636) (95,527) (25.0) (18,958) (32,733) (42.1) Foreign exchange (loss)/gain (22,616) (4,959) 356.1 (1,711) 11,746 n.m. Share of results of associated companies 14,487 33,572 (56.8) 3,229 18,114 (82.2) Share of results of joint ventures (42,800) (4,674) n.m. (35) (2,747) (98.7) Other operating income 11,856 17,184 (31.0) 6,580 6,625 (0.7) Other (expenses)/income, net (77,261) (25,732) 200.3 1,425 8,775 (83.8) Exceptional item Gain on disposal of a subsidiary 109,441 - n.m. 109,441 - n.m. Profit before income tax 690,018 322,448 114.0 411,663 140,312 193.4 Income tax (52,320) (58,749) (10.9) (21,029) (23,931) (12.1) Profit for the year/period 637,698 263,699 141.8 390,634 116,381 235.7 Attributable to: Owners of the Company 355,971 114,908 209.8 238,164 46,472 412.5 Non-controlling interests 281,727 148,791 89.3 152,470 69,909 118.1 637,698 263,699 141.8 390,634 116,381 235.7 Notes: (1) Certain comparative figures have been reclassified to conform to current year’s presentation. (2) n.m. – not meaningful.
Transcript
1
SINARMAS LAND LIMITED (REG. NO. 199400619R)
Full Year Financial Statement And Dividend Announcement
PART I - INFORMATION REQUIRED FOR QUARTERLY (Q1, Q2 & Q3), HALF-YEAR AND FULL YEAR
ANNOUNCEMENTS
1(a) An income statement and statement of comprehensive income for the group, together with a
comparative statement for the corresponding period of the immediately preceding financial year
UNAUDITED CONSOLIDATED INCOME STATEMENT FOR THE YEAR ENDED 31 DECEMBER 2017
Earnings before income tax, non-controlling interests, interest on borrowings, depreciation, foreign exchange (loss)/gain, exceptional item and share of results of associated companies and joint ventures (“EBITDA”)
Full Year 2017
Full Year 2016 Change
4th Qtr 2017
4th Qtr 2016 Change
S$’000 S$’000 % S$’000 S$’000 %
Earnings before income tax, non-
controlling interests, interest on
borrowings, depreciation, foreign
exchange (loss)/gain, exceptional
item and share of results of
associated companies and joint
ventures (“EBITDA”)
750,934 417,155 80.0 333,357 141,226 136.0
Interest on borrowings (71,636) (80,765) (11.3) (18,958) (17,971) 5.5
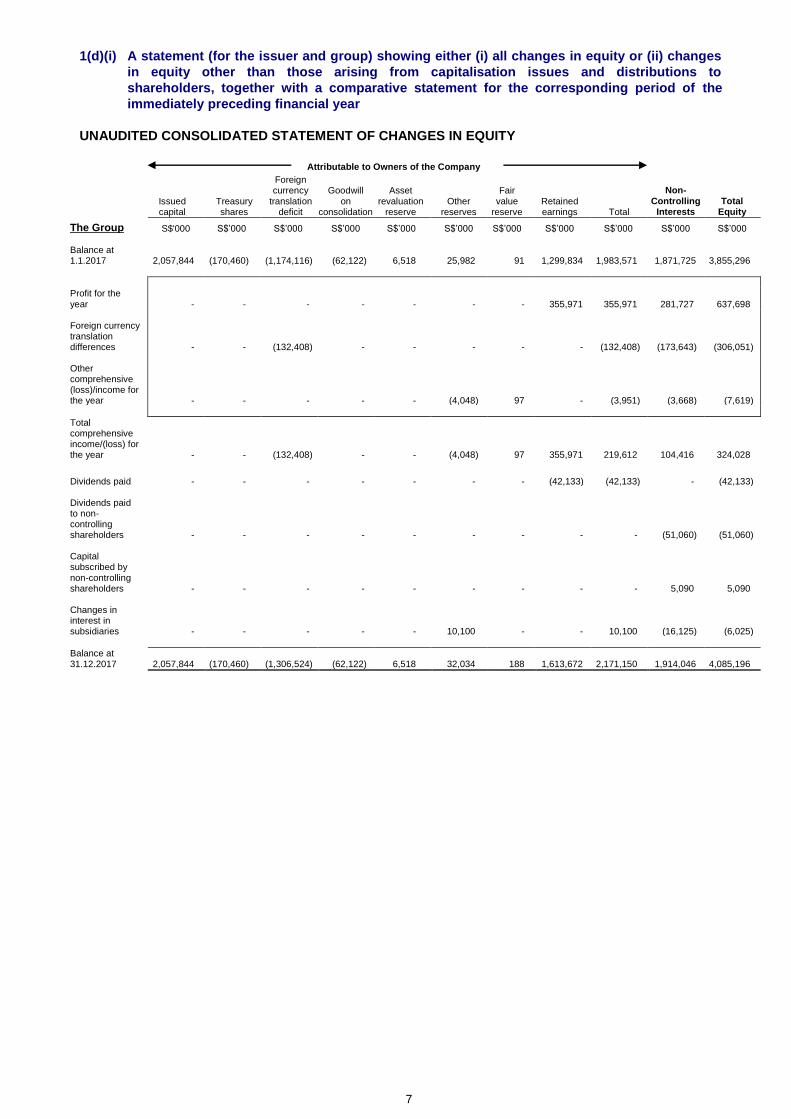
1(d)(i) A statement (for the issuer and group) showing either (i) all changes in equity or (ii) changes in equity other than those arising from capitalisation issues and distributions to shareholders, together with a comparative statement for the corresponding period of the immediately preceding financial year
UNAUDITED CONSOLIDATED STATEMENT OF CHANGES IN EQUITY (cont’d)
Attributable to Owners of the Company
Issued
capital Treasury shares
Foreign currency
translation deficit
Goodwill on
consolidation
Asset revaluation
reserve
Other reserves
Fair
value reserve
Retained earnings Total
Non-Controlling
Interests
Total
Equity
The Group S$'000 S$’000 S$’000 S$’000 S$’000 S$’000 S$’000 S$’000 S$’000 S$’000 S$’000 Balance at 1.1.2016 2,057,844 (170,460) (1,256,967) (62,122) 6,518 (18,945) (197) 1,193,012 1,748,683 1,581,539 3,330,222
Profit for the year - - - - - - - 114,908 114,908 148,791 263,699 Other comprehensive income/(loss) for the year - - 82,851 - - (1,001) 288 - 82,138 172,022 254,160
Total comprehensive income/(loss) for the year - - 82,851 - - (1,001) 288 114,908 197,046 320,813 517,859
Notes: (1) This refers to certain mixed developments located in Chengdu and Shenyang, China and investment property operations in AFP Land group, which
consists of the former Amcol group of companies mainly located in Singapore, Malaysia and Batam (Indonesia). (2) Certain comparative figures have been reclassified to conform to current year’s presentation. Please refer to Note 5 for further details. (3) n.m. – not meaningful.
12
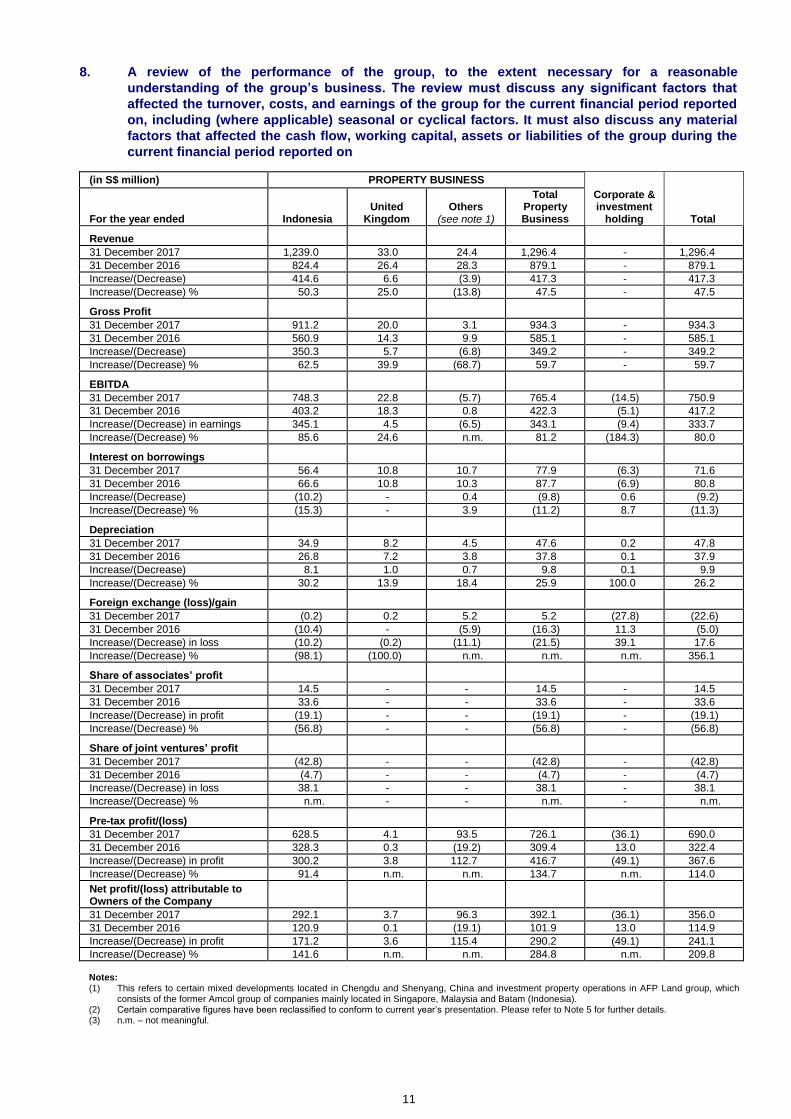
PERFORMANCE FOR THE YEAR ENDED 31 DECEMBER 2017
Revenue of the Group surpassed $1 billion in the year ended 31 December 2017 (“FY2017”), supported
by sales of land parcels in Indonesia. In tandem with higher revenue, EBITDA and net profit attributable
to owners of the Company were higher at $750.9 million and $356.0 million respectively in the current
year as compared to $417.2 million and $114.9 million respectively in the previous year (“FY2016”).
REVENUE
Total revenue of the Group increased by 47.5% from $879.1 million in FY2016 to $1,296.4 million mainly
contributed by higher sales of land parcels and higher revenue from apartments recognised in BSD City,
Indonesia.
During the current year, the Group recognised $167.5 million of revenue from sales of land parcel to its
joint ventures (PT BSD Diamond Development and PT Panahome Deltamas Indonesia) for further joint
development. The gain arising from this transaction that is attributable to the interests of the Group has
not been recognised in the Group’s income statement in accordance with the requirement of Singapore
Financial Reporting Standards. Hence, appropriate adjustments have been made in the share of results
of joint ventures.
GROSS PROFIT
In tandem with the increase in sales of land parcels with higher profit margin, the Group’s gross profit
increased from $585.1 million in the previous year to $934.3 million. Consequently, the Group’s overall
gross profit margin was also higher at 72.1% in the current year as compared to 66.6% in FY2016.
OPERATING EXPENSES
SELLING EXPENSES
Selling expenses of $99.5 million comprised mainly advertising and marketing expenses, professional
fees, and salaries and related expenses. The 16.9% increase in selling expenses in FY2017 was mainly
due to higher advertising, marketing and commission expenses incurred in line with higher sales of
industrial land.
GENERAL AND ADMINISTRATIVE EXPENSES
General and administrative expenses of $177.0 million comprised mainly salaries and related expenses,
legal and professional fees, repairs and maintenance, information technology software licenses and
maintenance fees, depreciation, rent, tax and licenses, office supplies and utilities. These expenses
increased by 16.6% mainly due to higher salaries and related expenses, as well as higher legal and
professional fee incurred for acquisition and disposal of assets during the current year.
FINANCE EXPENSES, NET
Finance expenses comprised interest expenses (net of interest income), loss on early redemption of
interest bearing senior notes, as well as amortisation of deferred bond and loan charges. Net finance
expenses decreased from $66.9 million in the previous year to $38.2 million mainly due to higher interest
income earned, coupled with absence of $14.8 million loss arising from the redemption of certain interest
bearing senior notes during the last quarter of 2016 and lower interest expenses in Indonesia due to
lower average bank borrowings during the current year.
FOREIGN EXCHANGE LOSS
The Group recorded net foreign exchange loss of $22.6 million in the current period as compared to $5.0
million in the previous year. Higher loss in the current year was mainly attributable to unrealised
translation loss on inter-company loans in certain subsidiaries following the weakening of U.S. Dollar
(“USD”) against SGD in FY2017, while the USD strengthened against SGD in FY2016.
13
SHARE OF RESULTS OF ASSOCIATED COMPANIES, NET
The share of profit in associated companies decreased from $33.6 million in FY2016 to $14.5 million in
the current year mainly attributable to lower contribution for sales of certain industrial units and higher
borrowings costs.
SHARE OF RESULTS OF JOINT VENTURES, NET
The reversal of unrealised gain adjustment of $59.4 million (FY2016: $10.7 million), representing the
Group’s portion for gain on sales of land parcel to joint ventures in the current year, has impacted the
Group’s share of net results in joint ventures. Without this reversal, on a like-for-like comparison between
FY2017 and FY2016, the Group recorded higher share of profit in joint ventures of $16.6 million in
FY2017 as compared to $6.0 million in FY2016. This was mainly due to better operating performance in
certain joint ventures in Indonesia.
OTHER OPERATING INCOME
Net operating income comprised mainly building and estate management service income (net of
expenses), forfeiture of deposits and cancellation fees, fair value gain on financial instruments,
management and lease co-ordination fees. Net operating income decreased from $17.2 million to $11.9
million in the current year primarily due to impairment loss on properties held for sales, partially offset by
fair value gain on conversion option upon settlement of certain convertible bonds during the current year.
EXCEPTIONAL ITEM
The current year’s exceptional gain of $109.4 million arising from gain on disposal of investment
properties holding subsidiary, Golden Bay Realty (Private) Limited, in Singapore.
INCOME TAX
Income tax expense comprised final tax on revenue derived from sales of land and properties in
Indonesia, withholding tax paid and corporate income tax derived by applying the varying statutory tax
rates of the different countries in which the Group operates on its taxable profit and taxable temporary
difference. No group relief is available for set-off of taxable profits against tax losses of companies within
the Group.
Income tax expense was lower at $52.3 million in the current period mainly in line with the reduction in
final tax rate on revenue derived from sales of land and properties in Indonesia.
REVIEW OF FINANCIAL POSITION AS AT 31 DECEMBER 2017
Assets
Compared to the previous year end, the Group’s total assets increased by $482.9 million to $6,562.8
million as at end of 2017 mainly attributable to the acquisition of investment properties, namely the
'Horseferry' building for GBP188.6 million (equivalent to approximately $337.8 million) in London, United
Kingdom and the Sinarmas MSIG Tower in Central Jakarta for IDR2,363.3 billion (equivalent to
approximately $236.3 million) in Jakarta, Indonesia. This increase was partially offset by lower purchase
advances, as well as lower properties under development and held for sales mainly attributable to
translation effect of weakening of Indonesian Rupiah against SGD.
Short-term investments increased by $8.8 million mainly due to investment in short-term treasury
products.
Other current assets decreased by $78.6 million to $309.7 million mainly due to decrease in advance
payment made for purchase of properties and land in Indonesia.
14
Liabilities
Total liabilities of the Group increased by $253.0 million to $2,477.6 million as at 31 December 2017
mainly due to increase in total borrowings and payables for the acquisition of investment properties and
capital expenditure.
REVIEW OF CASH FLOWS FOR YEAR ENDED 31 DECEMBER 2017
Net cash and cash equivalents (before the effect of exchange rate changes) increased by $138.2 million
in the current year mainly as a result of cash generated from operations of $616.3 million due to better
operating performance, cash from net borrowings, after deducting cash used in investing activities.
Net cash used in investing activities of $619.9 million mainly related to acquisition of investment
properties and subsidiaries, capital expenditure incurred on properties under development, as well as an
additional investments in joint venture and associated companies during the current year.
Net cash generated from financing activities of $141.8 million mainly related to net proceeds from
borrowings, after payment for dividends during the current year.
9. Where a forecast, or a prospect statement, has been previously disclosed to shareholders, any
variance between it and the actual results
Not applicable.
10. A commentary at the date of the announcement of the competitive conditions of the industry in
which the group operates and any known factors or events that may affect the group in the next
reporting period and the next 12 months
Indonesia’s GDP grew 5.19% year-on-year in the fourth quarter of 2017 (“4Q2017”), slightly better than
the previous quarter, boasted by increased government spending and higher investments. However, full
year economic growth of 5.07% was below expectations and household consumption remained sluggish
over the recent years. Despite Bank Indonesia cutting interest rates, consumers are still hesitant to
spend on purchasing cars and homes. Consumption may be hampered by the regional elections to be
held in June 2018 and the presidential elections to be held in 2019.
The Group managed to achieve record-breaking revenue and profits in FY2017 due to land sales and
divestment of legacy asset which are non-recurring in nature. Looking ahead, the Group expects its
Indonesia property division to maintain marginal growth in its organic property development and
investment business. The recent acquisition of Sinarmas MSIG Tower is expected to improve recurring
income. The International property division had successfully divested Orchard Towers in 4Q2017, thus
recording an exceptional gain and marking the continued shift of focus to the United Kingdom. The newly
acquired 33 Horseferry Road in Central London is expected to more than offset the income loss from
Orchard Towers in FY2018 and the divestment proceeds will be re-invested in higher yielding assets.
15
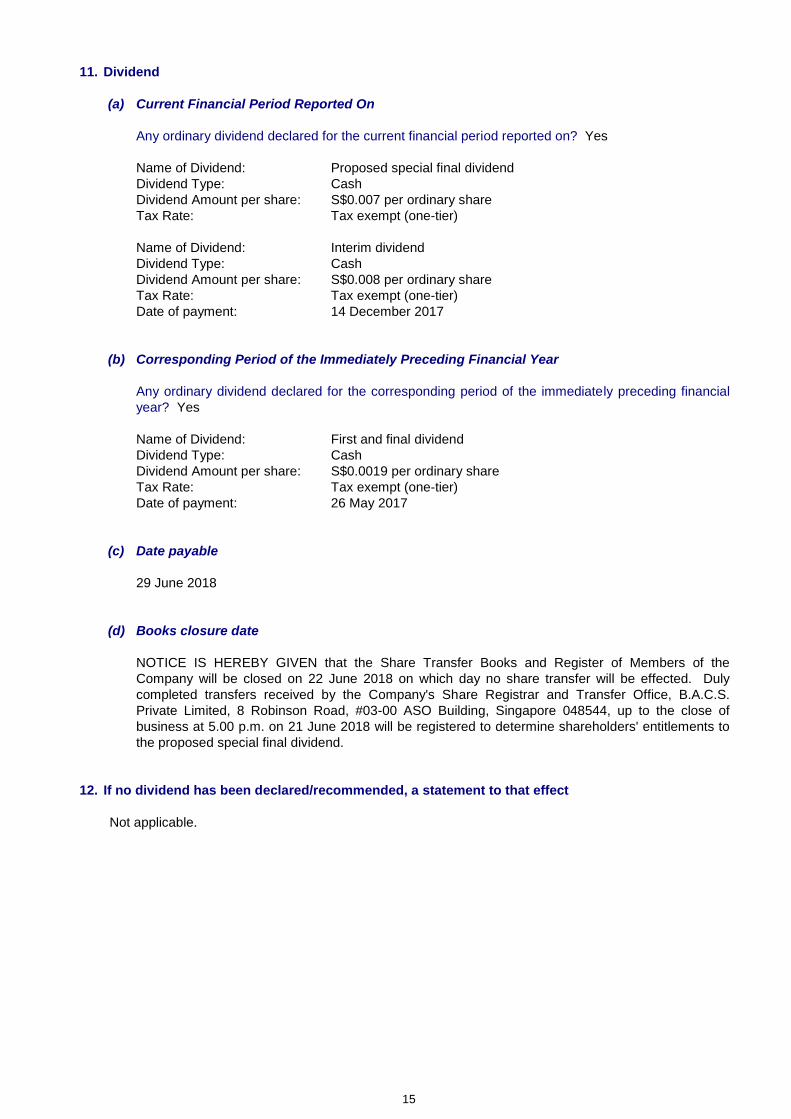
11. Dividend
(a) Current Financial Period Reported On
Any ordinary dividend declared for the current financial period reported on? Yes
Name of Dividend: Proposed special final dividend
Dividend Type: Cash
Dividend Amount per share: S$0.007 per ordinary share
Tax Rate: Tax exempt (one-tier)
Name of Dividend: Interim dividend
Dividend Type: Cash
Dividend Amount per share: S$0.008 per ordinary share
Tax Rate: Tax exempt (one-tier)
Date of payment: 14 December 2017
(b) Corresponding Period of the Immediately Preceding Financial Year
Any ordinary dividend declared for the corresponding period of the immediately preceding financial
year? Yes
Name of Dividend: First and final dividend
Dividend Type: Cash
Dividend Amount per share: S$0.0019 per ordinary share
Tax Rate: Tax exempt (one-tier)
Date of payment: 26 May 2017
(c) Date payable
29 June 2018
(d) Books closure date
NOTICE IS HEREBY GIVEN that the Share Transfer Books and Register of Members of the
Company will be closed on 22 June 2018 on which day no share transfer will be effected. Duly
completed transfers received by the Company's Share Registrar and Transfer Office, B.A.C.S.
Private Limited, 8 Robinson Road, #03-00 ASO Building, Singapore 048544, up to the close of
business at 5.00 p.m. on 21 June 2018 will be registered to determine shareholders' entitlements to
the proposed special final dividend.
12. If no dividend has been declared/recommended, a statement to that effect
Not applicable.
16
13. Interested persons transactions disclosure
Name of interested person
(“IP”)@
Aggregate value of all
interested person transactions
during the financial year under
review (excluding transactions
less than S$100,000 and
transactions conducted under
shareholders’ mandate*
pursuant to Rule 920)
Aggregate value of all
interested person transactions
conducted under shareholders’
mandate* pursuant to Rule 920
(excluding transactions less
than S$100,000)
FY2017 FY2017
S$ S$
PT Asuransi Jiwa Sinarmas MSIG
(“AJS”) - 49,001,619
#1
PT Bank Sinarmas Tbk (“BSM”) - 54,221,859 #2
PT Cakrawala Mega Indah - 3,696,193
PT DSSP Power Mas Utama - 201,012
PT Indah Kiat Pulp & Paper Tbk - 2,632,741
PT Ivo Mas Tunggal - 347,248
PT Lontar Papyrus Pulp & Paper
Industry - 786,369
PT Pabrik Kertas Tjiwi Kimia Tbk - 4,100,400
PT Paraga Artamida 2,436,000 -
PT Pindo Deli Pulp and Paper
Mills - 786,369
PT Purimas Sasmita - 68,207,996 #3
PT Purinusa Ekapersada - 269,080
PT Sinarmas Asset Management - 1,692,878
PT Sinarmas Sekuritas - 594,884
PT Sinar Mas Agro Resources and
Technology Tbk (“SMART”) - 13,852,747
#4
PT Sinar Mas Specialty Minerals - 269,080
Total 2,436,000 200,660,475
Notes:- @
These IPs are regarded as associates of SML’s controlling shareholder under Chapter 9 of the SGX-ST listing manual (“Listing Manual”) on interested person transactions.
* Renewed at SML’s Annual General Meeting on 25 April 2017 pursuant to Rule 920 of the Listing Manual.
#1 Transfer of property units in Sinarmas MSIG Tower from AJS to PT Duta Cakra Pesona (“DCP”), a subsidiary of PT Bumi Serpong Damai Tbk (“BSDE”).
#2 Time deposits and current account placements with BSM during the year. Principal amount of placements as at 31 December 2017 is approximately S$12.11 million.
#3 Transfer of property units in Sinarmas MSIG Tower from PT Purimas Sasmita to DCP for consideration of equivalent to S$140,896,500. Amount at risk of S$68,207,996 computed based on SML’s effective interest of 48.41% in DCP.
#4 Lease of premises to SMART.
17
PART II - ADDITIONAL INFORMATION REQUIRED FOR FULL YEAR ANNOUNCEMENT
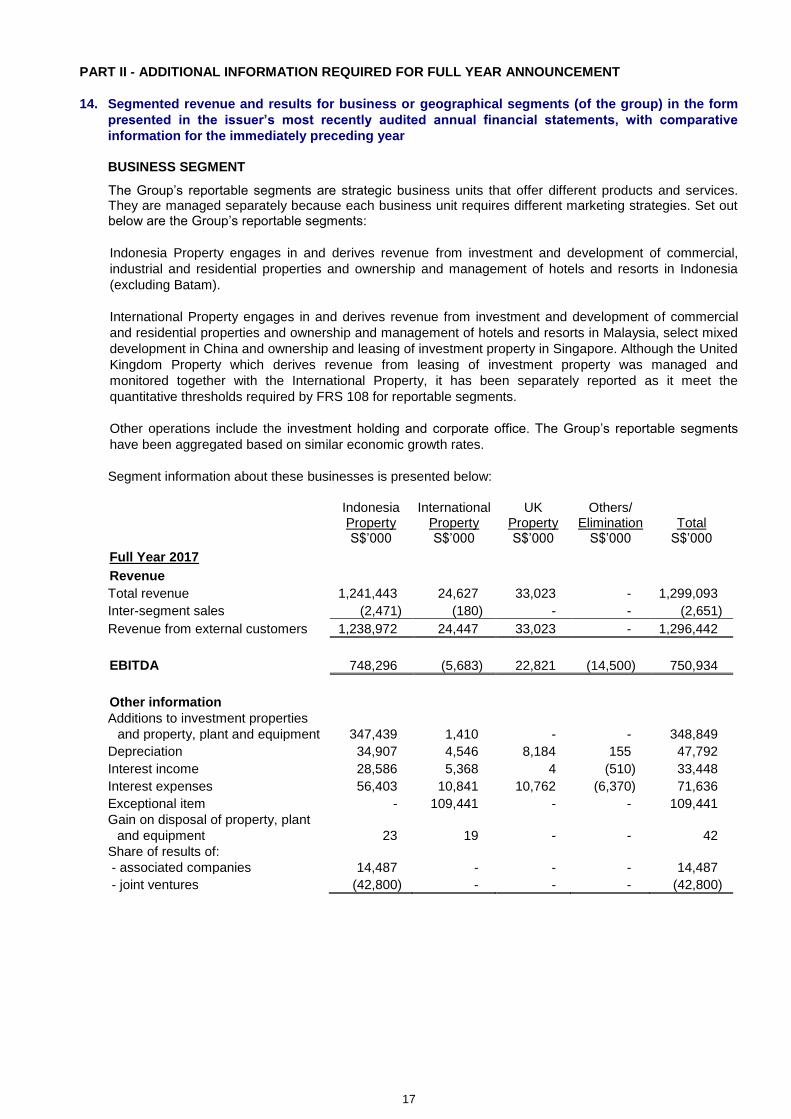
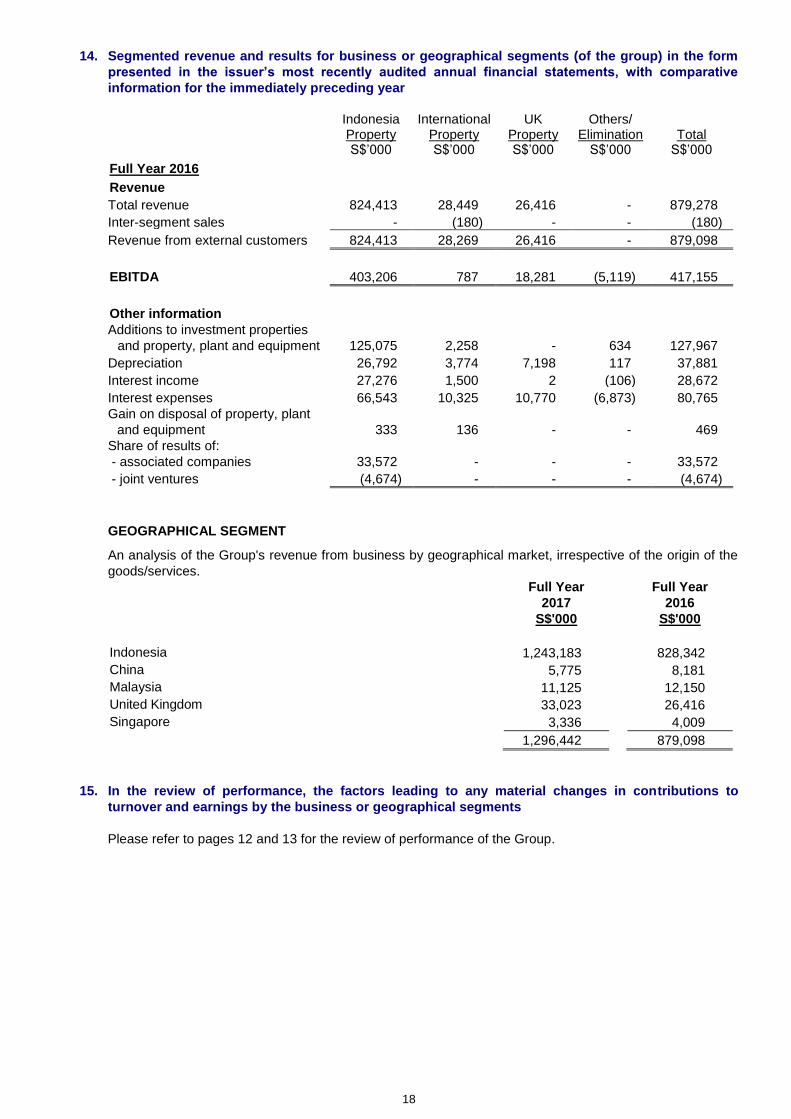
14. Segmented revenue and results for business or geographical segments (of the group) in the form
presented in the issuer’s most recently audited annual financial statements, with comparative
information for the immediately preceding year
BUSINESS SEGMENT
The Group’s reportable segments are strategic business units that offer different products and services. They are managed separately because each business unit requires different marketing strategies. Set out below are the Group’s reportable segments:
Indonesia Property engages in and derives revenue from investment and development of commercial,
industrial and residential properties and ownership and management of hotels and resorts in Indonesia
(excluding Batam).
International Property engages in and derives revenue from investment and development of commercial
and residential properties and ownership and management of hotels and resorts in Malaysia, select mixed
development in China and ownership and leasing of investment property in Singapore. Although the United
Kingdom Property which derives revenue from leasing of investment property was managed and
monitored together with the International Property, it has been separately reported as it meet the
quantitative thresholds required by FRS 108 for reportable segments.
Other operations include the investment holding and corporate office. The Group’s reportable segments
have been aggregated based on similar economic growth rates.
Segment information about these businesses is presented below:
Indonesia
Property International
Property UK
Property Others/
Elimination Total S$’000 S$’000 S$’000 S$’000 S$’000
Full Year 2017
Revenue
Total revenue 1,241,443 24,627 33,023 - 1,299,093
Inter-segment sales (2,471) (180) - - (2,651)
Revenue from external customers 1,238,972 24,447 33,023 - 1,296,442
EBITDA 748,296 (5,683) 22,821 (14,500) 750,934
Other information
Additions to investment properties
and property, plant and equipment 347,439 1,410 - - 348,849