1 Using Data to Demonstrate Outcome Measurement and Support Systems Change Presenters: Gary Madden, Director 2-1-1 San Bernardino County Teri Blum-Johnston, HMIS Program Specialist Community Action Partnership of San Bernardino County
Transcript
1
Using Data to Demonstrate Outcome Measurement
and Support Systems Change
Presenters: Gary Madden, Director 2-1-1 San Bernardino County
Teri Blum-Johnston, HMIS Program Specialist
Community Action Partnership of San Bernardino County
2
Data – what is it really?
• “Just a bunch of Numbers.” • Data (plural of "datum") are typically the results
of measurements and can be the basis of graphs, images, or observations of a set of variables. Data are often viewed as the lowest level of abstraction from which information and then knowledge are derived.
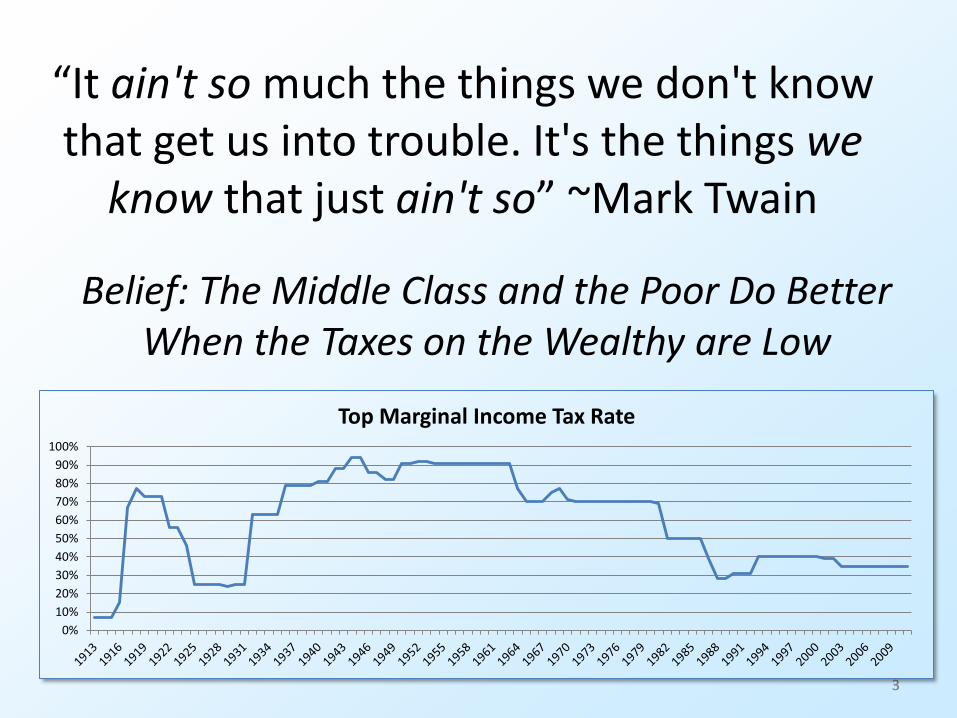
“It ain't so much the things we don't know that get us into trouble. It's the things we
know that just ain't so” ~Mark Twain
3
0%10%20%30%40%50%60%70%80%90%
100%
Top Marginal Income Tax Rate
Belief: The Middle Class and the Poor Do Better When the Taxes on the Wealthy are Low
4
Belief: The Law of Supply and Demand
About 1 billion people do not get enough to eat. Since there are food producers virtually everywhere, we must conclude that not enough food is produced to feed everyone.
4
2011 World Hunger and Poverty Facts and Statistics (worldhunger.org): The world produces enough food to feed everyone. World agriculture produces 17 percent more calories per person today than it did 30 years ago, despite a 70 percent population increase. This is enough to provide everyone in the world with at least 2,720 kilocalories (kcal) per person per day (FAO 2002, p.9).
Data can help us prove our assertions
5 5 5
How to use 211 Data to Advance Your
Organization
6 6
Types of Data from 211
• Caller data – geocoded needs and demographics – to zip code level
• Identification of service gaps / unmet needs
• Referrals
• Resource specifics – service penetration – potential partners
7
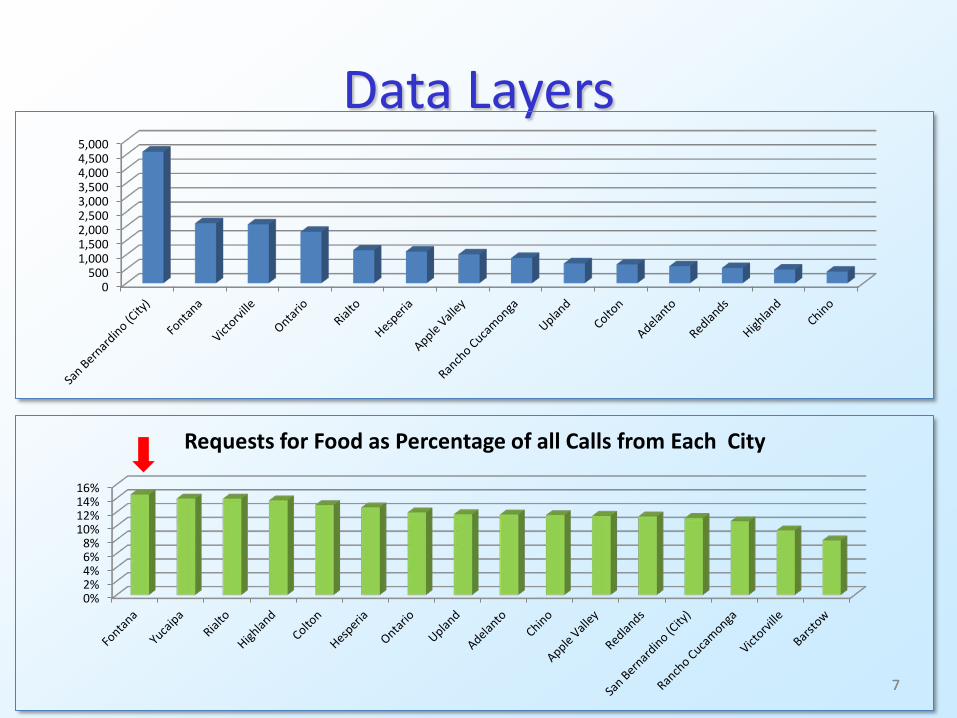
0%2%4%6%8%
10%12%14%16%
Requests for Food as Percentage of all Calls from Each City
7
Data Layers
0500
1,0001,5002,0002,5003,0003,5004,0004,5005,000
8
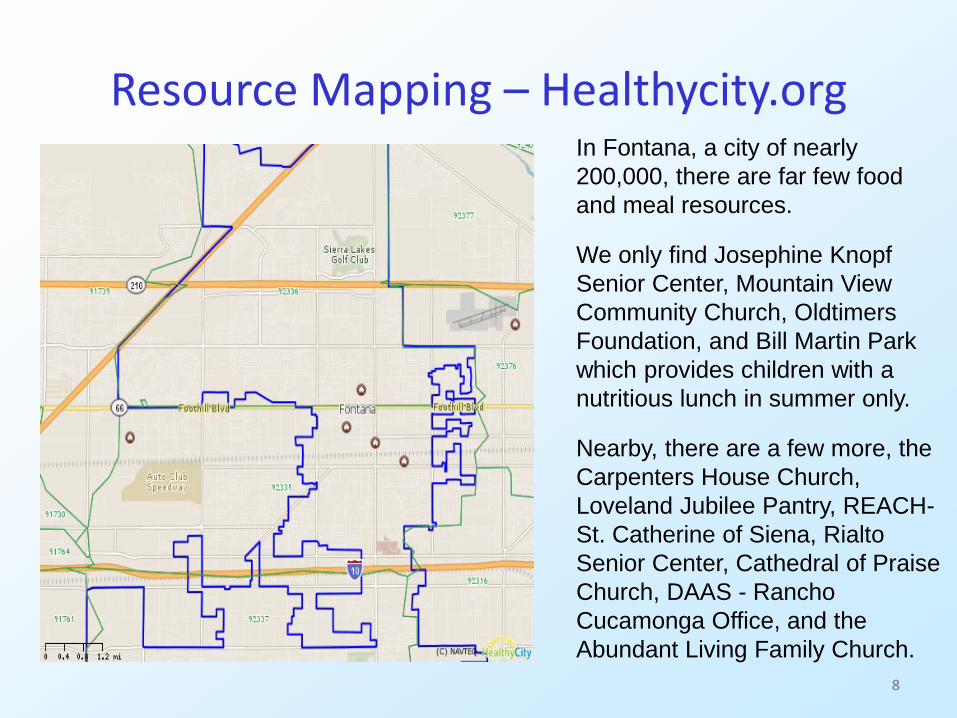
Resource Mapping – Healthycity.org
8
In Fontana, a city of nearly 200,000, there are far few food and meal resources.
We only find Josephine Knopf Senior Center, Mountain View Community Church, Oldtimers Foundation, and Bill Martin Park which provides children with a nutritious lunch in summer only.
Nearby, there are a few more, the Carpenters House Church, Loveland Jubilee Pantry, REACH-St. Catherine of Siena, Rialto Senior Center, Cathedral of Praise Church, DAAS - Rancho Cucamonga Office, and the Abundant Living Family Church.
9
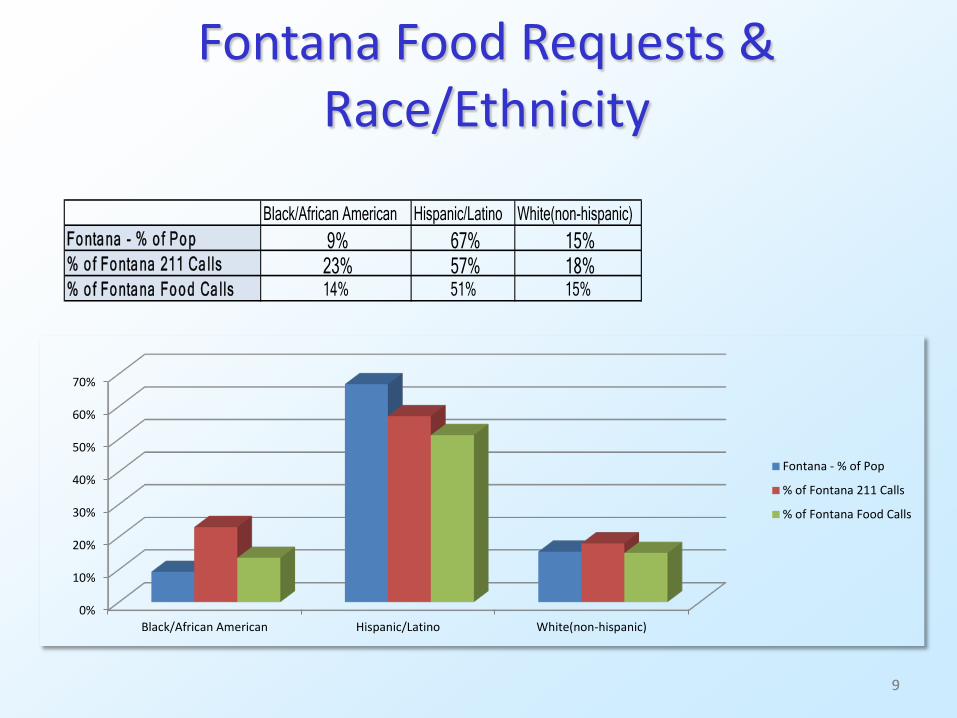
Fontana Food Requests & Race/Ethnicity
9
0%
10%
20%
30%
40%
50%
60%
70%
Black/African American Hispanic/Latino White(non-hispanic)
Fontana - % of Pop
% of Fontana 211 Calls
% of Fontana Food Calls
Black/African American Hispanic/Latino White(non-hispanic)Fo nta na - % o f Po p 9% 67% 15%% o f Fo nta na 211 Ca lls 23% 57% 18%% o f Fo nta na Fo o d Ca lls 14% 51% 15%
10
10
Put it together with mapping Uploaded User Data This is a healthycity.org mapping of 39 months of 211 caller data showing volume of requests for food per zip code.
The blue outline shows the boundaries of Fontana.
11
11
Put it together with mapping
Add Race/Ethnic data Note how high the saturation of Hispanic/Latino population (red circles) as shown here in the Fontana map. Also note how this saturation aligns with 211 calls requesting food.
12 12
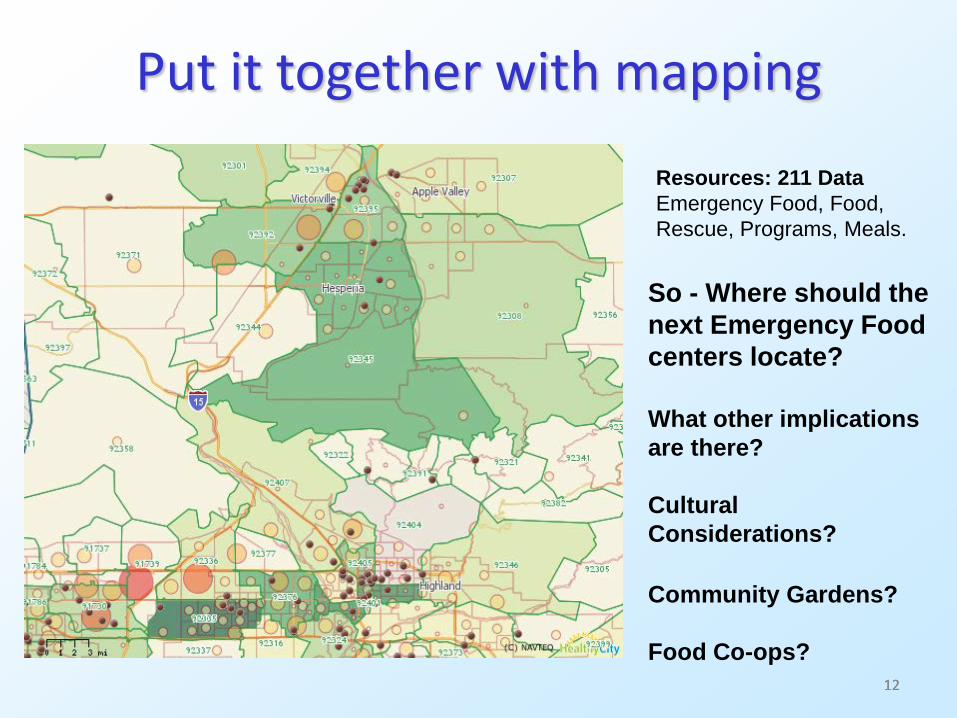
Put it together with mapping
Resources: 211 Data Emergency Food, Food, Rescue, Programs, Meals.
So - Where should the next Emergency Food centers locate? What other implications are there? Cultural Considerations? Community Gardens? Food Co-ops?
What role does data play in Organizational Planning
and Evaluation? In Grant Writing?
18
Can Your Data Prove…
• The RIGHT Data can prove that your Agency is: – Effective – Cost Effective – Efficient – A valuable Partner/Collaborator – Unique, with data available nowhere else – Evidence-based – Self Evaluating and Self Correcting
19 19
Link your data with. . .
PARCEL
CITY
Block Group
THEMATIC
20 20 20
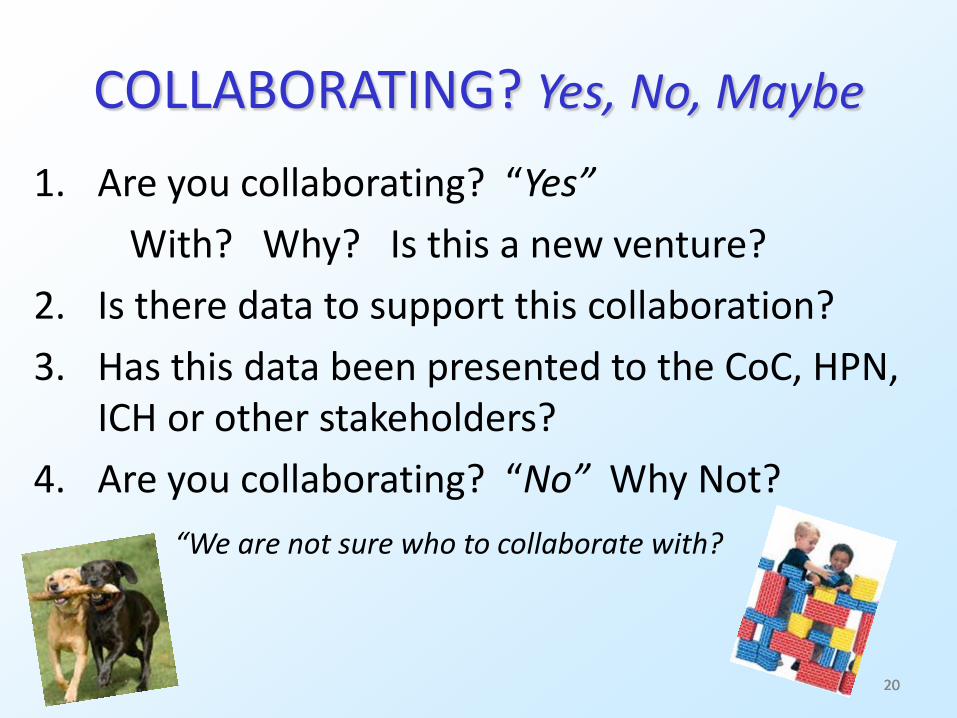
COLLABORATING? Yes, No, Maybe
1. Are you collaborating? “Yes” With? Why? Is this a new venture? 2. Is there data to support this collaboration? 3. Has this data been presented to the CoC, HPN,
ICH or other stakeholders? 4. Are you collaborating? “No” Why Not? “We are not sure who to collaborate with?
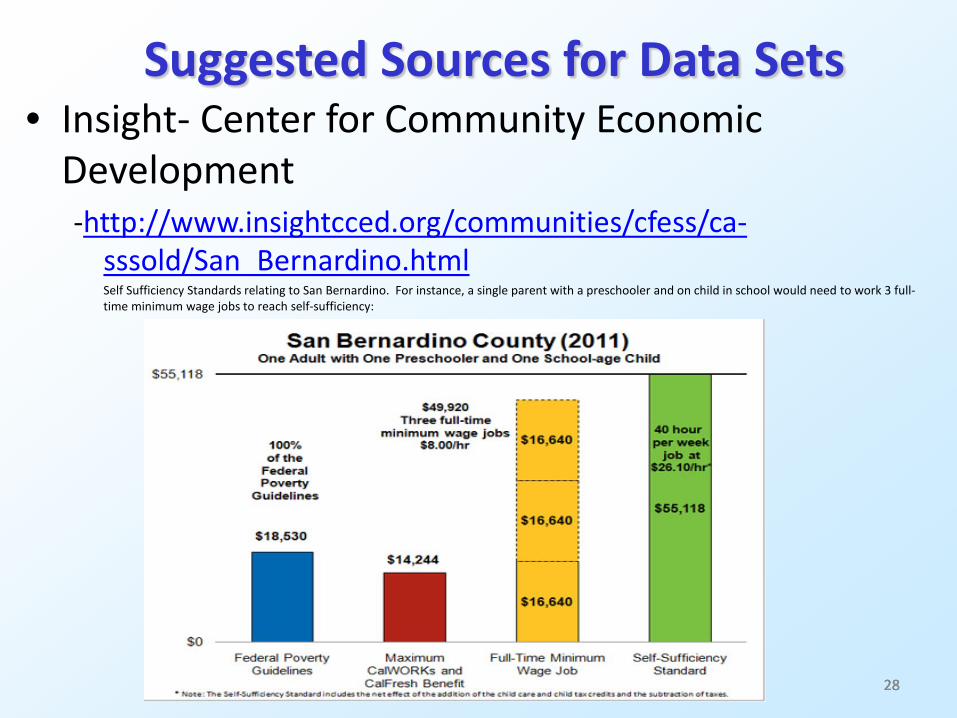
Suggested Sources for Data Sets • Insight- Center for Community Economic
Development -http://www.insightcced.org/communities/cfess/ca-
sssold/San_Bernardino.html Self Sufficiency Standards relating to San Bernardino. For instance, a single parent with a preschooler and on child in school would need to work 3 full-