40
TEST REPORT on Shear Wall Test On Sing Walls for SINGHOME COMPANY McCleary, Washington by Prof. William M. Miller and Vince Chaijaroen October 4th, 2002

TEST REPORT
on
Shear Wall Test On Sing Walls
for
SINGHOME COMPANY
McCleary, Washington
by
Prof. William M. Miller and Vince Chaijaroen
October 4th, 2002
Page 2 of 40 SING-WALL TEST REPORT
SHEAR WALL TESTS ON SING – WALLS By
William M. Miller
INTRODUCTION
In June of this year 2002 Dr. John Stanton, Director of the Civil Engineering Structural Testing Laboratory, engaged in contract with Mr. Peter Sing, President of the Singhome Company, McCleary, Washington, for the purpose of testing four shear walls constructed from “Sing logs”. Both the logs and the walls are yet to be described. These walls were tested under the control of Mr. Vince Chaijaroen, Engineering Technician and Lab Coordinator between the dates of July 17 and Aug. 14. Present for the first test (Wall No. I) were Designer Terry Sparks of Terry Designs in Redmond, WA., Mr. Richard Rock, P.E., of Rock Engineering, Port Orchard, Wash., and the writer, Prof. William M. Miller, P.E. and Emeritus Faculty, Dept. of Civil Engineering, Univ. of Washington. Present for the third test (which happened to be on Wall No, IV) were Mr. Tim Tyler, City of Everett Building Official, and Mr. Steven M. Miller, P.E., Associate Engineer, Building Division, Dept. of Public Works, Everett.
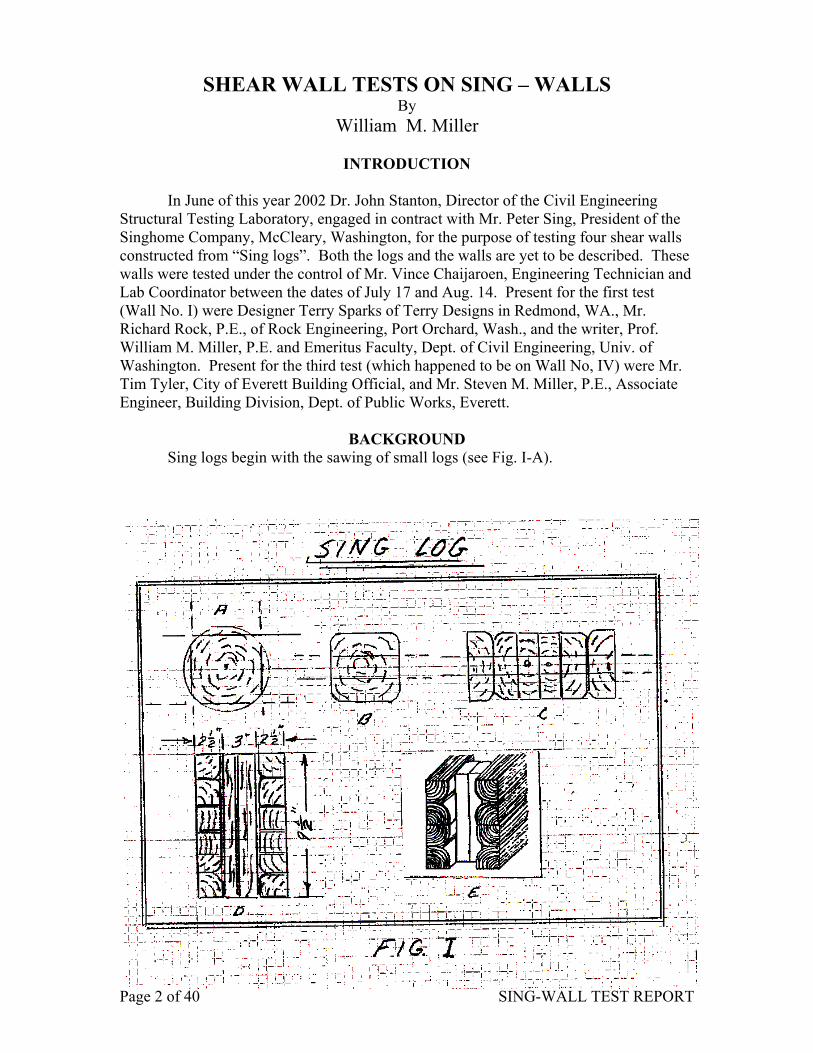
BACKGROUND Sing logs begin with the sawing of small logs (see Fig. I-A).

Page 3 of 40 SING-WALL TEST REPORT
The dashed lines define planes of saw-cuts. The squared up log (Fig. I-B) which retains wane on all four corners is next cut into three boards. These boards become the raw material of the Sing Mill. Figure I-C shows how they are repositioned and then glued along the flats. Next, this composite is re-sawed into “Sing Planks”. Two planks are then placed on edge and separated three inches apart by glued-in 2 X 4 spacers (see Fig. I-D). The result is known as a “Sing Log”. The walls that were tested were made up from 8 X 10 (nominal) logs, true dimensions of which are shown in Fig. I-D. The planks of the logs are also tongue and grooved on each edge (not shown in the sketch). The species used for the walls tested was Douglas fir.
The walls were 8’ by 8’ (nominal) in compliance with ASTM E7. True dimensions are available in Fig. II. Special details of each wall will be further introduced along with each of the four individual tests.

Page 4 of 40 SING-WALL TEST REPORT
APPARATUS AND INSTRUMENTATION
A photograph of the loading rack, with one of the walls in place, is shown in Plate I.
Plate 1 The rack contains an MTS hydraulic actuator, capable of a maximum load of 22
kips and a maximum displacement of 10 inches. Fixed into the ram was a load-cell, which was calibrated directly before the test. Also fixed to the ram was an LVDT electric extensometer. Uplift, resistance type, sensors were fixed at the corners of the base logs. Transfer of the actuator load to the shear wall was accomplished by initial delivery to a 4” by 10” steel channel placed on the flat. The pin to channel connection permitted the channel to rotate. Thus the channel connection to the wall sill produced a “rotation-free” end condition for the wall, in accordance with the standards prescribed in ASTM E72. Twenty-two rows of holes (four per row), 7/16 in diameter, provided for lag bolting to the top sill of the wall. Forty- six bolts, 3/8” by 2”, were driven. To assist in the preclusion of wall slide in the rack, steel blocks were fixed to the rack base such that they butted up to each end of the base log. The rack was oriented in a north – south direction. All of the circuitry was completed at a monitor station located directly to the east of the wall and rack.
Data acquisition at the console consisted of load cell, LVDT (Linear Variable Differential Transformer) and uplift sensory readout on oscilloscope and computer screens. Data storage was accomplished with a HP Datalogger which gathered format data in an EXCEL type file.

Page 5 of 40 SING-WALL TEST REPORT
ORIENTATION-SIGN CONVENTION-LOADING PROCEDURE
Established sign convention is as follows: A push on the wall is positive. A displacement from zero to the north is positive. Conversely, a pull on the wall is negative. A displacement from zero to the south is negative.
The loading procedure was of a static, complete reversal form. For pre-determined displacements, resultant lateral loads were read. The maximum displacement for the first cycle was arbitrarily established at plus and minus 0.10”. Each cycle consistently began with a pull to the south. At a displacement of –0.10”, the load was observed, then, the displacement was returned to a complete stop at zero. Next came the compressive half of the “ONE-TENTH” cycle, with a stop at +0.10”; then, a return to zero.
Maximum displacements for each cycle were chosen to increase by successive increments of 0.10”. Thus the test continued on up to the condition associated with ultimate load. A sample plot is shown in Fig. III. This figure essentially summarizes the orientation and sign convention. Note that the figure arbitrarily illustrates the so-called “FOUR-TENTHS” cycle. The plot is randomly sketched in, purely for illustration. In the computer graphs to be presently reported, the limiting displacements will generally be within plus or minus 0.02” of the ideal maximum displacements desired. Accurate limiting loads will also accompany the more accurate limiting displacements. Less accurate limiting loads and displacements were recorded on a running, hand-held log sheet for each cycle in each test. These sheets are included in the appendix of this report. The numbers therein were hastily abstracted from rapidly changing screen readouts and can only be considered to be approximate.
SHEAR WALL NO. I
Plate I shows Shear Wall I in place. Figure II shows its dimensions. Also, it indicates the important features. The wall is characterized by tie rods that extend only through the base log. Four 5/8” diameter “All-thread” anchor rods complete the tie-down. Four couplings directly below the sole plate were snuggled up, mainly for the purpose of holding things together during wall fabrication and transport. Once the wall was seated on the base of the rack,

Page 6 of 40 SING-WALL TEST REPORT
extension lengths of rods were required to complete the tie to steel channels on the rack. This detail is shown in Fig. IV. Also shown in this figure is a detail of the construction at the ends of the base log. Two, Douglas fir glued-in spacers, at 1 ½” by 11” by 9 ½”, provided bearing parallel-to-grain for a ½” by 3” by 11” steel plate. The All-thread was then topped off with nut and washer. Four wood screws were additionally driven horizontally on each side of the base log. A photo of this connection is shown in Plate II.
Plate 2

Page 7 of 40 SING-WALL TEST REPORT
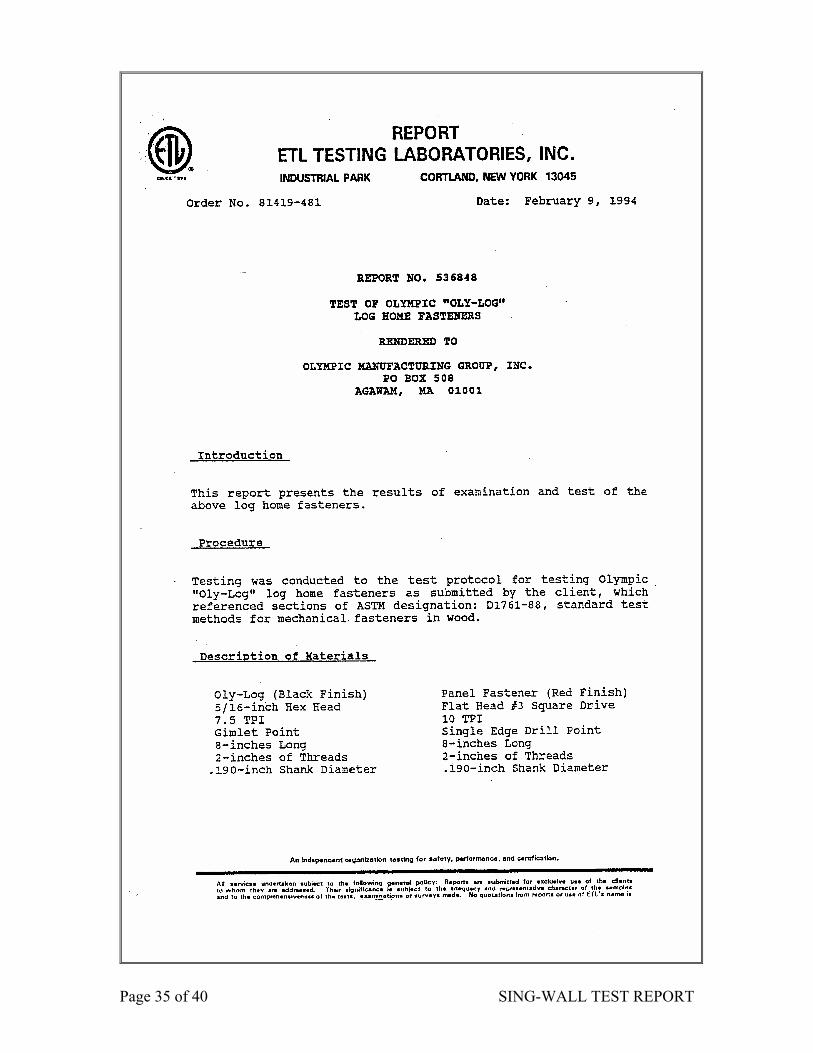
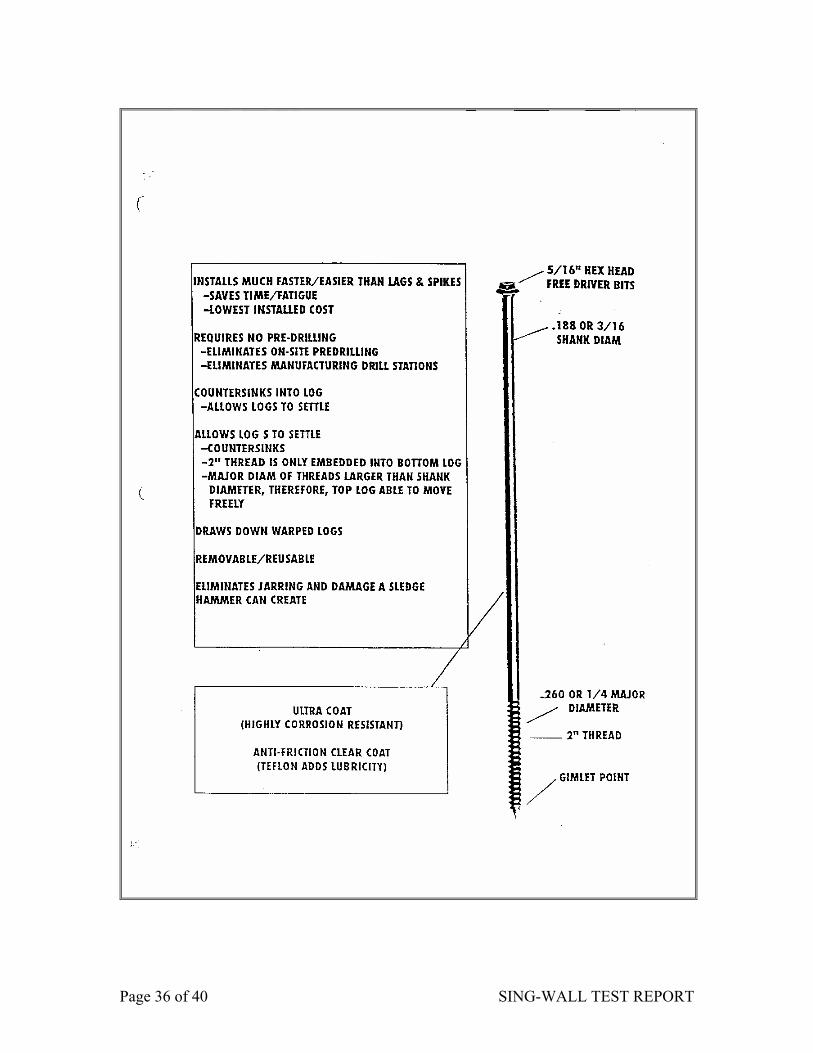
Glue adhesive and Olympic “Oly-Log” log home fasteners (or equivalent) must necessarily take the place of the tie-rods in providing for tensile loading in the logs above the tie rod ends. They are also shown in Fig. IV. “Oly-Logs are also commonly referred to as “OlyScrews”
They are 12” long. Further facts about these fasteners can be found in the
appendix of this report. The glue along the tongue and groove interfaces was “Tight-bond”, a water soluble, “user-friendly” product. It is generally laid down with a caulking gun, to produce two “field” glue lines (1/2” wide) along each plank of the base log.

Page 8 of 40 SING-WALL TEST REPORT
Of considerable importance is to note that, in Wall I, two Oly-Screws for each plank were driven into the first eleven inches of the logs, at each end. Two more (one on each plank) were placed at the longitudinal center of each T&G interface. Thus, a major feature of Wall I is “ten - Oly- Screw per interface” throughout the wall.
Two other tie-down All-thread rods were symmetrically spaced along the base log. Figure II shows this feature. These, however, were capped off with doubled-up ¼” by 2” by 5” steel plates that spanned the two planks thus creating a condition of bearing perpendicular to the grain. The plates sat in a mitered insert.
TEST RESULTS: (Appendix A) Graph I shows an array of computer plots for a number of displacement cycles. Graph II shows an arbitrarily selected plot of the “FIVE TENTHS” displacement cycle. Most important is the “1.3 - INCH” cycle since, in this, structural failure occurred. This is shown in Graph III. Note that, at a displacement of +1.292”, the ultimate lateral load was +7.292kips. At this point an open crack appeared at the south end of the T&G interface of the base log. For the first half of the following “1.4 - INCH” cycle, at a –1.394” displacement, with a pull of -5.969 kips, a similar interface separation occurred at the north corner. For the second half of this cycle the compressive load dropped from +7.292kips to +6.65kips (see Graph IV). Failure was tensile, both in the adhesive and the Oly- Screws. A photo of the failed section on the south end is shown in Plate III. Plate IV shows failure conditions on the north corner. Two of the Oly-Screws on the north end fractured. One fractured on the south end. The remaining end Oly Screws failed either in pull-out or pull-through.
Plate 3

Page 9 of 40 SING-WALL TEST REPORT
Plate 4
SHEAR WALL NO. III
Failure of the interface of Wall I revealed a defect. The adhesive appeared to be unusually soft and pliable. It had apparently not fully cured. Further investigation revealed the fact that the interface “field” seams could very well have been subjected to damaging stresses in the process of handling and transport. Wall I was constructed at the owner’s Mill on its side. It was eventually lifted to a vertical position then laid flat on a trailer bed. Upon arrival at the laboratory, it was again lifted to vertical, stored flat, then raised to vertical once more before being placed on the loading rack. High normal stresses due to bending could very well have caused preliminary damage. Wall No. III was constructed to enhance the performance of the glue. It had identical dimensions and features to those of Wall I, except that careful attention was given to maximizing bond surface along the field seams. Also, it was constructed vertically in a temporary rack set up on the trailer bed for which it was to be transferred. In the laboratory it was also kept vertical at all times. Two weeks of drying time was prescribed. Furthermore, the number of Oly-Screws per interface was increased to 16. Six screws were placed within the first 11” of each log, as opposed to the four in Wall I. Also, four more (instead of two) were symmetrically spaced at interior longitudinal stations.
TEST RESULTS: Graph V is an array of a number of the smaller
displacement cycles, provided only for casual observance. The most important cycles follow individually in Graphs VI through IX. Graph VI shows the “EIGHT-TENTHS cycle where, during the second half of the cycle, an ultimate compressive load of +10.586 kips produced failure. A longitudinal crack, ¼” wide and 27” long opened up in the

Page 10 of 40 SING-WALL TEST REPORT
south end of the east plank of the base log. The crack was just below the gimlet points of the Oly-screws (three inches down from the T&G interface). Upon investigating the corresponding west plank, a similar split was observed. The compressive load rapidly dropped to +6kips Plate V shows a photo of the splitting.
Plate 5
In the subsequent “NINE-TENTHS” cycle (see Graph VII), the maximum tensile force rose to –11.193kips. The maximum compressive force recovered modestly from +6kips to +8.185kips. During the first half of this cycle there was the first evidence of a split in the north end of the base log. For the “ONE-INCH CYCLE” (see GRAPH VIII), through the first half (tensile), the load bearing capacity of the wall continued to rise, going from –11.193kips to -11.745kips. Meanwhile the split in the north end continued to propagate. It was only after completion of the tensile half of the “1.10 - INCH” cycle that there was a fall-off of the maximum tensile load from –11.745kips to minus 11.095 kips (see Graph IX). The modifications to Wall III served to bolster the performance of the base log T&G interface. It remained in tack throughout the test. Also, the strength of the wall improved over that of Wall 1 by about 3.3kips. What the modifications did was to “fix the weakest link”, only to move the weakness to another (but not far away) level. There was a combined failure. First, the upper three inches of the 2” by 12” spacer glued surfaces failed in shear. This left only the two base planks to take the tension. The wood failed in tension perpendicular to the grain. The same kind of failure occurred at both ends. Close-ups of the Wall III failures are shown in Plates VI and VII

Page 11 of 40 SING-WALL TEST REPORT
Plate 6
Plate 7

Page 12 of 40 SING-WALL TEST REPORT
SHEAR WALL NO. II
Shear Wall No. II was quite different from walls I and III. While it was the same size and the same species, it was characterized by end tie-down rods that extended vertically from the bottom of the rack channels to the top of the wall. Figure II shows true dimensions and exacting details of this wall. Because room was needed between the top channel on the rack and the top of the wall, for the capping of the rods with nuts, the top log was necessarily shortened 6” on each end. This wall obviously did not require the base log end bearing surfaces required in Walls I and III. The spacers in the base log were the typical doubled up 2 by 4’s placed 6” in from both ends, plus others of the same placed longitudinally about every 2’. With the exception of the top two logs, all of the other logs in the wall were made the same. The second log down from the top now necessarily contained the bearing blocking. A ¾” by 6” by 8” steel plate rested on two glued-in 1 ½’ by 6” by 9 ½” blocks. The wood was subjected to compression, part in parallel and part in perpendicular to the grain. Intermediate tie-down rods were identical to those of Walls I and III. Each T&G interface contained ten Oly-Screws spaced the same as they were in Wall I. Plate VIII shows Wall II set up in the rack and ready to go.
Plate 8

Page 13 of 40 SING-WALL TEST REPORT
TEST RESULTS: From the outset, this wall exhibited some strange
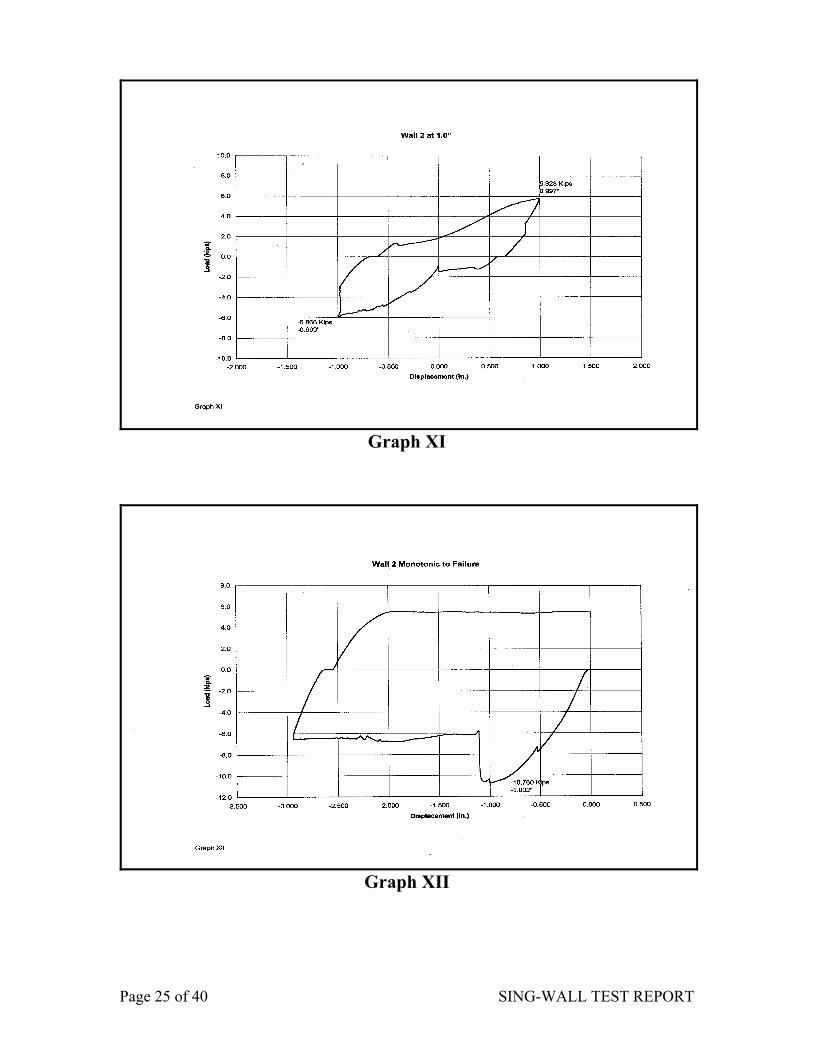
behavior. Upon loading, there was the sound from sliding wood surfaces, which amplified with each successive cycle. Successive cycles in the lower increment range produced small visible relative horizontal displacements along the T&G interfaces. The wall was behaving somewhat like a deck of well-used cards. Upon reaching the end of the “NINE-TENTHS” cycle, the wall produced the sound of a loud crack. The third interface from the base of the rack developed an instantaneous longitudinal relative displacement of about ½” (see Plate IX, showing the shift to the north). The maximum compressive load at the end of this cycle was +6.730kips. This is shown in Graph X). Graph XI of the “ONE-INCH” cycle shows the “dropping off” of the “ultimate” loads that were experienced through each half of the “NINE-TENTHS cycle. Shear failure was obviously in the adhesive along the interface.
Plate 9
An investigation into this strange behavior revealed the fact that this wall, which was fabricated at the Sing Mill, contained little (if any) glue along the field seams. The employee reported that he placed, at best, a thin layer of adhesive only along the tongue surfaces of each log. This shortage of bond surface, along with relatively minimal curing pressure provided by the ten Oly-Screws, proved to be a disaster. Furthermore, this wall, in the process of temporary storage and transportation, was handled in the same way as was Wall I. If the field seams developed any bond strength at all, it could have been destroyed, in part, through handling.

Page 14 of 40 SING-WALL TEST REPORT
When this test was completed, the process of returning the actuator to its zero position was such as to return this “stack of cards” to its original orderly vertical pile. Aside from some local wood crushing next to the Oly-Screws, the wall was undamaged. As an aftermath, the writer took the opportunity to interject an experiment. Using a bonding agent named “MOR-AD-M513”, a quick drying, insoluble adhesive, the T&G field seams were caulked and allowed to cure for three days. The procedure could not accurately be described as “injection gluing”, but it was intended to certainly suggest a potential procedure for “field post gluing”.
This modified wall was subjected to a simple monotonic (one direction) pull, the results of which are shown in Graph XII. It shows an ultimate load of minus 10.760kips an increase of about 4kips over its “no-glue” counterpart. Again the sliding type failure occurred along the third interface up from the bottom of the wall.
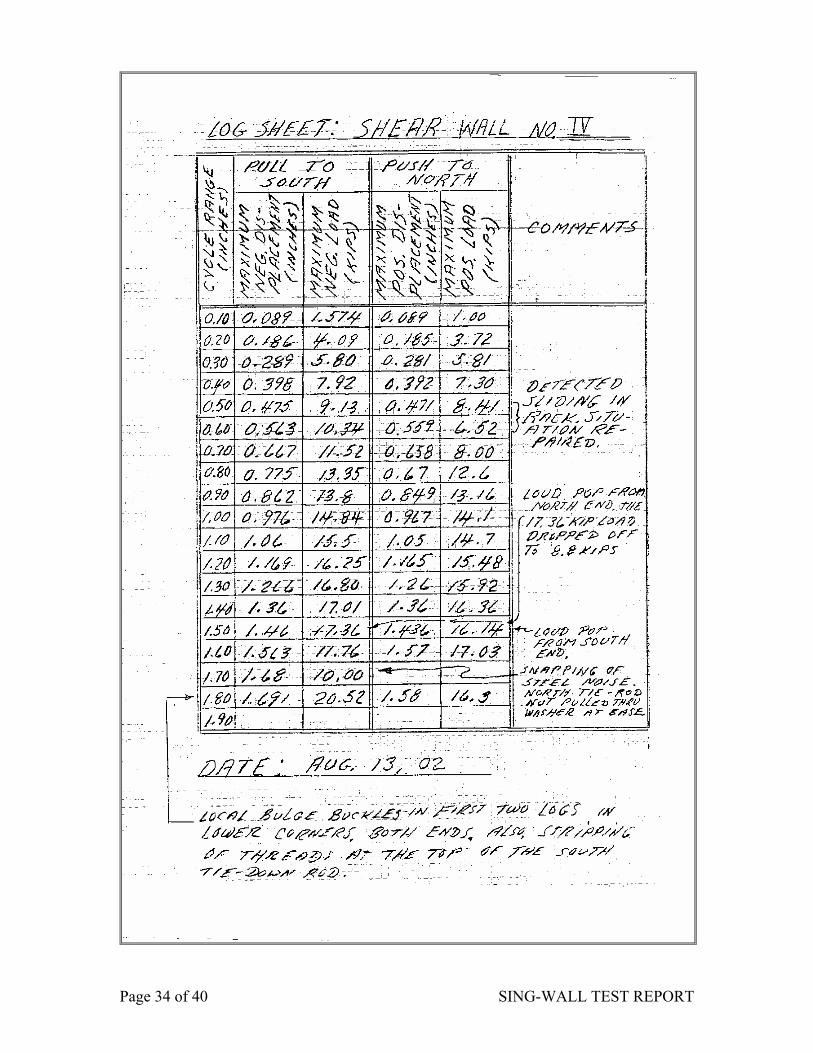
SHEAR WALL NO. IV
This wall was a replication of Wall II in almost every way. Size, species, dimensions, number of Oly-Screws per T&G interface and all four tie-downs were exactly the same. The major difference however was in the gluing of the T&G surfaces. The adhesive remained the same, namely MOR-AD M-513, but it was carefully distributed over the interface surfaces. Also, this wall was constructed and allowed to cure in the loading rack.
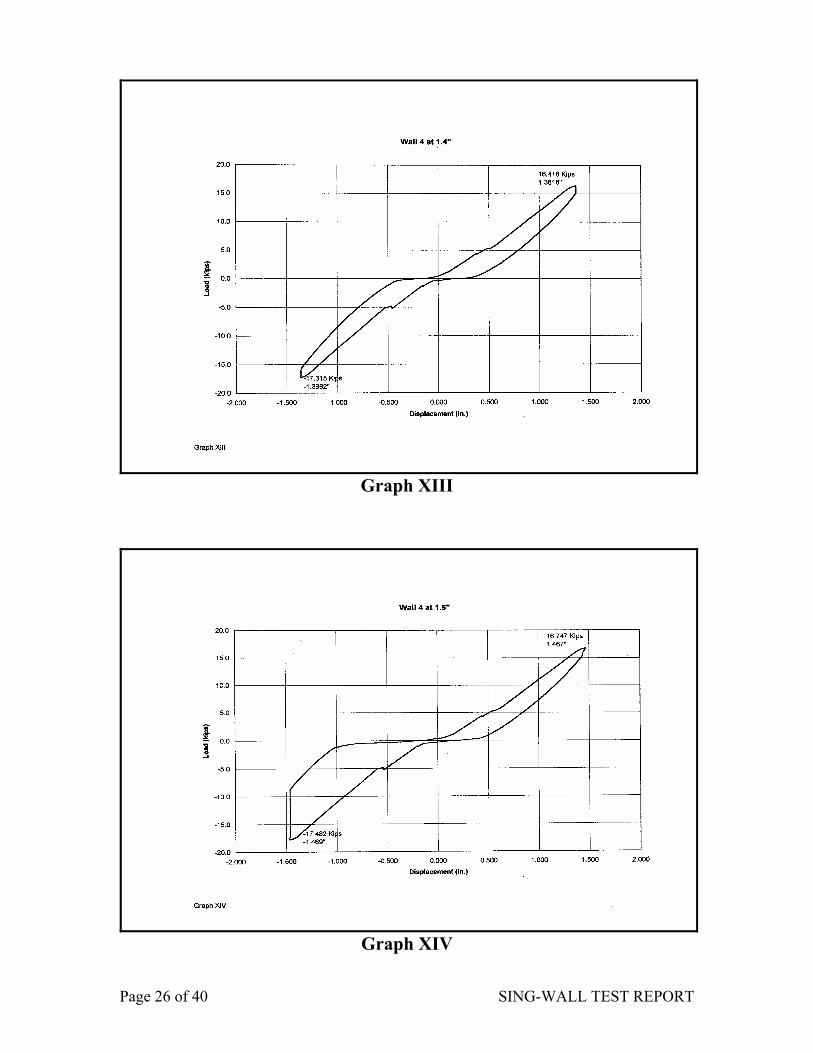
TEST RESULTS: The wall responded quietly. At the end of the “SIX-TENTHS” cycle the load fell off somewhat (about 2 kips below the previous cycle). Observers discovered that the north block on the frame base had slid about 3/8” to the north. The block (and the wall) was returned to it original position, all tie-downs and the block were re-tightened; then the test was continued. The wall behaved well, developing continuously increasing load bearing capability, on up to, and through, the “1.4 - INCH” cycle. This cycle is shown in Graph XIII. During the first half of the “1.5 - INCH” cycle (shown in Graph XIV), under a load of –17.482kips, there was a loud “pop” from the north end and the load dropped off to about –9kips. On completion of this cycle the peak compressive load was +16.747kips. This was accompanied by another “pop”, now coming from the south end.
Observation of the wall at this point revealed similar developments at both ends of the base log. The sole 2” by 8” crushed to produce the shape of an arch along its top surface. Planks on both sides of the log began to rotate outward causing the wall to produce a local “bulge” buckle. This in turn caused a tension failure in the glue surface between a plank and a 2” by 4” spacer. This pair of failures is shown first in Plate X (south end) and next In Plate XI (north end).

Page 15 of 40 SING-WALL TEST REPORT
Plate 10
Plate 11

Page 16 of 40 SING-WALL TEST REPORT
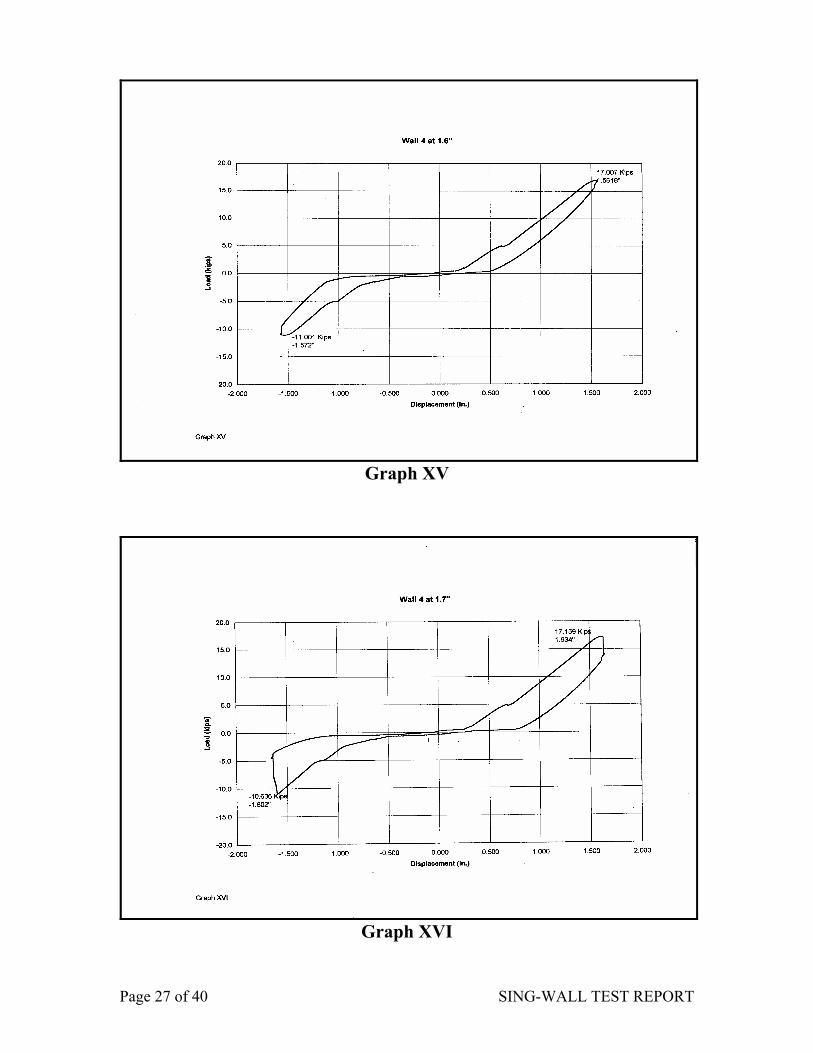
Of interesting note is the fact that the wall, under the subsequent displacement
cycle (“1.6 INCH) exhibited renewed load bearing capability (see Graph XV). The cycling continued. During the first half of the 1.7 INCH cycle (see Graph XVI), at a load of –10.636kips, there was a snapping of steel. The nut on the north tie-rod, under the rack channel, sheared through the washer. Some repairs were made on the tie-downs. Replacement nuts, along with doubled-up washers, were fitted to all four, and a final cycle was begun. During the first half of the “1.8 INCH “ cycle (see Graph XVII), at a displacement of –1.756” and an absolute ultimate load of –20.134kips, collectively catastrophic failure was reached. Local buckle was observed in the first two logs in the lower corners. This was accompanied by a stripping of the thread at the top of the south tie - down rod. Throughout all of this, the properly placed adhesive along the field seams behaved extremely well. There was no evidence of failure it that glue, either in shear or in tension. Plate XII is an exhibit of the damaged tie-downs.
Plate 12

Page 17 of 40 SING-WALL TEST REPORT
UPLIFT
Uplift, associated with tendency to overturn, was monitored throughout the testing. It was minimal. Maximum corner uplifts for each corner, for each wall are reported below.
SHEAR WALL SOUTH CORNER NORTH CORNER
I 0.167” 0.136” II 0.200” 0.123” III 0.003” 0.070” IV 0.481” 0.407”
In general, the end tie-downs, in all cases, performed quite well in bearing. The bearing surface areas that were provided proved to be adequate.
CONCLUSION
A concluding summary table is shown in TABLE I.

Page 18 of 40 SING-WALL TEST REPORT
The reported “Ultimate Loads” for each wall are those that related to the first sign of distress, even though the wall may have developed additional strength in subsequent cycles. Reported Ultimate Shear Flows were derived by multiplying the listed Ultimate Loads by 1000/7.83.
The reader should be reminded at this point that, because of the “rotation- free” connecting feature of the loading channel at the top of the wall, The wall behaved much more like an ideal cantilever beam than one having “rotation fixity” at both ends. Field conditions for shear walls are usually such that gravity loads are delivered from second stories, and second story floors are quite stiff, suggesting that the more realistic analogized beam model should develop equal moments at both top and bottom. These moments would only be half as much as that which develops at the fixed base of the pure cantilever. The point to be made is that the “pure cantilever” shear wall test (specified in ASTM E72) is conservative. This factor must be kept in the mind of the structural engineer, should he desire to establish an “allowable shear flow” by projecting the findings of these tests into his individual designs.
William M. Miller P.E.
Client Information:
SINGHOME COMPANY 162 Summit Road N.
McCleary, WA 98557 Tel:(360) 495-3577 Fax:(360) 495-4585
e-mail: [email protected]

Page 19 of 40 SING-WALL TEST REPORT
Appendix A
Graphs

Page 20 of 40 SING-WALL TEST REPORT
Graph I
Graph II

Page 21 of 40 SING-WALL TEST REPORT
.
Graph III
Graph IV

Page 22 of 40 SING-WALL TEST REPORT
Graph V
Graph VI

Page 23 of 40 SING-WALL TEST REPORT
Graph VII
Graph VIII

Page 24 of 40 SING-WALL TEST REPORT
Graph IX
Graph X
Page 25 of 40 SING-WALL TEST REPORT
Graph XI
Graph XII
Page 26 of 40 SING-WALL TEST REPORT
Graph XIII
Graph XIV
Page 27 of 40 SING-WALL TEST REPORT
Graph XV
Graph XVI

Page 28 of 40 SING-WALL TEST REPORT
Graph XVII

Page 29 of 40 SING-WALL TEST REPORT
Appendix B
Miscellaneous

Page 30 of 40 SING-WALL TEST REPORT

Page 31 of 40 SING-WALL TEST REPORT

Page 32 of 40 SING-WALL TEST REPORT

Page 33 of 40 SING-WALL TEST REPORT
Page 34 of 40 SING-WALL TEST REPORT
Page 35 of 40 SING-WALL TEST REPORT
Page 36 of 40 SING-WALL TEST REPORT

Page 37 of 40 SING-WALL TEST REPORT

Page 38 of 40 SING-WALL TEST REPORT

Page 39 of 40 SING-WALL TEST REPORT

Page 40 of 40 SING-WALL TEST REPORT


