Page 1
1
Single cell genome analysis of an uncultured heterotrophic
stramenopile
Rajat S. Roy1,2, Dana C. Price2, Alexander Schliep1,3, Guohong Cai4, Anton Korobeynikov5,6,
Hwan Su Yoon7, Eun Chan Yang8, & Debashish Bhattacharya2,*
1Department of Computer Science, Rutgers University, Piscataway, NJ 08854, USA
2Department of Ecology, Evolution and Natural Resources, Rutgers University, New Brunswick,
NJ 08901, USA
3BioMaPS Institute for Quantitative Biology, Rutgers University, Piscataway, NJ 08854, USA
4Department of Plant Biology and Pathology, School of Environmental and Biological Sciences,
Rutgers University, New Brunswick, NJ 08901, USA
5Faculty of Mathematics and Mechanics, Department of Statistical Modeling, Saint Petersburg
State University, Universitetskiy 28, 198504, Stary Peterhof, Saint Petersburg, Russia
6Algorithmic Biology Laboratory, Saint Petersburg Academic University, Khlopina 8/3, 194021,
Saint Petersburg, Russia
7Department of Biological Sciences, Sungkyunkwan University, Suwon 440-746, Korea
8Marine Biotechnology Research Center, Korea Institute of Ocean Science and Technology,
Ansan 426-744, Korea
* Corresponding author: Debashish Bhattacharya, Department of Ecology, Evolution and Natural
Resources and Institute of Marine and Coastal Science, Rutgers University, New Brunswick,
New Jersey, 08901, USA; phone: 848-932-6218, fax: 732-932-8746,
Email: [email protected]
Page 2
2
Abstract
A broad swath of eukaryotic microbial biodiversity cannot be cultivated in the lab and is
therefore inaccessible to conventional genome-wide comparative approaches. One promising
approach to study these lineages is single cell genomics (SCG), whereby an individual cell is
captured from nature and genome data are produced from the amplified total DNA. Here we
tested the efficacy of SCG to generate a draft genome assembly from a single sample, in this case
a cell belonging to the broadly distributed MAST-4 uncultured marine stramenopiles. Using de
novo gene prediction, we identified 6,996 protein-encoding genes in the MAST-4 genome. This
genetic inventory was sufficient to place the cell within the ToL using multigene phylogenetics
and provided preliminary insights into the complex evolutionary history of horizontal gene
transfer (HGT) in the MAST-4 lineage.
Page 3
3
Multigene phylogenetic analysis using cultivated microbial eukaryotes (protists) has provided an
important backbone to the eukaryote tree of life (ToL)1 but has failed to address a fundamental
problem with these taxa: sparse taxon sampling. This issue arises because many key lineages,
and in general most protist taxa cannot be successfully cultivated2, 3 (at least long-term) or go
undetected due to their small size or morphological simplicity (i.e., exist as cryptic species4).
Therefore our understanding of the protist ToL is skewed by a preponderance of data from
important parasites or easily cultivated free-living lineages. Another confounding issue is foreign
gene acquisition either as result of plastid endosymbiosis (i.e., endosymbiotic gene transfer;
EGT5,6) or horizontal gene transfer, HGT, from non-endosymbiotic sources7-9 that generates a
reticulate history for many nuclear genes. A commonly used approach to address the massive
scale of microbial eukaryotic biodiversity2 is DNA “barcoding” (e.g., using rDNA hypervariable
regions10) to identify uncultured lineages. These data are however often insufficient to reliably
reconstruct ToL phylogenetic relationships and do not address genome evolution. Another
approach to studying the biology and evolution of uncultivated lineages is analysis of individual
cells isolated using fluorescence-activated cell sorting (FACS) of natural samples followed by
whole genome amplification (WGA) using multiple displacement amplification (MDA11-16). The
pool of total DNA resulting from this process can be used to reconstruct the genomes of the host
and associated symbionts, pathogens, or “food” DNA presumably present in cell vacuoles. This
approach, termed single cell genomics (SCG) has been used to elucidate the phylogeny of
individual cells and their biotic interactions13-15. Other applications that rely on MDA of single
cells include targeted metagenomics, whereby marker genes are PCR-amplified from the DNA
sample to decipher their distribution in ecosystems or larger fragments of DNA are assembled
for analysis of gene content11, 17.
Page 4
4
Here we used SCG to generate the first draft genome assembly from a cell belonging to
the broadly distributed group of MAST-4 uncultured marine stramenopiles18. MAST-4 cells are
small-sized (ca. 2-5 μm diameter) protists that account for about 9% of heterotrophic flagellates
in non-polar ocean waters19, 20. Due to their high abundance, these cells are key bacterivores in
marine environments, potentially controlling the growth and vertical distribution of bacterial
species21 and playing important roles in nutrient re-mineralization22. Here we used a MAST-4
cell as a model to test SCG methods with uncultured taxa. The over-arching goal of our study
was to assess the extent of genome completion that is possible when studying a single MDA
sample. Analysis of the genome data using ab initio gene prediction identified 6,996 protein-
encoding genes in the genome of the isolate. This represents >70% of the expected gene
inventory of the MAST-4 lineage. Using these partial data we included the MAST-4 cell in the
ToL using multigene phylogenetics and gained insights into its complex evolutionary history of
horizontal gene transfer (HGT).
Results
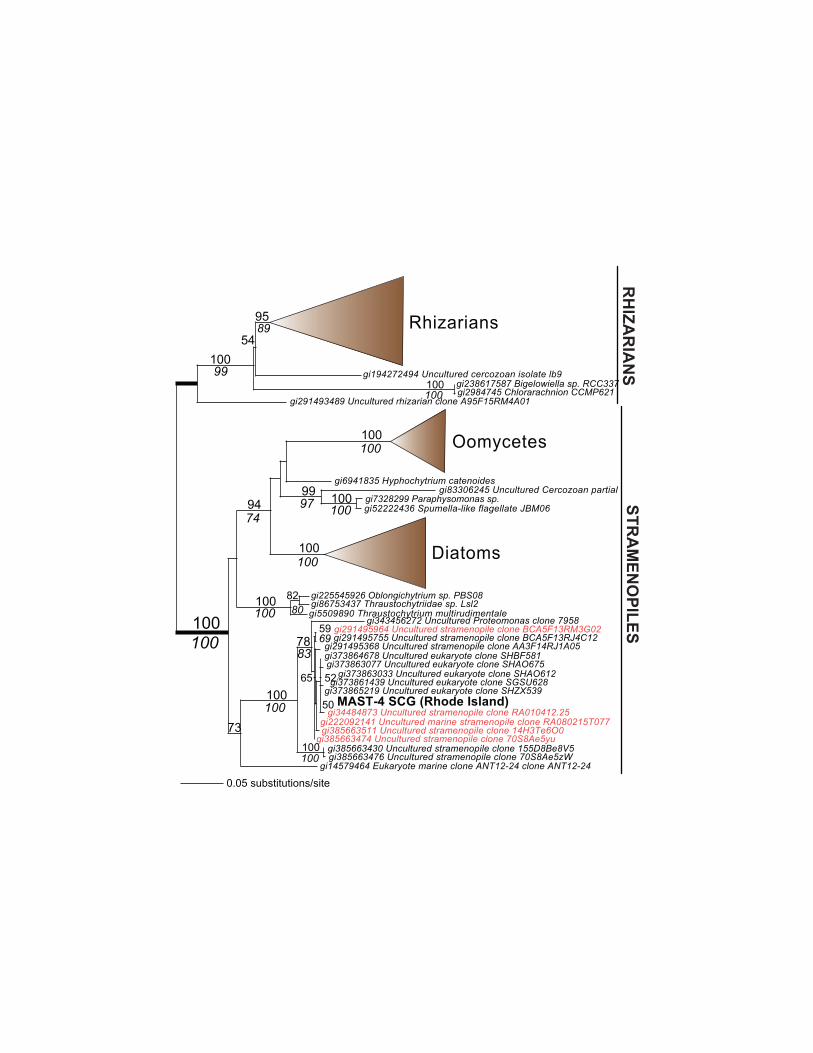
Sample collection and preliminary analysis. A water sample collected from Narragansett,
Rhode Island, USA was sorted using FACS. Single heterotrophic cells <10 µm in size lacking
chlorophyll autofluorescence were retained for MDA prior to rDNA identification and
phylogenomic analysis. Analysis of 18S rDNA sequence showed that one was related to
uncultured, heterotrophic stramenopiles identified in the English Channel and from Saanich Inlet
in Vancouver, Canada (Fig. 1). High sequence identity of the stramenopile rDNA to taxa in the
marine stramenopile group 4 (MAST-4; e.g., accessions RA010412.25, 14H3Te6O0,
Page 5
5
RA080215T.0778) identifies this cell as a member of this abundant, globally distributed member
of the plankton that consumes bacteria and picophytoplankton18, 22-24.
Genome assembly, gene prediction, and search for contaminant DNA. A total of 6.62 Gbp of
Illumina paired-end reads were generated from the MAST-4 MDA sample and assembled using
SPAdes 2.425. This assembly had 123x average genome coverage and comprised 4,611 scaffolds
with a total length of 16.93 Mbp (average scaffold length = 3,671 bp). The scaffold N50 was
14,108 bp and the maximum scaffold length was 111 Kbp (Table 1). We used the Core
Eukaryotic Genes Mapping Approach (CEGMA26) to identify 159/458 conserved eukaryotic
proteins in the MAST-4 SCG assembly. The genes encoding these proteins were used to
predict27 6,996 proteins, of which 3,072 had a significant BLASTP hit (e-value ≤1e-10;
Supplementary Fig. S1) with an alignment of at least 70% of the length of the protein to an
existing sequence in our in-house peptide database (Supplementary Table S1). A vast majority of
these top hits were to eukaryotic proteins. Relaxation of the BLASTP criteria to only the e-value
cut-off and use of the NCBI “nr” database returned 4,645 hits, of which 4,091 (88%) of the top
hits were to eukaryotes and 1,611 to stramenopiles (Supplementary Table S2).
We tested the possibility that some MAST-4 predicted proteins may have been
contaminants derived from food sources, symbionts, or pathogens, as has been previously
described in SCG work done with wild-caught, heterotrophic picozoan and Paulinella ovalis-like
cells. These assemblies contained significant bacterial, viral, and phage DNA13-15, 28 that
assembled into contigs that were either very short, encoding a single gene or if larger (e.g., often
>10 Kbp in length), encoded multiple prokaryote, viral, or phage genes. Many of these contigs
had atypically high genome coverage due to MDA bias15, 28. Given these data, we identified all
prokaryote top hits to the MAST-4 predicted proteins. This analysis (Supplementary Table S3)
Page 6
6
turned up 294 scaffolds that contained a prokaryote top hit (total of 351 genes, 5% of the total).
Of these, 119 scaffolds encoded a single prokaryote gene. All scaffolds with >1 prokaryote gene
(232) also encoded genes of eukaryote origin, suggesting independent HGTs in these genome
regions rather than contaminating prokaryote DNA. This is not surprising because protists have
been shown to contain a large number of genes of prokaryote origin derived through HGT6, 9, 29.
We however recognize that the MAST-4 assembly will likely contain some chimeric scaffolds
(i.e., independently derived bacterial and eukaryotic genes that are artifactually assembled in one
fragment), but it would be very surprising if all 232 scaffolds were chimeric. Finally, the 119
scaffolds that encode single prokaryotic genes comprise only 1.7% of the total gene set and had a
minor impact on the overall phylogenetic analyses (see below).
The search for foreign eukaryote (i.e., prey or contamination) DNA in the assembly was
repeated for MAST-4 proteins that had a BLASTP top hit to eukaryotes other than
stramenopiles, alveolates, or rhizarians (the SAR clade). Although still a controversial issue,
SAR taxa have been grouped together in phylogenies and likely share a sister group
relationship30, 31. This analysis turned up 13 scaffolds that encode ≥5 top hits to lineages such as
metazoans, fungi, and Viridiplantae (Supplementary Table S4). To investigate these results
further, we generated a RAxML bootstrap tree for each predicted MAST-4 protein, resulting in
4,385 phylogenies. Manual analysis of trees derived from proteins encoded on the 13 scaffolds of
interest did not identify any cases in which a single eukaryote source gave rise to the foreign
genes. Most of these proteins were placed with SAR taxa in the RAxML trees (results not
shown) indicating that the BLASTP result was not accurate. This suggests that eukaryote-derived
food DNA likely does not exist in our MAST-4 assembly. We recognize however that proving
clear instances of eukaryote-derived HGT (even from a single “food” lineage) is more difficult,
Page 7
7
in particular if the foreign sequences derive from SAR taxa. Intra-phylum HGT is difficult to
identify without additional genomes to provide a more fine-grained history of stramenopile and
SAR gene phylogeny.
Comparing results of the MAST-4 and control diatom MDA analyses. To explore the
efficacy of our approach to generate the MAST-4 assembly and predict proteins, we generated
three independent MDA samples (named A, B, and C) from total DNA prepared from a unialgal
culture of the diatom Thalassiosira pseudonana (CCMP1335). This species has a high-quality
completed genome of size 34.5 Mbp that encodes 11,242 proteins32. Illumina paired-end data
generated from the diatom MDA samples were assembled (Table 1) separately and when
combined in one dataset and the encoded genes predicted (Table 2) as described above.
Comparison of the MAST-4 SCG assembly with the assembly derived from the three T.
pseudonana MDA samples indicates they are similar in terms of maximum scaffold and N50
lengths (Table 1).
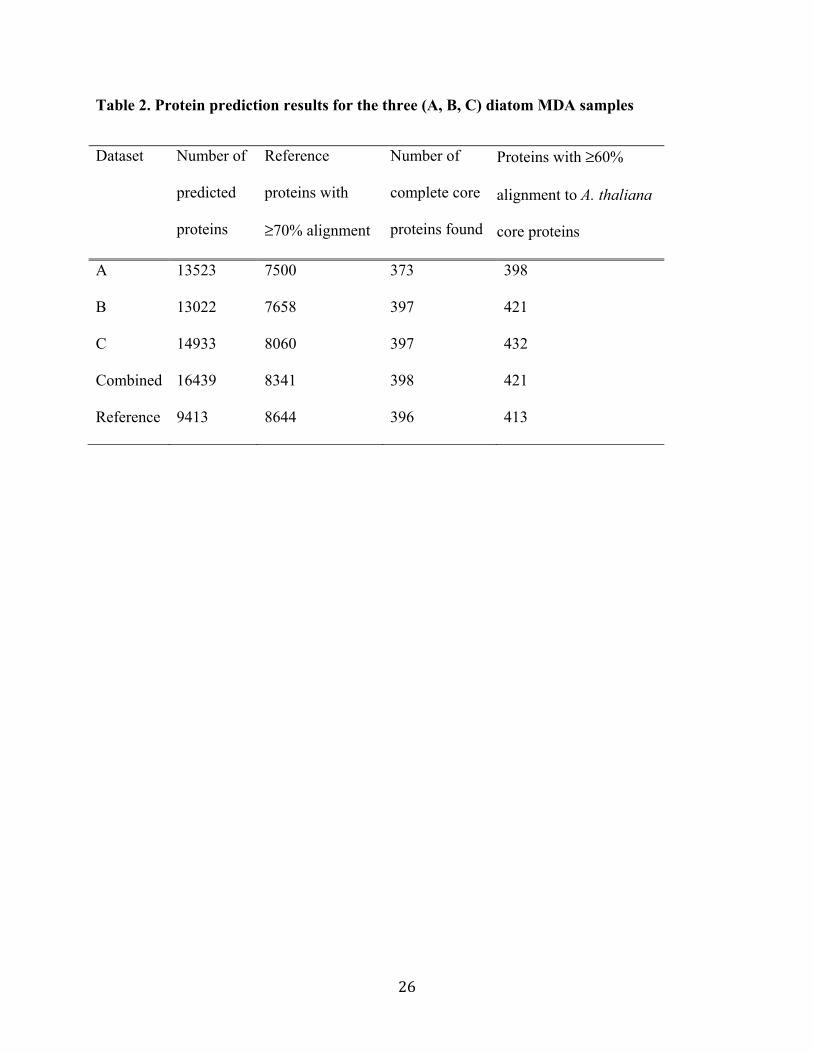
The fraction of diatom reference proteins32 having at least 70% coverage with a BLASTP
hit to our predicted proteins was 64%, 65%, 68%, and 71%, respectively in the individual and
combined diatom MDA-derived genome data (Supplementary Fig. S2A). In comparison,
CEGMA recovered only 86.7% of the core proteins in the diatom reference assembly (that
included organelle DNA) and the predicted proteins encompassed 73.40% of the reference
diatom proteins with ≥70% coverage. Analysis of core CEGMA proteins within the predicted
data from the MAST-4 SCG and diatom showed that ca. 60% and ≥90%, respectively, of the 458
genes were identified when compared to the Arabidopsis thaliana reference set (Supplementary
Fig. S2B). When the alignment length of the MAST-4 and A. thaliana reference proteins was
reduced to a minimum of 70%, then 326 (71%) core CEGMA proteins were identified in the
Page 8
8
MAST-4 data. This value climbed to 410 proteins (90%) when the alignment length was reduced
to 50%. Analysis of the 248 ultra-conserved protein set in CEGMA showed that 89 complete
proteins from this set was identified in the MAST-4 data. These results demonstrate that gene
prediction from SCG data can detect a significant number of proteins (both complete and partial
[i.e., the latter due to a fragmented assembly) in a microbial eukaryote without an available
reference genome or transcriptome data.
The ca. 30% difference between the efficiency of recovery of complete proteins from the
core set between the MAST-4 and diatom MDA samples (Supplemental Fig. S2A, S2B) likely
reflects the fact that the diatom DNA was derived from a culture and therefore many copies of
each chromosomal region were available for WGA. In contrast, the MAST-4 SCG data were
derived from a single copy of the template DNA and some genome regions were apparently
poorly sampled by MDA14, 33 and missing from the final assembly. Consistent with this
hypothesis, recent work with the highly reduced genome (1.6 Mbp) from the prokaryote
endosymbiont Bartonella australis has demonstrated that the MDA procedure is significantly
impacted by template DNA concentration34. These authors found that the level of MDA
amplification bias was dependent on the quantity of template DNA, with greater amounts of
starting material resulting in higher quality genome assemblies. Given these observations,
pooling DNA from multiple cells derived from a single population of protists may result in better
coverage of the target genome. In this case, however it would be critical to ascertain whether any
of the single cells contain significant foreign DNA (e.g., prey bacteria, viruses) that could
substantially weaken the combined cell assembly.
The hypothesis that data fragmentation and low coverage, rather than complete absence
may provide an explanation for the low number of CEGMA proteins recovered from the MAST-
Page 9
9
4 data is impossible to address without a reference genome from this currently uncultivated
lineage. However, consistent with this assertion is the finding that in comparison to the three T.
pseudonana MDA samples that had significant representation of CEGMA proteins, the MAST-4
results provided similar assembly statistics and had a better average scaffold length (T.
pseudonana Sample A=1,176 bp, Sample B=1,795 bp, Sample C=1,875 bp, MAST-4=3,671 bp)
suggesting these data are of comparable quality. We nonetheless recognize, as others have
reported with prokaryotic MDA data35, 36, that WGA methods do not provide complete coverage
of a genome. Therefore missing data clearly contributes to the results of the CEGMA analysis
with the MAST-4 cell. Genome reduction in the MAST-4 lineage may also play a role in
explaining the CEGMA results. Gene loss is a common feature of many small-sized, mesophilic
eukaryotes (e.g., Ostreococcus tauri, 12.6 Mbp37; Porphyridium purpureum, 19.7 Mbp9) and the
heterotrophic MAST-4 cell is unlikely to be as gene-rich as a photosynthetic diatom.
Analysis of MAST-4 and diatom predicted proteins using KEGG. To gain preliminary
insights into the functions encoded by MAST-4 predicted proteins, we mapped these sequences
to the Kyoto Encyclopedia of Genes and Genomes (KEGG) categories. Given the incomplete
assembly, we assumed in the KEGG analysis that missing proteins are randomly distributed
across pathways. Therefore if a particular pathway is present in the MAST-4 cell, then it would
be partially filled and if a pathway is absent in the KEGG analysis, then there is no reason to
expect that this reflects an assembly artifact, but rather indicates true absence. Given this
hypothesis, the KEGG analysis (Supplemental Fig. S3) demonstrates that many conserved
pathways are present (e.g., TCA cycle), whereas others such as the urea cycle and photosynthesis
are absent and presumably do not exist in the MAST-4 cell. For example, unlike the diatom no
light harvesting chlorophyll complex proteins are present in the MAST-4 cell, as are missing
Page 10
10
nuclear encoded photosystem II precursors such as psbO and psbM. Genes present in MAST-4
that are missing in the diatom include a member of glycosyltransferase family 29 involved in
galactose metabolism (protein 230; EC:3.2.1.23) and several enzymes involved in amino acid
and nucleotide metabolism (Supplementary Fig. S3). Analysis of proteins involved in protein
synthesis [e.g., ribosomal proteins, aminoacyl-tRNA biosynthesis (Supplementary Fig. S4)] and
metabolic functions [e.g., purine metabolism, fatty acid metabolism (Supplementary Fig. S5)]
shows that the majority of these pathway components are present in MAST-4.
Inference of the ToL. Phylogenomic analysis of individual MAST-4 proteins demonstrated the
expected sister-group relationship to stramenopiles (e.g., diatoms and oomycetes) and minimal
evidence of contaminating DNA (i.e., 94.8% of the trees summarized in Supplementary Fig. S6
show a eukaryotic affiliation for MAST-4 proteins). To test the usefulness of these data for
inferring the eukaryotic ToL, we generated a concatenated alignment from a broad collection of
completed genomes that incorporated the 458 CEGMA proteins (i.e., with some missing data
from MAST-4 and other taxa). This alignment had a length of 25,145 amino acids and maximum
likelihood analysis shows 100% RAxML bootstrap support for the phylogenetic affiliation of
MAST-4 with other stramenopiles in a tree that provides robust bootstrap support for many other
nodes (Fig. 2 and Supplementary Fig. S7). RAxML analysis of a reduced dataset of 159 CEGMA
core eukaryote proteins (12,627 amino acids) that were complete in the MAST-4 assembly
provided similar results (Fig. 2). Although the phylogenetic position of the MAST-4 lineage is
well known based on rDNA comparisons (e.g., Fig. 1), the multi-gene analysis demonstrates the
utility of SCG data for inferring the phylogenetic position of other uncultured eukaryotes that
may be of unknown or uncertain affiliation. The phylogenomic output shows that a strong signal
also exists for foreign gene acquisition in MAST-4 that conflict with the topology of the
Page 11
11
CEGMA-based tree. These latter data reflect the expected HGT contribution to protist genomes5-
9, but also may derive from alga-derived EGT that persists in MAST-4, potentially reflecting a
photosynthetic past for this lineage38, 39.
Using a protein coverage cut-off of ≥ 70% of the reference sequence in the database, 97
and 119 trees showed a sister group relationship between MAST-4 and green and red algal
proteins, respectively (Supplementary Fig. S6). Two of these trees that incorporate GOS data are
shown in Figure S8. Here a putative ion transporter protein (Supplementary Fig. S8A) is shared
with and potentially derived from red algae in the MAST-4 cell as well as in photosynthetic
haptophytes, rhizarians, and the diatom Fragliariopsis cylindrus. Another example is a putative
glutathione S-transferase protein (Supplementary Fig. S8B) shared with cyanobacteria,
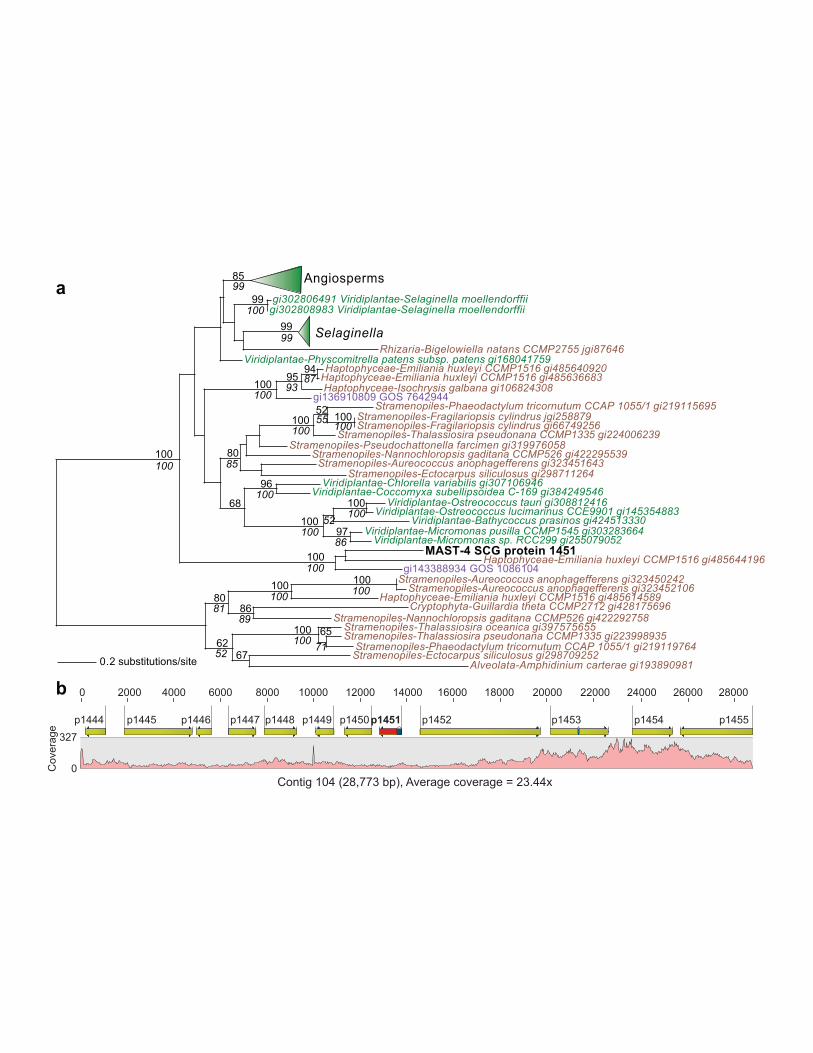
stramenopiles, and rhizarians. More intriguing is the violaxanthin de-epoxidase (VDE) tree (Fig.
3a), in which all other taxa are photosynthetic eukaryotes. In algae and plants, plastid thylakoid
localized VDE catalyzes the conversion of violaxanthin to zeaxanthin in the photo-protective
xanthophyll cycle. The Mast-4 VDE-like protein appears to be green alga-derived, but in the
non-photosynthetic stramenopile may function as a lipocalin, the broad functional group that
gave rise to VDE40. This predicted protein 1451 lacks an N-terminal extension and its position in
the genome contig suggests it is not the result of an assembly artifact or contamination (Fig. 3b);
i.e., co-localized proteins in the contig [e.g., proteins 1447, 1448, and 1453 (Supplementary Fig.
S9)] are of stramenopile or eukaryotic affiliation. Two other examples of putative algal-derived
EGTs (a serine/threonine kinase domain containing protein and a myosin/kinesin motor domain,
both shared with green algae) are shown in Supplementary Fig. S10.
Discussion
Page 12
12
SCG is a rapidly developing field in medical and environmental science. In the latter area,
virtually all work done until now has focused on prokaryotic taxa33 that have smaller, less
complex genomes than eukaryotes. These microbes are more amenable to genome assembly
when using MDA-derived sequence data. The initial work on marine protist SCG showed
complex biotic interactions for taxa (e.g., presence of prey and pathogen DNA in the MDA
sample13-15) that precluded a robust assembly of the host nuclear genome. Here we show that if a
MDA sample derived from the natural environment is largely free of contaminating DNA, that it
is possible to generate a useful, partial draft assembly from the cell. Applications of these SCG
data include generating a gene inventory for the uncultivated taxon to study metabolic pathways
and placing it in the ToL using multigene phylogenetics. With regard to inferring the ToL, our
results demonstrate that the CEGMA proteins are well suited for this purpose even in the face of
significant HGT in marine microbes. Regardless of how the MAST-4 trees are interpreted with
respect to direction of gene transfer or the role of phylogenetic artifacts in explaining some of the
topologies39, our data make it clear that the MAST-4 genome contains divergent phylogenetic
histories. One of these histories (i.e., the CEGMA data) follows the expected trajectory of
vertical inheritance, whereas the second involves a reticulate history of foreign gene sharing.
This latter feature is typical of many photosynthetic algae (e.g., in Fig. 3a, Bigelowiella natans,
Guillardia theta5, 6, 9) and as shown here characterizes the genome of a widely distributed plastid-
lacking plankton.
In the future, generation of protist (particularly picoeukaryotic) marine metagenome data
will potentially enable mapping of eukaryote-derived SCG proteins directly to natural
environments. These data should provide the opportunity to elucidate the connection between the
complex history of gene sharing via E/HGT and the global distribution of microbial eukaryotes5-
Page 13
13
7, 9, 40-42. Ultimately, it should be possible to map the global network of taxon-associated genes
and gene families and to correlate these data to their evolutionary histories.
Methods
Cell collection and DNA preparation. A 500 mL sample of estuarine water was collected at
low tide from the Pettaquamscutt River, Narragansett, Rhode Island, USA (41° 26’ 57.32” N 71°
26’ 59.49” W) on September 16th, 2009. The sample was kept in the dark and low temperature
(-4°C) until processing, which was ≤ 6 hours thereafter at the Single Cell Genomics Center at the
Bigelow Laboratory for Ocean Sciences, ME, USA. Environmental samples were pre-screened
through a 70 μm mesh-size strainer (Becton Dickinson). A 3 mL subsample was incubated with
the Lysotracker Green DND-26 (75 nmol L-1; Invitrogen) for 10 min in order to stain protist
food vacuoles using pH-sensitive green fluorescence43. Target cells were identified and sorted
using a MoFloTM (Beckman-Coulter) flow cytometer equipped with a 488 nm laser for
excitation. Prior to target cell sorting, the cytometer was cleaned thoroughly with bleach. A 1%
NaCl solution (0.2 µm filtered and UV treated) was used as sheath fluid44. Heterotrophic protist
identification, single cell isolation, and total DNA amplifications were carried out as described
by Yoon and co-authors14. Two criteria were used for the heterotrophic cell sorting, the presence
of Lysotracker fluorescence and <10 µm cell diameter. Cells were deposited into a 384-well PCR
plate containing 0.6 mL of 1X TE buffer, centrifuged briefly and stored -80° C until further
processing (plate no. AB108). Cells frozen in TE buffer were exposed to cold KOH for cell lysis
and DNA denaturation45. Cell lysate genomic DNA was amplified using multiple displacement
amplification (MDA46). The single cell amplified genomes were diluted 100-fold in sterile TE
buffer, then screened by PCR and sequencing of conserved 18S rDNA. All sample 18S rDNA
Page 14
14
sequences were compared against RefSeq (http://www.ncbi.nih.nlm.gov/refseq) and their
phylogenetic positions inferred based on a maximum likelihood tree with 100 bootstrap
replications (RAxML Version 7.2.830). One MDA sample, AB108-RIc103, was identified as a
member of the uncultured MAST-4 stramenopiles (Fig. 1). This sample was re-amplified using
the REPLI-g Midi Kit (Qiagen) to generate sufficient DNA for downstream uses, following the
manufacturer’s instructions. The second MDA reaction was treated with the QIAqick PCR
purification Kit (Qiagen). The MAST-4 library was prepared using the Nextera DNA sample
prep kit (Illumina) according to the manufacturer’s instructions using 50 ng of input DNA.
Because the fragmentation was transposon-mediated, the average fragment size spanned the
range 200-500 bp. Sequencing utilized the 500-cycle MiSeq Reagent Kit V2 (Illumina) in a
2x250 bp paired-end run.
For the diatom (T. pseudonana) sample, DNA was extracted from the algal culture using
the Qiagen DNeasy Plant kit following the manufacturer’s protocol. Three separate MDA
reactions were done using the REPLI-g kit (Qiagen) according to the manufacturer’s protocol
starting with 50 ng of input diatom DNA in each reaction. Three sequencing libraries were
prepared using the Nextera DNA Sample prep kit v2 and sequenced as described above. The
three T. pseudonana libraries were multiplexed on one MiSeq sequencing run.
Single cell genome assembly. MDA to facilitate whole genome amplification (WGA) generates
sufficient DNA from single cells for next generation sequencing [the recently described
MALBAC47 procedure offers another promising approach]. MDA may however produce
significant coverage bias, resulting in fragmented and incomplete assemblies35, 36, 48. Therefore,
although it is clear that SCG may not provide complete genome assemblies, the challenge
nonetheless is to maximize the quantity and quality of the data from uncultured taxa. Given these
Page 15
15
constraints, we applied a specialized assembler to the SCG data. Here SPAdes 2.425 was used
because it demonstrates high performance when assembling bacterial single cell libraries
(http://bioinf.spbau.ru/spades/). Initial assembly of the read library with default settings
demonstrated that despite the maximum read length of 250 bp the median insert size was only
130 bp (with a standard deviation of 65 bp). In addition, the distribution of the library insert sizes
varied widely and a significant amount of paired-end reads were of length 100-150 bp or shorter;
many of the reads overlapped by 100-200 bp. In an attempt to improve the original data quality,
we removed reads shorter than 150 bp in length, which increased the median insert size up to 200
bp but the resulting assembly was very fragmented due to loss of coverage. The unique iterative
mode in SPAdes was used to recover the usable insert length and to preserve as much coverage
as possible. The program was run using k-mer lengths of 21, 33, 55, 85, 95, and 127 in ‘careful’
mode. Using this approach, shorter k-mer lengths allowed us to keep the coverage, whereas
longer k-mers exploited the usable part of insert size distribution to provide proper repeat
resolution. Gene prediction began with derivation of 159 core eukaryote genes (CEGs) from our
MAST-4 SCG assembly via CEGMA26. CEGMA is a computational method for building a
highly reliable set of gene annotations in the absence of experimental (e.g., transcriptome) data.
This approach relies on a defined a set of conserved protein families that occur in a wide range of
eukaryotes and presents a mapping procedure that accurately identifies their exon-intron
structures in a novel genome. This results in an initial set of reliable gene annotations in
potentially any eukaryotic genome, even those in the draft stage. The CEGMA gene structures
were then used to train the Augustus27 gene predictor prior to execution on the full genome
assembly. Note that CEGMA only predicts genes for which a full-length homolog is found.
Therefore, the fragmented nature of our assembly may have been the major reason for detecting
Page 16
16
only 159 (35%) of the core proteins. Interestingly, the set of proteins predicted by Augustus
contained 243 CEGs (53%) with at least 60% BLASTP length similarity to a known Arabidopsis
thaliana CEG.
KEGG ontology terms for the predicted MAST-4 proteins and for the known T.
pseudonana proteome were obtained using the Automatic Annotation Server
(http://www.genome.jp/tools/kaas/) with a (single/bidirectional) best hits method against the
ortholog database. These terms were then used in the KEGG Mapper Pathway Reconstruction
tool (http://www.genome.jp/kegg/tool/map_pathway.html) to annotate representative pathways.
Over-assembly of SCG data. As expected with MDA-derived genome data, we found a
considerable fraction of over-assembly of diatom reads when compared to the T. pseudonana
reference genome. The assemblies were larger than the reference genome (32.61 Mbp) by 38%,
25%, and 35%, respectively for the three independent MDA samples and 47% for the combined
data. It should however be noted that SCG assemblers such as IDBA-UD49 and SPAdes 2.425
were tested and optimized for bacterial datasets and there exists no dedicated SCG for larger,
more complex eukaryotic genomes. Therefore, it was not our expectation that a perfect or near-
perfect assembly would result from either the reference diatom or the MAST-4 genome. As a
consequence, the set of predicted proteins we generated is also incomplete.
Phylogenomics. Phylogenomic analysis was performed as described previously5, 9, 50. Briefly, the
MAST-4 predicted proteins were used in a BLASTP query against an in-house peptide database
consisting of ca. 16.9 million sequences derived from RefSeq v.51 with the addition of
sequenced eukaryote (e.g., Fungi, Metazoa, Viridiplantae, and stramenopiles) taxa from the Joint
Genome Institute (http://www.jgi.doe.gov) and 6-frame translated eukaryote EST sequences
retrieved from NCBI dbEST (http://www.ncbi.nlm.nih.gov/dbEST). A taxonomically diverse set
Page 17
17
of target peptides were selected, aligned via MAFFT v641, and used for phylogenetic
reconstruction under the PROTGAMMALG evolutionary model of RAxML v.7.2.83051. The
resulting trees were sorted for patterns of monophyly using PhyloSort52. A multi-protein
alignment of length 25,143 amino acids was produced by sampling our in-house database for
homologs to the 458 CEGs. Each individual CEG family was aligned with its MAST-4 peptide
homolog via MUSCLE53, and Gblocks54 was used to extract conserved sites from the alignment
prior to concatenation and phylogenetic inference with RAxML (100 bootstraps,
PROTGAMMALG model).
Author contributions
E.C.Y. and H.S.Y. collected and prepared the single cell DNA that was processed at the Single
Cell Genomics Center at the Bigelow Laboratory, ME, USA. G.C. was in charge of Illumina
library preparation, single cell sequencing on the MiSeq instrument, and was involved in helping
to design the downstream bioinformatic analyses. D.C.P. processed the data and aided in genome
assembly, gene prediction, and phylogenomics. R.S.R. and A.K. generated the final genome
assembly and gene models and R.S.R. did the phylogenomic analyses. D.B. generated the
phylogenetic trees presented in the text. D.B., A.S. and R.S.R. designed the study. R.S.R., D.B.,
and D.C.P. wrote the paper. All authors discussed the results and commented on the manuscript.
Acknowledgements
We thank members of the D.B. lab for helpful discussions, Kay Bidle for providing the diatom
DNA, and the School of Environmental and Biological Sciences and members of the Genome
Cooperative at Rutgers for supporting this research. D.B. and H.S.Y. lab members are funded by
the National Science Foundation and H.S.Y. is funded by a Korean RDA grant.
Competing financial interests: The authors declare no competing financial interests.
Page 18
18
Accession codes: The sequence data used to assemble the draft stramenopile MAST-4 single cell
genome are archived at the NCBI Sequence Read Archive (SRA) under Accession
SRPXXXXXX. The assembled genome, gene models, gene annotations, phylogenomic output,
multigene alignments, and other material are available at http://cyanophora.rutgers.edu/MAST4/.
References
1. Parfrey, L. W. et al. Broadly sampled multigene analyses yield a well-resolved eukaryotic
tree of life. Syst. Biol. 59, 518-533 (2010).
2. Pawlowski, J. et al. CBOL protist working group: barcoding eukaryotic richness beyond the
animal, plant, and fungal kingdoms. PLoS Biol. 10, e1001419 (2012).
3. Guiry, M. D. How many species of algae are there? J. Phycol. 48, 1057–1063, (2012).
4. Boo, S. M. et al. Complex phylogeographic patterns in the freshwater alga Synura provide
new insights on ubiquity versus endemism in microbial eukaryotes. Mol. Ecol. 19, 4328-4338
(2010).
5. Moustafa, A. et al. Genomic footprints of a cryptic plastid endosymbiosis in diatoms. Science
324, 1724-1726 (2009).
6. Curtis, B. A. et al. Cryptophyte and chlorarachniophyte nuclear genomes reveal evolutionary
mosaicism and the fate of nucleomorphs. Nature 492, 59-65 (2012).
7. Keeling, P. J. & Palmer, J. D. Horizontal gene transfer in eukaryotic evolution. Nat. Rev.
Genet. 9, 605-618 (2008).
8. Chan, C. X. et al. Analysis of dinoflagellate genes reveals the remarkably complex
evolutionary history of a microbial eukaryote. J. Phycol. 48, 1130-1142 (2012).
9. Bhattacharya, D. et al. Genome of the red alga Porphyridium purpureum. Nat. Commun. 4,
Page 19
19
1941 (2013).
10. Behnke, A. et al. Depicting more accurate pictures of protistan community complexity using
pyrosequencing of hypervariable SSU rRNA gene regions. Environ. Microbiol. 13, 340–349
(2011).
11. Cuvelier, M. L. et al. Targeted metagenomics and ecology of globally important uncultured
eukaryotic phytoplankton. Proc. Natl. Acad. Sci. U.S.A. 107, 14679-14684 (2010).
12. Lepere, C. et al. Whole-genome amplification (WGA) of marine photosynthetic eukaryote
populations. FEMS Microbiol. Ecol. 76, 513-523 (2011).
13. Worden, A. Z., Dupont, C. & Allen, A. E. Genomes of uncultured eukaryotes: sorting FACS
from fiction. Genome Biol. 12, 117 (2011).
14. Yoon, H. S. et al. Single-cell genomics reveals organismal interactions in uncultivated
marine protists. Science 332, 714-717 (2011).
15. Bhattacharya, D. et al. Single cell genome analysis supports a link between phagotrophy and
primary plastid endosymbiosis. Sci. Rep. 2, 356 (2012).
16. Stepanauskas, R. Single cell genomics: an individual look at microbes. Curr. Opin.
Microbiol. 15, 613-620 (2012).
17. Vaulot, D. et al. Metagenomes of the picoalga Bathycoccus from the Chile coastal upwelling.
PLoS One 7, e39648 (2012).
18. Massana, R. et al. Phylogenetic and ecological analysis of novel marine stramenopiles. Appl.
Environ. Microbiol. 70, 3528–3534 (2004).
19. Rodríguez-Martínez, R., Rocap, G., Logares, R, Romac, S. & Massana, R. Low evolutionary
diversification in a widespread and abundant uncultured protist (MAST-4). Mol. Biol. Evol.
29, 1393-1406 (2012).
Page 20
20
20. Logares, R. et al. Diversity patterns and activity of uncultured marine heterotrophic
flagellates unveiled with pyrosequencing. ISME J. 6, 1823-1833 (2012).
21. Anderson, R., Wylezich, C., Glaubitz, S., Labrenz, M. & Jürgens, K. Impact of protist
grazing on a key bacterial group for biogeochemical cycling in Baltic Sea pelagic
oxic/anoxic interfaces. Environ. Microbiol. 15, 1580-1594 (2013).
22. Massana, R., Terrado, R., Forn, I., Lovejoy, C. & Pedrós-Alió, C. Distribution and
abundance of uncultured heterotrophic flagellates in the world oceans. Environ. Microbiol. 8,
1515-1522 (2006).
23. Massana, R. et al. Phylogenetic and ecological analysis of novel marine stramenopiles. Appl.
Environ. Microbiol. 70, 3528-3534 (2004).
24. Lin, Y. C. et al. Distribution patterns and phylogeny of marine stramenopiles in the North
Pacific Ocean. Appl. Environ. Microbiol. 78, 3387-3399 (2012).
25. Bankevich, A. et al. SPAdes: a new genome assembly algorithm and its applications to
single-cell sequencing. J. Comput. Biol. 19, 455-477 (2012).
26. Parra, G., Bradnam, K. & Korf, I. CEGMA: a pipeline to accurately annotate core genes in
eukaryotic genomes. Bioinformatics 23, 1061-1067 (2007).
27. Stanke, M. & Morgenstern, B. Augustus: a web server for gene prediction in eukaryotes that
allows user-defined constraints. Nucleic Acids Res. 33, W465-W467 (2005).
28. Bhattacharya, D. et al. Identification of a marine cyanophage in a protist single cell
metagenome assembly. J. Phycol. 49, 207-212 (2013).
29. Qiu, H. et al. Adaptation through horizontal gene transfer in the cryptoendolithic red alga
Galdieria phlegrea. Curr. Biol. 23, R865-R866 (2013).
Page 21
21
30. Hackett, J. D. et al. Phylogenomic analysis supports the monophyly of cryptophytes and
haptophytes and the association of rhizaria with chromalveolates. Mol. Biol. Evol. 24, 1702-
1713 (2007).
31. Burki, F., Okamoto, N., Pombert, J. F. & Keeling, P. J. The evolutionary history of
haptophytes and cryptophytes: phylogenomic evidence for separate origins. Proc. Biol. Sci.
279, 2246-2254 (2012).
32. Armbrust, E. V. et al. The genome of the diatom Thalassiosira pseudonana: ecology,
evolution, and metabolism. Science 306, 79-86 (2004).
33. Lloyd, K. G. et al. Predominant archaea in marine sediments degrade detrital proteins.
Nature 496, 215-218 (2013).
34. Ellegaard, K. M., Klasson, L. & Andersson, S. G. Testing the reproducibility of multiple
displacement amplification on genomes of clonal endosymbiont populations. PLoS One 8,
e82319 (2013).
35. Rodrigue, S. et al. Whole genome amplification and de novo assembly of single bacterial
cells. PLoS One 4, e6864 (2009).
36. Chitsaz, H. et al. Efficient de novo assembly of single-cell bacterial genomes from short-read
data sets. Nat. Biotechnol. 29, 915–921 (2011).
37. Palenik, B. et al. The tiny eukaryote Ostreococcus provides genomic insights into the
paradox of plankton speciation. Proc. Natl. Acad. Sci. U.S.A. 104, 7705-7710 (2007).
38. Tyler, B. M. et al. Phytophthora genome sequences uncover evolutionary origins and
mechanisms of pathogenesis. Science 313, 1261-1266 (2006).
Page 22
22
39. Stiller, J. W., Huang, J., Ding, Q., Tian, J. & Goodwillie, C. Are algal genes in
nonphotosynthetic protists evidence of historical plastid endosymbioses? BMC Genomics 10,
484 (2009).
40. Frommolt, R. et al. Ancient recruitment by chromists of green algal genes encoding enzymes
for carotenoid biosynthesis. Mol. Biol. Evol. 25, 2653-2567 (2008).
41. Archibald, J. M. et al. Lateral gene transfer and the evolution of plastid-targeted proteins in
the secondary plastid-containing alga Bigelowiella natans. Proc. Natl. Acad. Sci. U.S.A. 100,
7678-7683 (2003).
42. Andersson, J. O. Gene transfer and diversification of microbial eukaryotes. Annu. Rev.
Microbiol. 63, 177-93 (2009).
43. Rose, J. M., Caron, D. A., Sieracki, M. E. & Poulton, N. Counting heterotrophic
nanoplanktonic protists in cultures and aquatic communities by flow cytometry. Aquat.
Microbial Ecol. 34, 263–277 (2004).
44. Stepanauskas, R. & Sieracki, M. E. Matching phylogeny and metabolism in the uncultured
marine bacteria, one cell at a time. Proc. Natl. Acad. Sci. U.S.A. 104, 9052-9057 (2007).
45. Raghunathan, A. et al. Genomic DNA amplification from a single bacterium. Appl. Environ.
Microbiol. 71, 3342-3347 (2005).
46. Dean, F. B. et al. Comprehensive human genome amplification using multiple displacement
amplification. Proc. Natl. Acad. Sci. U.S.A. 99, 5261-5266 (2002).
47. Zong, C., Lu, S., Chapman, A. R. & Xie, X. S. Genome-wide detection of single-nucleotide
and copy-number variations of a single human cell. Science 338, 1622-1626 (2012).
48. Woyke, T. et al. Assembling the marine metagenome, one cell at a time. PLoS One 4, e5299
(2009).
Page 23
23
49. Peng, Y., et al. IDBA-UD: a de novo assembler for single-cell and metagenomic sequencing
data with highly uneven depth. Bioinformatics 28, 1420-1428 (2012).
50. Price, D. C. et al. Cyanophora paradoxa genome elucidates origin of photosynthesis in algae
and plants. Science 335, 843-847 (2012).
51. Stamatakis, A. RAxML-VI-HPC: maximum likelihood-based phylogenetic analyses with
thousands of taxa and mixed models. Bioinformatics 22, 2688-2690 (2006).
52. Moustafa, A. & Bhattacharya, D. PhyloSort: a user-friendly phylogenetic sorting tool and its
application to estimating the cyanobacterial contribution to the nuclear genome of
Chlamydomonas. BMC Evol. Biol. 8, 6 (2008).
53. Edgar, R. C. MUSCLE: multiple sequence alignment with high accuracy and high
throughput. Nucleic Acids Res. 32, 1792-1797 (2004).
54. Talavera, G. & Castresana, J. Improvement of phylogenies after removing divergent and
ambiguously aligned blocks from protein sequence alignments. Syst. Biol. 56, 564-577
(2007).
Page 24
24
Figure legends
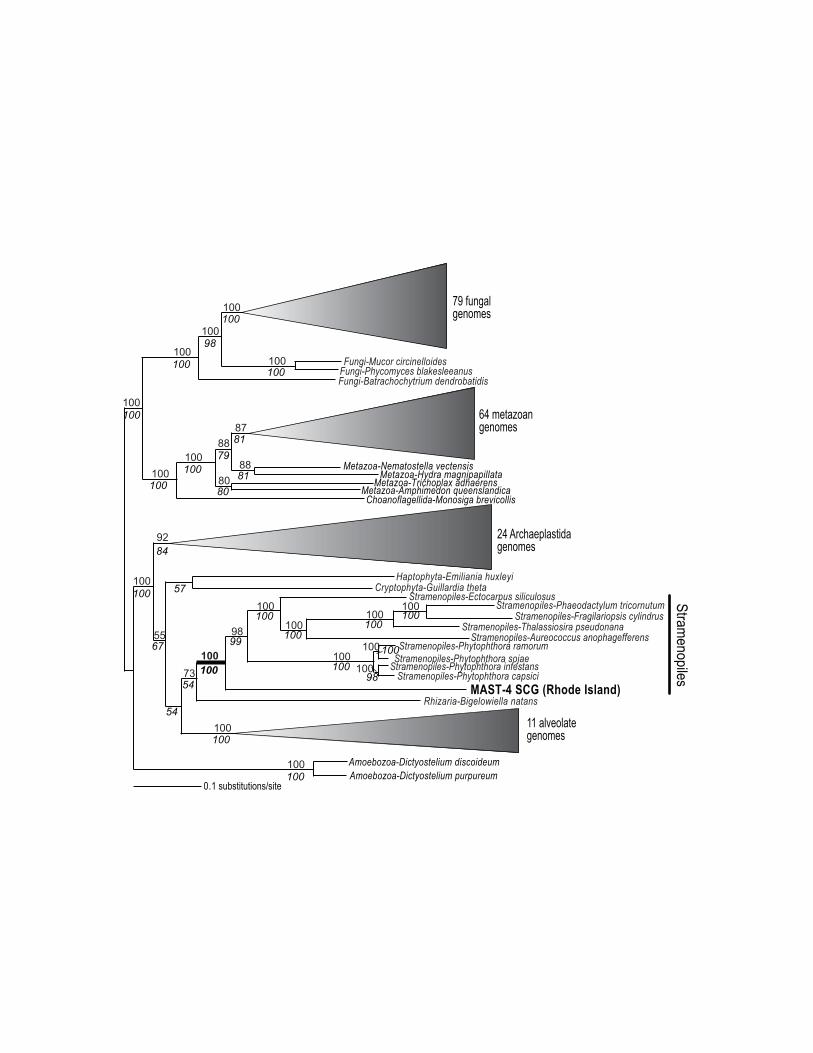
Figure 1 | Analysis of protist SCG data. Phylogenetic position of the Rhode Island MAST-4
single cell isolate used for genome sequencing. NCBI “gi” numbers are shown for each rDNA
sequence. Known members of the MAST-4 clade24 are shown in red text. Bootstrap values
shown above and below the branches are from RAxML and PhyML (in Italic text) analyses,
respectively, using 1,000 iterations and the GTRGAMMA model of sequence evolution.
Figure 2 | Analysis of proteins derived from MAST-4 SCG data. Phylogenetic tree inferred
from the concatenated alignment of the core 458 CEGMA proteins with the results of 100
bootstrap replicates (when ≥ 50%) shown at the branches. The numbers in Italics below the
branches derive from a RAxML bootstrap analysis using a subset of 159 CEGMA proteins that
were full-length in the MAST-4 SCG assembly. The complete tree is shown in Supplementary
Fig. S7.
Figure 3 | Phylogeny of MAST-4 proteins. (a) RAxML tree of violaxanthin de-epoxidase
(VDE). The results of 100 RAxML and PhyML bootstrap replicates (when ≥ 50%) are above and
below the branches, respectively, and “gi” numbers are shown for taxa. (b) Coverage map and
gene predictions for contig 104 in the MAST-4 SCG assembly that encodes the alga-derived
VDE shown above.
Supplementary Information accompanies this paper on
http://www.nature.com/naturecommunications
Reprints and permission information is available online at
http://npg.nature.com/reprintsandpermissions/
Page 25
25
Table 1. Assembly statistics for the MDA samples from the MAST-4 cell and for the three
(A, B, C) T. pseudonana samples
Dataset Total data
(Gbp)
Assembly
Size (Mbp)
Scaffold length
(Mbp) with ≥90%
alignment to
reference genome
No of
Scaffolds
N50
(Kbp)
Maximum
Scaffold
Length
(Kb)
MAST-4 6.61 17 N/A 4611 14 111
A 1.30 45 33.80 38245 7 101
B 0.98 41 21.43 22838 25 204
C 1.18 44 25.79 23466 17 168
Combined 3.46 48 28.48 27397 16 201
The scaffold length alignment was not done for the MAST-4 cell because of the lack of a
reference genome.
Page 26
26
Table 2. Protein prediction results for the three (A, B, C) diatom MDA samples
Dataset Number of
predicted
proteins
Reference
proteins with
≥70% alignment
Number of
complete core
proteins found
Proteins with ≥60%
alignment to A. thaliana
core proteins
A 13523 7500 373 398
B 13022 7658 397 421
C 14933 8060 397 432
Combined 16439 8341 398 421
Reference 9413 8644 396 413