REPORT ◥ SINGLE-CELL GENOMICS Single-cell whole-genome analyses by Linear Amplification via Transposon Insertion (LIANTI) Chongyi Chen, 1 * Dong Xing, 1 * Longzhi Tan, 1 * Heng Li, 2 * Guangyu Zhou, 1 Lei Huang, 1,3,4 X. Sunney Xie 1,3,4 † Single-cell genomics is important for biology and medicine. However, current whole-genome amplification (WGA) methods are limited by low accuracy of copy-number variation (CNV) detection and low amplification fidelity. Here we report an improved single-cell WGA method, Linear Amplification via Transposon Insertion (LIANTI), which outperforms existing methods, enabling micro-CNV detection with kilobase resolution. This allowed direct observation of stochastic firing of DNA replication origins, which differs from cell to cell. We also show that the predominant cytosine-to-thymine mutations observed in single-cell genomics often arise from the artifact of cytosine deamination upon cell lysis. However, identifying single- nucleotide variations (SNVs) can be accomplished by sequencing kindred cells.We determined the spectrum of SNVs in a single human cell after ultraviolet radiation, revealing their nonrandom genome-wide distribution. R apid advances in DNA sequencing have led to a wealth of knowledge about ge- nomes of various species, including humans, most of which have been derived from bulk measurements from a large number of cells. However, a single cell has a unique genome even within an individual human being. For example, each germ cell is distinct, carrying different com- binations of paternal and maternal genes. Somatic cells have spontaneous genomic changes that take place stochastically in time and genomic position. These include single-nucleotide variations (SNVs), copy-number variations (CNVs), and structural var- iations. Such genomic changes can lead to cancer and other diseases. As such, characterization of single-cell genomes has attracted increasing at- tention in recent years (1, 2). The importance of single-cell genomics becomes more apparent in the case of highly valued and rare samples, such as embryonic cells and circulating tumor cells (3, 4), or when probing stochastic changes and cell-to- cell heterogeneity (5–9). Because of the trace amount of genomic DNA in a cell, single-cell genome sequencing has relied on whole-genome amplification (WGA). Among pre- vious WGA methods, degenerate oligonucleotide– primed polymerase chain reaction (DOP-PCR) is an exponential PCR reaction with degenerate priming (10). Multiple-displacement amplification (MDA) uses a strand-displacing DNA polymerase to expo- nentially amplify single-stranded DNA into a hyper- branched structure (11, 12). Multiple annealing and looping-based amplification cycles (MALBAC) uses quasi-linear amplification through looping- based amplicon protection followed by PCR (5). All these methods involve nonspecific priming and exponential amplification that create amplifica- tion bias and errors. To reduce such bias and errors, we have de- veloped a new WGA method, Linear Amplifica- tion via Transposon Insertion (LIANTI), which combines Tn5 transposition (13) and T7 in vitro transcription (14) for single-cell genomic analyses. Random fragmentation and tagging of genomic DNA by Tn5 transposition has been used to prepare DNA sequencing libraries by introducing priming sites for PCR amplification (15). However, such exponential amplification is associated with amplification bias and errors, limiting its appli- cations in single-cell genomics (16, 17). Here we demonstrate linear amplification, whose advan- tage over exponential amplification is illustrated in Fig. 1A. In LIANTI, genomic DNA from a single cell is randomly fragmented by Tn5 transposition of a specially designed LIANTI transposon that in- cludes a T7 promoter (Fig. 1B). Genomic DNA fragments tagged by T7 promoters are linearly amplified into thousands of copies of RNAs through in vitro transcription, followed by re- verse transcription and second-strand synthesis into double-stranded LIANTI amplicons ready for DNA library preparation (Fig. 1C). LIANTI eliminates nonspecific priming and exponential amplification used in other single-cell WGA meth- ods, greatly reducing amplification bias and errors. We used LIANTI to amplify genomic DNA from single BJ cells, a human diploid cell line from skin fibroblasts chosen for no aneuploidy. Single-cell genomic DNA was randomly frag- mented by Tn5 transposition to give an average fragment size of ~400 base pairs (bp) (figs. S1, A and B, and S2, A and B). After overnight in vitro transcription, we routinely acquired ~20 ng of LIANTI amplicons for DNA library preparation. We sequenced BJ cells at ~30× depth and per- formed a systematic comparison between LIANTI and previous WGA methods [data from ( 1 )]. LIANTI achieves 97% genome coverage and a 17% allele dropout rate, outperforming other WGA methods (table S1). To evaluate amplification uniformity, we plotted the average read depths in 1-Mb bins across the genome for LIANTI, MDA, MALBAC, and DOP-PCR, together with a zoom-in to a 10-Mb region on chromosome 1 with 10-kb bins (Fig. 1D). On both scales, LIANTI exhibits the highest amplification uniformity compared to the other methods. To better quantify amplifica- tion bias on all scales, we plotted the coefficient of variation (CV) of the read depth along the genome as a function of the bin size (Fig. 1E and fig. S3A), which is more reproducible and informative than power spectra and Lorenz curves (fig. S3B) used previously (see supple- mentary materials). LIANTI achieves the lowest CV values with respect to all bin sizes, offering the highest accuracy for CNV detection. The spatial resolution of CNV detection in a single cell has been limited to ~1 Mb owing to the amplification noise of previous WGA methods. In LIANTI, amplification noise, though much reduced, still exists on account of different am- plification factors for each fragment, preventing accurate detection of micro-CNVs (<100-kb CNVs). To further reduce this noise, instead of relying on read depths, we carried out digital counting of the inferred fragment numbers, as shown in Fig. 2A. This is done by taking advantage of the fact that LIANTI amplicons mapped to the reference genome with the same ends should originate from the same genomic DNA fragment, hence allowing more accurate inference of the fragment numbers at each genomic position. For example, in Fig. 2B, the unamplified bulk (top panel) shows a 2-to- 1 copy-number loss. However, the LIANTI single- cell read-depth raw data (middle panel) obscures this micro-CNV. The inferred fragment number by the digital-counting analysis (bottom panel) better resolved the micro-CNV. Digital counting improves the resolution of micro-CNV detection to ~10 kb. We characterized the false positives and false negatives for micro-CNV detection in a single BJ cell (fig. S4, A and B). Results differ for copy-number gains, 2-to-0 copy-number losses, and 2-to-1 copy-number losses (fig. S4, C and D), none of which were possible by previous WGA methods at this resolution. We took advantage of LIANTI’s capability to detect micro-CNVs to probe DNA replication, an important research area in biology. In particular, RESEARCH Chen et al., Science 356, 189–194 (2017) 14 April 2017 1 of 5 1 Department of Chemistry and Chemical Biology, Harvard University, Cambridge, MA 02138, USA. 2 Broad Institute of Massachusetts Institute of Technology (MIT) and Harvard, Cambridge, MA 02142, USA. 3 Biodynamic Optical Imaging Center (BIOPIC), School of Life Sciences, Peking University, Beijing 100871, China. 4 Beijing Advanced Innovation Center for Genomics (ICG), Peking University, Beijing 100871, China. *These authors contributed equally to this work. †Corresponding author. Email: [email protected]on April 13, 2017 http://science.sciencemag.org/ Downloaded from
Single-cell genomics is important for biology and medicine. However, current whole-genomeamplification (WGA) methods are limited by low accuracy of copy-number variation (CNV)detection and low amplification fidelity. Here we report an improved single-cell WGA method,Linear Amplification via Transposon Insertion (LIANTI), which outperforms existing methods,enabling micro-CNVdetection with kilobase resolution.This allowed direct observationof stochastic firing of DNA replication origins, which differs from cell to cell.We also showthat the predominant cytosine-to-thymine mutations observed in single-cell genomics oftenarise from the artifact of cytosine deamination upon cell lysis. However, identifying single-nucleotide variations (SNVs) can be accomplished by sequencing kindred cells.We determinedthe spectrum of SNVs in a single human cell after ultraviolet radiation, revealing theirnonrandom genome-wide distribution.
Rapid advances in DNA sequencing haveled to a wealth of knowledge about ge-nomesof various species, includinghumans,most of which have been derived from bulkmeasurements from a large number of cells.
However, a single cell has a unique genome evenwithin an individual human being. For example,each germ cell is distinct, carrying different com-binations of paternal andmaternal genes. Somaticcells have spontaneous genomic changes that takeplace stochastically in time and genomic position.These include single-nucleotide variations (SNVs),copy-number variations (CNVs), and structural var-iations. Such genomic changes can lead to cancerand other diseases. As such, characterization ofsingle-cell genomes has attracted increasing at-tention in recent years (1, 2). The importance ofsingle-cell genomics becomes more apparent inthe case of highly valued and rare samples, such asembryonic cells and circulating tumor cells (3, 4),or when probing stochastic changes and cell-to-cell heterogeneity (5–9).Because of the trace amount of genomicDNA in
a cell, single-cell genome sequencing has relied onwhole-genome amplification (WGA). Among pre-viousWGAmethods, degenerate oligonucleotide–primedpolymerase chain reaction (DOP-PCR) is an
exponential PCR reactionwith degenerate priming(10). Multiple-displacement amplification (MDA)uses a strand-displacingDNApolymerase to expo-nentially amplify single-strandedDNAinto ahyper-branched structure (11, 12). Multiple annealingand looping-based amplification cycles (MALBAC)uses quasi-linear amplification through looping-based amplicon protection followed by PCR (5).All thesemethods involve nonspecific priming andexponential amplification that create amplifica-tion bias and errors.To reduce such bias and errors, we have de-
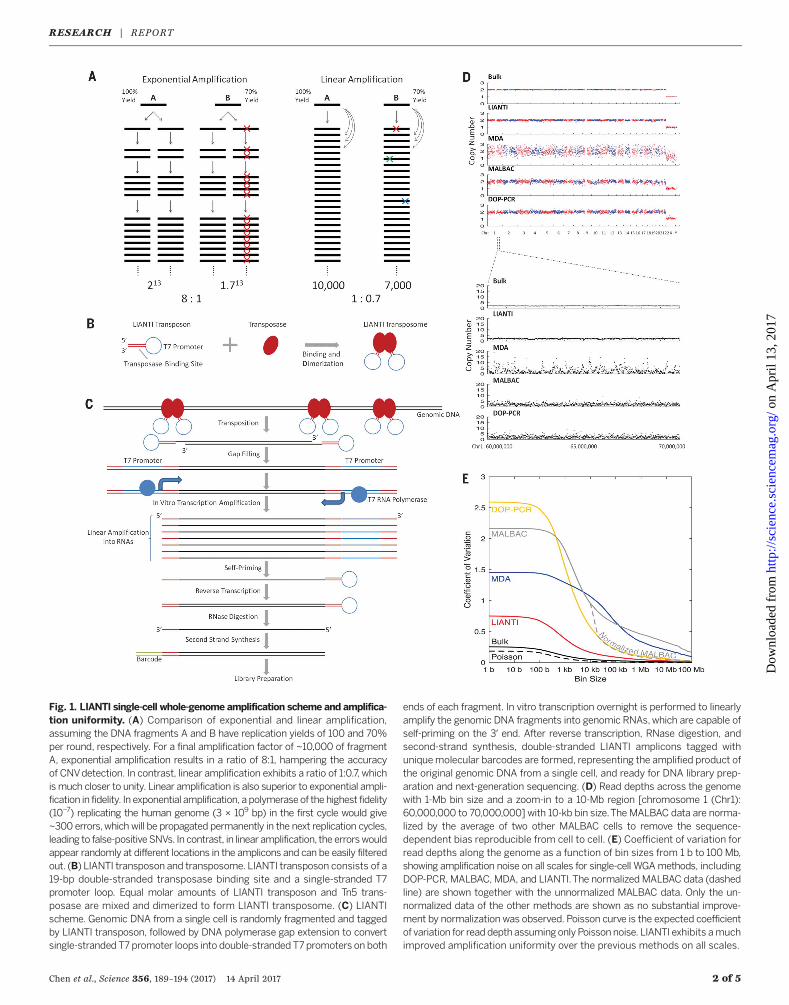
veloped a new WGA method, Linear Amplifica-tion via Transposon Insertion (LIANTI), whichcombines Tn5 transposition (13) and T7 in vitrotranscription (14) for single-cell genomic analyses.Random fragmentation and tagging of genomicDNA by Tn5 transposition has been used toprepare DNA sequencing libraries by introducingpriming sites for PCR amplification (15). However,such exponential amplification is associated withamplification bias and errors, limiting its appli-cations in single-cell genomics (16, 17). Here wedemonstrate linear amplification, whose advan-tage over exponential amplification is illustratedin Fig. 1A.In LIANTI, genomic DNA from a single cell is
randomly fragmented by Tn5 transposition of aspecially designed LIANTI transposon that in-cludes a T7 promoter (Fig. 1B). Genomic DNAfragments tagged by T7 promoters are linearlyamplified into thousands of copies of RNAsthrough in vitro transcription, followed by re-verse transcription and second-strand synthesisinto double-stranded LIANTI amplicons readyfor DNA library preparation (Fig. 1C). LIANTIeliminates nonspecific priming and exponential
amplificationused in other single-cellWGAmeth-ods, greatly reducing amplificationbias and errors.We used LIANTI to amplify genomic DNA
from single BJ cells, a human diploid cell linefrom skin fibroblasts chosen for no aneuploidy.Single-cell genomic DNA was randomly frag-mented by Tn5 transposition to give an averagefragment size of ~400 base pairs (bp) (figs. S1, Aand B, and S2, A and B). After overnight in vitrotranscription, we routinely acquired ~20 ng ofLIANTI amplicons for DNA library preparation.We sequenced BJ cells at ~30× depth and per-formed a systematic comparison between LIANTIandpreviousWGAmethods [data from(1)]. LIANTIachieves 97% genome coverage and a 17% alleledropout rate, outperforming otherWGAmethods(table S1).To evaluate amplification uniformity, we
plotted the average read depths in 1-Mb binsacross the genome for LIANTI, MDA, MALBAC,and DOP-PCR, together with a zoom-in to a10-Mb region on chromosome 1 with 10-kb bins(Fig. 1D). On both scales, LIANTI exhibits thehighest amplification uniformity compared tothe other methods. To better quantify amplifica-tion bias on all scales, we plotted the coefficientof variation (CV) of the read depth along thegenome as a function of the bin size (Fig. 1Eand fig. S3A), which is more reproducible andinformative than power spectra and Lorenzcurves (fig. S3B) used previously (see supple-mentary materials). LIANTI achieves the lowestCV values with respect to all bin sizes, offeringthe highest accuracy for CNV detection.The spatial resolution of CNV detection in a
single cell has been limited to ~1Mb owing to theamplification noise of previous WGA methods.In LIANTI, amplification noise, though muchreduced, still exists on account of different am-plification factors for each fragment, preventingaccurate detection of micro-CNVs (<100-kb CNVs).To further reduce this noise, instead of relying onread depths, we carried out digital counting ofthe inferred fragment numbers, as shown in Fig.2A. This is done by taking advantage of the factthat LIANTI amplicons mapped to the referencegenomewith the same ends should originate fromthe same genomic DNA fragment, hence allowingmore accurate inference of the fragment numbersat each genomic position. For example, in Fig. 2B,the unamplified bulk (top panel) shows a 2-to-1 copy-number loss. However, the LIANTI single-cell read-depth raw data (middle panel) obscuresthis micro-CNV. The inferred fragment numberby the digital-counting analysis (bottom panel)better resolved the micro-CNV. Digital countingimproves the resolution ofmicro-CNV detectionto ~10 kb. We characterized the false positivesand false negatives formicro-CNV detection in asingle BJ cell (fig. S4, A and B). Results differ forcopy-number gains, 2-to-0 copy-number losses,and 2-to-1 copy-number losses (fig. S4, C and D),none of which were possible by previous WGAmethods at this resolution.We took advantage of LIANTI’s capability to
detect micro-CNVs to probe DNA replication, animportant research area in biology. In particular,
RESEARCH
Chen et al., Science 356, 189–194 (2017) 14 April 2017 1 of 5
1Department of Chemistry and Chemical Biology, HarvardUniversity, Cambridge, MA 02138, USA. 2Broad Institute ofMassachusetts Institute of Technology (MIT) and Harvard,Cambridge, MA 02142, USA. 3Biodynamic Optical ImagingCenter (BIOPIC), School of Life Sciences, PekingUniversity, Beijing 100871, China. 4Beijing AdvancedInnovation Center for Genomics (ICG), Peking University,Beijing 100871, China.*These authors contributed equally to this work.†Corresponding author. Email: [email protected]
Chen et al., Science 356, 189–194 (2017) 14 April 2017 2 of 5
Fig. 1. LIANTI single-cell whole-genome amplification scheme and amplifica-tion uniformity. (A) Comparison of exponential and linear amplification,assuming the DNA fragments A and B have replication yields of 100 and 70%per round, respectively. For a final amplification factor of ~10,000 of fragmentA, exponential amplification results in a ratio of 8:1, hampering the accuracyof CNVdetection. In contrast, linear amplification exhibits a ratio of 1:0.7, whichismuch closer to unity. Linear amplification is also superior to exponential ampli-fication in fidelity. In exponential amplification, a polymeraseof the highest fidelity(10−7) replicating the human genome (3 × 10⁹ bp) in the first cycle would give~300 errors,which will be propagated permanently in the next replication cycles,leading to false-positiveSNVs. In contrast, in linear amplification, the errorswouldappear randomly at different locations in the amplicons and can be easily filteredout. (B) LIANTI transposon and transposome. LIANTI transposon consists of a19-bp double-stranded transposase binding site and a single-stranded T7promoter loop. Equal molar amounts of LIANTI transposon and Tn5 trans-posase are mixed and dimerized to form LIANTI transposome. (C) LIANTIscheme. Genomic DNA from a single cell is randomly fragmented and taggedby LIANTI transposon, followed by DNA polymerase gap extension to convertsingle-stranded T7 promoter loops into double-stranded T7 promoters on both
ends of each fragment. In vitro transcription overnight is performed to linearlyamplify the genomic DNA fragments into genomic RNAs,which are capable ofself-priming on the 3′ end. After reverse transcription, RNase digestion, andsecond-strand synthesis, double-stranded LIANTI amplicons tagged withuniquemolecular barcodes are formed, representing the amplified product ofthe original genomic DNA from a single cell, and ready for DNA library prep-aration and next-generation sequencing. (D) Read depths across the genomewith 1-Mb bin size and a zoom-in to a 10-Mb region [chromosome 1 (Chr1):60,000,000 to 70,000,000] with 10-kb bin size.The MALBAC data are norma-lized by the average of two other MALBAC cells to remove the sequence-dependent bias reproducible from cell to cell. (E) Coefficient of variation forread depths along the genome as a function of bin sizes from 1 b to 100Mb,showing amplification noise on all scales for single-cell WGAmethods, includingDOP-PCR, MALBAC, MDA, and LIANTI.The normalized MALBAC data (dashedline) are shown together with the unnormalized MALBAC data. Only the un-normalized data of the other methods are shown as no substantial improve-ment by normalization was observed. Poisson curve is the expected coefficientof variation for readdepth assumingonly Poisson noise. LIANTI exhibits amuchimproved amplification uniformity over the previous methods on all scales.
whether the firing of replication origins andreplicon formation (~50 to 120 kb) are stochastichas been a subject of intensive investigation(18–21) and can be best answered by single-cellmeasurements. Recently, MDAwas used to probesingle-cell DNA replication (22), but was unableto resolve individual replicons as a result of itspoor spatial resolution.We show in Fig. 2C whole-genome sequencing
with LIANTI for 11 BJ cells picked from a syn-chronized population in early S phase. Thegenome-wide replication origin–firing and replicon-formation eventsweredetectedby the copy-numbergain from 2 to 3 and from 3 to 4 with kilobaseresolution (Fig. 2C and fig. S6). The genome-widereplicon copy numbers of a single cell correlatewell with the conventional bulk readouts of theRepli-Seq assay (23) (Fig. 2D and fig. S7) and thedeoxyribonuclease I (DNase I)–hypersensitiveassay (24) (Fig. 2D and fig. S8), suggesting thata subset of replication origins are used in in-dividual cells. Figure 2E shows the correlationplots of replicon copy numbers between pairsof single cells close in replication progress in Sphase (Fig. 2E and fig. S9). Whereas the diag-onal signal represents replicons shared by both
cells (deterministic), the strong off-diagonal signalsuggests a large degree of stochasticity in termsof replication origin firing, which is different fromcell to cell.In terms of SNV detection accuracy, among all
WGA methods, LIANTI gives the lowest false-positive rate of 5.4 × 10⁻⁶ for single–BJ cell SNVdetection (Fig. 3A and fig. S10A), which is stillhigher than the anticipation from linear ampli-fication. We further characterized the mutationspectra of false positives and found that bothLIANTI andMDA exhibit a C-to-T false-positivepredominance, which is not seen in the unam-plified bulk (Fig. 3B). Such “de novo” C-to-Tmutations have been reported in many previoussingle-cell genomic studies (25, 26) and mostrecently in nondividing neurons (26).We instead attribute this predominant C-to-T
observation to the experimental artifact of C-to-U deamination after cell lysis, which iswell knownas the most common cause of point mutations(27, 28) and is especially prominent in ancientDNA (29). Deamination of C to U is a naturalprocess that occurs at a low rate randomly inthe genome (30), and hence would be difficult tosee in bulk sequencing because of the extremely
low allele frequency. To test whether C-to-T false-positive predominance in LIANTI is caused byC-to-U deamination, we treated genomic DNAfrom a lysed cell before LIANTI amplificationwith uracil–DNA glycosylase, which functionsas part of the DNA repair system in live cells, toeliminate cytosine-deaminated uracil bases (31).Indeed, a significant reduction of C-to-T SNVswere observed (Fig. 3B and fig. S10B), showingthat the commonly observed C-to-T SNV pre-dominance in the field of single-cell genomicsis caused by in vitro cytosine deamination arti-fact and is a false positive.Likewise, the second most frequent false posi-
tive is A-to-G (Fig. 3B), which happens to be thesecond most common spontaneous mutation ofDNA bases due to adenine deamination (27).Another common type of false positive is G-to-T(Fig. 3B), which is likely caused by guanine oxida-tion to 8-hydroxyguanine (32, 33). We concludedthat the accuracy of single-cell SNV detection forany WGA method is fundamentally limited bychemical instability of DNA bases in the absenceof cellular DNA repair systems. As a result, se-quencing two kindred cells (5), which are a pairof cells derived from the division of a single cell,
Chen et al., Science 356, 189–194 (2017) 14 April 2017 3 of 5
Fig. 2. Genome-wide detection of micro-CNVs and replica-tion origin–firing events in single BJ cells. (A) Principle forthe inference of fragment numbers by LIANTI. Single-cell LIANTIamplicons mapped to the same starting and ending coordinateson the reference genome are grouped, as they originated fromone fragment of the genomic DNA.This allows for the correctionof the different amplification efficiency, often size dependent, foreach fragment.The digital counting of the inferred fragment num-ber across the genome is shown here for 2-to-1 copy-number
loss. (B) Example of a 57-kb 2-to-1 micro-CNV detected in a single BJ cell,plotted with 100-bp bin size. Top panel is the read depth from unamplifiedbulk sequencing showing the existence of the micro-CNV. Middle panel isthe read depth of the single-cell LIANTI amplicons, which obscures the micro-CNV because of amplification noise at this resolution. Bottom panel showsthe inferred fragment number by LIANTI digital-counting analysis, whichrecovers the micro-CNV in the single cell. (C) Genome-wide detection ofreplication origin firing and replicon formation based on the copy-number
gain in 11 single cells with 10-kb bin size (~250-Mb region of Chr1 shown inthe plot). (D) Correlation plots of single-cell replicon copy numbers withthe bulk readouts of the Repli-Seq assay and the DNase I–hypersensitiveassay using 100-kb bin size. (E) Correlation plots of replicon copy numbersbetween pairs of single cells close in replication progress in S phase using100-kb bin size. The diagonal signal represents replicon copy numbersshared by both cells, and the off-diagonal signal suggests stochastic originfiring and replicon formation, which is different from cell to cell.
Chen et al., Science 356, 189–194 (2017) 14 April 2017 4 of 5
Fig. 4. Genome-wide profiling of UV-induced mutations in single BJ cells.(A) Experimental design. BJ cells cultivated in dishes are exposed to UV radia-tion at a dose of 5, 15, and 30 J/m2. Single cells that survived cell-cycle arrestand apoptosis were picked and allowed to divide intomultiple kindred cells (fig.S11), from which a pair of kindred cells were picked for LIANTI. (B) Spectraof UV-induced SNVs in a representative cell exposed to 15 J/m2 UV radiation.(C) Depletion of UV-induced SNVs within transcribed regions, DNase I–hypersensitive sites, and early-replicating regions. “Expected” column is thepercentage of SNVs simulated assuming randomdistribution along the genome.“Observed”column is the percentage of SNVs observed in UV-radiated samples,with the error bars calculated from four kindred pairs. (D) Overlay of the density
of UV-induced SNVs (red) and the minus Repli-Seq signal (blue) reflectingthe replicated genomic regions, as well as the minus DNase I–hypersensitivesignal (blue) throughout the genome (~250-Mb region of Chr1 shown in theplot). Both signals were calculated in 2-Mb moving windows with 100-kbincrements. (E) Nontemplate-to-template ratio of UV-induced C-to-Tand T-to-A mutations within transcribed regions and the sequence context of suchmutations. “Expected” column is the ratio simulated assuming random dis-tribution of SNVs on both strands. “Observed” column is the ratio observed inUV-radiated samples, with the error bars calculated from four kindred pairs.Sequence context is plotted based on the frequency of each base next to thecorresponding type of mutation.
Fig. 3. Detection of SNVs in single BJ cells. (A) False-positive rates of SNVdetection in a single BJ cell.The error bars were calculated from three differentBJ cells. (B) Spectra of SNV false positives in unamplified bulk, single-cell LIANTI,single-cell MDA, and single-cell uracil–DNA glycosylase (UDG)–treated LIANTIsamples.The number of false positives is shown in the bracket for each sample.Both LIANTI and MDA results exhibit predominant C-to-T false positives notseen in the unamplified bulk. Similar C-to-T SNVs have been reported in
previous single-cell MDA studies and attributed to de novo mutations (26).We attribute the phenomenon to the spontaneous C-to-U deamination uponcell lysis, which is often seen in ancient DNA bulk samples. We show thatsuch C-to-U deamination accounts for the observed SNV false positives byWGAof the cell lysate treatedwithUDG,which eliminates cytosine-deaminateduracil bases and hence recovers the reduced C-to-T false-positive fraction inthe bulk.
is necessary to filter out such false positives oc-curring randomly in the genome.We further demonstrate the use of LIANTI for
the study of mutations generated by ultraviolet(UV) radiation. It is well known that exposuretoUV radiation in sunlight leads to DNAdamageand potential skin cancer, attractingmanymech-anistic studies. UV radiation generates cyclobutanepyrimidine dimers (CPDs) and (6-4) photoproducts(PPs) on genomic DNA (34), which are subjectto nucleotide excision repair (NER) (35). If thedamage is not repaired before DNA replication,error-prone translesion synthesisDNApolymeraseis recruited to the damaged region, giving rise tode novo SNVs (36). However, thesemutations aredifferent from cell to cell because of the random-ness of UV damage along the genome, whichnecessitates single-cell whole-genome amplifica-tion and sequencing.To characterize UV-induced genome-widemuta-
tions, we exposed BJ cells to different UV doses.After propagating several cell cycles without UV,a single cell under investigation was cultured togenerate a pair of kindred cells, which were sub-ject to LIANTI and sequencing in order to elim-inate false-positive SNVs (Fig. 4A).We detected 4700 to 9300 UV-induced SNVs
throughout the genome from each pair of kindredcells (fig. S12). The SNV spectra show a C-to-Tpredominance (Fig. 4B and fig. S13), in goodagreement with the previously reported SNVspectra of sun-exposed normal human skin andmelanomas (37–39). While examining the pointmutation distribution along the genome, we dis-covered a depletion of mutations within tran-scribed regions (Fig. 4C), which can be explainedby the involvement of transcription-coupled NER(40, 41). We also observed a significant depletionwithin DNase I–hypersensitive sites and early-replicating regions (Fig. 4C). When plottingthroughout the genome, we observed a stronganticorrelationbetween thedensity ofUV-inducedSNVs and Repli-Seq signal reflecting the rep-licated genomic regions, as well as the DNaseI–hypersensitive signal (Fig. 4D and fig. S14).Similar phenomena have also been observed incancer genomes without UV radiation (42–44),which was attributed to NER impairment byDNA-bound proteins (43, 45).We further examined the propensity of mu-
tations for the two strands within transcribedregions and observed a C-to-T enrichment in thenontemplate strand (Fig. 4E). The same enrich-ment was also observed in UV-associated cancergenomes (46), which can be explained by thepreferred CPD and PP removal by transcription-coupled NER on the template strand (40, 47).
When plotting the sequence context of C-to-Tmutations, the adjacent base is mostly T on the5′ side (Fig. 4E), consistent with the well-knownmechanism of UV-induced CPD and PP formationof T:C dimers, followed by error-prone translesionsynthesis (36). Notably, we also observed an en-richment of T-to-A in the nontemplate strand(Fig. 4E and fig. S15), suggesting the involvementof transcription-coupledNER as well. We furtherplotted the sequence context of T-to-Amutationsand found the adjacent base is mostly T on bothsides (Fig. 4E and fig. S16), suggesting that T-to-Amutations may be caused by UV-induced CPDand PP formation of T:T, followed by a differentkind of error-prone translesion synthesis.High-throughput sequencing of many single
cells canbe easily achievedbyadding combinatorialcellular barcodes in the LIANTI transposon andprimer. In addition to fundamental investigationsillustrated, the high precision of micro-CNVs de-tection and the ability to call individual SNVs in asingle cell will allow better genetic screening inreproductivemedicine andprovide valuable infor-mation about how genome variation takes placein cancer and other diseases.
REFERENCES AND NOTES
1. L. Huang, F. Ma, A. Chapman, S. Lu, X. S. Xie, Annu. Rev.Genomics Hum. Genet. 16, 79–102 (2015).
2. C. Gawad,W. Koh, S. R. Quake,Nat. Rev. Genet. 17, 175–188 (2016).3. L. Yan et al., Proc. Natl. Acad. Sci. U.S.A. 112, 15964–15969
(2015).4. X. Ni et al., Proc. Natl. Acad. Sci. U.S.A. 110, 21083–21088 (2013).5. C. Zong, S. Lu, A. R. Chapman, X. S. Xie, Science 338,
1622–1626 (2012).6. S. Lu et al., Science 338, 1627–1630 (2012).7. Y. Hou et al., Cell 155, 1492–1506 (2013).8. N. Navin et al., Nature 472, 90–94 (2011).9. Y. Wang et al., Nature 512, 155–160 (2014).10. H. Telenius et al., Genomics 13, 718–725 (1992).11. F. B. Dean et al., Proc. Natl. Acad. Sci. U.S.A. 99, 5261–5266
(2002).12. K. Leung et al., Proc. Natl. Acad. Sci. U.S.A. 113, 8484–8489
(2016).13. I. Y. Goryshin, W. S. Reznikoff, J. Biol. Chem. 273, 7367–7374
(1998).14. R. N. Van Gelder et al., Proc. Natl. Acad. Sci. U.S.A. 87,
1663–1667 (1990).15. A. Adey et al., Genome Biol. 11, R119 (2010).16. J. A. Reuter, D. V. Spacek, R. K. Pai, M. P. Snyder, Nat. Methods
13, 953–958 (2016).17. H. Zahn et al., Nat. Methods 14, 167–173 (2017).18. N. Rhind, D. M. Gilbert, Cold Spring Harb. Perspect. Biol. 5,
a010132 (2013).19. M. Fragkos, O. Ganier, P. Coulombe, M. Méchali, Nat. Rev. Mol.
Cell Biol. 16, 360–374 (2015).20. R. Lebofsky, R. Heilig, M. Sonnleitner, J. Weissenbach,
A. Bensimon, Mol. Biol. Cell 17, 5337–5345 (2006).21. B. Miotto, Z. Ji, K. Struhl, Proc. Natl. Acad. Sci. U.S.A. 113,
E4810–E4819 (2016).22. N. Van der Aa et al., Nucleic Acids Res. 41, e66 (2013).23. R. S. Hansen et al., Proc. Natl. Acad. Sci. U.S.A. 107, 139–144
(2010).24. S. John et al., Curr. Protoc. Mol. Biol. 103, 21.27.1–21.27.20 (2013).
25. J. Wang, H. C. Fan, B. Behr, S. R. Quake, Cell 150, 402–412(2012).
26. M. A. Lodato et al., Science 350, 94–98 (2015).27. T. Strachan, J. Goodship, P. Chinnery, Genetics and
Genomics in Medicine (Garland Science, New York, 2014).28. A. Beletskii, A. S. Bhagwat, Proc. Natl. Acad. Sci. U.S.A. 93,
13919–13924 (1996).29. M. Hofreiter, V. Jaenicke, D. Serre, A. von Haeseler, S. Pääbo,
Nucleic Acids Res. 29, 4793–4799 (2001).30. J. C. Shen, W. M. Rideout III, P. A. Jones, Nucleic Acids Res. 22,
972–976 (1994).31. N. Rohland, E. Harney, S. Mallick, S. Nordenfelt, D. Reich,
Philos. Trans. R. Soc. Lond. B Biol. Sci. 370, 20130624(2015).
32. K. C. Cheng, D. S. Cahill, H. Kasai, S. Nishimura, L. A. Loeb,J. Biol. Chem. 267, 166–172 (1992).
33. L. Chen, P. Liu, T. C. Evans Jr., L. M. Ettwiller, Science 355,752–756 (2017).
34. R. P. Rastogi, A. Richa, A. Kumar, M. B. Tyagi, R. P. Sinha,J. Nucleic Acids 2010, 592980 (2010).
35. J. O. Fuss, P. K. Cooper, PLOS Biol. 4, e203 (2006).36. A. Stary, P. Kannouche, A. R. Lehmann, A. Sarasin, J. Biol.
Chem. 278, 18767–18775 (2003).37. M. Krauthammer et al., Nat. Genet. 44, 1006–1014 (2012).38. I. Martincorena et al., Science 348, 880–886 (2015).39. N. Saini et al., PLOS Genet. 12, e1006385 (2016).40. J. Hu, S. Adar, C. P. Selby, J. D. Lieb, A. Sancar, Genes Dev. 29,
948–960 (2015).41. G. Hendriks et al., Curr. Biol. 20, 170–175 (2010).42. P. Polak et al., Nature 518, 360–364 (2015).43. P. Polak et al., Nat. Biotechnol. 32, 71–75 (2014).44. B. Schuster-Böckler, B. Lehner, Nature 488, 504–507
(2012).45. R. Sabarinathan, L. Mularoni, J. Deu-Pons, A. Gonzalez-Perez,
N. López-Bigas, Nature 532, 264–267 (2016).46. N. J. Haradhvala et al., Cell 164, 538–549 (2016).47. H. Vrieling et al., Nucleic Acids Res. 19, 2411–2415 (1991).
ACKNOWLEDGMENTS
The LIANTI development was supported by the NIH Director’sPioneer Award (5DP1CA186693), and the study of DNA damageby UV radiation was supported by a National Cancer Institutegrant (5R33CA174560). The comparison with other methodsand the study of micro-CNVs were supported by BeijingMunicipal Science and Technology Commission grants(D1511000024150002 to X.S.X.), National Key TechnologiesResearch and Development program (2016YFC0900100to L.H.), and funding from Beijing Advanced Innovation Centerfor Genomics at Peking University. L.T. was supported by aHoward Hughes Medical Institute International StudentResearch Fellowship. We thank Y. Yin, P. Cui, A. Chapman,Y. Tang, and other members in the group for their assistanceand helpful discussions. X.S.X., C.C., and D.X. are inventorson a patent application filed by Harvard University thatcovers the single-cell whole-genome sequencing by LIANTItechnology. Raw sequencing data were deposited atthe National Center for Biotechnology Informationwith accession number SRP102259 at www.ncbi.nlm.nih.gov/sra/SRP102259.
SUPPLEMENTARY MATERIALS
www.sciencemag.org/content/356/6334/189/suppl/DC1Materials and MethodsFigs. S1 to S16Table S1References (48–64)
22 September 2016; resubmitted 3 February 2017Accepted 17 March 201710.1126/science.aak9787
Chen et al., Science 356, 189–194 (2017) 14 April 2017 5 of 5
(6334), 189-194. [doi: 10.1126/science.aak9787]356Science Lei Huang and X. Sunney Xie (April 13, 2017) Chongyi Chen, Dong Xing, Longzhi Tan, Heng Li, Guangyu Zhou,Transposon Insertion (LIANTI)Single-cell whole-genome analyses by Linear Amplification via
Editor's Summary
, this issue p. 189Scienceradiation.to determine the spectrum of single-nucleotide variations in a single human cell after ultraviolet transposon that includes a T7 promoter, which allows linear amplification. The authors used the methodvia Transposon Insertion (LIANTI). The DNA is randomly fragmented by Tn5 transposition of a
report an improved single-cell WGA method, Linear Amplificationet al.amplification fidelity. Chen have been hampered by low accuracy and spatial resolution of gene copy numbers and by low (WGA) methods that provide sufficient DNA for next-generation sequencing. Current WGA methodsand genome instability. Key to single-cell sequencing techniques are whole-genome amplification
Sequencing the genome of single cells gives insight into issues such as cell-to-cell heterogeneityMaking an unbiased library
This copy is for your personal, non-commercial use only.
Article Tools
http://science.sciencemag.org/content/356/6334/189article tools: Visit the online version of this article to access the personalization and
Permissionshttp://www.sciencemag.org/about/permissions.dtlObtain information about reproducing this article:
is a registered trademark of AAAS. ScienceAdvancement of Science; all rights reserved. The title Avenue NW, Washington, DC 20005. Copyright 2016 by the American Association for thein December, by the American Association for the Advancement of Science, 1200 New York
(print ISSN 0036-8075; online ISSN 1095-9203) is published weekly, except the last weekScience