Single-Particle and Collective Mode Couplings Associated with 1- and 2-Directional Electronic Ordering in Metallic RTe 3 (R ¼ Ho; Dy ; Tb) R. V. Yusupov, 1, * T. Mertelj, 1 J.-H. Chu, 2 I. R. Fisher, 2 and D. Mihailovic 1 1 Complex Matter Department, Jozef Stefan Institute, Jamova 39, 1000 Ljubljana, Slovenia 2 Geballe Laboratory for Advanced Materials and Department of Applied Physics, Stanford University, Stanford, California 94305, USA (Received 30 June 2008; published 11 December 2008) The coupling of phonons with collective modes and single-particle gap excitations associated with one- (1d) and two-directional (2d) electronically driven charge-density wave (CDW) ordering in metallic RTe 3 is investigated as a function of rare-earth ion chemical pressure (R ¼ Tb; Dy; Ho) using femtosecond pump-probe spectroscopy. From the T dependence of the CDW gap CDW and the amplitude mode, we find that while the transition to a 1d-CDW ordered state at T c1 initially proceeds in an exemplary mean- field-like fashion, below T c1 , CDW is depressed and departs from the mean-field behavior. The effect is apparently triggered by resonant mode mixing of the amplitude mode with a totally symmetric phonon at 1.75 THz. At low temperatures, when the state evolves into a 2d-CDW ordered state at T c2 in the DyTe 3 and HoTe 3 , additional much weaker mode mixing is evident but no soft mode is observed. DOI: 10.1103/PhysRevLett.101.246402 PACS numbers: 71.45.Lr, 72.15.Nj, 78.47.JOrdered electronic states in condensed matter physics are of fundamental importance as models for investigating the competition between different ground states and the collective behavior of quantum systems. They are also of a practical interest because electronic ordering gives rise to phenomena such as superconductivity and colossal mag- netoresistance which are all macroscopic manifestations of underlying quantum phenomena. One class of systems which has received renewed attention recently are two- dimensional (2D) layered metals with electronically driven charge-density-wave (CDW) instabilities, partly because of the possible role that electronic ordering may play in high-temperature superconductivity in layered cuprates and (more recently) iron pnictides [1]. In weakly interact- ing systems, the instability is predominantly driven by a Fermi surface (FS) nesting, where a single wave vector q N connects multiple points along the FS, giving rise to an enhanced generalized susceptibility at this wave vector, which in turn leads to the formation of an electronic ordered CDW state which reduces the energy of the sys- tem. How this behavior evolves in strongly coupled sys- tems such as cuprates is still the subject of intense investigations and is not clear. Layered rare-earth tritelluride compounds (RTe 3 , where R is a rare-earth ion) shown schematically in Fig. 1(a) are interesting newly discovered examples of very weakly coupled electronically driven [2] CDW systems whose properties can be tuned by changing the size of the R ion which changes the unit cell size along the crystallographic a axis, effectively exerting a chemical pressure. Initial electron diffraction [2] and subsequent high resolution x-ray diffraction (XRD) [3–5] studies have revealed the ubiquitous presence of a weak lattice modulation at a primary modulation vector q CDW , where FS nesting leads to the formation of a one-directional (1d) incommensurate CDW. More recently, angle-resolved photoemission spec- troscopy (ARPES) confirmed the existence of imperfect FS nesting and revealed that as a result of the CDW, a gap forms in the Fermi surface in the -Z direction [6,7] of the Brillouin zone. Quantum oscillations from the recon- structed FS have been observed in LaTe 3 [8]. Recent theoretical work suggests that there may be a competition between 1d ‘‘stripe order’’ and 2d ‘‘checkerboard order,’’ which is finely tuned by the strength of the electron- phonon coupling !. Indeed, x-ray diffraction [5] and STM data [9] on the heavier rare-earth members of the series confirm the presence of a ‘‘rectangular’’ 2d-ordered CDW state at low temperatures (at T c2 ’ 126 K in HoTe 3 and 49 K in DyTe 3 ). In TbTe 3 there are also indications of possible 2d ordering from scanning-tunneling microscope studies at 6 K [9], but no long range ordering was seen by x-ray diffraction. In some layered chalcogenides, notably in NbSe 2 , pressure leads to suppression of the CDW and emergence of superconductivity. Studies as a function of chemical pressure in tritellurides have shown that the 1d- CDW transition temperature T c1 decreases with decreasing R radius, but at the same time, another, coexisting 2d- ordered state appears in the heavier R members of the series, whose critical transition temperature T c2 increases with increasing pressure [see Fig. 1(b)]. So far, no super- conductivity was discovered, but all compounds show metallic resistivity down to the lowest temperatures, in spite of CDW gaps on the FS. Femtosecond pump-probe spectroscopy (FPPS) has re- cently been shown to be eminently suitable to the study of quasiparticle (QP) and collective excitations of electroni- cally ordered systems [10–13]. It allows the measurement of low-frequency modes with very high resolution which are inaccessible to Raman spectroscopy, as well as a direct measurement of the QP recombination kinetics across the PRL 101, 246402 (2008) PHYSICAL REVIEW LETTERS week ending 12 DECEMBER 2008 0031-9007= 08=101(24)=246402(4) 246402-1 Ó 2008 The American Physical Society
Transcript
Single-Particle and Collective Mode Couplings Associated with 1- and 2-Directional ElectronicOrdering in Metallic RTe3 (R ¼ Ho;Dy;Tb)
R.V. Yusupov,1,* T. Mertelj,1 J.-H. Chu,2 I. R. Fisher,2 and D. Mihailovic1
1Complex Matter Department, Jozef Stefan Institute, Jamova 39, 1000 Ljubljana, Slovenia2Geballe Laboratory for Advanced Materials and Department of Applied Physics, Stanford University,
Stanford, California 94305, USA(Received 30 June 2008; published 11 December 2008)
The coupling of phonons with collective modes and single-particle gap excitations associated with one-
(1d) and two-directional (2d) electronically driven charge-density wave (CDW) ordering in metallic RTe3is investigated as a function of rare-earth ion chemical pressure (R ¼ Tb;Dy;Ho) using femtosecond
pump-probe spectroscopy. From the T dependence of the CDW gap �CDW and the amplitude mode, we
find that while the transition to a 1d-CDW ordered state at Tc1 initially proceeds in an exemplary mean-
field-like fashion, below Tc1, �CDW is depressed and departs from the mean-field behavior. The effect is
apparently triggered by resonant mode mixing of the amplitude mode with a totally symmetric phonon at
1.75 THz. At low temperatures, when the state evolves into a 2d-CDW ordered state at Tc2 in the DyTe3and HoTe3, additional much weaker mode mixing is evident but no soft mode is observed.
Ordered electronic states in condensed matter physicsare of fundamental importance as models for investigatingthe competition between different ground states and thecollective behavior of quantum systems. They are also of apractical interest because electronic ordering gives rise tophenomena such as superconductivity and colossal mag-netoresistance which are all macroscopic manifestations ofunderlying quantum phenomena. One class of systemswhich has received renewed attention recently are two-dimensional (2D) layered metals with electronically drivencharge-density-wave (CDW) instabilities, partly becauseof the possible role that electronic ordering may play inhigh-temperature superconductivity in layered cupratesand (more recently) iron pnictides [1]. In weakly interact-ing systems, the instability is predominantly driven by aFermi surface (FS) nesting, where a single wave vector qNconnects multiple points along the FS, giving rise to anenhanced generalized susceptibility at this wave vector,which in turn leads to the formation of an electronicordered CDW state which reduces the energy of the sys-tem. How this behavior evolves in strongly coupled sys-tems such as cuprates is still the subject of intenseinvestigations and is not clear.
Layered rare-earth tritelluride compounds (RTe3, whereR is a rare-earth ion) shown schematically in Fig. 1(a) areinteresting newly discovered examples of very weaklycoupled electronically driven [2] CDW systems whoseproperties can be tuned by changing the size of the R ionwhich changes the unit cell size along the crystallographica axis, effectively exerting a chemical pressure. Initialelectron diffraction [2] and subsequent high resolutionx-ray diffraction (XRD) [3–5] studies have revealed theubiquitous presence of a weak lattice modulation at aprimary modulation vector qCDW, where FS nesting leadsto the formation of a one-directional (1d) incommensurate
CDW. More recently, angle-resolved photoemission spec-troscopy (ARPES) confirmed the existence of imperfect FSnesting and revealed that as a result of the CDW, a gapforms in the Fermi surface in the �-Z direction [6,7] of theBrillouin zone. Quantum oscillations from the recon-structed FS have been observed in LaTe3 [8]. Recenttheoretical work suggests that there may be a competitionbetween 1d ‘‘stripe order’’ and 2d ‘‘checkerboard order,’’which is finely tuned by the strength of the electron-phonon coupling �. Indeed, x-ray diffraction [5] andSTM data [9] on the heavier rare-earth members of theseries confirm the presence of a ‘‘rectangular’’ 2d-orderedCDW state at low temperatures (at Tc2 ’ 126 K in HoTe3and 49 K in DyTe3). In TbTe3 there are also indications ofpossible 2d ordering from scanning-tunneling microscopestudies at 6 K [9], but no long range ordering was seen byx-ray diffraction. In some layered chalcogenides, notablyin NbSe2, pressure leads to suppression of the CDW andemergence of superconductivity. Studies as a function ofchemical pressure in tritellurides have shown that the 1d-CDW transition temperature Tc1 decreases with decreasingR radius, but at the same time, another, coexisting 2d-ordered state appears in the heavier R members of theseries, whose critical transition temperature Tc2 increaseswith increasing pressure [see Fig. 1(b)]. So far, no super-conductivity was discovered, but all compounds showmetallic resistivity down to the lowest temperatures, inspite of CDW gaps on the FS.Femtosecond pump-probe spectroscopy (FPPS) has re-
cently been shown to be eminently suitable to the study ofquasiparticle (QP) and collective excitations of electroni-cally ordered systems [10–13]. It allows the measurementof low-frequency modes with very high resolution whichare inaccessible to Raman spectroscopy, as well as a directmeasurement of the QP recombination kinetics across the
PRL 101, 246402 (2008) P HY S I CA L R EV I EW LE T T E R Sweek ending
12 DECEMBER 2008
0031-9007=08=101(24)=246402(4) 246402-1 � 2008 The American Physical Society
CDWor superconducting gap. In this Letter, we use FPPSto investigate the evolution of the CDW gap and thecoupling of the amplitude mode and single-particle exci-tations with phonons in the 1d- and 2d-ordered states ofthree tritellurides for the first time: HoTe3 and DyTe3,which exhibit two CDW transitions, and TbTe3, for whichthere is only one transition.
FPPS involves the measurement of the transient reflec-tivity response after excitation by ultrashort (50 fs) laserpulses [11,13]. The laser pulses excite electron-hole pairswhich relax to states near the Fermi level in <50 fs byavalanche QP multiplication. When there is a gap forelectronic excitations at low energy, such as a CDW orsuperconducting gap, a relaxation bottleneck may formand a nonequilibrium population of the QPs at the gapedge, which can be probed by excited state absorption witha probe laser pulse, thus effectively measuring QP densityin real time. This QP density is usually assumed to bedirectly proportional to the transient change of reflectivity�R=Rwhich allows us to directly observe the presence of aCDW gap, the QP relaxation time �QP, and their evolution
with temperature. In addition to the QP excitations, with
FPPS we also observe collective excitations such as pho-nons and the amplitude mode (AM) [11], typically withvery high resolution and low noise. In our experiments thepump and probe wavelengths were 400 and 800 nm, re-spectively. The pump fluence was �20 �J=cm2, and laserheating was checked to be minimal. The crystals used inthis study were prepared by slow cooling a binary melt, asdescribed previously [14]. Clean surfaces oriented perpen-dicular to the b axis of the crystal were exposed by cleav-age prior to the measurement.The raw data on the transient reflectivity are shown in
Fig. 1(c) for DyTe3 (data on all three compounds arequalitatively similar). The QP response gives rise to theshort transient, while the oscillations are from the coher-ently excited phonons and the AM. The QP data areanalyzed in the following way: The maximum value of�R=RðtÞ was used as a measure of QP density (AQP), while
the lifetime was obtained by fitting the falling slope of thefast transient with �R=RðtÞ ¼ A exp½�t=�QP�. The fast
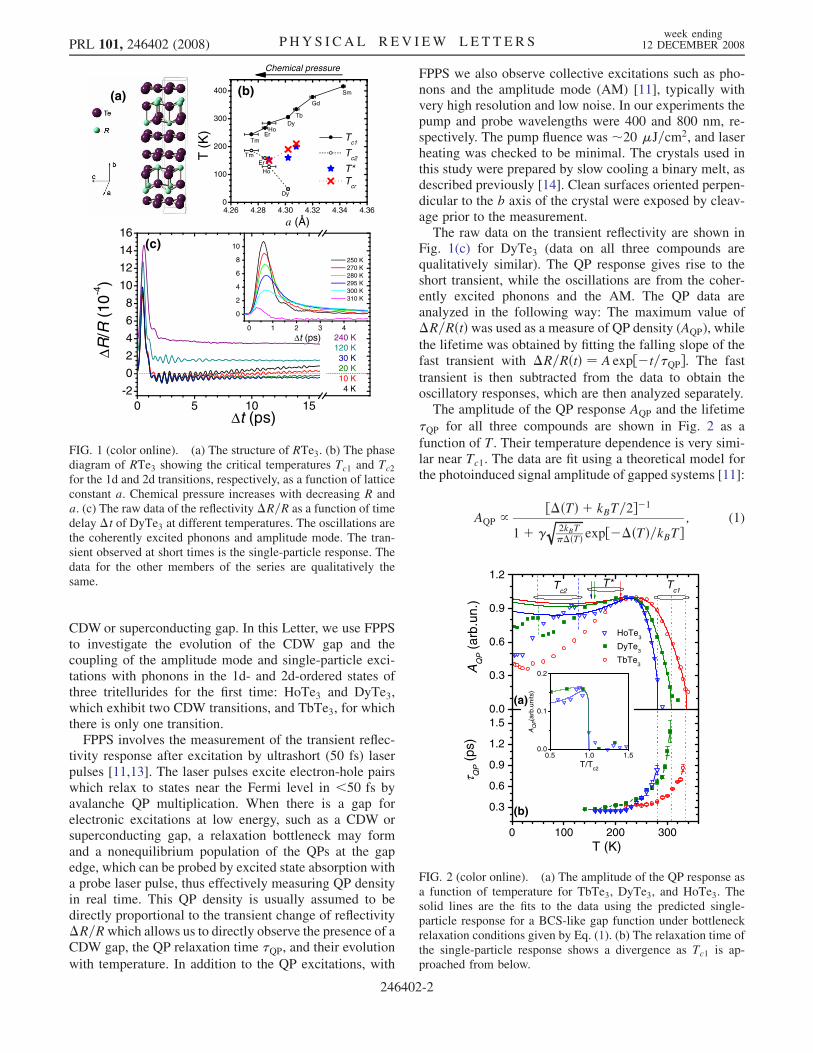
transient is then subtracted from the data to obtain theoscillatory responses, which are then analyzed separately.The amplitude of the QP response AQP and the lifetime
�QP for all three compounds are shown in Fig. 2 as a
function of T. Their temperature dependence is very simi-lar near Tc1. The data are fit using a theoretical model forthe photoinduced signal amplitude of gapped systems [11]:
AQP / ½�ðTÞ þ kBT=2��1
1þ �ffiffiffiffiffiffiffiffiffiffi
2kBT��ðTÞ
q
exp½��ðTÞ=kBT�; (1)
(a)
(b)
0.0
0.3
0.6
0.9
1.2
0.5 1.0 1.50.0
0.1
0.2
AQ
P (ar
b.un
its)
T/Tc2
T*Tc2
AQ
P (
arb.
un.)
HoTe3
DyTe3
TbTe3
0 100 200 300
0.3
0.6
0.9
1.2
1.5
τ QP (
ps)
T (K)
Tc1
FIG. 2 (color online). (a) The amplitude of the QP response asa function of temperature for TbTe3, DyTe3, and HoTe3. Thesolid lines are the fits to the data using the predicted single-particle response for a BCS-like gap function under bottleneckrelaxation conditions given by Eq. (1). (b) The relaxation time ofthe single-particle response shows a divergence as Tc1 is ap-proached from below.
0 5 10 15-2
0
2
4
6
8
10
12
14
16
0 1 2 3 4
0
2
4
6
8
10
240 K120 K 30 K 20 K 10 K 4 K
∆ R/R
(10
-4)
∆t (ps)
250 K 270 K 280 K 295 K 300 K 310 K
∆t (ps)
(a) (b)
(c)
a (Å)4.26 4.28 4.30 4.32 4.34 4.360
100
200
300
400
TmEr
Ho
Dy
TmEr
HoDy
Tb
Gd
Sm
T (
K) T
c1
Tc2
T*T
cr
Chemical pressure
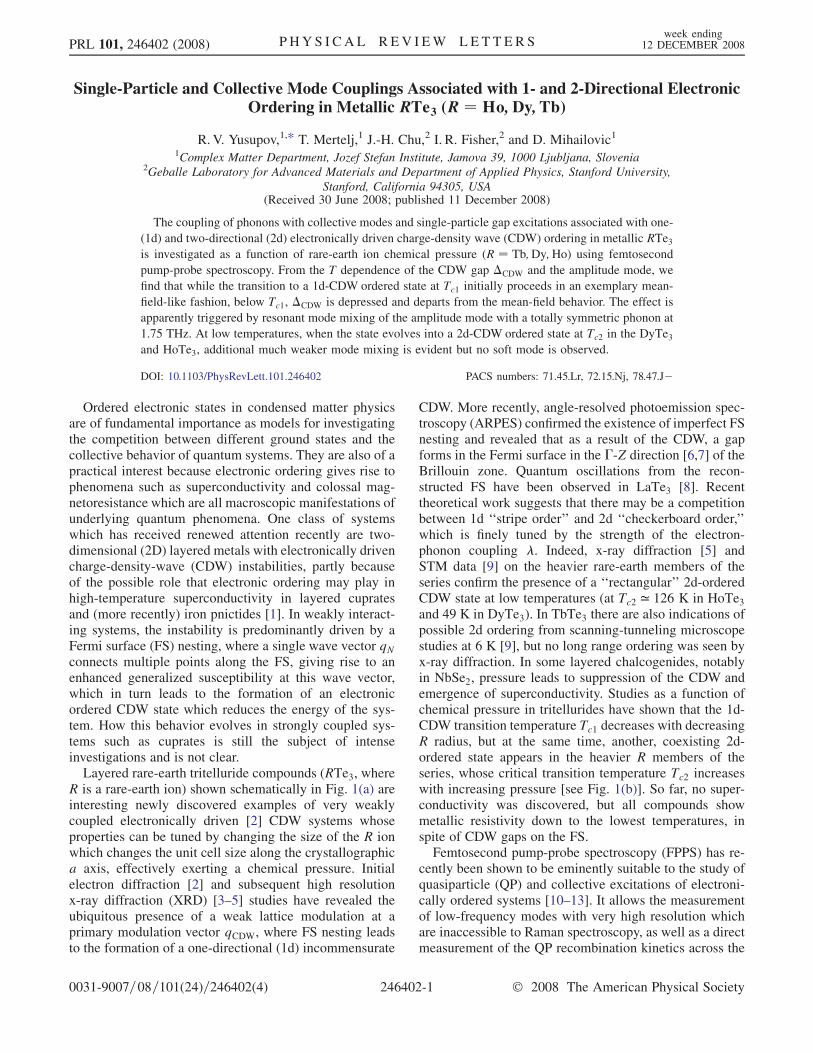
FIG. 1 (color online). (a) The structure of RTe3. (b) The phasediagram of RTe3 showing the critical temperatures Tc1 and Tc2
for the 1d and 2d transitions, respectively, as a function of latticeconstant a. Chemical pressure increases with decreasing R anda. (c) The raw data of the reflectivity �R=R as a function of timedelay �t of DyTe3 at different temperatures. The oscillations arethe coherently excited phonons and amplitude mode. The tran-sient observed at short times is the single-particle response. Thedata for the other members of the series are qualitatively thesame.
PRL 101, 246402 (2008) P HY S I CA L R EV I EW LE T T E R Sweek ending
12 DECEMBER 2008
246402-2
where�ðTÞ is the gap with a BCS-like T dependence and �is a parameter (see [11] or [12] for a description of �). Wesee that the solid lines show remarkable agreement with thedata near Tc1. The gap values for the Ho, Dy, and Tbtellurides obtained from the fit are �ð0Þ1D ¼ 118ð2Þ, 123(3), and 125(6) meV, respectively, in good agreement withprevious optical measurements [15] and somewhat lessthan the maximum gap obtained in ARPES [7], whichwe attribute to the fact that optical measurements, ingeneral, perform an average over ~q. The values of �were 20(5) for all traces. The relaxation time is theoreti-cally related to the gap as �QP / 1=�1dðTÞ near Tc [10], so
the divergence of �QP for all three compounds is further
remarkable indication of mean-field (MF) behavior, where�1dðTÞ ! 0 as T ! Tc1.
In contrast to the behavior near Tc1, below � 200 K wesee a systematic departure from the predicted MF behaviorin all three compounds. The order parameter in TbTe3observed by x-ray diffraction shows a similar departurefrom MF behavior in the same temperature range [5]. Inour case, two effects are visible: a drop in the amplitudebelow the MF prediction and a small but systematic gap-like feature which coincides with Tc2 in DyTe3 and HoTe3.The inset in Fig. 2 shows that the gaplike anomaly at Tc2
can be fit to the appearance of an additional CDW gapopening for both Ho and Dy tellurides. The fit gives valuesof the gap at �ð0Þ2D ¼ 40ð4Þ meV and �ð0Þ2D ¼13:5ð1:5Þ meV for HoTe3 and DyTe3, respectively, with� ¼ 3. No such gap opening is unambiguously seen inTbTe3, where the existence of a second transition is un-certain [5]. Turning to the departure fromMF behavior, wehave plotted the point where the amplitude AQP deviates
from the MF prediction on the phase diagram in Fig. 1. Thedeviation is systematic in all three compounds and occursin the temperature range 140 K< T� < 200 K.
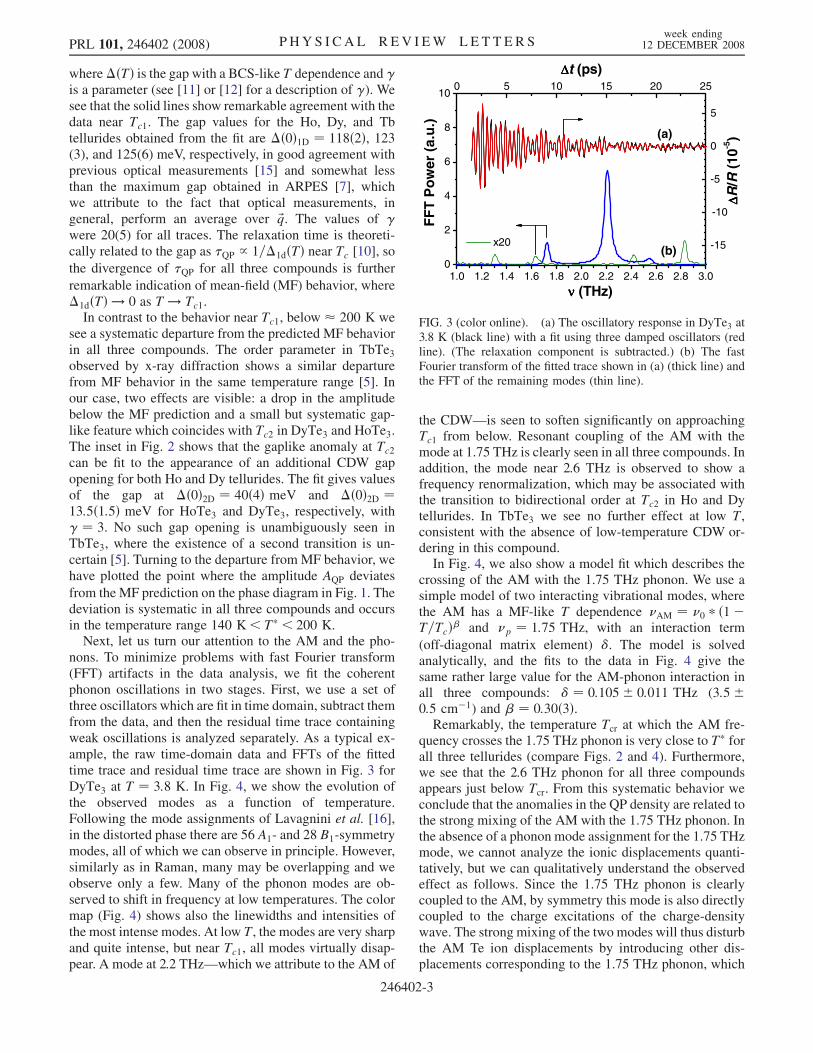
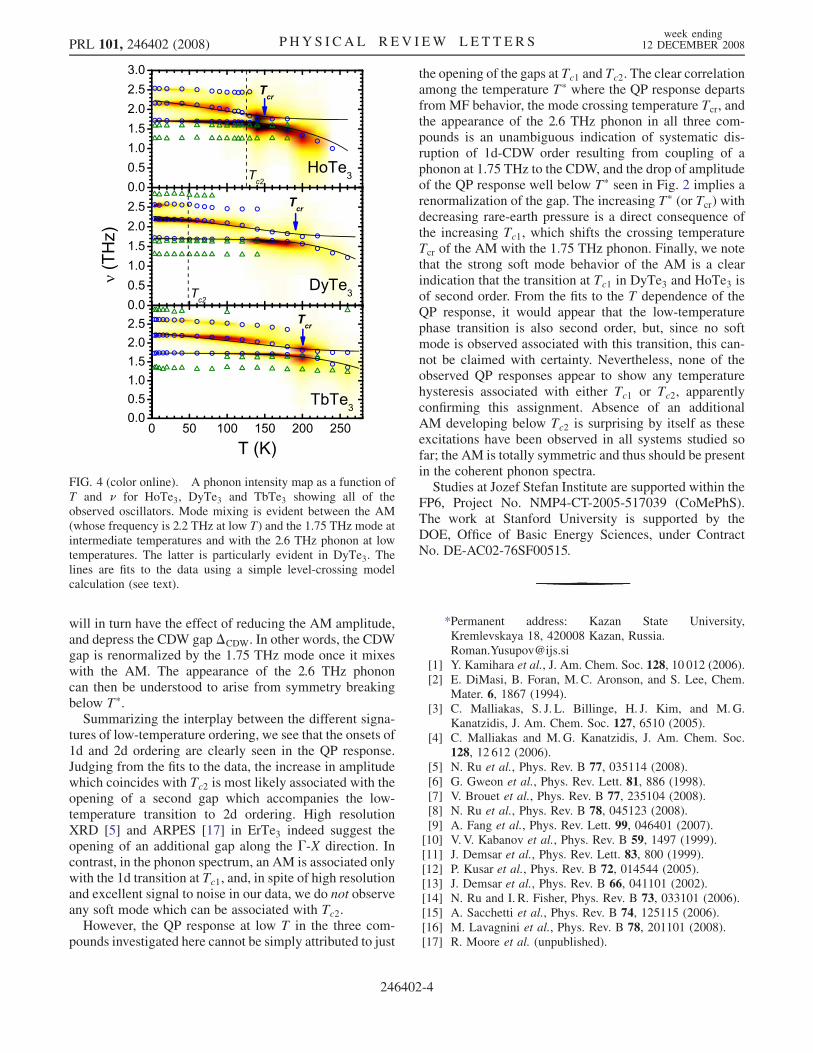
Next, let us turn our attention to the AM and the pho-nons. To minimize problems with fast Fourier transform(FFT) artifacts in the data analysis, we fit the coherentphonon oscillations in two stages. First, we use a set ofthree oscillators which are fit in time domain, subtract themfrom the data, and then the residual time trace containingweak oscillations is analyzed separately. As a typical ex-ample, the raw time-domain data and FFTs of the fittedtime trace and residual time trace are shown in Fig. 3 forDyTe3 at T ¼ 3:8 K. In Fig. 4, we show the evolution ofthe observed modes as a function of temperature.Following the mode assignments of Lavagnini et al. [16],in the distorted phase there are 56 A1- and 28 B1-symmetrymodes, all of which we can observe in principle. However,similarly as in Raman, many may be overlapping and weobserve only a few. Many of the phonon modes are ob-served to shift in frequency at low temperatures. The colormap (Fig. 4) shows also the linewidths and intensities ofthe most intense modes. At low T, the modes are very sharpand quite intense, but near Tc1, all modes virtually disap-pear. A mode at 2.2 THz—which we attribute to the AM of
the CDW—is seen to soften significantly on approachingTc1 from below. Resonant coupling of the AM with themode at 1.75 THz is clearly seen in all three compounds. Inaddition, the mode near 2.6 THz is observed to show afrequency renormalization, which may be associated withthe transition to bidirectional order at Tc2 in Ho and Dytellurides. In TbTe3 we see no further effect at low T,consistent with the absence of low-temperature CDW or-dering in this compound.In Fig. 4, we also show a model fit which describes the
crossing of the AM with the 1.75 THz phonon. We use asimple model of two interacting vibrational modes, wherethe AM has a MF-like T dependence �AM ¼ �0 � ð1�T=TcÞ� and �p ¼ 1:75 THz, with an interaction term
(off-diagonal matrix element) �. The model is solvedanalytically, and the fits to the data in Fig. 4 give thesame rather large value for the AM-phonon interaction inall three compounds: � ¼ 0:105� 0:011 THz (3:5�0:5 cm�1) and � ¼ 0:30ð3Þ.Remarkably, the temperature Tcr at which the AM fre-
quency crosses the 1.75 THz phonon is very close to T� forall three tellurides (compare Figs. 2 and 4). Furthermore,we see that the 2.6 THz phonon for all three compoundsappears just below Tcr. From this systematic behavior weconclude that the anomalies in the QP density are related tothe strong mixing of the AM with the 1.75 THz phonon. Inthe absence of a phonon mode assignment for the 1.75 THzmode, we cannot analyze the ionic displacements quanti-tatively, but we can qualitatively understand the observedeffect as follows. Since the 1.75 THz phonon is clearlycoupled to the AM, by symmetry this mode is also directlycoupled to the charge excitations of the charge-densitywave. The strong mixing of the two modes will thus disturbthe AM Te ion displacements by introducing other dis-placements corresponding to the 1.75 THz phonon, which
1.0 1.2 1.4 1.6 1.8 2.0 2.2 2.4 2.6 2.8 3.00
2
4
6
8
100 5 10 15 20 25
-15
-10
-5
0
5
(b) x20
FF
T P
ow
er (
a.u
.)
νννν (THz)
(a)
∆∆ ∆∆ R/R
(10
-5)
∆∆∆∆t (ps)
FIG. 3 (color online). (a) The oscillatory response in DyTe3 at3.8 K (black line) with a fit using three damped oscillators (redline). (The relaxation component is subtracted.) (b) The fastFourier transform of the fitted trace shown in (a) (thick line) andthe FFT of the remaining modes (thin line).
PRL 101, 246402 (2008) P HY S I CA L R EV I EW LE T T E R Sweek ending
12 DECEMBER 2008
246402-3
will in turn have the effect of reducing the AM amplitude,and depress the CDW gap �CDW. In other words, the CDWgap is renormalized by the 1.75 THz mode once it mixeswith the AM. The appearance of the 2.6 THz phononcan then be understood to arise from symmetry breakingbelow T�.
Summarizing the interplay between the different signa-tures of low-temperature ordering, we see that the onsets of1d and 2d ordering are clearly seen in the QP response.Judging from the fits to the data, the increase in amplitudewhich coincides with Tc2 is most likely associated with theopening of a second gap which accompanies the low-temperature transition to 2d ordering. High resolutionXRD [5] and ARPES [17] in ErTe3 indeed suggest theopening of an additional gap along the �-X direction. Incontrast, in the phonon spectrum, an AM is associated onlywith the 1d transition at Tc1, and, in spite of high resolutionand excellent signal to noise in our data, we do not observeany soft mode which can be associated with Tc2.
However, the QP response at low T in the three com-pounds investigated here cannot be simply attributed to just
the opening of the gaps at Tc1 and Tc2. The clear correlationamong the temperature T� where the QP response departsfrom MF behavior, the mode crossing temperature Tcr, andthe appearance of the 2.6 THz phonon in all three com-pounds is an unambiguous indication of systematic dis-ruption of 1d-CDW order resulting from coupling of aphonon at 1.75 THz to the CDW, and the drop of amplitudeof the QP response well below T� seen in Fig. 2 implies arenormalization of the gap. The increasing T� (or Tcr) withdecreasing rare-earth pressure is a direct consequence ofthe increasing Tc1, which shifts the crossing temperatureTcr of the AM with the 1.75 THz phonon. Finally, we notethat the strong soft mode behavior of the AM is a clearindication that the transition at Tc1 in DyTe3 and HoTe3 isof second order. From the fits to the T dependence of theQP response, it would appear that the low-temperaturephase transition is also second order, but, since no softmode is observed associated with this transition, this can-not be claimed with certainty. Nevertheless, none of theobserved QP responses appear to show any temperaturehysteresis associated with either Tc1 or Tc2, apparentlyconfirming this assignment. Absence of an additionalAM developing below Tc2 is surprising by itself as theseexcitations have been observed in all systems studied sofar; the AM is totally symmetric and thus should be presentin the coherent phonon spectra.Studies at Jozef Stefan Institute are supported within the
FP6, Project No. NMP4-CT-2005-517039 (CoMePhS).The work at Stanford University is supported by theDOE, Office of Basic Energy Sciences, under ContractNo. DE-AC02-76SF00515.
*Permanent address: Kazan State University,Kremlevskaya 18, 420008 Kazan, [email protected]
[1] Y. Kamihara et al., J. Am. Chem. Soc. 128, 10 012 (2006).[2] E. DiMasi, B. Foran, M.C. Aronson, and S. Lee, Chem.
Mater. 6, 1867 (1994).[3] C. Malliakas, S. J. L. Billinge, H. J. Kim, and M.G.
Kanatzidis, J. Am. Chem. Soc. 127, 6510 (2005).[4] C. Malliakas and M.G. Kanatzidis, J. Am. Chem. Soc.
128, 12 612 (2006).[5] N. Ru et al., Phys. Rev. B 77, 035114 (2008).[6] G. Gweon et al., Phys. Rev. Lett. 81, 886 (1998).[7] V. Brouet et al., Phys. Rev. B 77, 235104 (2008).[8] N. Ru et al., Phys. Rev. B 78, 045123 (2008).[9] A. Fang et al., Phys. Rev. Lett. 99, 046401 (2007).[10] V. V. Kabanov et al., Phys. Rev. B 59, 1497 (1999).[11] J. Demsar et al., Phys. Rev. Lett. 83, 800 (1999).[12] P. Kusar et al., Phys. Rev. B 72, 014544 (2005).[13] J. Demsar et al., Phys. Rev. B 66, 041101 (2002).[14] N. Ru and I. R. Fisher, Phys. Rev. B 73, 033101 (2006).[15] A. Sacchetti et al., Phys. Rev. B 74, 125115 (2006).[16] M. Lavagnini et al., Phys. Rev. B 78, 201101 (2008).[17] R. Moore et al. (unpublished).
FIG. 4 (color online). A phonon intensity map as a function ofT and � for HoTe3, DyTe3 and TbTe3 showing all of theobserved oscillators. Mode mixing is evident between the AM(whose frequency is 2.2 THz at low T) and the 1.75 THz mode atintermediate temperatures and with the 2.6 THz phonon at lowtemperatures. The latter is particularly evident in DyTe3. Thelines are fits to the data using a simple level-crossing modelcalculation (see text).
PRL 101, 246402 (2008) P HY S I CA L R EV I EW LE T T E R Sweek ending