Single photon counting with a microchannel plateintensified integrated diode array
Murray Parkinson
A multichannel photoelectron counting system employing a Reticon 1024-element linear silicon photodiodearray with fiber optic window has been developed. The primary design philosophy was to produce a 1-Delectronic camera optimized for high dispersion astronomical spectrophotometry of faint sources by intensefying the photodiode array with a microchannel plate. With an intensification factor of 108, single photonincidences will be amplified beyond system noise, becoming readily discriminable by low resolution pulsecounting electronics. The system will approach the ideal of a truly noiseless amplifier with shot-limitedperformance. Funds not being available for the purchase of a microchannel plate, operation of the system inthe rapid scanning intensified mode was illustrated by using the photodiode array as a line scanner imagingbright sources, and operation in the slow chilled Reticon mode was illustrated by installation in an automated3-m Czerny-Turner double monochromator.
1. Introduction
For optimum accuracy when performing spectro-photometry of faint sources we require a multichannelsingle photon recording detector. A reticon S-series(scientific) linear silicon integrated photodiode array(IDA) is well suited for this purpose when used as thestorage terminal of a light amplifier formed by cou-pling a microchannel plate (MCP) intensifier via afiber optic window. Single photon detections are am-plified by the MCP, producing substantial signals incorresponding photodiodes. Thus low resolutionpulse counting electronics will reliably discriminatesingle photon pulses.
A photomultiplier tube (PMT) single photon re-cording system employing a single channel detector isused to record a spectrum by performing a sequence ofintegrations as a narrow monochromatic window ismechanically slewed through a software designatedwavelength partition. An IDA-based system, on theother hand, will record a geometrically stable pan-oramic view of the source spectrum with only oneexposure, reducing any drawbacks associated with thenonsimultaneity of data acquisition1 (e.g., star track-ing errors).
The author was with University of Queensland, Physics Depart-ment, St. Lucia, Q4067, Australia.
Additionally, S-series photodiode arrays with fiberoptic windows have a peak responsive quantum effi-ciency (RQE) of ,70%2 into the deep red, with goodresponse into the near IR and UV, whereas PMT pho-tocathodes have peak RQEs of some 20-30%3 in theUV. However, if we intensify the light signal with aMCP, the RQE of n25%3 for this device prevails.
When operating IDAs in the chilled reticon modesubject to the single readout philosophy,' the integra-tion times for astronomical spectroscopy of faintsources may range up to an hour.4 Hence the shorternet integration times associated with operating IDAsin the intensified mode5 represents a practical reduc-tion in precious telescope time and observer fatigue.The increased temporal resolution of recorded spectrais also important for the study of relatively faintsources undergoing rapid evolution (e.g., flare stars6
and other eruptive variables), and single photon re-cording also facilitates investigation of the most dis-tant cosmic sources.
The thermal current in a reticon S-series photodiodearray at room temperature2 is -10-ll A. At an inte-gration time of 10 ms this corresponds to a thermallyaccumulated charge of 106 (electron-hole) (e-h)pairs or 1% of Qsat [saturation charge 87.5(106) e-hpairs for S-series arrays]. This has an important de-sign implication: if the integration time is kept at <10ms when operating an IDA in the intensified mode,thermal leakage is negligible, and thus the massivecoldbox housing used to refrigerate the detector be-comes redundant. Lightweight reticon housings withstable shielded cables permit handheld wand imaging
systems, reducing the payload of orbiting observa-tories and overcoming the need to mount massive de-tector housings at the coude focuses of large telescopes.
My objective is to describe an IDA-MCP-basedmultichannel photoelectron counting system, outlin-ing its design and operational considerations for thepurpose of faint source astronomical spectrophoto-metry. Initial illustration of the system's perfor-mance includes installation in a 3-m Czerny-Turnermonochromator.
11. Single Photon Recording Approach
A. Front End Gain
Photodiode arrays are typically operating in the di-rect photon integrating mode without intensification.Vogt et al.1 gave the amplified video output potentialassociated with the ith pixel of the photodiode arrayoperated in the direct imaging mode as
SA. = (RQER,.NP, + NL,)ATGj + FPSi, (1)
where R tERi = responsive quantum efficiency of theith diode,
Npi = incident photon current,NLi = thermal leakage current,AT = integration time,Gj= amplifier gain for the jth video line,
having units of V/e-h pairs, andFPSi = fixed pattern signal caused by capaci-
tive coupling of clock transients ontothe video lines.
In this mode, FPS and thermal leakage may be sub-tracted from the incident photon component by per-forming a reference exposure on dark backgroundalone preceding the actual exposure. If thermal leak-age saturates elements in the array during an integra-tion (at room temperature this takes 10 s), it may bepractically eliminated by chilling the detector to nearits absolute minimum rating of -76°C.
Now consider the form Eq. (1) takes when we use aMCP to convert the diode array into the temporarystorage terminal of a multichannel light amplifier: theamplified video potential associated with the ith pixelof the array becomes
SA = (RQER.GMcp.RQEMcp.Np. + NL.)ATGj + FPSi, (2)
where the new quantities are GMCPi = the front endgain of photons produced by the MCP, and RQEMCpi =the responsive quantum efficiency of the MCP for theith diode.
A single photon recording is achieved when the frontend gain (FEG) is made so large that the number ofcascaded photons produced by a single photon enter-ing the detector is substantially greater than the num-ber of equivalent e-h pairs corresponding to reset noiseand the shot component of thermal leakage. But inthe interests of design simplicity we wish to abandonchilling and discriminate single photon events by usinglow resolution, low gain pulse counting electronics.Thus it is also desirable that the number of cascadedphotons produced by a single photon event should
substantially exceed the number of equivalent e-hpairs corresponding to FPS and thermal leakage. Forsuch a system we effectively have
RQER.GMcp.RQEMcp.Np, > NL,
RQER.GMCpiRQEMCpNpiATGj >> FPSi,
(3)
(4)
i.e., we may ignore the inconsequential quantities NLi,FPSi in Eq. (2).
Considering only the terms essential for calculatingthe amplitude of a single photon pulse, we now have
SA = RQERGMCpRQEMCpNpG/integratiOn, (5)
where Np is no longer a rate, and the subscripts ij havebeen dropped because we now average quantities overall pixels of the array. Expressing SA in terms of anequivalent charge of e-h pairs stored in the photodi-odes (instead of a potential), we ignore the video gain,letting G = 1.0 e-h pairs e-h pairs-', and because weare assuming the discrete case of a single photon detec-tion by the intensifier, or Np = /RQEMcp per shortintegration, the product RQEMCp Np = 1.0. This triv-ial reduction of Eq. (5) leads us to the number of e-hpairs generated in a photodiode due to a single photondetection by the MCP:
Se-h = RQERGMcp. (6)
To use a low resolution pulse counting circuit we re-quire that Se-h Qsat. Thus the FEG of a single stageMCP required for single photon recording should be
108, yet adequately compensating for RQEMCp. Butthe availability of contemporary technology may de-mand multistage intensification to achieve this photongain. For an n-stage intensifier, Eq. (6) becomes
Se-h = RQERG cpRQEtc.) (7)
Gruntman and Demchenkova7 report an amplificationfactor of i108 with a system of three MCPs. Never-theless, for lower but comparable FEGs, we need onlyamplify the video with signal processing circuitry and/or use an analog-to-digital converter (ADC) of suffi-cient resolution to discriminate the video pulses intosingle photon events. However, system noise limitsthe extent to which this more exacting and demandingtact may be taken.
B. Intensifier Noise
A MCP basically consists of a photocathode andphosphor screen with the space between filled by abundle of microscopic hollow glass tubes whose insidesare coated with a dynode-type multiplication surface.As such the device is analogous to a PMT, except that aMCP is a multichannel device. Both devices have acharacteristic room temperature dark current andvariations in gain, imposing limitations on operationand performance.
Thermionic emission caused by the thermal motionsof electrons in the photocathode is a principal source ofa dark current. Chilling the intensifier stage of thedetector will not be required if its dark current remainswell below a signal equivalent to one photodetection
channel integration-'. Assuming that this singlephotodetection corresponds to the accumulation of87.5(106) e-h pairs channel-' in the IDA, for FEG = 108and AT = 3.5 ms we require a dark current of<<4.6(10-5) pA channel- emanating from the MCPphotocathode or a dark current of <<4 nA channel-' atthe phosphor terminal.
These maximum dark currents compare favorablywith 1 nA for the order of magnitude of the darkcurrent at the anode of conventional PMTs. More-over, for a correct comparison between MCP and PMTwe must first divide the PMT anode current by thenumber of channels in the IDA and also allow for theattenuation of the dark current incurred by the RQE ofthe IDA and the electron multiplier-phosphor emis-sion interaction.
If, however, the equivalent dark current event rate iscomparable although smaller than the diode array scanrate, dark background exposure may be performed toremove photon counts produced by these phantomevents. When the equivalent dark current event rateequals the diode array scan rate, the actual signalcannot be recorded.
Statistical fluctuations in the FEG of the MCPtranslate into a substantial readout noise term in theamplitude of diode array video pulses, further restrict-ing the ultimate resolution of an ADC discriminatingvideo pulses into single photon counts. A detailedaccount of noise in PMTs including a derivation of thenoise contribution of its multiplier system is given bySchonkeren.8 By considering the statistical distribu-tion of incoming photons and the fluctuations in theconversion of photons to electrons, he obtains the shotnoise equation for the cathode current (assuming thatthe dark current is negligible):
ik = 2eIkAB, (8)
where Ik = cathode current,e = charge on an electron, and
AB = bandwidth.
The bandwidth is related to the integration time by AT= (2AB)- 1 . For the special case of an average of 1/RQEMcp photons being incident on the cathode duringan integration, we have Ik e/AT, and it is easy toreduce Eq. (8) to show that ikn = e/AT or 1 electronintegration-' regardless of bandwidth. Assumingthat one photoelectron has been ejected from the pho-tocathode, how will the multiplier system increase thenoise ikn?
The anode current of a PMT employing n dynodeseach possessing a secondary emission factor is givenby
Ia = 1kn, (9)
where the gain of the device is An. If the multipliersystem (the hollow glass tubes in the case of a MCP)contributed no noise, a comparison between Eqs. (8)and (9) would lead us to believe that the noise in theanode current is
i= 2eAB5 2n. (10)
But a statistical analysis of the emission of secondaryelectrons within the multiplier system, in which it isassumed that the probability of a primary electronreleasing m secondary electrons from a dynode followsa Poisson distribution, shows that the noise contribu-tion of the first dynode is
= 2ekAM. (11)
At this stage my analysis diverges from Schonker-en's because the dynode-type tubes of a MCP consti-tute a single stage amplifier (n = 1), and thus we neednot consider the noise contributions of higher-orderdynodes, as in the case of a PMT. My analysis shouldapply for MCPs, although as long as we consider thatthere are many anode currents because a MCP con-tains many dynode-type channels. Also note that inthis analysis if 4k is quantitized, being equivalent to sayone, two, or three electrons integration-, Eqs. (9) and(10) imply that I, and ian are also quantitized, althoughin packets equivalent to _'bn electrons integration'.
The total noise in the anode current is the sum of thecomponent of noise provided by fluctuations in thecathode current [Eq. (10)] and the component of noiseprovided by the multiplying system [Eq. (11)]:
an = 2eIkAB(62n + ). (12)
A comparison between Eqs. (10) and (12) shows thatthe multiplier system increases the noise in the outputcurrent by a factor of 0:
O(n,6) = (n + 6,)/62n. (13)
This factor also represents an increase in noise attrib-utable to statistical fluctuations in the intensifier gain.For a MCP, n = 1, and using a gain An = 104, 0 (n,6) =1.0001, or a 0.01% increase in noise. Clearly the multi-plier system of a MCP is virtually noise free and, whenused to intensify single photon events for subsequentstorage by an IDA, should have little bearing on theaccuracy of single photon discrimination.
More significant variations in intensifier gain areproduced by changes in the operating temperature andsupply potential. However, as a rule, gain variationsdo not exceed a few tenths of a percent 'C-' for PMTs,but their gain is critically dependent on the multiplierpotentials. For a single stage MCP its gain is directlyproportional to the multiplier potential, and thus astable power supply is essential. Drifts in gain due tophysical changes within the intensifier during opera-tion and rapid shifts in gain resulting from changes inthe incident photon flux may also be a problem.
C. Performance
The detective quantum efficiency (DQE) gives arealistic measure of system performance. It is definedas
DQE -(S/N)2 (S/N)? (14)
where (S/N), = the signal to noise ratio of the outputsignal, and (S/N)i = the signal to noise ratio of the
input signal. For a perfect detector this quantityshould equal unity: the recorded signal replicates in-put shot noise (NpAT)112.
Vogt et al. 1gave the DQE for an IDA operating in thechilled reticon mode without intensification as
DQER = RQER (15)1 + (2U2)/(RQERNpAT) 11
/2
where a is the system rms readout noise, typically103 e-h pairs, and thermal leakage is negligible be-
cause of chilling. For high total photon incidences(>>106), the readout noise term in the denominator,(2U2)/(RQERNPAT) - 0, and thus
DQER RQER = 70% at X7500 A. (16)
Clearly, for either short integrations on brilliantsources, or long integrations on faint sources (i.e., hightotal exposures), the performance of the reticon in thechilled mode is excellent. Indeed, high light levelprecision spectra have been recorded by Livingston etal.4
But for optimum spectrophotometry of faint sourceswe require rapid single photon counting, and for astro-nomical observations this can mean Np - 100 photonsduring a short integration. Since a- 103 e-h pairs,the DQE - 0 as Np - 0. For single photon counting inthe chilled reticon mode with unity exposures we havea very poor performance indeed:
DQER 10-5% at X7500 A (17)
Integrations lasting numerous hours may be requiredto achieve a high total photon incidence for very faintsources. This is altogether undesirable because of theresultant observer fatigue and the need to stabilize theRQE and thermal leakage pattern of the reticon atcryogenic temperatures for prolonged periods.
The solution is to operate the IDA in the intensifiedmode, especially if the FEG is sufficient to make thedetector a single photon integrating diode array(SPIDA), which approaches the ideal of a truly noise-less amplifier. The input SNR is again just shot noise(NpAT) 1/2, and because we are counting single photonswe ignore readout noise 2/2a and statistical fluctua-tions in FEG, the sum of which is negligible comparedto the amplitude of a single photon pulse [a 103 +FEG (0 - 1) = 104 e-h pairs vs Qsat 108 e-h pairs].Thus the output SNR (RQEMCpNpAT)'/2 is also shotlimited, and Eq. (14) gives
DQEMcP = RQEMcp = 25%. (18)
The performance is not quite as good as for imagingbright sources in the chilled reticon mode [Eq. (16)],but comparing Eqs. (17) and (18), we see that theincreased photometric accuracy attained for imagingfaint sources within practical integration times is para-mount.
D. Dynamic Range
Although it takes -87.5(106)/0.70 red photons tosaturate an S-series photodiode, in practice the systemreadout noise consisting of reset noise, the shot compo-
nent of thermal noise, and amplifier (circuit) noiserestricts the accessible dynamic range to 1:104 for asingle integration in the chilled reticon mode.2 But forbright sources we may sum the counts for many scansand thus further increase this already acceptable dy-namic range.
However, the use of an intensifier to record faintsources will cause a reduction in the accessible dynam-ic range during any one integration. Assuming read-out noise (including shot intensifier noise) is <<FEG,the accessible dynamic range of the detector becomes1:87.5(106 )/FEG.
When the FEG is sufficient to cause a single photondetection by the MCP to saturate an element of thearray, the detector becomes a SPIDA, and the dynamicrange is two. After any one integration all spectropho-tometric counts consist of Schmitt trigger 0/1-typecounts, and the recorded spectrum is very crude. Thedynamic range in the image is synthesized by using arapid scanning technique-the 0/1 counts for a succes-sion of many short integrations are added. The dy-namic range will be restricted by the number of scansperformed and thus in practice by the availability ofcomputer memory. The more scans the better, be-cause sampling statistics tells us that the relative errorwill decrease.
The shortest possible integration time is also de-sired, not only to reduce the net integration time, andthereby reduce the experimental fatigue associatedwith achieving a given photometric accuracy, but toensure that the array scan rate matches or preferablysupercedes the incident photon rate, permitting singlephoton integrations. If the incident photon rate is stilltoo high, it must be reduced with neutral density filtersuntil it either matches or preferably undercuts thescan rate.
111. Description of the System
Figure 1 is a block diagram of the system, which insimplest terms constitutes a 1-D electronic camera.The diagram encompasses a layout of evaluation andanalysis circuitry.
A. Coldbox
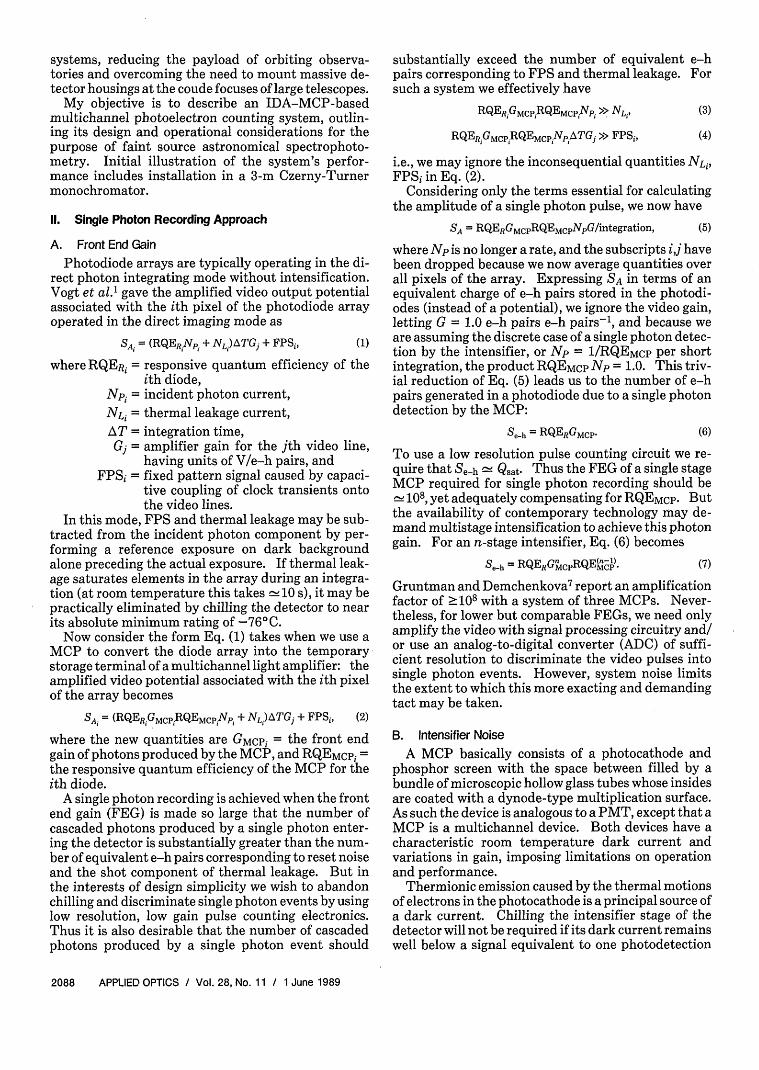
An auxiliary coldbox (Fig. 2) similar to that of Vogtet al.' was constructed for refrigerating the IDA tocombat thermal leakage when operating the system atlong integration times without intensification. Withsufficient FEG the coldbox is obsolete. Its mass issome 10 kg.
The reticon array is connected to a copper cold probevia an electrically insulative heat sink, SIL PAD 400,manufactured by Berquist. The cold probe is chilledby adjusting an aspirator fitted to a laboratory watertap and drawing liquid N2 ( = -196°C) from a ther-maflask through a spiral of copper tubing hugging theprobe. The temperature of the copper cold probedrops at _3°C/min.
External tubing is well insulated by a layer of foamrubber wrapped in sheets of sisalation, all bound withmasking tape. The aluminum coldbox housing is
' SI & 52 select SPC or MED modes of video analysis. H IPoICRO L.. Murray Parkinsn 1967
Fig. 1. Block diagram of the 1-D electronic camera. The diagram outlines the layout of a signal timing circuit to drive the array andsynchronize data acquisition (top) and a signal processing circuit to prepare video pulses for a subsequent analysis and interface (bottom).
Computer control is outlined at right.
filled with insulative polyurethane foam. The mas-sive cold probe with thick encompassing insulationgives the IDA thermal inertia by isolating it from theambient laboratory environment.
A cold chamber sealed with a quartz evacuated win-dow and purged with dry N2 prevents hazardous con-densation forming on the detector. At deep cryogenictemperatures, condensation forming on the exteriorsurface of the quartz window is eliminated with a hairdryer. However, deep chilling is not recommendedbecause of possible damage to the expensive reticonchip. Indeed, it appears that even pixels of our arrayhave ceased to function after prolonged chilling withliquid N2 -
The light tight filter box merely consists of an anod-ized aluminum chamber housing various combinationsof aluminized microscope slides employed as neutraldensity filters. They service the intensified mode byreducing bright source incident photon rates until theyare comparable to one photon/integration, thus per-mitting single photon recording.
B. Evaluation Circuit
DETECTOR CLK (clock) for the signal timing portionof the evaluation circuit (Fig. 1) is derived from either astable variable frequency signal generator or thelatched 1-MHz computer enable clock. It is fed to aMOS 40 clock driver and start pulse generator, whichprovides timing signals driving the reticon IDA at DE-
TECTOR CLK/4 Hz.
The integration time, or lapse between start pulses,is manually adjusted by a 10-bit DIL switch time con-trol. Start pulses are not issued from computer con-trol because this would introduce an unnecessary delaybefore readouts, increasing the integration time whichmust be minimized.
Odd and even recharge video lines of the IDA areamplified by discrete JFET charge sensitive preampli-fiers before analog multiplexing. Direct current levelshifting amplifiers serve to bring the video pulse trainswithin the appropriate range of an ADC, protected by avoltage limiter consisting of high frequency diodes.Analog buffers isolate the effects of gain adjustmentson different amplifiers.
Because this system was designed for single photoncounting, comparatively less attention was paid to thecircuit's linearity and available dynamic range. Forthis reason also, FPS was not subtracted by amplifyingthe difference between actual and dummy videos.
The required available dynamic range for singlephoton counting is only two, but if an n-bit ADC isused for analysis of the video pulse, the available dy-namic range must be in excess of 2n:1.
C. Analysis Circuit
The purpose of the analysis circuit is to interpretanalog video pulses, converting them into digital pho-ton counts appropriate for the computer interface.The two available options for analyzing the video are
Fig. 2. Auxiliary coldbox facility for chilling the IDA.
selected by simultaneous adjustment of two mechani-cal switches.
The single photon counting (SPC) mode of analysisis a Schmitt trigger 0/1-type analysis accomplishedwith an Amptec A-101 PAD hybrid charge sensitivepreamplifier discriminator, delivering TTL outputpulses. For a single photon integration the detector'sFEG must be sufficient to produce a video pulse com-parable to saturation amplitude. Thus as the IDA israpidly scanned the A-101 PAD will sense the presenceof saturation video pulses and for corresponding pho-todiode pixels deliver a count of one photon. Other-wise the count will be zero photons.
The Multiple event discrimination (MED) mode ofanalysis is accomplished with a TRW 4-bit flash ADC.If the FEG of the MCP is insufficient to produce singlephoton video pulses comparable to saturation ampli-tude, single photon events may be discriminated by anADC. For an n-bit ADC, the FEG must be lowereduntil it takes (2n - 1) photodetections during a shortintegration to produce a video pulse comparable tosaturation amplitude. Then the ADC digital countwill be the number of photodetections during the scan.
The MED mode of analysis is a technique of preserv-ing dynamic range within the bounds of the single
photon counting approach. It is an alternative ap-proach to SPC analysis, in which supersaturation ofphotodiodes by multiple events is prevented by reduc-ing the incident photon rate with neutral density fil-ters. The use of an ADC will also give increased per-formance when the FEG is too small for discriminationof single photon events by low gain pulse countingelectronics.
In both modes of analysis, the dynamic range in therecorded image is synthesized by repeated scanning.Assuming that shot-limited performance is attained,sampling statistics will determine the scatter in data.For N scans, the SPC mode will deliver scatter - (N) 12and the MED mode employing an n-bit ADC will deliv-er scatter K [(2n - 1) X N] 1 /2
D. Computer InterfaceThe computer performing data acquisition, storage,
and display is a PDQII installed in an Applelle hostcomputer. The PDQII consists of a 32/16-bitMC68000 coprocessor and 256K RAM expansion tothe Applelle 8-bit 6502 processor. The 10-MHz clockof the PDQ gives an order of magnitude increase in thesystem's data acquisition rate over the previous gener-ation of personal computers.
A PDQII-reticon asynchronous interface circuit wasdesigned to give a high data acquisition rate and thus asmall integration time suitable for single photon re-cording. Assembly language instructions were care-fully chosen to keep individual read, add, and storecycles to a minimum of 33 PDQ clocks at 10 MHz,giving a data acquisition rate of 300 kilosamples persecond (kSPS) when DETECTOR CLK = 1.2 MHz.
Allowing a short delay for software to catch a startpulse, the integration time AT for a 1024-element ar-ray is 3.5 ms, accommodating incident photon rates of1140 quanta/s/diode (taking RQEMCp = 25%). An128-element array will give AT 0.6 ms accommodat-ing incident photon rates of 4000 quanta/s/diode.
E. Control Software
Applesoft PDQBASIC programs manage assemblylanguage data acquisition routines subject to particu-lar experimental methodologies, storing, processing,and displaying spectral data as necessary. In general,images are corrected for pixel to pixel variations insensitivity by a routine dividing raw data by the resultsof a reference exposure on a diffuse, flat field, whitelight source. Pixel to pixel variations in sensitivity formy system were measured to be as much as 4.8%.
When performing multicolor spectrophotometry,the absolute response of the system at different wave-lengths to a standard source of known relative spectralradiance must be obtained. Thus software managesanother reference exposure, this time on a tungstenstandard lamp, recording data used to correct spectralimages for the system's transfer function. For exam-ple, PCC 3M (photon counting control, 3-m monochro-mator) was specifically written to manage the dataacquisition procedure with a 3-m monochromator.
BACKGROUND SUBTRACT and SMOOTH CURVE areroutines which perform their namesake, and AVERAGECOUNT is a simple routine which averages the videocount across all pixels of the array for all integrations,making the system a powerful photometric instru-ment.
IV. Testing the System
A. Line Scanning
The unintensified diode array was used as a linescanner to record 1-D monochromatic images of theworld. The bandwidth of images was primarily deter-mined by the reticon's frequency response, and only tothis extent are they monochromatic. For sources suf-ficiently bright to permit short integrations, operationof the system in the intensified mode is illustrated, andthis was done because funds for the purchase of a MCPwere not forthcoming during the term of this work.
Shadows cast by drill bits illuminated with a Philips4.8-V torch bulb were imaged by performing 103scans at AT = 3.5 ms (Fig. 3). Because thermal leak-age at room temperature during this interval is - 105e-h pairs (0.2% of Qsat), chilling the detector was un-necessary. However, a reference exposure on a diffuseflat field source was performed to correct pixel to pixelvariations in sensitivity. Both SPC and MED modes
1.0
TQ
'U
'a
0-
~0
0 5
(/)
0a-
Y)
0
FN: DRILL BITS 18/8/87
100 500CHANNEL
TRWI044/PCC 2
900
Fig. 3. Image of drill bit shadows recorded using the MED circuit.The diode array was operated with chilling or intensification, and a10,000 scan reference exposure corrected pixel to pixel variations insensitivity, measured to be as much as 4.8%. This compares with
2.2% for the size of scatter associated with scanning the array 2000times.
of analysis were employed, although, because intensifi-cation was absent, the single photons producing satu-ration video pulses were actually - 108 photons.
B. Array Emulation
The leading edge of DMPXR of SAMPLES synchro-nized with latched video counts (Fig. 1) acts theDTACK (data transfer acknowledge)-read cycle timingsignal for the MC68000 processor, which will automati-cally insert wait states in its read cycles until the recep-tion of this signal. The array scan rate need not per-fectly match the data acquisition rate determined bysoftware.
By setting the scan rate to a frequency higher thanthe data acquisition rate, a shorter integration timewill result. As an approximation, the scan rate mustbe x-times faster than the data acquisition rate to givean x-fold reduction in integration time, but only everyxth photodiode is sampled. Thus this technique willemulate an array of N/x photodiodes spanning thesame physical length of a completely sampled array ofN elements.
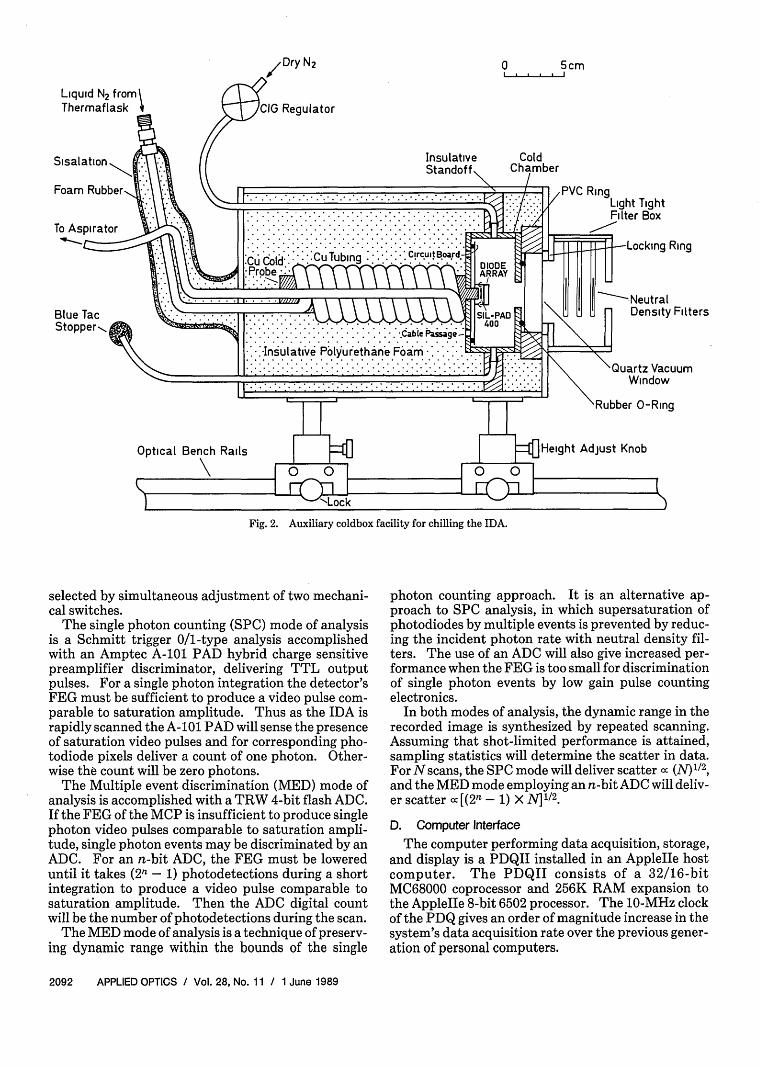
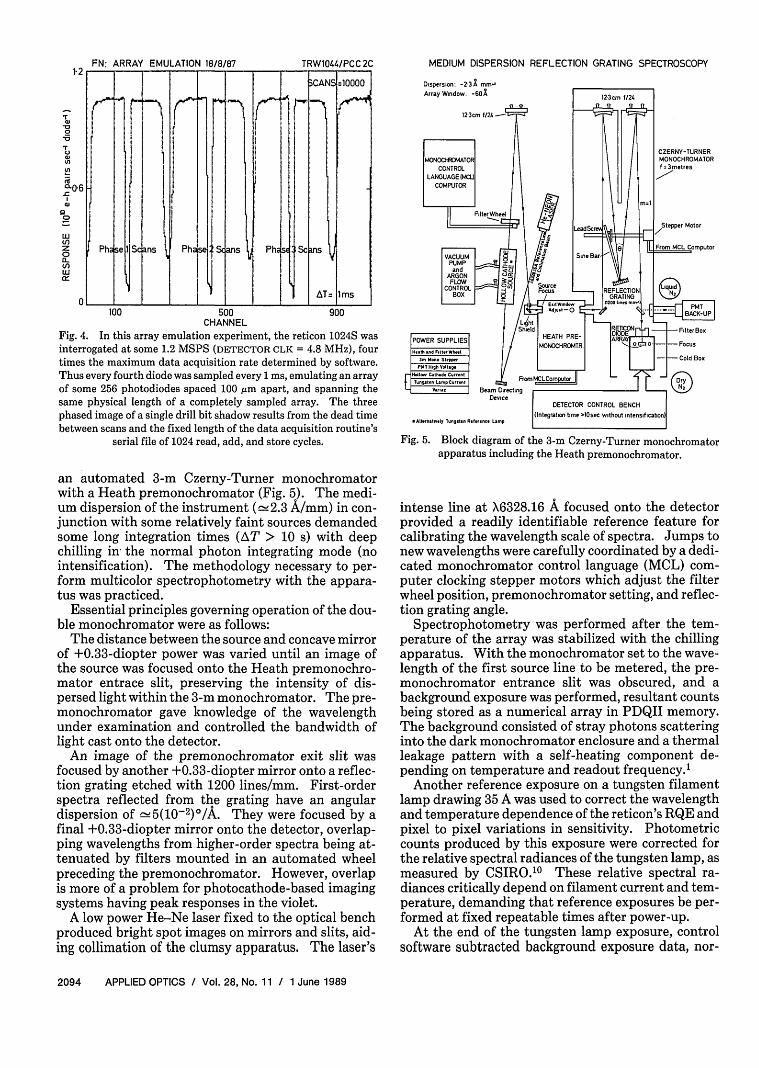
Drill bit shadows were also imaged using array emu-lation at an interrogation rate of 1.2 MSPS (DETEC-TOR CLK = 4.8 MHz), giving AT 1 ms (Fig. 4).EG&G reticon 9 claims that their S-series arrays can bedriven at 5 MSPS, imposing a practical limit to theminimum integration time possible using this tech-nique. But note that unless a short integration time iscritical for a particular application, the advantage ofarray emulation is marginal because temporal resolu-tion is increased at the expense of spatial resolution.
C. Reflection Grating Spectroscopy
The fully illuminated IDA imaged a 60-A bandwidthof the optical spectrum when installed at the focus of
Fig. 4. In this array emulation experiment, the reticon 1024S wasinterrogated at some 1.2 MSPS (DETECTOR CLK = 4.8 MHz), fourtimes the maximum data acquisition rate determined by software.Thus every fourth diode was sampled every 1 ms, emulating an arrayof some 256 photodiodes spaced 100 am apart, and spanning thesame physical length of a completely sampled array. The threephased image of a single drill bit shadow results from the dead timebetween scans and the fixed length of the data acquisition routine's
serial file of 1024 read, add, and store cycles.
an automated 3-m Czerny-Turner monochromatorwith a Heath premonochromator (Fig. 5). The medi-um dispersion of the instrument ( 2.3 A/mm) in con-junction with some relatively faint sources demandedsome long integration times (AT > 10 s) with deepchilling in' the normal photon integrating mode (nointensification). The methodology necessary to per-form multicolor spectrophotometry with the appara-tus was practiced.
Essential principles governing operation of the dou-ble monochromator were as follows:
The distance between the source and concave mirrorof +0.33-diopter power was varied until an image ofthe source was focused onto the Heath premonochro-mator entrace slit, preserving the intensity of dis-persed light within the 3-m monochromator. The pre-monochromator gave knowledge of the wavelengthunder examination and controlled the bandwidth oflight cast onto the detector.
An image of the premonochromator exit slit wasfocused by another +0.33-diopter mirror onto a reflec-tion grating etched with 1200 lines/mm. First-orderspectra reflected from the grating have an angulardispersion of 5(102)o/A. They were focused by afinal +0.33-diopter mirror onto the detector, overlap-ping wavelengths from higher-order spectra being at-tenuated by filters mounted in an automated wheelpreceding the premonochromator. However, overlapis more of a problem for photocathode-based imagingsystems having peak responses in the violet.
A low power He-Ne laser fixed to the optical benchproduced bright spot images on mirrors and slits, aid-ing collimation of the clumsy apparatus. The laser's
MEDIUM DISPERSION REFLECTION GRATING SPECTROSCOPY
Dispersion: -2-3X mmArray Wi.dow: -601
Fig. 5. Block diagram of the 3-m Czerny-Turner monochromatorapparatus including the Heath premonochromator.
intense line at X6328.16 A focused onto the detectorprovided a readily identifiable reference feature forcalibrating the wavelength scale of spectra. Jumps tonew wavelengths were carefully coordinated by a dedi-cated monochromator control language (MCL) com-puter clocking stepper motors which adjust the filterwheel position, premonochromator setting, and reflec-tion grating angle.
Spectrophotometry was performed after the tem-perature of the array was stabilized with the chillingapparatus. With the monochromator set to the wave-length of the first source line to be metered, the pre-monochromator entrance slit was obscured, and abackground exposure was performed, resultant countsbeing stored as a numerical array in PDQII memory.The background consisted of stray photons scatteringinto the dark monochromator enclosure and a thermalleakage pattern with a self-heating component de-pending on temperature and readout frequency.'
Another reference exposure on a tungsten filamentlamp drawing 35 A was used to correct the wavelengthand temperature dependence of the reticon's RQE andpixel to pixel variations in sensitivity. Photometriccounts produced by this exposure were corrected forthe relative spectral radiances of the tungsten lamp, asmeasured by CSIRO.10 These relative spectral ra-diances critically depend on filament current and tem-perature, demanding that reference exposures be per-formed at fixed repeatable times after power-up.
At the end of the tungsten lamp exposure, controlsoftware subtracted background exposure data, nor-
Fig. 6. Three mercury vapor lines recorded at nX4358 A with thedeeply chilled IDA installed in the 3-m monochromator. The inte-gration time was 52 s for this eight-scan spectrum corrected by a five-scan exposure on background and a five-scan exposure on a tungstenstandard lamp. The two brightest peaks are at supersaturationintensity levels, well beyond the detector's saturation level. Thescatter associated with performing only eight scans in the MEDmode of analysis is +±11%, this error further increasing after data
processing.
malized the remaining data, then stored it as a numeri-cal array of scaling factors. Then the tungsten lampwas exchanged for the spectral source and the sourceexposure was performed, the resultant data being cor-rected by a routine which first subtracts background,then divides by the normalized tungsten lamp re-sponse. With scaling factors noted for later data re-duction, the monochromators were instructed to jumpto the wavelength of the next source line to be metered,whereupon the entire procedure was repeated. Thisincluded a new set of updated reference exposures.
Line intensity ratios for a laboratory mercury vaporlamp (Fig. 6) were measured following this procedure.Some initial results peculiar to our source are as fol-lows:
A5460.742 A 6 8X 5460.742 A 6 0 X5460.742 A 2.0. (13)A5769.598 A ; X5790.659 A ; X4358.343 A
These measurements should not be taken too serious-ly. The IDA-based imaging system designed here forrapid scanning, short, single photon integrations per-formed poorly as a spectrophotometer when operatedat long integration times without intensification: thismode is the providence of the single readout philoso-phy' with high ADC resolution. Repeated integra-tions at 13 s were required here to obtain unreliablephotometric measurements with the monochromator.Instability in the temperature of the array during longintegrations and condensation on the quartz windowboth introduced errors in the measurements and wereconstantly checked. Moreover, the RQE of a reticonarray is dependent on temperature.'
01500
C-)
0 100 t 4 TR TRANS ± -5%
0E. CCOUNT = 57
500 -4--
0 05 10TRANSMITTANCE I
1/1
SAT)
Fig. 7. Initial investigation of the system's linearity shown with aleast-squares best fit. The largest source of error in the measure-ment is due to uncertainty in the transmittance of neutral densityfilters controlling the relative intensity. Nevertheless, these dataindicate that system linearity is quite sufficient for primitive SPC
and MED analysis.
Operating an IDA in the intensified mode eliminatesphotometric errors and experimental fatigue associat-ed with deep chilling. Data acquisition times for faintsources are reduced from hours to seconds.
D. Linearity
By using various combinations of neutral densityfilters of known absorptivity, the intensity of lightincident on the detector could be controlled. Plottingthe photometric count produced by the system againsttransmittance (Fig. 7) illustrates the linearity of thesystem (i.e., including signal processing circuitry).
The illumination provided by distant fluorescenttubes was adjusted to give saturation video pulses for100% transmittance, then subsequently attenuated byvarious combinations of neutral density filters. Pho-tometric counts consisted of the average ADC countfor 512 channels during 1000 scans. Although the 4-bit ADC was operated at less than optimum perfor-mance, the uncertainty in filter absorptivities was thelargest source of error in this initial investigation giv-ing a 15% average departure of data from the least-squares best fit.
Substantial nonlinearities can be a problem for highresolution ADC, single readout analysis without inten-sification, although inconsequential for low resolutionSPC or MED analysis in which the intensifier's highgain causes video output potentials to be quantitizedinto discrete single photon levels comparable to satu-ration amplitude.
E. Peak Response
The normalized transfer function of a diode array ismodified by the addition of atmosphere, neutral densi-ty filters, a quartz evacuated window, MCP, and a fiberoptic window into the optical path. As mentioned, the
Fig. 8. Peak sensitivity of the photodiode array with a fiber opticwindow measured using the 3-m monochromator. Deep chillingwasrequired to record the tungsten lamp source without an intensifier.
response of a diode array also varies with temperature.A shift in peak sensitivity may result if any element ofthe imaging system produces a gross modification ofthe system's response.
Figure 8 is the response of the deeply chilled arraymeasured at the focus of the 3-m monochromator.The tungsten filament lamp was the source imagedthrough a 50% absorptivity filter at AT = 13 s. Eachresponse measurement was obtained by taking theaverage difference between five scans of the tungstenlamp and five scans on background across 512 channelsof the array. The bandwidth of individual measure-ments was 60 A.
The measured peak sensitivity at X7400 A comparesfavorably with the typical value of X7500 A given byReticon Corp.2 for their S-series photodiode arrayswith fiber optic windows.
V. Conclusion
With sufficient amplification of light provided by aMCP, a diode array-based imaging system employinglow resolution pulse counting electronics can reliablydiscriminate single photon events and thus give shot-
limited performance. The system described here ischaracterized by simple circuit layout. Only Schmitttrigger 0/1-type discrimiantion of video pulses is re-quired when FEG 108.
Fast interrogation rates are required to ensure singlephoton integrations and eliminate thermal leakage.For still brighter sources, the incident photon ratemust be attenuated with neutral density filters. Inthese conditions the statistics of randomly arrivingphotons should prevail in the recorded signal.
Operation of a system designed for this purpose hasbeen illustrated by using the diode array as a linescanner repeatedly performing 3.5-ms integrations at a300-kSPS interrogation rate. Purchase of a MCP willgive the system a good DQE for low total exposures,making it ideal for applications such as low light levelspectrophotometry with monochromators and spec-troscopes mounted at the focus of optical telescopes.
Discussions with J. Ross and P. Wolfs, among othersat the University of Queensland, were invaluable.The helpful suggestions on interfacing the PDQII by C.Arena, president of Enhancement Technology Corp.,are highly appreciated.
References1. S. S. Vogt, R. G. Tull, and P. Kelton, "Self-Scanned Photodiode
Array: High Performance Operation in High Dispersion Astro-nomical Spectrophotometry," Appl. Opt. 17, 574-592 (1978).