PNNL-22984 Prepared for the U.S. Department of Energy under Contract DE-AC05-76RL01830 Single-Step Syngas-to-Distillates (S2D) Synthesis via Methanol and Dimethyl Ether Intermediates: Final Report Conducted under the National Advanced Biomass Consortium Program RA Dagle VMC Lebarbier JA Lizarazo-Adarme DL King Y Zhu MJ Gray SB Jones MJ Biddy RT Hallen Y Wang JF White JE Holladay DR Palo November 2013
Transcript
PNNL-22984
Prepared for the U.S. Department of Energy under Contract DE-AC05-76RL01830
Single-Step Syngas-to-Distillates (S2D) Synthesis via Methanol and Dimethyl Ether Intermediates: Final Report Conducted under the National Advanced Biomass Consortium Program RA Dagle VMC Lebarbier JA Lizarazo-Adarme DL King Y Zhu MJ Gray SB Jones MJ Biddy RT Hallen Y Wang JF White JE Holladay DR Palo November 2013
PNNL-22984
Single-Step Syngas-to-Distillates (S2D) Synthesis via Methanol and Dimethyl Ether Intermediates: Final Report Conducted under the National Advanced Biomass Consortium Program RA Dagle1 VM Lebarbier1 JA Lizarazo-Adarme1 DL King1 Y Zhu1 MJ Gray1 SB Jones1 MJ Biddy2 RT Hallen1 Y Wang1 JF White1 JE Holladay1 DR Palo1 November 2013 Prepared for the U.S. Department of Energy under Contract DE-AC05-76RL01830 Pacific Northwest National Laboratory Richland, Washington 99352
1 Pacific Northwest National Laboratory 2 National Renewable Energy Laboratory
iii
Executive Summary
The objective of the work was to enhance price-competitive, synthesis gas (syngas)-based production of transportation fuels that are directly compatible with the existing vehicle fleet (i.e., vehicles fueled by gasoline, diesel, jet fuel, etc.). To accomplish this, modifications to the traditional methanol-to-gasoline (MTG) process were investigated. Originally pioneered by Mobil, the MTG process was revolutionary; however, it proved to be uneconomical when initially developed. Because the chemistry is based on shape-selective catalysis, MTG has the potential to produce fuel streams that require very little downstream modification. The Fischer-Tropsch process, on the contrary, requires extensive catalytic modification and cracking to produce useful and proper fuel range products. Combining methanol synthesis and MTG in a single bed also has some potential to be economically advantageous. Implications for the temperature and pressure requirements in a combined system as compared to conventional methanol synthesis and MTG processes are shown in Figure ES.1.
Figure ES.1. Merging the Methanol Synthesis (high pressure, low temperature) Process with the MTG Process (low pressure, higher temperature). Merging the two processes leads to the combined synthesis-to-distillates process that operates at high temperature and high pressure. Different catalyst functionalities also are required for both the methanol synthesis and MTG processes.
In this study, we investigated direct conversion of syngas to distillates using methanol and dimethyl ether intermediates. For this application, a Pd/ZnO/Al2O3 (PdZnAl) catalyst previously developed for methanol steam reforming was evaluated. The PdZnAl catalyst was shown to be far superior to a conventional copper-based methanol catalyst when operated at relatively high temperatures (i.e., >300°C), which is necessary for MTG-type applications. Catalytic performance was evaluated through parametric studies. Process conditions such as temperature, pressure, gas-hour-space velocity, and syngas feed ratio (i.e., hydrogen:carbon monoxide) were investigated. PdZnAl catalyst formulation also was optimized to maximize conversion and selectivity to methanol and dimethyl ether while suppressing methane formation. This was accomplished by adjusting the acid and base functionality of the catalyst. PdZn-metal sites are necessary for methanol synthesis. Alumina substrate not only plays the role of
iv
textural support but also offers acidic sites useful for the dehydration of methanol to dimethyl ether. Manipulation of the Pd:Zn molar ratio and total PdZn-metal loading were shown to greatly affect catalytic performance. Thus, a PdZn/Al2O3 catalyst optimized for methanol and dimethyl ether formation was developed through combined catalytic material and process parameter exploration. However, even after compositional optimization, a significant amount of undesirable carbon dioxide was produced (formed via the water-gas-shift reaction), and some degree of methane formation could not be completely avoided.
Pd/ZnO/Al2O3 used in combination with ZSM-5 was investigated for direct syngas-to-distillates conversion. High conversion was achieved as thermodynamic constraints are alleviated when methanol and dimethyl are intermediates for hydrocarbon formation. When methanol and/or dimethyl ether are products formed separately, equilibrium restrictions occur. Thermodynamic relaxation also enables the use of lower operating pressures than what would be allowed for methanol synthesis alone. Aromatic-rich hydrocarbon liquid (C5+), containing a significant amount of methylated benzenes, was produced under these conditions. However, selectivity control to liquid hydrocarbons was difficult to achieve. Carbon dioxide and methane formation was problematic. Furthermore, saturation of the olefinic intermediates formed in the zeolite, and necessary for gasoline production, occurred over PdZnAl. Thus, yield to desirable hydrocarbon liquid product was limited. Evaluation of other oxygenate-producing catalysts could possibly lead to future advances. Potential exists with discovery of other types of catalysts that suppress carbon dioxide and light hydrocarbon formation.
Comparative techno-economics for a single-step syngas-to-distillates process and a more conventional MTG-type process were investigated. Results suggest operating and capital cost savings could only modestly be achieved, given future improvements to catalyst performance. Sensitivity analysis indicated that increased single-pass yield to hydrocarbon liquid is a primary need for this process to achieve cost competiveness. However, even given future technological improvements, combining methanol and dimethyl ether synthesis with zeolite conversion appears to yield only modest cost-improvement potential over the benchmark MTG process. Thus, it may be more fruitful to evaluate other routes for the production of gasoline from biomass (e.g., fast pyrolysis, etc.). Alternatively, evaluating novel technologies that might yield higher quality fuel blends such as those useful for jet and/or diesel may provide more economic incentive.
v
Acknowledgments
The authors would like to acknowledge that initial work on this concept funded through the Energy Conversion Initiative at Pacific Northwest National Laboratory. The bulk of this work was supported by the National Advanced Biofuels Consortium which is funded by the U.S. Department of Energy’s Office of Biomass Program with recovery act funds. PNNL work was conducted under U.S. Department of Energy contract DE-AC05-76RL01830. The facilities of the Microproducts Breakthrough Institute in Corvallis, Oregon, were utilized for the mixed catalyst bed experiments. Finally, the authors would like to acknowledge that a portion of this work was done in the William R. Wiley Environmental Molecular Sciences Laboratory (EMSL), a Department of Energy-sponsored scientific user facility located at Pacific Northwest National Laboratory.
vii
Acronyms and Abbreviations
C2+ species containing at least two carbons
CHydrocarbon hydrocarbon carbon-containing species
Coxy oxygenate carbon-containing species
CH4 methane
CO carbon monoxide
CO2 carbon dioxide
Cu copper
CuZnAl copper zinc alumina
DOE U.S. Department of Energy
FT Fischer-Tropsch
GC gas chromatograph
GGE gallons of gasoline equivalent
GHSV gas-hourly space velocity
H2 hydrogen
IR infrared
LPG liquid petroleum gas
MTG methanol-to-gasoline
MTO methanol-to-olefins
MOGD Mobil’s olefins-to-gasoline/distillate
N2 nitrogen
NABC National Advanced Biomass Consortium
Pd palladium
PdZn palladium-zinc alloy
PdZnAl palladium-zinc alloy supported on Al2O3
Pt platinum
PNNL Pacific Northwest National Laboratory
S2D syngas-to-distillates
STEM scanning transmission electron microscopy
syngas synthesis gas
TCD thermal conductivity detector
TPD temperature programmed desorption
XRD x-ray diffraction
Zn zinc
ix
Contents
Executive Summary .............................................................................................................................. iii
Acknowledgments ................................................................................................................................. v
Acronyms and Abbreviations ............................................................................................................... vii
Appendix A .................................................................................................................................... A.1
Appendix B .................................................................................................................................... B.1
Appendix C .................................................................................................................................... C.1
Appendix D .................................................................................................................................... D.1
xi
Figures
1.1 Comparing the Process Flow Schematics for Conventional MTG (“Base Case”) with the Single-Step Syngas-to-Distillates (S2D) Process Described in this Study ................................ 1.2
2.1 Pressurized Fixed-Bed Flow Reactor Test Stand ...................................................................... 2.4
2.2 Conceptual Flow Diagram of Biomass-Gasification-Based Single-Step S2D System ............. 2.6
2.3 Conceptual Flow Diagram of Biomass-Gasification-Based Conventional Two-Step S2D System ....................................................................................................................................... 2.7
3.1 XRD Patterns for the Spent Pd/ZnO/Al2O3 Catalysts. .............................................................. 3.2
3.2 Pd/ZnO/Al2O3 Catalysts Analyzed using STEM ....................................................................... 3.3
3.3. Infrared Spectra Recorded ......................................................................................................... 3.4
3.4 Equilibrium CO Conversion ...................................................................................................... 3.5
3.5 Evolution of CO Conversion with Time On-Stream for the Cu/ZnO/Al2O3 and the 8.8P/ZnO/Al2O3-0.38 Catalysts ................................................................................................. 3.6
3.6 Conversion and Selectivity as a Function of Temperature ........................................................ 3.7
3.9 Evolution of Conversion and Selectivity Relative to the Pd:Zn Molar Ratio............................ 3.12
3.10 Evolution of DME Selectivity and Amount of NH3 Desorbed from the Catalysts Surface as a Function of (a) Pd:Zn molar ratio and (b) Pd loading ............................................................ 3.12
3.11 Evolution and Product Selectivity as a Function of Pd Loading ............................................... 3.13
3.12 Effect of Feed Gas Composition on (a) Conversion and (b) Selectivity for the 5Pd/ZnO/Al2O3-0.25 Catalyst. ................................................................................................... 3.14
2.3 Major Inputs and Assumptions of the Synthesis Reactor(s) for All Three Cases ......................... 2.8
3.1 Catalyst Compositions and Textural Properties ............................................................................ 3.1
3.2 Particle Sizes of the Pd/ZnO/Al2O3 Catalysts Determined by XRD and Dispersion Measurements ............................................................................................................................... 3.2
3.3 Effect of Temperature, Pressure, and GHSV on Conversion and Selectivity for the 8.8Pd/ZnO/Al2O3-0.38 Catalyst .................................................................................................... 3.7
4.1 Results for Methanol Feed Hydrogenation Comparison Studies. ................................................. 4.3
4.2 Catalytic Performance Comparison between Two Different Pd/ZnO/Al2O3 Methanol Catalysts ........................................................................................................................................ 4.12
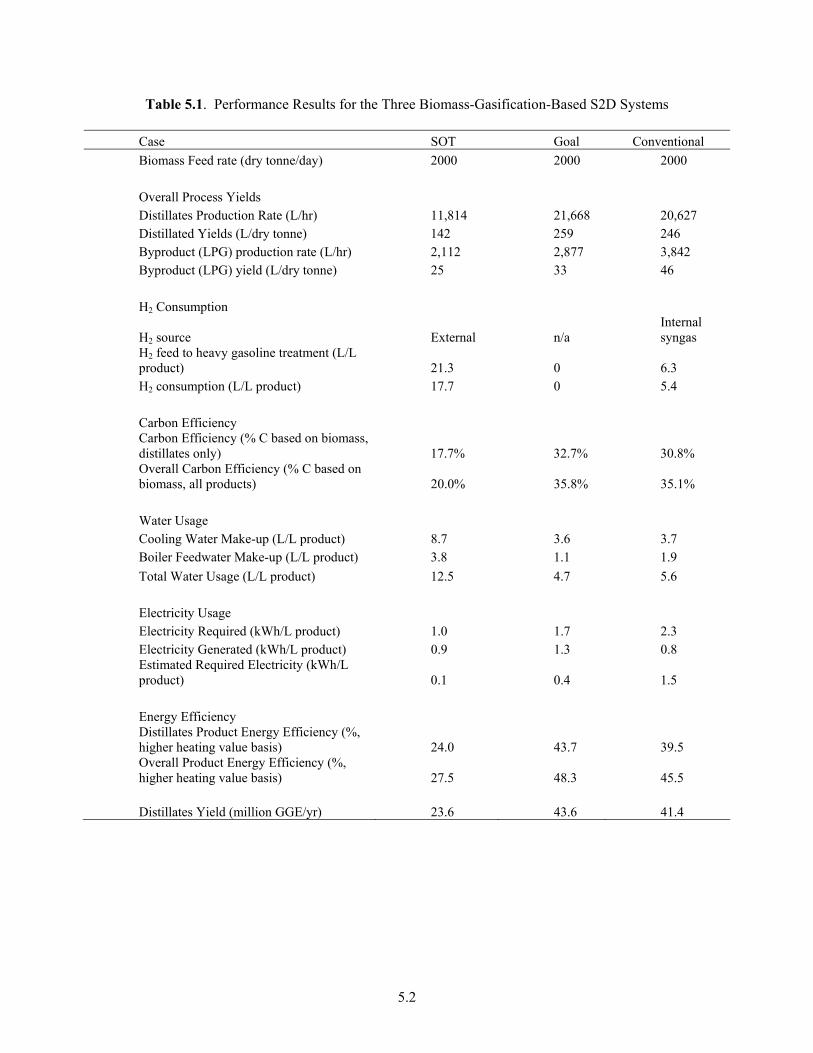
5.1 Performance Results for the Three Biomass-Gasification-Based S2D Systems .......................... 5.2
5.2 Cost results for the three biomass-gasification based S2D systems. ............................................ 5.3
1.1
1.0 Introduction
Synthesis gas (syngas), which is derived from natural gas, biomass, or coal, can be used to synthesize a variety of fuels and chemicals. Domestic transportation and military operational interests have driven continued focus on domestic production of syngas-based fuels. Liquid transportation fuels may be made from syngas via four basic processes: 1) higher alcohols, 2) Fischer-Tropsch (FT), 3) methanol-to-gasoline (MTG), and 4) MTO-MOGD (methanol-to-olefins, Mobil’s olefin-to-gasoline/distillates). Synthesis of higher alcohols, which mainly is focused on ethanol, has enjoyed recently renewed interest but still suffers from low productivity and poor selectivity [1]. The FT process produces a wide array of mainly linear paraffinic hydrocarbons with distributions that depend on the catalyst and the specific process configuration. The products follow an Anderson-Schulz-Flory distribution, and post processing is required to maximize the desired fraction. Overall, the FT process suffers from low operating efficiencies and has not realized significant market share despite much development work in this area [2].
Compared to the FT and higher alcohols processes, the MTG and MTO-MOGD processes have received less attention in recent years. MTG and MTO-MOGD operations take advantage of the relative ease with which methanol is formed from syngas, followed by direct conversion of this initial product into heavier fuels. The MTG process converts methanol to a mixture of hydrocarbons in the C2 to C10
range, including paraffins, aromatics, and olefins. Essentially only gasoline-type fuels are made in the conventional MTG process. The typical catalyst is a form of ZSM-5, a pentasil zeolite. The only commercial MTG plant was built in New Zealand (it became operational in 1986), where natural gas-derived syngas was converted to methanol and then to gasoline in a fixed-bed reactor. Although generally considered a technical success [3], the MTG operation was shut down in the 1990s and only the methanol production facility still operates. Because MTG does not produce a diesel or jet fuel fraction, Mobil devised another variant of MTG, namely the combined “methanol-to-olefins” (MTO) and MTO-MOGD [4]. MTO is a variant of MTG in which short methanol contact times over a tailored ZSM-5 yield olefins and some premium gasoline. MOGD is then conducted in a second reactor, where the olefins are oligomerized to a mixture of gasoline and distillate range product at above 95% total selectivity. The result is mostly methyl branched iso-olefins from C5 to C20. MTO-MOGD was successfully demonstrated by Mobil in a refinery environment in 1981 [4].
Despite several advantages over the FT process, the MTG and MTO-MOGD processes have not been widely implemented. Because of the high capital cost of these synthetic fuel plants, the production cost of the finished fuel cannot compete with petroleum-derived fuel. This is especially true for biomass feed stocks because unfavorable biomass transportation costs drive the need for smaller, distributed plants. In addition, oil price instability has caused synthetic fuel process economics to vary.
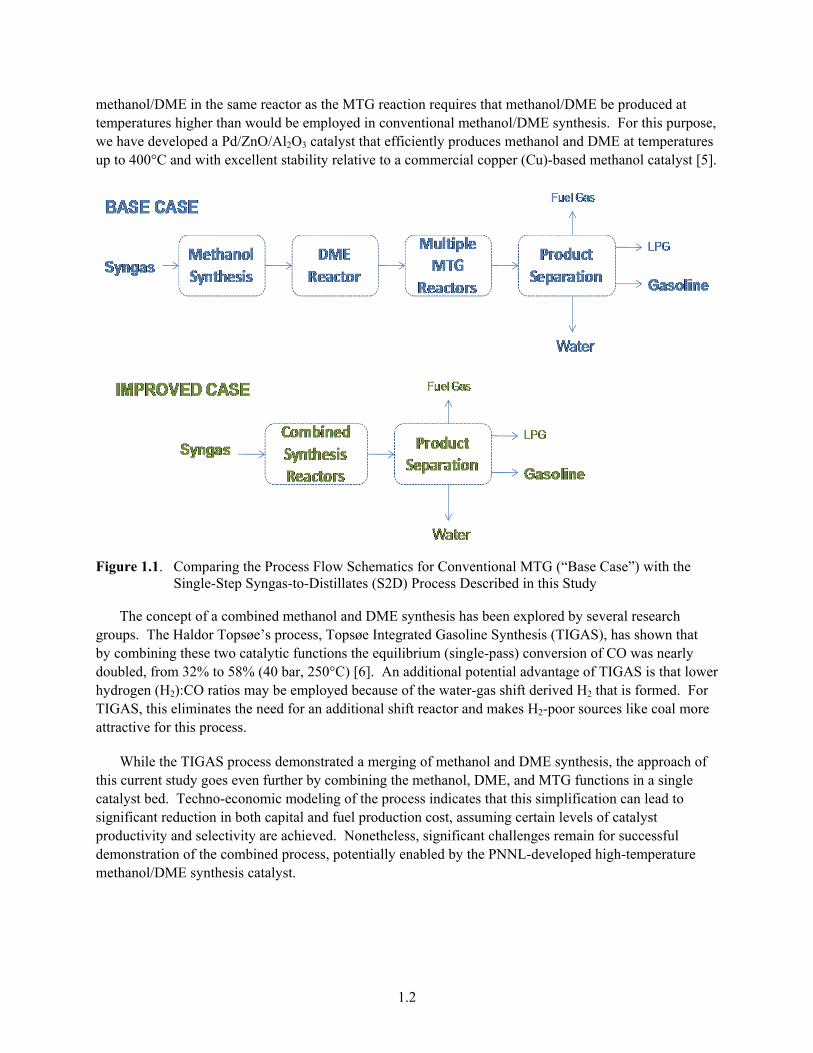
Pacific Northwest National Laboratory (PNNL) has recently evaluated one way to potentially reduce capital cost (and overall production cost) for MTG by combining the methanol, DME, and MTG syntheses in a single bed. This single-step conversion pathway has been defined as the “syngas-to-distillates” (S2D) process because light hydrocarbons are formed in addition to gasoline. The schematic for this S2D conversion process is shown in Figure 1.1 along with the conventional MTG process to illustrate the simplification envisioned. This potentially leads to improvements in capital investment as well as enhanced process efficiency because per-pass carbon monoxide (CO) conversion is driven upward, as compared to methanol synthesis. This is accomplished by the continuous consumption of methanol and DME, eliminating the otherwise equilibrium conversion constraint. Producing the
1.2
methanol/DME in the same reactor as the MTG reaction requires that methanol/DME be produced at temperatures higher than would be employed in conventional methanol/DME synthesis. For this purpose, we have developed a Pd/ZnO/Al2O3 catalyst that efficiently produces methanol and DME at temperatures up to 400°C and with excellent stability relative to a commercial copper (Cu)-based methanol catalyst [5].
Figure 1.1. Comparing the Process Flow Schematics for Conventional MTG (“Base Case”) with the Single-Step Syngas-to-Distillates (S2D) Process Described in this Study
The concept of a combined methanol and DME synthesis has been explored by several research groups. The Haldor Topsøe’s process, Topsøe Integrated Gasoline Synthesis (TIGAS), has shown that by combining these two catalytic functions the equilibrium (single-pass) conversion of CO was nearly doubled, from 32% to 58% (40 bar, 250°C) [6]. An additional potential advantage of TIGAS is that lower hydrogen (H2):CO ratios may be employed because of the water-gas shift derived H2 that is formed. For TIGAS, this eliminates the need for an additional shift reactor and makes H2-poor sources like coal more attractive for this process.
While the TIGAS process demonstrated a merging of methanol and DME synthesis, the approach of this current study goes even further by combining the methanol, DME, and MTG functions in a single catalyst bed. Techno-economic modeling of the process indicates that this simplification can lead to significant reduction in both capital and fuel production cost, assuming certain levels of catalyst productivity and selectivity are achieved. Nonetheless, significant challenges remain for successful demonstration of the combined process, potentially enabled by the PNNL-developed high-temperature methanol/DME synthesis catalyst.
1.3
In this report we disclose research and development activities pertaining to, 1) development of a PdZnAl catalyst as the methanol and DME synthesis catalyst specifically tailored for use in a single-step S2D/gasoline configuration, 2) process parameter investigation for the mixed PdZnAl and zeolite system, and 3) comparative techno-economic analysis for the S2D process and a more conventional approach.
2.1
2.0 Materials and Methods
2.1 Catalyst Preparation
Pd/ZnO/Al2O3 catalysts were prepared by incipient wetness impregnation of an Al2O3 support (Engelhard, AL-3945E) with a palladium (Pd) nitrate solution (21.21 wt% Pd in nitric acid) to which a zinc (Zn) nitrate precursor (Sigma Aldrich) was added, as reported in a previous study [7]. The catalysts were dried at 110ºC for 8 hours and calcined at 350ºC for 3 hours. For the first series, the Pd loading was equal to 8.8 wt% and the Pd:Zn molar ratio varied from 0.25:1 to 0.75:1. For the second series, the Pd loading varied from 2.5 to 20 wt% and the Pd:Zn molar ratio was kept constant and equal to 0.25:1. A Pd/Al2O3 catalyst with 8.8 wt% Pd was prepared according to the same method with no addition of Zn nitrate precursor to the Pd solution. The Pd/ZnO/Al2O3 catalysts were labeled xPd/ZnO/Al2O3-y where x stands for the Pd loading and y stands for the Pd/Zn molar ratio. For example, 8.8Pd/ZnO/Al2O3-0.25 indicates a Pd loading of 8.8 wt% and a Pd:Zn content of 0.25:1 (molar). For comparison, a commercial Cu/ZnO/Al2O3 catalyst (Synetix, F51-8 PPT) was tested under the same conditions as the supported Pd catalysts. Note that the term “spent” refers to the catalyst after reaction.
For the majority of S2D tests, a methanol catalyst with a Pd loading of 8.9 wt% and a Pd:Zn molar ratio of 0.38:1 was used (this catalyst was designated “8.9PdZnAl”). One set of experiments used a methanol catalyst with a Pd loading of 5.0 wt% and a Pd:Zn molar ratio of 0.25:1 (designated “5PdZnAl”). Sixty to 100 mesh catalyst particle sizes were utilized. Commercial ZSM-5 zeolite (PQ Corp, HZSM-5, Si/Al = 40) powder was compressed into tablets then crushed and sieved to produce 60- to 100-mesh particles.
2.2 Catalytic Characterizations
2.2.1 Brunauer-Emmett-Teller Surface Area
Nitrogen (N2) adsorption was measured at 77 K with an automatic adsorptiometer (Micromeritics ASAP 2000). The samples were pretreated at 150°C for 12 hours under vacuum. The surface areas were determined from adsorption values for five relative pressures (P/P0) ranging from 0.05 to 0.2 using the Brunauer–Emmett–Teller (BET) method. The pore volumes were determined from the total amount of N2 adsorbed between P/P0 = 0.05 and P/P0 = 0.98. Prior to BET measurements, the catalysts had been reduced under 10% H2/N2 at 400°C for 2 hours.
2.2.2 X-Ray Diffraction
X-ray diffraction (XRD) analysis of the spent catalysts (i.e., after methanol synthesis reaction conditions) was conducted using a Philips X’pert MPD (Model PW3040/00) diffractometer with a Cu anode (Kα1 = 0.15405 nm) and a scanning rate of 0.01°C per second between 2θ = 10° to 70°. The diffraction patterns were analyzed using Jade 5 (Materials Data Inc., Livermore, California) and the Powder Diffraction File database (International Center for Diffraction Data, Newtown Square, Pennsylvania). Particle sizes of the samples were determined from the XRD patterns using the Debye-Sherrer relation (d = 0.89λ/ Bcosθ, where λ is the wavelength of Cu Kα radiation, B is the calibrated half-width of the peak in radians, and θ is the diffraction angle of a crystal face). The metal dispersion was
2.2
estimated from the particle size by assuming hemispherical geometry using the equation D = 1/d (D = dispersion and d = metal particle size) [8].
2.2.3 Scanning Transmission Electron Microscopy
Scanning transmission electron microscopy (S/TEM) was performed with FEI Titan 80-300 operated at 300 kV. The FEI Titan is equipped with CEOS GmbH double-hexapole aberration corrector for the probe-forming lens, which allows imaging with ~0.1-nm resolution in scanning transmission electron microscopy (STEM) mode. The STEM images were acquired on high-angle annular dark field with an inner collection angle of 52 mrad. In general, TEM sample preparation involved mounting powder samples on Cu grids covered with lacey carbon support films and immediate loading them into the TEM airlock to minimize exposure to atmospheric oxygen (O2). Note that the samples were analyzed by S/TEM after ex situ reduction under 10% H2/N2 at 400°C for 2 hours.
2.2.4 Infrared Spectroscopy
Infrared (IR) spectra were recorded with a Bruker spectrometer, equipped with a MCT detector (resolution: 4 cm-1, 256 scans). Samples pressed into pellets were first pretreated under H2 for 2 hours at 400°C. During this pretreatment, the sample was alternatively exposed to H2 for 30 minutes and evacuated under vacuum for 15 minutes to simulate flow conditions. After that, the temperature was cooled to room temperature, and small doses of CO were progressively added until the catalyst surface became saturated.
2.2.5 Ammonia Temperature Programmed Desorption
Ammonia (NH3)-temperature programmed desorption (TPD) experiments were performed on an automated catalyst characterization unit (Micromeritics Autochem 2910) equipped with a thermal conductivity detector (TCD). The catalyst (0.1 g) was loaded in a U-type quartz tube. Then, a 10% H2/argon (Ar) mixture was passed through the sample starting from 20°C and heating up to 400°C with a ramp of 5°C/min and held at this temperature for 2 hours under 10% H2/Ar mixture and one more hour under helium (He). The temperature was cooled to 100°C under He flow, and the adsorption of NH3 (16% NH3/He) was carried out at 100°C for 2 hours. After that, He flowed for 2 hours at the same temperature, to remove the physisorbed NH3 from the surface of the catalyst. The catalyst then was heated to 650°C (ramp 5°C/min) and held at this temperature for 1 hour.
2.3 Catalyst Performance Testing
2.3.1 Methanol/DME Synthesis
Methanol/DME synthesis catalytic activity tests were conducted in a 7.8 mm inner diameter fixed-bed reactor. The catalyst (0.6 g), diluted with SiC (3 g), was loaded between two layers of quartz wool inside the reactor. A dual K-type thermocouple was placed in the reactor for the measurement of inlet and catalyst bed temperatures. The catalyst was reduced at 400 °C for 2 hours, using 10% H2/N2 gas mixture, prior to the test. A premixed gas containing H2, CO, CO2, and N2 was fed into the system using a Brooks Mass Flow Controller (5850E series). Four different premixed gas compositions with syngas ratios
2.3
H2:CO = 1, 2 or 3 (mol) were used and are listed in Table 2.1. The catalysts were tested at temperatures between 250 and 380ºC for gas hour space velocities (GHSV) ranging from 5,000 to 20,000 h-1 and pressures ranging from 34.5 to 69 bar. The gas products were separated using MS-5A and PPU columns and analyzed online using an Agilent Micro GC (gas chromatograph) equipped with a TCD. The activities of the catalysts were compared using the following definitions:
CO conversion (%) = 100fed CO of moles
reacted CO of moles ×
Selectivity (%) = 100P of moles
P moles
iii
ii ××
×
υυ
where Pi is a certain product and υ is the number of carbon atoms/molecule in Pi. (e.g., if P = CO2, υCO2 = 1, while for P = CH3OCH3, υCH3OCH3 = 2). We used Chemcad (version 5.6) to estimate the equilibrium CO conversion.
S2D activity tests were carried out using a packed-bed, down-flow reactor as shown in Figure 2.1. The test stand was equipped with electronic mass flow controllers, back-pressure regulators, and a volumetric total flow meter. The stainless steel packed-bed tubular reactor with an inner diameter of 4.4 mm was heated by electrical resistance, using a temperature feedback loop and a proportional-integral-derivative controller to maintain constant bed temperature. Temperatures, pressures, and flow rates were recorded continuously by means of a dedicated computer process control interface developed in LabVIEW 8.0 and containing the necessary safety-related shutdown logic for unattended operation. The reactor was loaded with a physical mixture of 0.3 g of Pd/ZnO/Al2O3 catalyst and 0.9 g of commercial HZSM-5, resulting in a 3:1 zeolite:methanol catalyst weight ratio. A thermocouple placed below the catalyst bed was used to monitor the reactor exit temperature while the catalyst temperature was monitored by four additional thermocouples inserted axially within the bed. More details for the test system are disclosed in Appendix A.
2.4
Figure 2.1. Pressurized Fixed-Bed Flow Reactor Test Stand
MTG studies (starting from methanol) were initially performed to assess the level of olefin hydrogenation over both zeolite and a mixed zeolite-PdZn/Al2O3 catalyst system. Before each experiment, the Pd/ZnO/Al2O3 of the combined bed was activated at ambient pressure under a 150 standard cubic centimeters per minute (sccm) flow of 10% H2/He, using a heating ramp rate of 2°C per minute, dwell time of 2 hours at 380°C, and cool down at a rate of ~4°C per minute. For each experiment, the pressure was kept at 1000 psig and the temperature at 375°C. Experimental conditions included two different feeds (methanol/H2 and methanol/N2) and two different catalyst beds (0.90 g of ZSM-5 with and without 0.30 g of 8.9 wt% Pd/ZnO/Al2O3). Experiments were run at GHSV = 1000 hr-1 for the zeolite only, and GHSV = 781 hr-1 for the mixed zeolite-Pd/ZnO/Al2O3 catalyst. This kept the zeolite (MTG) residence time the same in both cases. GHSVs were calculated at standard temperature and pressure conditions. Methanol as vapor was fed at 16.8 sccm, mixed with either N2 or H2 at 8.2 sccm (67% MeOH + 33% H2 or N2). Liquid product was collected in a refrigerated trap during a period of 6 hours on-stream. Product gas was analyzed using an online micro-gas chromatograph (Agilent 3000A), equipped with TCDs and three capillary columns (Mol Sieve 5A, Plot U and OV-1). At the end of the run, the liquid sample was depressurized, collected from the trap, and analyzed on a gas chromatograph (Agilent 5890-II) equipped with a mass selective detector (Agilent 5971A).
2.5
For combined S2D testing, a certified syngas mixture (Airgas Inc., ultra-high purity grade) with molar composition as shown in Table 2.2 was used as feed. Nitrogen was included in the mixtures as an internal standard. Commercial ZSM-5 was converted from the NH4+ to the H+ form by calcination in dry air at 400°C for 3 hours, then cooled and mixed with Pd/ZnO/Al2O3 and packed into the reactor. Before each experiment, the Pd/ZnO/Al2O3 of the combined bed was activated in situ under flow of 10% H2/He, using a heating ramp rate of 2°C per minute, dwell time of 2 hours at 380°C, and cool down at a rate of ~4°C per minute. Hydrogen pretreatment is necessary in order to form PdZn alloy, the active species for methanol synthesis [5]. After catalyst activation, the system was pressurized with the feed gas mixture by adjusting the back-pressure regulator. Once the flow rate and pressure reached steady state, the reactor bed temperature was increased at 10°C per minute under a flow of 25 sccm feed gas. The experiment began when the reactor reached the target bed temperature.
H2:CO Ratio CO:CO2 Ratio H2 (molar %) CO (molar %) CO2 (molar %) N2 (molar %) 1:1 3.19 41.5 41.5 13.0 4.0 2:1 3.22 58.0 29.0 9.0 4.03:1 3.19 66.7 22.3 7.0 4.0
Syngas conversion in the combined-bed configuration was typically conducted over a period of 50 hours. Product gas was analyzed every 30 minutes using an online micro-gas chromatograph as described above. During each experiment, the liquid fraction of the product stream was collected in a refrigerated trap installed between the reactor and the back-pressure regulator. At the end of the run, the liquid sample was depressurized, collected from the trap, and analyzed as described above.
Conversion of CO was calculated as the ratio of the difference of mass flow of CO in the feed and CO in the product, to the mass flow of CO in the feed. Selectivity of all carbon-bearing products was determined from the carbon appearing in any species divided by CO converted, on a carbon mass basis. For CO2, which is the only carbon-bearing product species present in the feed, the feed rate of CO2 is subtracted out. Selectivity to a given product then tracks the mass of carbon present in that species relative to the mass of carbon converted from CO. Furthermore, for simplicity, selectivity to the many products is grouped in terms of three general product classes: hydrocarbons, oxygenates, and CO2. Further breakdown of the hydrocarbon component is made according to the carbon number.
2.4 Techno-Economic Analysis
2.4.1 Process Overview
Three process scenarios were investigated for techno-economics in this study: 1) state of technology (SOT), 2) goal, and 3) conventional two-step cases. The SOT and goal cases assume the same single-step S2D process configuration but with different operating conditions and product yields. All the SOT, goal, and conventional cases have common design for feed handling and preparation, gasification, and gas cleanup and adjustment processes. The conventional case uses a two-step S2D process.
The design and simulation of the single-step S2D SOT case is based on experimental results obtained in our laboratories and described in this report. Operating parameters investigated included temperature, pressure, catalyst ratio, space velocity, H2:CO ratio, and type of methanol synthesis catalyst. The best
2.6
performing combination of the investigated parameters was chosen as the design basis for the performance simulation of the SOT case. SOT performance results were obtained from the following process conditions: T = 310°C, P = 22 bar, and GHSV = 740 hr-1. Feed composition contained a syngas molar ratio of H2:CO = 2.0, with CO2 added to the feed such that the molar ratio CO:CO2 = 3.2. A mixed catalyst bed containing a zeolite: methanol catalyst weight ratio of 3:1 was used. The methanol synthesis catalyst was a PNNL-developed PdZn/Al2O3 formula having 8.8% Pd loading and molar ration of Pd/Zn = 0.38 supported on g-Al2O3. Catalyst synthesis details are reported above. Commercial ZSM-5 (PQ Corp, HZSM-5, Si/Al = 40) was employed as the S2D zeolite.
2.4.1.1 Single-Step S2D Process
Figure 2.2 shows the conceptual process flow diagram for a biomass-gasification-based single-step S2D system. The major processes are gasification, gas cleanup and adjustment (tar cracking, wet scrubbing, syngas compression, water-gas shift reaction, and acid gas removal), single-step S2D with product separation and purification, and steam cycle.
Figure 2.2. Conceptual Flow Diagram of Biomass-Gasification-Based Single-Step S2D System
This study assumes an indirectly heated gasifier, which avoids dilution of the product syngas with N2 from air [9]. Biomass feed (wood chips in this study) is dried to the target moisture fraction by hot flue gas and converted to raw syngas in a gasifier. The raw syngas is sent to the gas cleanup and adjustment process. A large portion of tars, methane (CH4), and other light hydrocarbons in the raw syngas, as well as alcohols if present, are decomposed to CO and H2. The hot effluent is cooled by process streams and boiler feed water to generate steam or superheated steam, and then, the syngas is sent to a wet scrubbing unit to remove particulates. The scrubbed syngas is compressed and sent to a water-gas-shift (WGS) reactor to adjust H2:CO to the required ratio based on the downstream synthesis process. The shifted syngas is cooled and sent to an amine-based chemical absorption system to remove most of the sulfur
2.7
(mainly in the form of hydrogen sulfide [H2S]) and a large portion of CO2 in the shifted syngas. The syngas is then heated and sent to a ZnO bed to reduce the sulfur content to 10 ppmv (to avoid catalyst deactivation). The cleaned syngas is cooled and compressed for the synthesis process.
Clean syngas is converted to hydrocarbons in a single-step S2D reactor filled with a mixture of synthesis catalysts, namely a conventional methanol synthesis catalyst and zeolite HZSM-5. The reaction temperature is controlled by generating high pressure saturated steam. Raw products include hydrocarbons (C1 through C12), oxygenate, and water. The product is cooled and the condensed liquid is sent to the product separation and purification process. A large portion of the gas phase is recycled to the reactor. The remaining gas is sent to a molecular sieve to remove water, the dry gas is refrigerated to further condense hydrocarbon liquids, and the off-gas is then recycled to the tar reformer process. The condensed liquid streams are sent to the product separation process to separate light gas, liquid petroleum gas, light gasoline, and heavy gasoline. In the goal case, the durene content is assumed to be lower than the required durene limit for commercial gasoline and no hydrotreating process is needed. In the SOT case, based on the experimental results, a hydrotreating process is used to reduce the durene content.
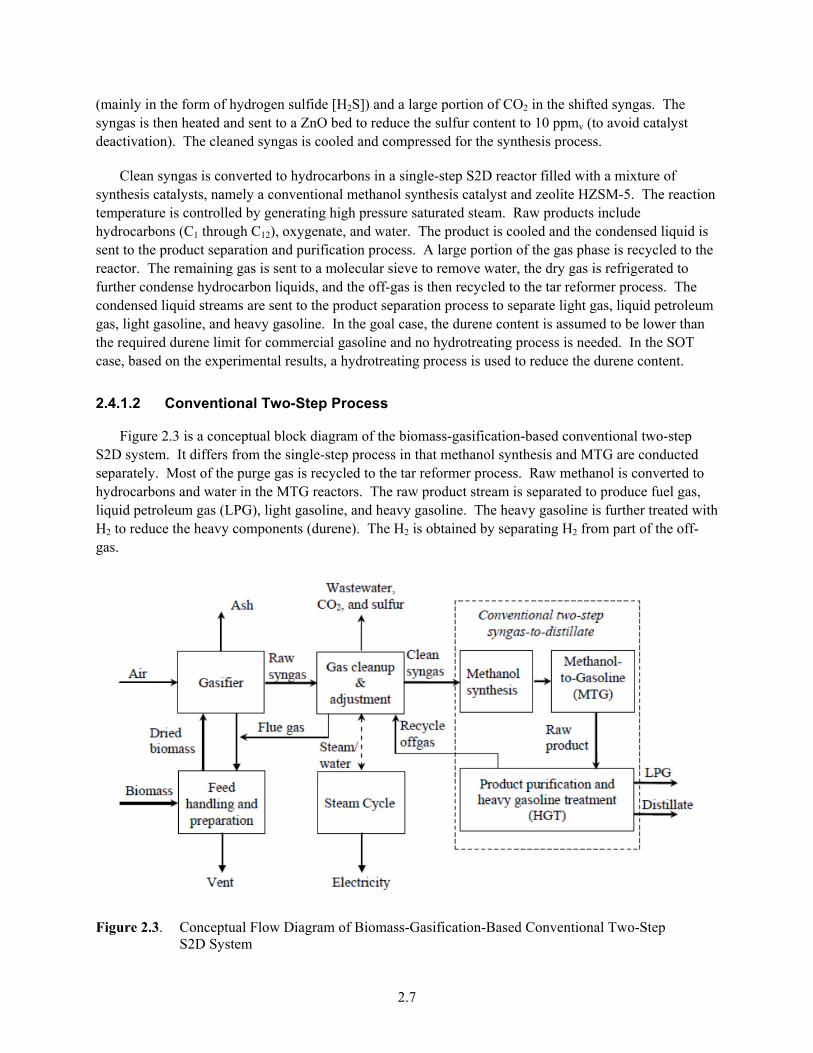
2.4.1.2 Conventional Two-Step Process
Figure 2.3 is a conceptual block diagram of the biomass-gasification-based conventional two-step S2D system. It differs from the single-step process in that methanol synthesis and MTG are conducted separately. Most of the purge gas is recycled to the tar reformer process. Raw methanol is converted to hydrocarbons and water in the MTG reactors. The raw product stream is separated to produce fuel gas, liquid petroleum gas (LPG), light gasoline, and heavy gasoline. The heavy gasoline is further treated with H2 to reduce the heavy components (durene). The H2 is obtained by separating H2 from part of the off-gas.
Figure 2.3. Conceptual Flow Diagram of Biomass-Gasification-Based Conventional Two-Step S2D System
2.8
2.4.2 Synthesis Reactor(s)
Different synthesis technologies are simulated for the three cases. A summary of reactor types, operating conditions, and major products yield data for three cases is provided in
Table 2.3. The inputs and assumptions for the S2D process of the SOT case have been experimentally proven using results described in this report. The product yields for the goal case are assumed to be the same as the conventional case. The conventional case is based on demonstrated large-scale, two-step S2D technologies and data available from the literature [10-12].
Additional details for the process simulation and economic analysis were done using Advanced System for Process Engineering Plus (Aspen Plus®) is disclosed in Appendix C. Further details for each major process in both systems are described in further detail in Appendix D.
Table 2.3. Major Inputs and Assumptions of the Synthesis Reactor(s) for All Three Cases
Cases SOT Case Goal Case Conventional Case
Reactor type Single-step isothermal tubular fixed-bed reactor
3.0 Methanol and Dimethyl Ether Synthesis from Syngas over Pd/ZnO/Al2O3
This portion of the report details development of the Pd/Zn/Al2O3 bi-functional catalyst for direct conversion of syngas to methanol and DME over a wide temperature range of 250 to 380°C [5]. These temperatures incorporate a regime suitable, for use in conjunction with zeolite, for single-step gasoline synthesis. Details for the single-step conversion to distillation/gasoline are described elsewhere in this report (Section 4.0). The focus of this particular study was to optimize the functionality of the methanol and DME synthesis catalyst. A Pd/ZnO/Al2O3 catalyst previously developed for methanol synthesis alone was used as a baseline catalyst. Tailoring the catalyst formulation and investigating process parameters for the exploitation of this new application was necessary. Catalytic compositions were altered by varying Pd and Zn loadings on the alumina (Al2O3 ) substrate, which affects catalytic activity and selectivity. Operating temperature, pressure, GHSV, and syngas ratio (H2:CO) were process variables also explored on select catalysts. The relationship of the bi-functional PdZn metal and acid sites and their impact on catalytic performance were investigated. A combination of synthesis experimentation and material characterization has led to insights regarding the reaction pathways.
3.1 Catalyst Characterizations
3.1.1 Catalyst Compositions and Textural Properties
Compositional information and the surface area and pore volume of the catalysts are shown in Table 3.1. For a given Pd loading, the surface area and pore volume increase with an increase of Pd:Zn ratio (i.e., decrease in the ZnO content). This could be due to blocking of the pores of the Al2O3 support by ZnO and by PdZn particles. The PdZn particle size decreases with the Pd:Zn ratio (see Table 3.1). Similarly, the decrease of the surface area and pore volume with the increase of the Pd loading from 2.5 to 20% is likely because of the increase of the PdZn particle size and ZnO content.
Table 3.1. Catalyst Compositions and Textural Properties
For the 8.8Pd/ZnO/Al2O3-0.38 catalyst exposed to methanol synthesis reaction conditions, the results have shown that the PdZn particles size increases during the first 12 hours on-stream (from 4.0 to 7.5 nm) but does not significantly increase for TOS greater than 12 hours. Therefore, we examined the spent catalysts by XRD to determine the PdZn particle size. Figure 3.1(a) shows the XRD patterns for the spent
3.2
Pd/ZnO/Al2O3 catalysts with different Pd loading and same Pd:Zn molar ratio, measured at 2θ = 40° to 48°. For the samples with a Pd loading >2.5%, peaks characteristic of bimetallic PdZn at 41.2° and 44.1° are observed. When the Pd loading increases, these peaks become more intense, and their bandwidths decrease, indicating an increase of the PdZn particle size (Table 3.2). For the 2.5Pd/ZnO/Al2O3-0.25 catalyst, one broad peak is detected between 2θ = 40.5° and 42.5°. It is likely that this peak is characteristic of Al2O3. However, the presence of small PdZn particles that could contribute to this broad peak is not ruled out. None of the XRD patterns shows peaks characteristic of Pdº (expected at 40.2°), suggesting that the samples present only bimetallic PdZn particles. Figure 3.1(b) displays the XRD patterns for the Pd/ZnO/Al2O3 catalysts with 8.8% Pd and different Pd:Zn molar ratios. The XRD pattern obtained for the 8.8Pd/Al2O3 catalyst is presented in Figure 3.1(b) as well. The XRD patterns for the Pd/ZnO/Al2O3 catalysts show only peaks characteristic of PdZn, again suggesting the absence of metallic Pd particles. Note that the bandwidth of the PdZn peak at 41.2° increases with the Pd:Zn ratio, indicating a decrease in the bimetallic PdZn particle size. The PdZn particle size and dispersion calculated from these XRD measurements are presented in Table 3.2. The dispersion increases with the increase in Pd:Zn molar ratio and decreases with an increase in the Pd loading.
Figure 3.1 XRD Patterns for the Spent Pd/ZnO/Al2O3 Catalysts. (a) Catalysts with different Pd loadings and the same Pd:Zn molar ratio, and (b) catalysts with 8.8% Pd and different Pd:Zn molar ratios.
Table 3.2. Particle Sizes of the Pd/ZnO/Al2O3 Catalysts Determined by XRD and Dispersion Measurements
a. Dispersion calculated from PdZn particle size using the equation D = 1/d with D = dispersion and d = PdZn particle size. b. Peaks characteristic of bimetallic PdZn particles were not detected by XRD indicating that the particle size is below the XRD detection limit (i.e., <4 nm).
040 41 42 43 44 45 46 47 48
8.8Pd/ZnO/Al2O3-0.255Pd/ZnO/Al2O3-0.25
20Pd/ZnO/Al2O3-0.25
2.5Pd/ZnO/Al2O3-0.25PdZn
PdZn
2 theta (degrees)
cou
nts
(s-1
) ZnO
(a)
038.3 40.3 42.3 44.3 46.3
8.8Pd/ZnO/Al2O3-0.25-8.8Pd/ZnO/Al2O3-0.38-
8.8Pd/Al2O38.8 Pd/ZnO/Al2O3-0.75-PdZn
PdZn SiCPd
2 theta (degrees)
cou
nts
(s-
1)
Al2O3
(b)
Al2O3
Al2O3
3.3
3.1.3 Scanning Transmission Electron Microscopy Analysis
The Pd/ZnO/Al2O3 catalysts were analyzed using STEM. Figure 3.2(a) shows bimetallic PdZn particles supported by ZnO-Al2O3 for the 2.5Pd/ZnO/Al2O3-0.25 catalyst. The detailed high-resolution image in Figure 3.2(b) confirms that the particles are PdZn bimetallic and have an ordered tetragonal structure with L10 type ordering. Nevertheless, some of the PdZn particles, such as the one shown in Figure 3.2(b), exhibit a contrast variation at the nanoscale indicating some compositional or structural inhomogeneities. The observations of bimetallic PdZn particles with tetragonal L10 type ordering are common for all of the analyzed Pd/ZnO/Al2O3 catalysts.
(a) (b)
Figure 3.2. Pd/ZnO/Al2O3 Catalysts Analyzed using STEM. (a) General view of the supported PdZn particles for the spent 2.5% Pd/ZnO/Al2O3 0.25:1 catalyst, and (b) high-resolution high-angle annular dark field image revealing the crystallographic nature of the PdZn intermetallic particles.
3.1.4 Infrared Analysis
Figure 3.3(a) shows IR spectra recorded between 1800 and 2125 cm-1, after saturation of the catalyst surface with CO at room temperature, for the Pd/ZnO/Al2O3-0.25 catalysts with different Pd loadings. For all the catalysts, the IR spectra present one main band between 2069 and 2077 cm-1 attributed to the vibration of CO linearly adsorbed on the PdZn alloy particles [13, 14]. The shift observed between the spectra for the different catalysts for the band at 2069 to 2077 cm-1 is not understood yet. In addition, a closer look at the spectrum obtained for the 2.5Pd/ZnO/Al2O3-0.25 catalyst shows one broad band between 1800 and 2000 cm-1 due to multi-bonded CO species [13] and characteristic of Pd° particles [14]. Note that the band at 1800 to 2000 cm-1 is almost undetectable for the 2.5Pd/ZnO/Al2O3-0.25 catalyst, suggesting that the amount of Pd° is low compared to the amount of bimetallic PdZn particles. Note that the presence of a band due to linearly CO species adsorbed on Pd° for the catalysts with Pd >2.5% can be ruled out since the Pd°/ZnO/Al2O3 catalyst band is due to linearly adsorbed CO between 2100-2000 cm-1 is accompanied by a more intense band between 2000-1800 cm-1 [14].
Figure 3.3(b) shows IR spectra recorded between 1800 and 2125 cm-1 for the 8.8Pd/ZnO/Al2O3 catalysts with different Pd:Zn molar ratios. All the spectra present one band at 2069 to 2077 cm-1, which is characteristic of PdZn alloy. The spectrum recorded for the 8.8Pd/ZnO/Al2O3-0.75 catalyst also shows
3.4
one more band between 1800 and 2000 cm-1, which is attributed to Pd°. These results suggest that the amount of Pd° increases with the Pd:Zn molar ratio. Note that contrary to the IR measurements, the XRD patterns did not indicate the presence of Pd° for the 8.8Pd/ZnO/Al2O3-0.75. It can be due to the fact that the Pd° particles are too small to be detected by XRD or to the fact that IR spectroscopy is sensitive to the surface composition of the catalyst, whereas the XRD technique provides information on the structure and bulk composition of the catalyst.
Figure 3.3. Infrared Spectra Recorded. (a) Spectra recorded after CO adsorption at room temperature. (b) Spectra recorded after saturation of the surface by CO for the Pd/ZnO/Al2O3 catalysts with different Pd loading and Pd:Zn molar ratio.
3.2 Thermodynamics of Methanol Synthesis and Dehydration Reactions
Figure 3.4(a) presents the equilibrium CO conversion for the synthesis of methanol at T = 225 to 400°C and P = 34.5 to 69 bar and H2:CO:CO2 of 2/1/0.13 (premix 1 in Table 2.1). For these calculations two cases are considered: 1) methanol was the only product, and 2) methanol and DME are products. For the first case, equilibrium CO conversion decreases with increasing temperature from 75% at 225°C to 0% at 400°C. For the second case, with both methanol and DME as products, the same trend of decreasing conversion with increasing temperature is seen, but overall conversions are higher. This demonstrates the benefit of the thermodynamic driving force when both methanol synthesis and methanol dehydration are employed in tandem. This is possible, for example, when catalyst(s) use both methanol synthesis (e.g., Cu/ZnO/Al2O3 or Pd/ZnO/Al2O3) and methanol dehydration (e.g.. zeolite or Al2O3) functionalities. Figure 3.4 (a) also shows how equilibrium CO conversion increases with pressure. For example, at 375°C, CO conversion increases from 10% at P = 34.5 bar, to 38% at P = 69 bar.
1800185019001950200020502100
5Pd/ZnO/Al2O3- 0.25
8.8Pd/ZnO/Al2O3- 0.25
2.5Pd/ZnO/Al2O3-0.25
2069.6
2077 (a)
Wavenumbers (cm-1)
Inte
nsi
ty (a
.u.)
1800185019001950200020502100
8.8Pd/ZnO/Al2O3-0.25
8.8Pd/ZnO/Al2O3- 0.75
8.8Pd/ZnO/Al2O3- 0.38
2069.6
2077 (b)
Wavenumbers (cm-1)
Inte
nsi
ty (a
.u.)
3.5
Figure 3.4(b) shows the equilibrium CO conversion and selectivities to methanol, DME, and CO2 at T = 225 to 400°C and P = 69 bar, when considering both methanol and DME as products. Equilibrium selectivity to DME decreases from 64% at 225°C to 40% at 400°C. On the other hand, equilibrium selectivity to CO2 increases from 31% at 225°C to 54% at 400°C. Equilibrium methanol selectivity remains quite level across the entire temperature range at approximately 5%.
Figure 3.4. Equilibrium CO Conversion. (a) Evolution of the equilibrium CO conversion as a function
of the temperature for methanol synthesis considering the formation of CH3OH and DME as products for P = 69 bar, P = 51.8 bar, P = 34.5 bar, and considering only the formation of CH3OH for P = 69 bar, H2:CO:CO2 = 2/1/0.13 (premix 1, Table 2.1). (b) Evolution of the CO conversion, CO2 selectivity, DME selectivity and CH3OH selectivity at equilibrium as a function of the temperature for P = 69 bar and H2:CO = 2, considering the formation of CH3OH and DME as products.
3.3 Methanol and DME Synthesis over Pd/ZnO/Al2O3 and Cu/ZnO/Al2O3
Industrially, the Cu/ZnO/Al2O3 catalyst is used for the synthesis of methanol from syngas [15]. We have compared a commercial Cu/ZnO/Al2O3 catalyst to the 8.8Pd/ZnO/Al2O3-0.38 catalyst for the synthesis of methanol, focusing on catalyst stability at relatively high pressure (i.e., 69 bar) and temperature (i.e., 375°C). These reaction conditions are suitable for the direct conversion of syngas to gasoline, and the temperature is significantly higher than that employed in conventional methanol synthesis. Figure 3.5 presents CO conversion versus time for a period of 125 hours on-stream for the two catalysts. Note that the stability test was conducted at higher a GHSV (i.e., 8340 h-1) for the 8.8Pd/ZnO/Al2O3-0.38 catalyst to ensure that the CO conversion would be below the equilibrium CO conversion. It is clear that the Cu/ZnO/Al2O3 suffers from rapid deactivation under these conditions. This deactivation is not surprising and caused by sintering of the Cu particles [16]. This is in stark contrast with the trend observed for the 8.8Pd/ZnO/Al2O3-0.38 catalyst. CO conversion is quite stable with time on-stream for the supported PdZn catalyst.
Con
vers
ion
/ Sel
ecti
vity
(%)
200 225 250 275 300 325 350 375 400 425
0
10
20
30
40
50
60
70
80
90
100
69 bars
51.8 bars
34.5 bars
CH3OH only, 69 bars
Temperature ( ºC)
CO
con
vers
ion
(%)
(a)
200 225 250 275 300 325 350 375 400 425
0
10
20
30
40
50
60
70
80
90
100
CO conversion
CO2 selectivity
DME selectivity
CH3OH selectivity
(b)
Temperature ( ºC)
3.6
Figure 3.5. Evolution of CO Conversion with Time On-Stream for the Cu/ZnO/Al2O3 and the 8.8P/ZnO/Al2O3-0.38 Catalysts. Reaction temperature = 375ºC, P = 69 bar, H2:CO = 2 (premix 3), GHSV = 3500h-1 for Cu/ZnO/Al2O3 and GHSV = 8340 h-1 for 8.8 Pd/ZnO/Al2O3-0.38.
Catalytic activity as a function of temperature is shown in Figure 3.6(a) for both catalysts. Note that, for each catalyst, the temperature was increased progressively from 250 to 380°C. The activity was measured after a 12 hour plateau at 250⁰C and a 3 to 4 hour plateau at 310°C, 330°C, 355°C, and 380°C. For the 8.8Pd/ZnO/Al2O3-0.38 catalyst, CO conversion increases with temperature until 360°C, beyond which it decreases because of equilibrium constraints. At temperature ≥330°C, the CO conversion is greater for the 8.8Pd/ZnO/Al2O3-0.38 catalyst than for Cu/ZnO/Al2O3. For both catalysts, CO2, ethane (C2H6), CH4, methanol, and DME were produced during reaction. For Cu/ZnO/Al2O3, the CO conversion is relatively flat, as compared to the 8.8Pd/ZnO/Al2O3-0.38 catalyst. This is the result of a progressive deactivation that occurs during data collection. The activity was measured over a 24 hour period during which the catalyst deactivates as evidenced from Figure 3.6.
Figure 3.6(b) shows the evolution of the methanol, DME, and CH4 selectivities as a function of temperature. The remaining selectivity (not shown) is for CO2. Note that for simplification and because both are the desired products, methanol and DME are combined and shown in the graph as “methanol + DME.” The compositional breakdown between methanol and DME is described below and is also shown in Table 3.3. As shown in Figure 3.6(b) selectivity to both methanol and DME decreases dramatically with increasing temperature. For the Cu/ZnO/Al2O3 catalyst, methanol and DME selectivity decreases from 75% at 240°C to 4.3% at 380°C. For the 8.8Pd/ZnO/Al2O3-0.38 catalyst, the selectivity to methanol and DME decreases from 36% at 240° C to 26% at 380°C, but is significantly higher than for the Cu/ZnO/Al2O3 catalyst at 380°C. At 380°C, the selectivity to methanol is 1.8% and 4.5% for the Cu/ZnO/Al2O3 and 8.8Pd/ZnO/Al2O3-0.38 catalysts, respectively, whereas the DME selectivity is 2.5 and 21.5%, respectively. This represents a sevenfold selectivity advantage for the 8.8Pd/ZnO/Al2O3-0.38
0
5
10
15
20
25
30
35
40
0 20 40 60 80 100 120
equilibrium
8.8 Pd/ZnO/Al2O3-0.38
Cu/ZnO/Al2O3
Time on stream (hours)
CO
con
vers
ion
(%)
3.7
catalyst at 380°C. For both catalysts, selectivity to undesirable CH4 increases with temperature and reaches 32% and 21.4% at 380°C for the Cu/ZnO/Al2O3 and 8.8Pd/ZnO/Al2O3-0.38 catalysts, respectively. CH4 production is an undesired byproduct and could also lead to the formation of coke. At temperatures above 350°C, the Cu/ZnO/Al2O3 catalyst produces a substantially greater amount of CH4 and lesser amount of methanol and DME compared to the 8.8Pd/ZnO/Al2O3-0.38 catalyst.
Figure 3.6. Conversion and Selectivity as a Function of Temperature. Evolution of (a) the CO conversion and (b) the methanol, DME and CH4 selectivity as a function of the temperature for the Cu/ZnO/Al2O3 (Cu) and the 8.8Pd/ZnO/Al2O3-0.38 catalysts, opened symbols: 8.8Pd/ZnO/Al2O3-0.38 (PdZn), filled symbols: Cu/ZnO/Al2O3, P = 69 bar, GHSV = 10 000h-1 and H2:CO = 2 (premix 1).
Table 3.3. Effect of Temperature, Pressure, and GHSV on Conversion and Selectivity for the 8.8Pd/ZnO/Al2O3-0.38 Catalyst
These results clearly show the 8.8Pd/ZnO/Al2O3-0.38 catalyst to be preferred over the Cu/ZnO/Al2O3
catalyst for methanol and DME synthesis from syngas at temperatures above 350°C. In contrast to the Cu/ZnO/Al2O3 catalyst, the 8.8Pd/ZnO/Al2O3-0.38 catalyst does not suffer from deactivation at these relatively high temperatures. In addition, higher selectivity to desirable DME and methanol and lower selectivity to undesired CH4 is observed for the 8.8Pd/ZnO/Al2O3-0.38 catalyst. Further development was undertaken to optimize the Pd/ZnO/Al2O3 catalyst formulation with a focus on suppressing CH4 formation while enhancing methanol and DME formation.
3.4 Methanol Dehydration to DME
As discussed above for both the Cu/ZnO/Al2O3 and 8.8Pd/ZnO/Al2O3-0.38 catalysts, formation of DME was observed. It is well known that dehydration of methanol proceeds over acidic sites offered by solid acid catalysts such as Al2O3 and zeolites [17]. Thus, the acid sites of the Al2O3 support likely promote DME formation via methanol dehydration once methanol is formed from the syngas. To investigate this further, we compared catalytic activity for the methanol-to-DME dehydration reaction at 250 to 425°C and at 1 bar. Activities of Cu/ZnO/Al2O3, 8.8Pd/ZnO/Al2O3-0.38, and Al2O3 alone (the support used for the PdZn catalysts) were compared. Figure 3.7 presents methanol conversion versus temperature for the three catalysts. Conversion increases dramatically with increasing temperature for both Cu/ZnO/Al2O3 and 8.8Pd/ZnO/Al2O3-0.38 and complete methanol conversion was achieved at approximately 350°C for both. For the Al2O3 support, conversion increases just slightly as temperature increses (i.e., from 29 to 35%). The significant increase of the conversion with the temperature for the Cu/ZnO/Al2O3 and 8.8Pd/ZnO/Al2O3-0.38 catalysts, compared to the Al2O3 alone, results from a considerable increase of their activity for methanol decomposition.
Figure 3.7. Methanol-to-DME Reaction. Evolution of the CH3OH conversion with the reaction temperature for P = 1 bar, GHSV = 5000h-1 and CH3OH = 36.1% in N2.
Temperature (°C)
CH
3OH
con
vers
ion
(%)
0
10
20
30
40
50
60
70
80
90
100
200 250 300 350 400 450
Al2O3Cu/ZnO/Al2O3Pd/ZnO/Al2O3
3.9
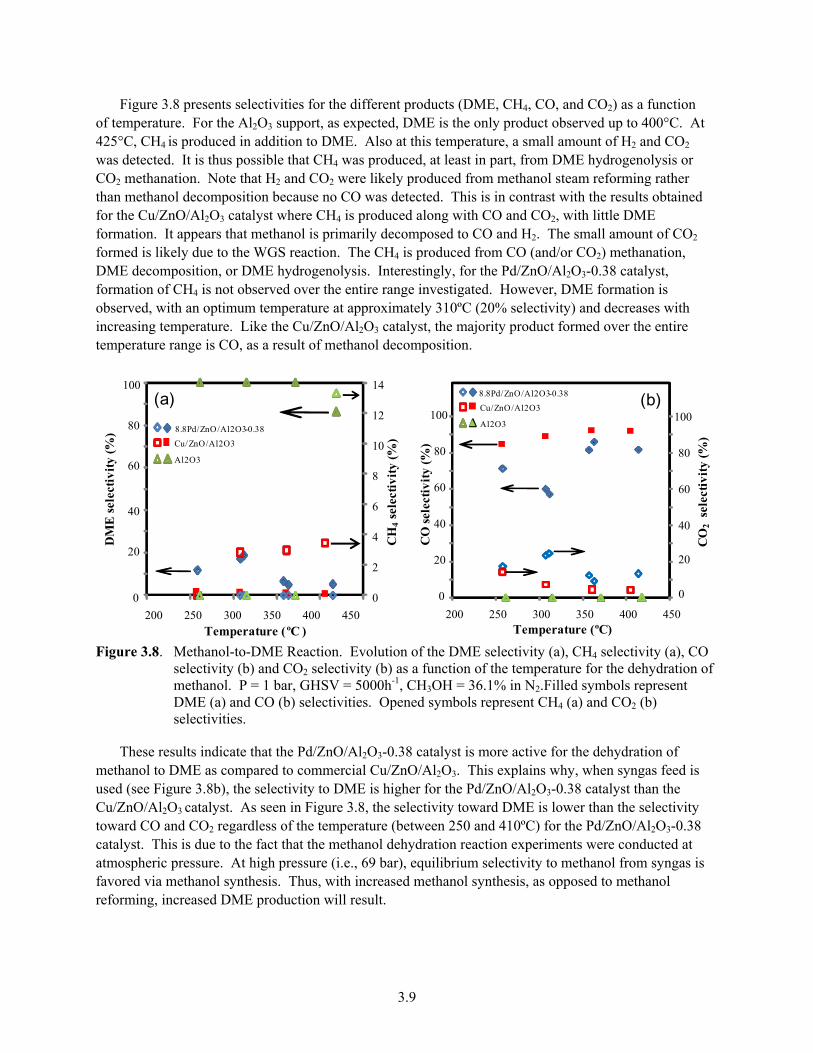
Figure 3.8 presents selectivities for the different products (DME, CH4, CO, and CO2) as a function of temperature. For the Al2O3 support, as expected, DME is the only product observed up to 400°C. At 425°C, CH4 is produced in addition to DME. Also at this temperature, a small amount of H2 and CO2 was detected. It is thus possible that CH4 was produced, at least in part, from DME hydrogenolysis or CO2 methanation. Note that H2 and CO2 were likely produced from methanol steam reforming rather than methanol decomposition because no CO was detected. This is in contrast with the results obtained for the Cu/ZnO/Al2O3 catalyst where CH4 is produced along with CO and CO2, with little DME formation. It appears that methanol is primarily decomposed to CO and H2. The small amount of CO2 formed is likely due to the WGS reaction. The CH4 is produced from CO (and/or CO2) methanation, DME decomposition, or DME hydrogenolysis. Interestingly, for the Pd/ZnO/Al2O3-0.38 catalyst, formation of CH4 is not observed over the entire range investigated. However, DME formation is observed, with an optimum temperature at approximately 310ºC (20% selectivity) and decreases with increasing temperature. Like the Cu/ZnO/Al2O3 catalyst, the majority product formed over the entire temperature range is CO, as a result of methanol decomposition.
Figure 3.8. Methanol-to-DME Reaction. Evolution of the DME selectivity (a), CH4 selectivity (a), CO
selectivity (b) and CO2 selectivity (b) as a function of the temperature for the dehydration of methanol. P = 1 bar, GHSV = 5000h-1, CH3OH = 36.1% in N2.Filled symbols represent DME (a) and CO (b) selectivities. Opened symbols represent CH4 (a) and CO2 (b) selectivities.
These results indicate that the Pd/ZnO/Al2O3-0.38 catalyst is more active for the dehydration of methanol to DME as compared to commercial Cu/ZnO/Al2O3. This explains why, when syngas feed is used (see Figure 3.8b), the selectivity to DME is higher for the Pd/ZnO/Al2O3-0.38 catalyst than the Cu/ZnO/Al2O3 catalyst. As seen in Figure 3.8, the selectivity toward DME is lower than the selectivity toward CO and CO2 regardless of the temperature (between 250 and 410ºC) for the Pd/ZnO/Al2O3-0.38 catalyst. This is due to the fact that the methanol dehydration reaction experiments were conducted at atmospheric pressure. At high pressure (i.e., 69 bar), equilibrium selectivity to methanol from syngas is favored via methanol synthesis. Thus, with increased methanol synthesis, as opposed to methanol reforming, increased DME production will result.
Temperature (ºC )
DM
E s
elec
tivi
ty (%
)
200 250 300 350 400 450
20
40
60
80
100
0
2
4
6
8
10
12
14
0
Al2O3
8.8Pd/ZnO/Al2O3-0.38
Cu/ZnO/Al2O3
0
20
40
60
80
100
200 250 300 350 400 450Temperature (ºC)
20
40
60
80
100Al2O3
8.8Pd/ZnO/Al2O3-0.38
Cu/ZnO/Al2O3(a) (b)
CH
4se
lect
ivit
y (%
)
CO
sel
ecti
vity
(%)
0
CO
2se
lect
ivit
y (%
)
3.10
3.5 Effect of Temperature, Pressure, and Gas-Hour Space Velocity
The effects of the temperature, pressure, and GHSV on the reactivity for syngas conversion to methanol and DME were examined for the 8.8Pd/ZnO/Al2O3-0.38 catalyst and the results are presented in Table 3.3. The effect of temperature on conversion and selectivity was discussed previously. As expected, CO conversion increases with pressure. When the operating temperature is kept constant at 380ºC, CO conversion increases from 20.6% to 44.2% when increasing the pressure from 34.5 to 69.0 bar. Selectivity to methanol and DME does increase somewhat with pressure. Methanol selectivity increases from 3.3 to 4.5%, and DME increases from 12.0 to 21.4%. An increase in methanol production is indeed predicted as the forward methanol synthesis reaction rates are favored with increasing pressure. CH4 and C2H6 production did not increase substantially with pressure. When the pressure increased from 34.5 bar to 69 bar the CH4 and C2H6 selectivities increased only slightly from 16.4% to 17.5% and from 2.2% to 4.5%, respectively.
GHSV was varied to determine the time dependence of conversion and selectivity, with the results shown in Table 3.3. As expected, CO conversion decreases as the GHSV increases. GHSVs of 5000, 10,000, and 18,000 hr-1 resulted in CO conversions of 63.7%, 44.2%, and 40.3%, respectively. Selectivities to CO2, CH4, and C2H6 increase with decreasing GHSV, whereas selectivity toward DME and methanol decrease. For example, at GHSVs of 5000 and 18,000 hr-1 selectivity to DME was 3.8% and 23.7%, respectively. Hence, shorter residence times favor the formation of DME relative to side products. Methane formation reactions such as DME hydrogenolysis become increasingly dominant at longer residence times. The fact that increased throughputs enhance selectivity to methanol and DME is an important finding from a practical standpoint.
One can see from Table 3.3 that a considerable amount of CO2 is produced during reaction. Indeed, whatever the reaction temperature (300 to 380°C), pressure (34 to 69 bar) and GHSV (5000 to 18,000 hr-1), the selectivity to CO2 is always approximately 50%. Under the present reaction conditions, the water gas-shift activity is significant, limiting methanol and DME formation.
3.6 Effect of Pd/Zn Ratio on Reactivity
Changes in Pd/Zn composition and the resulting effect on catalytic activity were also examined. Figure 3.9(a) presents the evolution of the conversion as a function of the Pd:Zn molar ratio at 380°C and 69 bar. CO conversion increases from 36 to 44% when the Pd:Zn molar ratio increases from 0.25:1 to 0.38:1. CO conversion decreases for higher Pd:Zn molar ratios and is equal to 26% for the 8.8Pd/Al2O3 catalyst with a Pd:Zn = 1:0. As evident from Figure 3.9(a), an optimum in Pd:Zn ratio exists for CO conversion. The higher CO conversion observed for the 8.8Pd/ZnO/Al2O3-0.38 catalyst, compared to the 8.8Pd/ZnO/Al2O3-0.25 catalyst, is probably due to a higher PdZn dispersion (see Table 3.2). From Figure 3.9(a), it can be seen that for Pd:Zn >0.25:1, the CO conversion decreases with an increase in Pd:Zn ratio. The IR measurements have shown an increase of the amount of Pdº with the increase of the Pd:Zn ratio. Consequently, these results strongly suggest Pdº particles to be less active than PdZn particles for the synthesis of methanol.
The effects of Pd:Zn molar ratios on product selectivity are shown in Figure 3.9(b). The CO2 selectivity is similar for all Pd:Zn molar ratios investigated and is equal to ~54%. One can also see that the CH4 and DME selectivities follow opposite trends. Indeed, the DME selectivity decreases from 24.5
3.11
to 10.5% with increasing Pd:Zn molar ratio. Consistent with this, a significant increase of the CH4 selectivity, from 13 to 33%, is observed with increasing Pd:Zn molar ratio. As the Pd:Zn ratio increases from Pd:Zn = 0.38 to 1.0, more Pdº sites are present on the surface of the catalyst, as shown by the IR results described above. Hence, these results show that Pdº facilitates CH4 formation.
Methanol dehydration to DME is catalyzed by acid catalysts. Al2O3 alone is active for the formation of DME from methanol [18]. However, Pd/ZnO is inactive for the dehydration of methanol to DME [19, 20]. Therefore, it is reasonable to assume that for the Pd/ZnO/Al2O3 catalysts, the Al2O3 support is the source of acidity. NH3-TPD experiments were conducted to determine the concentration of the acid sites for the 8.8Pd/ZnO/Al2O3 catalysts and the 8.8Pd/Al2O3 catalyst. The NH3-TPD profiles (not shown) have indicated the presence of one single peak located at 180°C for all the Pd/ZnO/Al2O3 catalysts. Figure 3.10(a) shows the evolution of the amount of NH3 desorbed as a function of the Pd:Zn ratio (for the catalyst with 8.8 % Pd loading). The amount of NH3 desorbed decreases with increasing Pd:Zn ratio and is the lowest for the 8.8Pd/Al2O3 sample (with Pd:Zn = 1:0). This signifies that the concentration of acid sites decreases with increasing Pd:Zn ratio. Because the dispersion increases with the Pd:Zn ratio (see Table 3.2), the coverage of the Al2O3 support increases, and the number of accessible acid sites decreases. Note that there is a correlation between the DME selectivity and the amount of acid sites. It indicates that for the 8.8Pd/ZnO/Al2O3 catalysts, the acid sites of the Al2O3 support are active for the dehydration of methanol to DME.
3.7 Effect of PdZn Metal Loading
Catalytic activity of several Pd/ZnO/Al2O3 catalysts with the same Pd:Zn molar ratio (Pd:Zn = 0.25:1) and different Pd loadings, varying from 2.5 to 20 wt%, were examined. The results obtained at 380°C and P = 69 bar are presented in Figure 3.11. CO conversion ranges from 41 to 47 % for all Pd loadings tested. As shown in Figure 3.11(b), the CO2 selectivity is somewhat stable for all the Pd loadings tested and methanol selectivity is less than 7% for all the catalysts. Interestingly, DME selectivity goes through a maximum of 28% at 5% Pd loading. This trend in DME selectivity is opposite to the trend in CH4 selectivity. The CH4 selectivity is at its lowest (i.e., 11.2%) for 5Pd/ZnO/Al2O3-0.25. Contrary to 5Pd/ZnO/Al2O3-0.25, the IR spectra recorded for 2.5Pd/ZnO/Al2O3-0.25 suggest the presence of Pd°. The higher CH4 selectivity observed for 2.5Pd/ZnO/Al2O3-0.25, compared to 5Pd/ZnO/Al2O3-0.25 is thus attributed to the presence of Pd°. Because the CH4 selectivity increases with the Pd loading for Pd ≥5 % and no Pd° was detected by IR spectroscopy for the higher loadings one can speculate that the CH4 formation is facilitated on bigger PdZn particles.
3.12
Figure 3.9. Evolution of Conversion and Selectivity Relative to the Pd:Zn Molar Ratio. (a) Conversion and (b) the selectivity with Pd:Zn molar ratio for the supported 8.8% Pd catalysts. Reaction temperature = 380ºC, P = 69 bar, H2:CO = 2 (premix 1) and GHSV = 10 000 h-1.
Figure 3.10. Evolution of DME Selectivity and Amount of NH3 Desorbed from the Catalysts Surface as a Function of (a) Pd:Zn molar ratio and (b) Pd loading. Reaction temperature = 380°C, P = 69 bar, GHSV = 10 000h-1 and H2:CO = 2 (premix 1).
0
10
20
30
40
50
60
70
0:1 0.2:1 0.4:1 0.6:1 0.8:1 1:0
CH4
CO2
ethaneCH3OH
DME
Sel
ecti
vity
(%)
Pd:Zn (moles)
(b)
0
5
10
15
20
25
30
35
40
45
50
0:1 0.2:1 0.4:1 0.6:1 0.8:1 1:0Pd:Zn (moles)
CO
Con
vers
ion
(%)
(a)
DM
E se
lect
ivit
y (%
)
NH
3d
esor
bed
(μm
oles
.m-2
)
Pd loading (%)
0
10
20
30
40
50
60
0
0.5
1
1.5
2
2.5
3
3.5
4
4.5
5
0 10 20 30
DME selectivity equilibrium
(b)
NH
3d
esor
bed
(μm
oles
.m-2
)
DM
E se
lect
ivit
y (%
)
Pd:Zn (moles)
0
10
20
30
40
50
60
0
0.5
1
1.5
2
2.5
3
3.5
4
4.5
5
0 0.5 1 1.5
(a)
DME selectivity equilibrium
3.13
Figure 3.11. Evolution and Product Selectivity as a Function of Pd Loading. (a) Conversion and (b)
product selectivity as a function of the Pd loading for the Pd/ZnO/Al2O3 catalysts with a Pd:Zn molar ratio equal to 0.25:1. Reaction temperature = 380ºC, P= 69 bar, H2:CO = 2 (premix 1) and GHSV = 10 000h-1.
Figure 3.10(b) shows the NH3 TPD results as a function of Pd loading. The amount of NH3 desorbed increases with the Pd loading from 2.5 to 8.8 % Pd and decreases for the highest loading. The DME selectivity and the amount of NH3 desorbed (i.e., amount of acid sites) from the catalyst surface follow the same trend with the increase of the Pd loading. This further confirms the acid sites of the catalysts are active for the production of DME.
From the analysis of the influence of the Pd loading and Pd:Zn molar ratio on the reactivity of the Pd/ZnO/Al2O3 catalysts, we can conclude that under these reaction conditions the sample with 5% Pd and a Pd:Zn molar ratio equal to 0.25:1 is preferred for syngas conversion to methanol and DME.
3.8 Effect of Syngas Ratio
The effect of feed syngas ratio on the catalytic performance of this composition is examined on 5Pd/ZnO/Al2O3-0.25, identified above as the most selective catalyst under these conditions. H2:CO molar ratios of 1.0, 2.0, and 3.0 were evaluated and the results are shown in Figure 3.12. Carbon monoxide conversion increases whereas the CO2 selectivity decreases with the increase of the H2:CO ratio [see Figure 3.12(a)]. DME selectivity increases from approximately 11 to 32% when increasing the H2:CO ratio from 1.0 to 3.0. The methanol selectivity is approximately 4% at H2:CO = 1, and then approaches zero at higher H2:CO ratios. Interestingly, CH4 production also decreases with feed syngas ratio, from approximately 6 to 2% for H2:CO = 1.0 and H2:CO = 3.0, respectively. Methanol synthesis and subsequent methanol dehydration is thus favored over CO methanation or DME hydrogenolysis for these higher H2-containing feeds.
CO2
CH4
ethaneCH3OH
DME
0
10
20
30
40
50
60
70
0 5 10 15 20 25Pd loading %
Sel
ecti
vity
(%)
(b)
0 5 10 15 20 25
Pd loading %
CO
Con
vers
ion
(%)
0
5
10
15
20
25
30
35
40
45
50
0 5 10 15 20 25
(a)
3.14
Figure 3.12. Effect of Feed Gas Composition on (a) Conversion and (b) Selectivity for the 5Pd/ZnO/Al2O3-0.25 Catalyst. For H2:CO = 1 (premix 2), for H2:CO = 2 (premix 3) and for H2:CO = 3 (premix 4). Reaction temperature = 380°C, P = 69 bar, and GHSV = 10 000 h-1.
3.9 Conclusions
In this study, we demonstrated the use of a Pd/ZnO/Al2O3 catalyst for the high-temperature production of methanol and DME from syngas and contrasted its activity with that of a commercial Cu/ZnO/Al2O3 catalyst. The PdZn-formulation outperforms the Cu-based formulation at these conditions, which are directly relevant to the potential single-step syngas-to-gasoline concept that combines methanol/DME synthesis with MTG in a single reactor. By studying the influence of Pd loading and Pd:Zn molar ratio, a catalyst with 5% Pd and a Pd:Zn molar ratio of 0.25:1 has been identified as the best performing catalyst. Since Pdo promotes the formation of CH4 over methanol it is critical that catalyst synthesis avoid generation of Pdo. A direct relationship between DME selectivity and concentration of acid sites was shown. Hence, two types of sites are required for the direct conversion of syngas to DME: 1) PdZn particles that are active sites for the synthesis of methanol from syngas, and 2) acid sites that are active for the conversion of methanol to DME. Results have shown that a non-negligible amount of undesired CH4 is produced during reaction at high operating temperatures. Also, under the conditions tested, the PdZn particles were quite active for the WGS reaction, leading to the formation of a large amount of CO2 at the expense of DME formation. To consider Pd/ZnO/Al2O3 as a realistic catalyst for direct conversion of syngas to gasoline it will be necessary to further investigate the parameters that could favor the methanol synthesis reaction and further lower CH4 formation and WGS activity.
0.0 1.0 2.0 3.0 4.00
10
20
30
40
50
60
70
80
90
0
10
20
30
40
50
60
70
80
H2/CO ratio
CO
2se
lect
ivit
y (%
)
CO
con
vers
ion
(%)
CO2conversion
(a)
0
5
10
15
20
25
30
35
40
0.0 1.0 2.0 3.0 4.0
CH4
CH3OH
DME
sele
ctiv
ity
(%)
H2/CO ratio
(b)
4.1
4.0 Single-Step Syngas-to-Distillates Conversion
This portion of the report describes experimental studies of this proposed one-step S2D process. Discussed are the effects that a composite Pd/ZnO/Al2O3 and HZSM-5 catalytic system have on methanol synthesis, methanol dehydration, and MTG reactions. The effects of operating temperature, pressure, and GHSV on catalytic performance are shown. Altering Pd and Zn compositions of the methanol/DME synthesis catalyst also were studied. Finally, addressed are problems related to olefin hydrogenation and CO2 formation that occur over a combined bed. Appendix B contains performance information details comparing catalyst beds when sequentially ordered (Pd/ZnO/Al2O3 followed by ZSM-5) and physically mixed Pd/ZnO/Al2O3 and ZSM-5 catalyst.
4.1 Reactions for the Single-Step Syngas-to-Gasoline Conversion
There are several reactions that can occur in the single-step conversion of syngas-to-gasoline, using a route through methanol. Direct DME synthesis involves several competing reaction pathways. Methanol synthesis (Eqs. 1 and 2) and WGS (Eq. 3) are equilibrium reactions:
CO + 2 H2 ↔ CH3OH ΔH0 = -92.0 kJ/mol (1)
CO2 + 3 H2 ↔ CH3OH + H2O ΔH0 = -49.5 kJ/mol (2)
CO + H2O ↔ CO2 + H2 ΔH0 = -41.1 kJ/mol (3)
Methanol synthesis typically requires high operating pressure, typically in excess of 1000 psig, and low temperature, usually <280°C, to achieve maximum conversion [15]. Dehydration of methanol to DME occurs over acidic sites and proceeds according to Eq. 4:
2 CH3OH ↔ CH3OCH3 + H2O ΔH0 = -23.6 kJ/mol (4)
Methane forming reactions possibly could occur from the hydrogenolysis of DME (Eq. 5) or from methanation reactions (Eqs. 6 and 7). It should be noted that when operating at low temperatures (<280°C) usually employed for direct DME synthesis, these reactions are not observed to any great extent. However, methanation could be catalyzed over metallic catalysts.
Methanol is first dehydrated to DME over acid sites through a mechanism thought to involve the formation of surface methoxy groups formed by protonation and subsequent removal of water [21]. The conversion of DME to light olefins is believed to be rate limiting. This reaction step has been the topic of extensive discussion throughout the years. More than 20 possible mechanisms have been proposed for the formation of the first C−C bond formation from the C1 reactants [21]. Oligomerization of the alkenes probably involves carbocation intemediates, by protonation of alkene double bonds. Aromatization and alkylation reactions also occur with the liquid product resulting in a mixture of alkanes, cycloalkanes, and aromatics [21]. For purposes of gasoline production, MTG processes are typically operated in the 325 to 375°C temperature and the 200 to 400 psig pressure range [22].
Combining of methanol synthesis and MTG results in an even more complex reaction scheme. Separately, these reactions are typically operated under different temperature and pressure regimes for optimum process efficiency. Futhermore, in the presence of H2, hydrogenation of the alkene intermedicates present an undesirable reaction pathway. Saturation of alkene intermediates to alkanes can limit the production of liquids made through a subsequent oglimerization step. The presence of H2 also presents the possibilty for undesirable methanation to occur.
4.2 Methanol Feed Hydrogenation Studies
Hydrogenation studies were performed to understand the effect that H2 plays in the MTG reaction, especially in the presence of a mixed zeolite-Pd/ZnO/Al2O3 catalyst. Four cases were explored. Methanol was fed either with N2 or H2, over a bed containing zeolite only, or physically mixed with both zeolite and Pd/ZnO/Al2O3. The mass of zeolite used for all the runs was the same to maintain the same residence time over the zeolite portion of bed. As shown in Table 4.1 methanol conversion was >96% for all four cases tested. Over a zeolite-only catalyst bed, the amount of liquid produced was similar in the presence of N2 or H2 (4.1 and 4.0 mg/min, respectively). Thus, the presence of H2 had little effect over the zeolite. However, in the case of the mixed catalyst, liquid production decreased to 2.8 mg/min for methanol/N2, and even further decreased to 1.1 mg/min for methanol/H2. These results indicate that the Pd/ZnO/Al2O3 catalyst interferes with the mechanism for liquid production. A significant portion of the methanol is decomposed to CO and H2, or steam reformed to CO2 and H2. Steam reforming is enabled by H2O being present as a result of the methanol and olefin dehydration reactions. Under reducing conditions, hydrogenation of the olefinic intermediates formed as a result of DME dehydration over the zeolite, occurs as well over the PdZn alloy metal sites. Thus, adding H2 to the feed further diminishes liquid yield.
Interestingly, while the liquid yield decreases in the presence of Pd/ZnO/Al2O3, variation of the liquid product is only somewhat affected. The resulting liquid condensate carbon number distribution is shown in Figure 4.1(a). Over zeolite alone, under non-reducing and reducing conditions, the liquid selectivity to C10 was 45% and 41%, respectively. With the addition of PdZn/Al2O3, the liquid contained approximately 50% and 61% selectivity to C10 in inert and reducing atmospheres, respectively. The addition of H2 in the presence of Pd/ZnO/Al2O3 appears to have shifted the liquid product slate slightly to heavier compounds. The C10 compounds produced were predominately tetramethylbenzenes in all four cases. The breakdown between unreacted methanol, paraffins, and aromatics formed in the liquid also can be seen in Figure 4.1(b). Again, there are only some minor differences in liquid product class selectivity.
4.3
Table 4.1. Results for Methanol Feed Hydrogenation Comparison Studies. Comparisons of zeolite and a mixed ZSM-5-Pd/ZnO/Al2O3 Catalyst System at 1000 psig and 375°C (with feed compositions of 67% MeOH + 33% H2 or N2).
Zeolite Bed Mixed Bed
Feed MeOH
N2
MeOH
H2
MeOH
N2
MeOH
H2
Methanol Conversion, wt% 97.1 97.0 96.8 99.1
Liquid Production Rate,a mg/min 4.1 4.0 2.8 1.1
a “Liquid production” is defined as the amount of resulting liquid condensable product formed (species identification shown in Figure 4.1) divided by the experiment duration time.
Thus, the addition of metal Pd/ZnO/Al2O3 to the zeolite under relatively severe process conditions (P = 1000 psig, T = 375°C) has the effect of generating more gas species and less liquid product. Methanol decomposition, methanol steam reforming, and WGS all occur. Furthermore, hydrogenation of the MTG-derived olefinic intermediates is possibly occurring over PdZn. However, the liquid species that do form are similar, as in the case without metal present. Chain growth oligomerization still occurs, resulting in the production of high carbon number-containing liquid species. Thus, these hydrogenation test results provide reason to believe that a mixed catalyst system could produce liquid product, when starting from a H2-containing syngas feed. However, there does appear to be significant room for improvement in enhancing liquid production. Regardless, these preliminary findings encouraged us to investigate further into the, mechanistically more complicated, syngas catalysis over a combined bed containing Pd/ZnO/Al2O3 and ZSM-5.
4.3 Syngas Feed Product Distribution and Effect of Pressure
Syngas conversion was performed over physically mixed Pd/ZnO/Al2O3 and HZSM-5 at 375°C, after in situ reduction as described above. Operating pressures of 300, 500, and 1000 psig were evaluated, under otherwise identical conditions. Initial steady-state conversion and selectivity results are shown in Figure 4.2(a). At 300 psig a CO conversion of 75% was achieved, increasing to a maximum of 85% at 500 psig. Hydrogen conversion increased from 40 to 53% when increasing the pressure from 300 to 1000 psig, respectively. As expected higher pressure, favoring methanol synthesis (Eqs. 1 and 2), offers enhanced conversion. Also as expected, CO conversion is significantly higher than would be expected in thermodynamically limited methanol synthesis only. In this composite catalyst system, methanol now represents an intermediate that is converted to DME and hydrocarbons, easing the thermodynamic constraint and resulting in higher CO conversion.
4.4
(a)
(b)
Figure 4.1. Methanol Hydrogenation Liquid Product Distributions. Distributions as a function of (a) carbon number (note: “C1” = methanol) and (b) product class, over zeolite (“MTG”) and mixed zeolite-Pd/ZnO/Al2O3 (“mixed”) catalyst beds in the presence of either nitrogen or H2 (T = 375°C, P = 1000 psig, feed composition: 67% MeOH + 33% H2 or N2).
4.5
(a)
(b)
Figure 4.2. Syngas Conversions and Selectivities and Hydrocarbon Composition Breakdowns. (a) CO and H2 conversion, and selectivity to hydrocarbons, oxygenates, or CO2 selectivity, and (b) hydrocarbon composition breakdown as a function of pressure over mixed zeolite-Pd/ZnO/Al2O3 catalyst system [T = 375°C, GHSV = 743 hr-1, feed: H2:CO = 2 (mol), CO:CO2 = 3.2 (mol), cat. vol. ratio: HZSM-5/8.9PdZnAl = 3].
A selectivity variation also can be observed with increasing pressure. Increasing pressure from 300 to 1000 psig resulted in increased hydrocarbon selectivity from 67 to 77%, and decreased CO2 selectivity from 28 to 17%, respectively. Higher pressure favors methanol synthesis which can explain the hydrocarbon selectivity enhancement. Carbon dioxide is formed from the WGS reaction (Eq. 3) over the Pd/ZnO/Al2O3 catalyst. Oxygenate selectivity, comprising primarily methanol and acetone, remained
0
10
20
30
40
50
60
70
80
90
100
200 400 600 800 1,000
Conv
ersi
on o
r Sel
ectiv
ity (w
t.%)
Pressure (psig)
XCO
SHC
XH2
SCO2
Soxy
0102030405060708090
100
200 400 600 800 1000
HC C
ompo
sitio
n (w
t.%)
Pressure (psig)
C2-4
C1
C5+ ₊
₋
4.6
relatively unchanged, with variation in pressure, at approximately 5%. Acetone is potentially formed from propylene and oxygenated intermediates, a mechanism known from the Cumene process that is used for the production of acetone [23].
Hydrocarbon product breakdown in terms of carbon number can be seen in Figure 4.2(b). Little variability in hydrocarbon product was observed with changing pressure. C1 (CH4) varied from 10 to 13%, C2−C4 hydrocarbons were by far the majority product ranging from 84 to 77%, and desirable C5+ fuels were scarce constituting only 6 to 10% of the hydrocarbon product, with content increasing with pressure. A significant amount of aliphatic C2‒C4 hydrocarbons were formed as a result of hydrogenation of C2−C4 olefin intermediates, formed from DME in the zeolite, over PdZn metal sites. As further discussed below, the effect of temperature has a great impact on C2−C4 hydrocarbon formation.
The C5+ liquid species that were produced consisted primarily of methylated benzenes. In Figure 4.3, the wt% product in the liquid condensate as a function of operating pressure is shown. Products were predominantly a mixture of polymethylbenzenes (PMB’s), consisting of tetramethylbenzenes, pentamethylbenzene, and hexamethylbenzene. Operating at high pressure and temperature produced polymethylated single ring aromatics with carbon numbers of up to 12. It should be noted that a significant fraction of the liquid contained 1,2,4,5-tetramethylbenzene, commonly known as durene. Durene content in the finished fuel must be minimized, as crystallization can easily occur because of its relatively high melting point (79°C).
Figure 4.3. GC species Identification of Liquid Condensate as a Function of Operating Pressure. Includes only compounds that account for >0.2 wt% of the total product (T = 375°C, GHSV = 743 hr-1, feed: H2:CO = 2 (mol), CO:CO2 = 3.2 (mol), cat. vol. ratio: HZSM-5/8.9PdZnAl = 3).
4.7
4.4 Temperature Effect and Catalytic Stability
Syngas conversion was measured over physically mixed Pd/ZnO/Al2O3 and HZSM-5 as a function of temperature when operating at 300 psig. Initial steady-state conversions and selectivities are shown in Figure 4.4(a). At 310°C, the CO and H2 conversions were 64 and 28%, respectively. Maximum CO and H2 conversion of 85% and 46%, respectively, occur at 340°C. At 375°C, CO and H2 conversion decreased to 75% and 40%. When the temperature was increased from 340°C to 375°C, equilibrium limitations for the methanol synthesis portion of the reaction scheme likely inhibit further CO conversion. Carbon dioxide selectivity decreases with increasing temperature while hydrocarbon selectivity increases.
The hydrocarbon fraction is further broken down according to carbon number and the results are shown in Figure 4.4(b). Selectivity to C2‒C4 hydrocarbons increases with increasing temperatures as hydrogenation of the olefinic intermediates intensifies. Therefore, not surprisingly, C5+ hydrocarbon products decrease with increasing temperature. Methane (C1) selectivity increases from 4 to 10% when increasing temperatures from 310°C to 375°C, respectively. At 310°C, the temperature most favorable for liquid production under the conditions tested, selectivity to C5+ was 35% while selectivity to C2‒C4 products was 61%. These results highlight that hydrogenation of the olefin intermediates, while lessened, is still problematic even at reduced temperature.
The stability of the composite catalyst system was assessed when operating at 310°C and 300 psig. Catalytic performance results over the course of 50 hours on-stream are shown in Figure 4.5. Carbon monoxide conversion decreased from 64% to 56% and H2 conversion from 28% to 24% after 50 hours on-stream. Some observed deactivation is not surprising, as acid-catalyzed MTG is well known to produce carbon deposits over HZSM-5 zeolite. In our other reported study specifically for methanol and DME synthesis we have shown the Pd/ZnO/Al2O3 catalyst to be quite stable under similar conditions [24]. Thus, addition of acidic zeolite did indeed adversely affect stability. It should be noted that, when increasing temperature, first to 340°C then to 375°C, the catalyst was found to be increasingly unstable with temperature. At increased temperatures, deactivation, speculated to be due to coking, was even more accelerated. Operating at the lower temperature of 310°C resulted in enhanced selectivity toward liquid production and with mitigated deactivation, albeit with somewhat lower total activity. It should be further noted that when operating at higher syngas ratio (e.g., H2:CO = 3) stability was improved. At the lower syngas ratio (e.g., H2:CO = 1) stability was poorer. Higher H2 partial pressure likely reduces coke formation resulting in improved stability. A similar result was reported by Mohanty et. al. for a bi-functional CuO‒CuO‒Cr2O3 mixed MFI zeolite system [25].
4.8
(a)
(b)
Figure 4.4. Syngas Conversions and Selectivities and Hydrocarbon Composition Breakdowns. As a function of (a) CO and H2 conversion, and selectivity to hydrocarbons, oxygenates, or CO2 selectivity, and (b) hydrocarbon composition breakdown as a function of temperature over mixed zeolite-Pd/ZnO/Al2O3 catalyst system [P = 300 psig, GHSV = 743 hr-1, feed: H2:CO = 2 (mol), CO?CO2 = 3.2 (mol), cat. vol. ratio: HZSM-5/8.9PdZnAl = 3].
0102030405060708090
100
300 310 320 330 340 350 360 370 380 390
Conv
ersi
on o
r Sel
ectiv
ity (w
t.%)
Temperature (oC)
XH2
Soxy
SCO2
SHC
XCO
0102030405060708090
100
300 310 320 330 340 350 360 370 380 390
HC
Com
posi
tion
(wt.
%)
Temperature (oC)
C2-4
C1
C5+
₋
₊
4.9
Figure 4.5. Stability Profiles at 310°C and 300 psig. Conditions are GHSV = 743 hr-1, feed: H2:CO = 2 (mol), CO:CO2 = 3.2 (mol), cat. vol. ratio: HZSM-5/8.9PdZnAl = 3.
4.5 Gas-Hour-Space Velocity Effect
The effect of varying GHSV was evaluated by running at GHSV = 740, 1490, and 2970 hr-1. Initial steady-state catalytic performance results, when operating at 375°C and 1000 psig, are shown in Figure 4.6. As would be expected, with increasing throughput, there was a corresponding decrease in CO and H2 conversion, decreasing from 85 to 68%, and 53 to 36%, respectively, over the range of GHSVs evaluated. Selectivities, however, do not vary significantly. Selectivity to hydrocarbons, CO2, and oxygenates range from 77 to 71%, 17 to 21%, and 6-8%, respectively. Of the C5+ hydrocarbons produced, there is an increase in CH4 production, and a corresponding decrease in C2‒C4 production, when increasing the GHSV from 1490 to 2970 hr-1. These results demonstrate that running at higher space velocities, in the range evaluated, does not negatively affect C5+ selectivity to any great extent.
4.6 Effect of Pd/Zn Ratio and Pd Loading
Syngas conversion over composite catalytic systems was performed with Pd/ZnO/Al2O3 catalysts with varying Pd contents and Pd/Zn ratios. Our previous studies using the Al2O3 support have shown these to be key variables when optimizing catalytic performance for methanol steam reforming [26], and more recently, for methanol and DME synthesis from syngas [24]. For the methanol steam reforming reaction, a Pd:Zn molar ratio of approximately 0.38 was found to result in optimum conversion [26]. Keeping the total molar Pd + Zn content the same, lower Pd/Zn ratios produced Zn-rich material resulting in too few PdZn alloy sites for optimum activity. Higher Pd/Zn ratios produced a Pd-rich composition resulting in the presence of metallic Pd sites. Methanol steam reforming was found to be more active and selective over PdZn alloy than Pd, and formation of the latter inhibits activity. Thus, an optimum Pd:Zn ratio exists where the presence of alloy is maximized and free Pd or Zn minimized. Similarly, for the case of methanol synthesis, we report above that metallic Pd was found to be less active for methanol synthesis and more active for CH4 formation [24]. Catalysts with varying Pd:Zn ratios, but keeping the
0
10
20
30
40
50
60
70
0 5 10 15 20 25 30 35 40 45 50 55
Conv
ersi
on o
r Sel
ectiv
ity (w
t.%)
Time-on-stream (hrs)
XCO
SHC
XH2
SCO2
Soxy
4.10
same Pd loading, were prepared and evaluated. Resulting catalytic materials contained primarily PdZn alloy, as evidenced by XRD. However, IR spectroscopy, a technique sensitive to surface composition, revealed the presence of small amounts of unalloyed metallic P, that increased with increasing Pd/Zn ratio. Activity tests demonstrated that CH4 formation increased on catalytic materials with increasing Pd/Zn ratio. This is attributed to increasing metallic Pd content [24].
(a)
(b)
Figure 4.6. Syngas Conversions and Selectivities and Hydrocarbon Compositon Breakdowns.
(a) Conversion and selectivity and (b) hydrocarbon composition breakdown as a function of gas-hour space velocity (GHSV) over mixed zeolite Pd/ZnO/Al2O3 catalyst system (T = 375°C, P = 1000 psig, feed: H2:CO = 2 (mol), CO:CO2 = 3.2 (mol), cat. vol. ratio: HZSM-5/8.9PdZnAl = 3).
0102030405060708090
100
500 1,000 1,500 2,000 2,500 3,000
Conv
ersi
on o
r Sel
ectiv
ity (w
t.%)
Gas-hour space velocity (hr-1)
XCO
XH2
SCO2
SHC
Soxy
0
10
20
30
40
50
60
70
80
90
500 1000 1500 2000 2500 3000
HC C
ompo
sitio
n (w
t.%)
Gas-hour space velocity (hr-1)
C2-4
C1
C5+
₋
₊
4.11
For the purpose of this study, it is also desirable to minimize metallic Pd formation. Hydrogenation of CO to CH4 and also the hydrogenation of the olefenic intermediates formed in the MTG reaction should be avoided if at all possible. Unfortunately, as discussed above, PdZn alloy also appears to catalyze olefin hydrogenation as well. PdZn alloy sites are necessary for methanol synthesis, however. In attempt to improve yield to desirable liquid product formation, the Pd and Zn content of the methanol catalyst was varied. These methanol catalysts were again mixed with zeolite for syngas conversion studies.
Catalytic performance results for syngas conversion at 310°C and 300 psig, comparing two different Pd/ZnO/Al2O3 catalyst formulations when mixed with HZSM-5 zeolite, are shown in Table 4.2. Not surprisingly, conversion favored the catalysts with the highest total metal content. Carbon monoxide and H2 conversions were 43% and 19% for the 5.5PdZnAl (Pd/Zn = 0.25 mol) catalyst, respectively, and 64% and 28% for the 8.9PdZnAl (Pd/Zn = 0.38 mol) catalyst, respectively. Differences in selectivity to CO2, oxygenates, or hydrocarbons also were observed. Selectivity slightly favored hydrocarbon formation with the 5.5PdZnAl catalyst, which contained less Pd metal and lower PdZn alloy content. The higher metal-containing 8.9PdZnAl catalyst produced more CO2. Increasing PdZn content appears to favor the WGS reaction over methanol formation. Of the hydrocarbons produced, the 8.9PdZnAl catalyst produced a higher number of C2‒C4 alkane species (61 wt%) compared to 5.5PdZnAl (52 wt%). This can be attributed to enhanced C2‒C4 olefin hydrogenation due to increased CO conversion. For the 5.5PdZnAl catalyst, 44 wt% were C5+ range whereas only 35 wt% for the 8.9PdZnAl formulation. Both catalysts produced a significant fraction of aromatic species, particularly poly-methyl benzenes. The yield of C5+ liquid hydrocarbon product from both catalysts was approximately 9.2 to 9.4%. These results represent the best liquid yield for all the conditions tested in this study.
4.7 General Discussion on Mechanistic Limitations
From the above results it is can be seen that varying Pd:Zn ratio and total PdZn content can affect conversion and selectivity to the various products. However, high selectivity to liquid product was very difficult to achieve because of the competing reactions that occur over PdZn. Furthermore, we do know from previous characterization studies that, while metallic Pd is present to a small degree in these catalysts, the dominant phase is PdZn alloy [24]. Thus, it can be concluded that PdZn alloy does indeed catalyze methanol formation. However, PdZn also catalyzes both the WGS reaction, which produces great amounts of CO2, and to a lesser degree methanation. Additionally, PdZn catalyzes hydrogenation of the olefinic intermediates that are produced in the MTG reaction mechanism over zeolite. This results in a high amount of C2‒C4 alkane formation. Thus, considering all these competing reactions, liquid formation does occur albeit in relatively low yield.
Changing process conditions greatly affects conversion and selectivity. As discussed above, adjusting the temperature, pressure, and GHSV all affect rates for the many competing reactions. Balancing of metal and acid sites, offered by the PdZn and zeolite, respectively, present an additional variable. However, under all the conditions tested in the course of this study, liquid product formation was limited, and light alkanes predominated. Figure 4.7 graphically highlights the degree of light olefin saturation for a variety of process conditions. The hydrocarbon/oxygenate product selectivity ratio was plotted as a function of the (C2‒C4)alkane:C5+ hydrocarbon product ratio. As hydrocarbons are increasingly being formed, from methanol as the primary “oxygenate” product, C2‒C4 alkanes are also increasingly being produced, as compared to C5+ formation. Oxygenate conversion over the acidic zeolite leads to
4.12
olefin formation prior to higher carbon product formation. As the olefins are being formed, they also are increasingly being hydrogenated to alkanes. The C5+ product is being produced but at a slower rate relative to alkane saturation. This trend holds similar for the variety of conditions as shown in Figure 4.7. We concluded that producing high yields of C5+ liquid product from syngas using PdZn alloy metal sites plus zeolite is extremely challenging.
Table 4.2. Catalytic Performance Comparison between Two Different Pd/ZnO/Al2O3 Methanol Catalysts. Comparisons with varying Pd and Zn compositions, when mixed with HZSM-5 (5.5PdZnAl contains 5% wt% Pd, Pd/Zn = 0.25 molar ratio, and 8.9PdZnAl contains 8.9 wt% Pd, Pd/Zn = 0.38 molar ratio; both supported on Al2O3).
5.5 PdZnAl/HZSM-5 8.9 PdZnAl/HZSM-5
Process Conditions:
H2:CO [mol] 2 cat. wt. ratio HZSM-5/PdZnAl 3
T [°C] 310 P [psig] 300
GHSV [hr-1] 743 Results:
Initial Conversion [wt%]
XCO 43 64
XH2 19 28
Selectivity [% wt. CO converted]
SCO2 35 45
SHydrocarbon 49 42
Soxy 16 13 Hydrocarbon Composition [wt%]
C1 4 4
C2 25 30
C3 20 25
C4 7 6
C5+ 44 35
Aromatics in C6+ wt.% 81 76
C10 Aromatics in C6+ wt.% 62 52
Tetra-methyl benzenes in C6+ wt.% 61 51
Durene in C6+ wt.% 31 16
Yield C5+ Hydrocarbon [wt.%] 9.2 9.4
4.13
Figure 4.7. Measure of Light Olefin Saturation for a Variety of Process Conditions. Ratio of hydrocarbon to oxygenate product selectivity as a function of the ratio of light alkane (C2‒C4) formation to C5+ hydrocarbon product. Conditions held constant (T = 375°C, P = 300 psig, catalyst ratio [HZSM-5/8.9PdZnAl] = 3 (wt.), syngas ratio (H2:CO) = 2 [mol] except where noted when varying temperature [310, 345, and 370°C], pressure [300, 500, and 1000 psig), GHSV (740, 1500, 3000 hr-1), zeolite/methanol catalyst ratio (1, 3, 6 by wt.), and syngas ratio (H2:CO = 1, 2, 3 molar).
These results suggest that Pd/ZnO/Al2O3 is probably not a suitable catalyst for use in a combined syngas-to-gasoline type process. However, this does not preclude the use of other catalyst types. Furthermore, oxygenates other than methanol and dimethyl ether could act as intermediates. For example, molybdenum supported on HZSM-5 was reported by Liu et. al. as an active catalyst for the synthesis of gasoline-range hydrocarbons [27]. It was reported that the mechanism involved mixed alcohols as the intermediates for hydrocarbon formation. Thus, intermediate-producing species other than methanol and/or dimethyl ether could be evaluated, opening the range of potential catalyst types that could be used for single-step conversion purpose. Of importance is discovery of catalysts that suppress CO2 and light hydrocarbon formation and, thus, enable selective hydrocarbon conversion.
4.8 Conclusions
A Pd/ZnO/Al2O3 catalyst, reported above to be very active for methanol synthesis and stable at temperatures exceeding 300°C, was evaluated in a composite catalyst system mixed with HZSM-5. This catalytic system was found to be active for the conversion of syngas to liquid fuel product, including gasoline-range hydrocarbons. Of the C5+gasoline-range hydrocarbons produced, polymethylbenzenes up to C12 were the primary constituents. Temperatures between 310 and 375°C and pressures between 300 and 1000 psig were evaluated using a molar feed syngas ratio (H2:CO) of 2.0. Even operating at a relatively low operating pressure of 300 psig resulted in the production of gasoline-range liquids with high conversion. Thermodynamic constraint, which exists for methanol synthesis alone, is relaxed when methanol and DME are intermediates for the formation of hydrocarbons. Operating at a relatively low temperature of 310°C resulted in enhanced C5+ liquid production and diminished undesirable C2‒C4 alkane production. However, lower temperature operation also resulted in enhanced CO2 formation. Operating under increased gas-hourly throughput resulted in little change in liquid product selectivity,
0
5
10
15
20
25
30
0 5 10 15 20
S HC/
S Oxy
(C2-C4)alkanes/C5+
Temperature (8.9 PdZnAl)Temperature (5.5 PdZnAl)PressureGHSVCatalyst Ratio Syngas Ratio
4.14
albeit at the expense of lessened overall conversion. In addition, operating with high H2 partial pressure also helped improve catalytic stability. This is likely due to a reduction in coke formation.
However, selectivity control was difficult all for the conditions and catalysts tested. Carbon dioxide formation occurring as a result of WGS activity over PdZn metallic sites was quite problematic. Also problematic was saturation of the olefinic intermediates, formed over zeolite acid sites and necessary for chain growth. Facile hydrogenation of the olefins led to a high degree of light alkane formation. Producing C5+ liquid product in high yield from syngas, specifically utilizing PdZn alloy sites as a means for intermediate methanol production, is challenging.
5.1
5.0 Process Design and Economics
In this chapter, we explore the economics for a process combining methanol synthesis and MTG in a single-reaction step [28]. After all, the purpose of developing this technology is to reduce the system complexity of the two-step conventional S2D technology, and thus reduce both the equipment and operating costs. Techno-economic analyses were implemented to evaluate two versions of the single-step S2D process, including the SOT case based on the best available experimental results and a goal case assuming the same performance as the conventional S2D case, but with a single-step S2D process. These two cases are compared to a conventional two-step S2D case. The objective of this study is to identify the best estimates of the major performance and cost of a biomass-to-gasoline system, the gap between the SOT and goal cases, and the potential directions of future development of the single-step S2D concept. Details for the process schemes and how the analysis was performed are provided in Section 2.4 and Appendix C and Appendix D. Major inputs and assumptions for the synthesis reactor performance are provided in Table 2.3.
5.1 Performance and Cost Results
The major performance results for the three cases are listed in Table 5.1. The SOT case (using current catalyst activity results) has much lower carbon efficiency than the goal case (using assumed catalyst activity), resulting from lower distillate and LPG yields. As shown in Table 2.3, the hydrocarbon selectivity for LPG and distillate components of the SOT case are much lower than the other two cases, which leads to the low final yields. The high light hydrocarbon (C1‒C2) yield of the SOT case leads to high recycle flow and high heat load in the tar reformer. The high process flow rate and high tar reformer heat load lead to high steam generation from process heat recovery. As a result, the SOT case has a much larger steam turbine than the other two cases, which leads to higher cooling water and boiling feed water flow rate. Part of the shaft work of the steam turbine for the SOT case is used to drive the clean syngas compressor. The reported electricity generated in Table 5.1 is the electricity generated from the steam turbine and the recycle gas expander reducing the shaft work used by the clean syngas compressor. For the other two cases, the shaft work of steam turbine is not enough to drive the clean syngas compressor. Therefore, the net electricity consumption of the SOT case is much lower than the other two cases. However, the energy efficiency of the SOT case is much lower than the other two cases mainly because of the lower final product yield. Because the distillate products have different heating values, the final product yield in gallon of gasoline equivalent (GGE) is used to compare the processes.
The major cost analysis results for the three cases are listed in Table 5.2. Compared to the conventional case, the goal case has approximately an 8% decrease in total capital investment. Capital costs are $376M and $346M for the conventional and goal cases, respectively. The minimum fuel selling price (MFSP) is $3.29/GGE and $2.79/GGE for the conventional and goal cases, respectively. This represents a 16% fuel selling cost advantage for the goal case. Thus, the goal case has both capital and operating cost advantages as compared to the conventional case. However, these savings are relatively modest. Furthermore, realization of the goal case is contingent upon future process performance improvements to the current SOT.
5.2
Table 5.1. Performance Results for the Three Biomass-Gasification-Based S2D Systems
H2 feed to heavy gasoline treatment (L/L product) 21.3 0 6.3 H2 consumption (L/L product) 17.7 0 5.4 Carbon Efficiency Carbon Efficiency (% C based on biomass, distillates only) 17.7% 32.7% 30.8% Overall Carbon Efficiency (% C based on biomass, all products) 20.0% 35.8% 35.1% Water Usage Cooling Water Make-up (L/L product) 8.7 3.6 3.7 Boiler Feedwater Make-up (L/L product) 3.8 1.1 1.9
Total Water Usage (L/L product) 12.5 4.7 5.6 Electricity Usage Electricity Required (kWh/L product) 1.0 1.7 2.3 Electricity Generated (kWh/L product) 0.9 1.3 0.8 Estimated Required Electricity (kWh/L product) 0.1 0.4 1.5 Energy Efficiency Distillates Product Energy Efficiency (%, higher heating value basis) 24.0 43.7 39.5 Overall Product Energy Efficiency (%, higher heating value basis) 27.5 48.3 45.5
Distillates Yield (million GGE/yr) 23.6 43.6 41.4
5.3
Table 5.2. Cost results for the three biomass-gasification based S2D systems.
Compared to the goal case, the SOT case has much higher capital cost for the S2D process. The lower conversion efficiency and higher light hydrocarbon yields of the SOT case lead to a large gas recycle rate in the synthesis loop, which leads to larger equipment size and thus higher cost. The lower space velocity for the SOT case also contributes to larger S2D reactor size and higher cost. In addition, as discussed above, the SOT case has a large steam turbine and high steam flow rate, which lead to higher costs for the steam cycle compared to the other two cases. The total installed cost of the SOT case is about 38% higher than that of the goal case and 21% higher than that of the conventional case. The three cases have the same feedstock cost because the feedstock feed rate is fixed for this analysis. For the other variable operating costs, the value of the goal case shows negative. This indicates that the byproduct credit is higher than the other variable operating costs (not including feedstock) for this case. The MFSP of the SOT case is almost twice of the other two cases because of its low final product yield.
The goal case is improved over the SOT case by modifying the following S2D process specifications: 1) single-pass conversion, 2) distillate yield, 3) S2D synthesis space velocity, and 4) heavy gasoline treatment not used. As shown in Figure 5.1, with these changes, the MFSP of the SOT case is reduced to be the same as the goal or nth plant case. With the CO single-pass conversion efficiency increasing from 60% (SOT case) to 70% (goal case), the off-gas flow rate is reduced and the process equipment size decreases, leading to lower capital cost. Higher conversion also leads to higher product yield. Therefore, the production cost decreases about 17% over the SOT case. The second improvement is increasing distillate (C5+) hydrocarbon yield and decreasing light (C1‒C2) hydrocarbon yield correspondingly. This
Case (2007 Dollars) SOT Goal Conventional Capital costs, $ million
Feed handling & drying 28.9 28.0 28.1 Gasification 46.0 46.0 46.0 Tar reforming, compression, & WGS 57.7 52.8 50.1 Acid gas removal 14.9 11.7 13.0 S2D (synthesis and product separation) 100.9 40.7 63.8 Steam cycle 27.7 20.1 15.6 Cooling water & other utilities 4.7 4.4 4.3 Total Installed Cost, $million 281 204 221 Total Indirect Cost, $million 174 126 137 Total Capital Investment (TCI), $ million 478 346 376 Operating cost, $ million/yr
Feedstock 46 46 46 Catalysts and Chemicals 13.3 3.4 4.0 Waste Disposal 0.7 0.6 0.7 Electricity and other utilities 1.2 5.4 17.1 Co-product credits -7.8 -10.6 -14.2
Fixed Costs 22.6 17.6 18.7 Capital Depreciation 22.8 16.5 17.9 Average Income Tax 16.4 11.6 12.5 Average Return on Investment 43.5 30.4 33.1 MFSP, $/L 1.71 0.71 0.84
MFSP, $/GGE 6.75 2.78 3.29
5.4
change leads to a 37% decrease in the production cost, which results from the much higher final product yield, lower recycle gas flow rate, and thus smaller equipment size, lower tar reforming heat load, and lower utility cost. The goal case also has much higher space velocity for the S2D reaction, which leads to much smaller reactor size and lower catalyst consumption and cost. The change of the S2D space velocity to the value of the goal case leads to 5% reduction in the production cost. Eliminating the heavy gasoline treatment process from the SOT case has limited benefits for reducing production cost. This analysis reveals that the most significant factors affecting the production cost are hydrocarbon yield and single-pass conversion efficiency.
Figure 5.1. Cost Effect of Each Improvement in Moving from SOT Case to Goal Case
5.2 Sensitivity Analysis
5.2.1 Sensitivity of Performance Parameters
Four performance parameters were investigated for their effects on the production cost, namely GHSV for the S2D reaction, synthesis pressure, CO single-pass conversion, and light hydrocarbon yield. For the sensitivities of GHSV and synthesis pressure, the product yields are assumed to be unaffected by these variables. The effects of these parameters on the production cost are shown in Figure 5.2.
$0.00
$1.00
$2.00
$3.00
$4.00
$5.00
$6.00
$7.00
$8.00
SOT Increasing single pass conversion efficiency
Increasing distillate yield or decreasing
light HCs yield
Increasing STD reaction space velocity
Removing HGT
Goal
MF
SP
($/G
GE
)
Moving from SOT to Goal Case: Impact of Targets
5.5
Figure 5.2. Effects of Performance Parameters on Production Cost
If GHSV is reduced more than 70% (to about 1500 hr-1), the production cost increases significantly. Increasing GHSV above the base value (5000 hr-1) does not decrease the cost much.
Synthesis pressure is varied from 18 to 70 bar, which has limited effects on MFSP. The S2D reactor is considered a shell-tube unit with catalyst on the tube side and boiling feed water in the shell side for heat recovery. The pressure for the shell is not affected by the synthesis pressure, but by the boiling feed water pressure, and changing synthesis pressure only affects the tube cost. Cost estimation shows the variation in pressure in the investigated range has minor effects on the reactor cost, but significant effects on syngas compressor cost. The overall effect of pressure variation is limited because the cost of the clean syngas compressor is only a small fraction of the overall system cost. Increased single-pass CO conversion reduces the unreacted off-gas volume flow rate, thus reducing the size of the equipment in the synthesis loop. With the same recycle ratio, increased single-pass conversion also leads to higher product yield. Both result in reduced production cost.
Reducing light gas yield by half and moving this material to the C5+ yield leads to about 10% reduction in production cost. Increased single-pass conversion efficiency has roughly the same effect. The benefits of reducing light hydrocarbon yield are slightly more significant than increasing the single-pass conversion efficiency. This finding is consistent with the results of moving from the SOT case to the goal case as shown in Figure 5.1.
-15%
-10%
-5%
0%
5%
10%
15%
-100% -50% 0% 50% 100%
Rel
ativ
e C
hang
e in
Pro
duct
ion
Cos
t, %
Relative Change in Parameters, %
GHSV
Synthesis pressure
Single pass conv. 70% to 85%
Light HC (C1-C4) yield
5.6
5.2.2 Sensitivity of Cost Parameters
As shown in Figure 5.3, multiple cost parameters were varied to investigate their effects on the production cost. The missing equipment contingency factor was found to be the most significant. When it is increased from 0 to 50% of the total project cost, the production cost increases about 23%. The next most important parameters are feedstock price and analysis period. Increasing feedstock price 36% leads to about 14% increase in the production cost. The feedstock cost represents the biggest fraction (about 83%) of the total variable operating cost. Therefore, its price changes significantly affect the production cost. Reducing the analysis period from 20 years to 10 years, increases the production cost about 15%. The byproduct credits and the S2D process equipment costs have moderate effects on the production cost. Assuming there are no byproducts generated, the production cost increases about 10%. With the S2D process equipment cost being doubled, the production cost increases about 7%. The effects of electricity price and solid waste disposal cost are not significant.
Figure 5.3. Effects of Cost Parameters on Production Cost
5.3 Conclusions
Techno-economic analysis was conducted for three cases of a biomass gasification-based S2D process: 1) the SOT case based on best available experimental results for a single-step approach, 2) the goal case for the single-step process, and 3) the conventional case based on a two-step S2D approach. Results indicate that the goal case provides somewhat reduced production cost, demonstrating the potential for the single-step approach to make biomass-based S2D modestly more competitive. On the other hand, the SOT case results in higher production costs than the conventional approach, demonstrating the need for significant improvement in the single-step process to bring the state of technology much closer to the goal process. Production cost was most dependent on the yields of light
-5%
0%
5%
10%
15%
20%
25%
-100% -50% 0% 50% 100%
Rel
ativ
e C
hang
e in
Pro
duct
ion
Cos
t, %
Relative Change in Parameters, %
Feedstock price
Electricity price
Solid disposal cost
Contingency factor, % of TPC
Analysis period
STD process equipment cost
By-product credit
5.7
hydrocarbons versus distillates, and only slightly sensitive to pressure and space velocity. For the SOT case to become more economical, future experimental developmental work focused on increasing distillate yield and decreasing light hydrocarbon yield would be necessary to meet parameters of the goal case.
6.1
6.0 Conclusions and Recommendations
A Pd/ZnO/Al2O3 catalyst, originally developed for methanol synthesis, was optimized for single-step syngas conversion purpose. This catalyst was shown to be stable, as compared to the more conventional Cu-based methanol catalyst, at temperatures necessary for zeolite conversion. The Pd/ZnO/Al2O3 catalyst was further developed to enhance methanol and dimethyl either production while minimizing the formation of CH4. However, production of CO2 and CH4, produced under conditions of this study, was still problematic.
Combining Pd/ZnO/Al2O3 methanol catalyst and zeolite for direct syngas conversion resulted in the formation of aromatic-rich C5+ hydrocarbons. A significant fraction of the liquid product consisted of methylated benzenes. Furthermore, high CO conversion was achieved under relatively low operating pressures. This was enabled by the easing of thermodynamic constraint, offered by combining reactions. In addition, catalytic stability was shown to be improved with increasing H2 feed. This was attributed to a reduction in coke formation when in the presence of syngas (i.e., H2). However, increasing selectivity to hydrocarbon liquid product was challenging. In addition to formation of carbon dioxide and CH4, saturation of the olefin intermediates, that are necessary for chain growth, occurs over PdZn particles. Thus, the Pd/ZnO/Al2O3 catalyst does not at this point seem a viable candidate to be used in a combined methanol and gasoline synthesis reaction scheme. However, this does not preclude the use of other catalysts. Furthermore, oxygenated intermediates other than methanol and dimethyl ether could be evaluated. The use of higher alcohols as intermediates, for example, has been reported to facilitate gasoline production over zeolite. This opens the range of potential catalyst types that could be exploited for single-step conversion purpose. Of importance is the discovery of catalyst types that suppress carbon dioxide and light hydrocarbon formation. Extension of this study by exploring other types of oxygenate-producing catalysts could be one potential area of research.
However, a techno-economic study showed the cost improvement for the single-step process, as compared to the benchmark MTG process, to be minimal. Reduction in capital cost and MFSP for the goal case was found to be 8% and 16%, respectively. This assumes future improvement to catalytic performance. Thus, even if technological advancement were realized, primarily through increased selectivity to liquid product, combining methanol and dimethyl ether with gasoline synthesis appears only to have marginal improvement to overall cost. In conclusion, it appears more fruitful to evaluate other aspects of the MTG process to improve upon, or other hydrocarbon liquid fuel’s production technologies. For example, evaluation of technologies for producing higher quality fuel blends such as those useful for jet and/or diesel may be more economically attractive.
7.1
7.0 References
[1] Spivey JJ and A Egbebi. 2007. “Heterogeneous Catalytic Synthesis of Ethanol from Biomass-Derived Syngas.” Chemical Society Reviews 36(2007):1514-1528.
[2] S Han S and CD Chang. 2000, “Fuels, Synthetic, Liquid Fuels.” Kirk-Othmer Encyclopedia of Chemical Technology, John Wiley & Sons, Inc.. DOI: 10.1002/0471238961.12091721080114.a01.
[3] Chang CD. 1992, “The New Zealand Gas-to-Gasoline Plant: An Engineering Tour de Force.” Catalysis Today 13(1992):103-111.
[4] Keil KJ. 1999. “Methanol-to-Hydrocarbons: Process Technology.” Microporous and Mesoporous Materials 29(1999):46-66.
[5] Lebarbier VM , RA Dagle, L Kovarik, J. Lizarazo-Adarme, DL King, D.R. Palo. 2012. “Synthesis of Methanol and Dimethyl Ether from Syngas over Pd/ZnO/Al2O3 Catalysts.” Catalysis Science Technology 2(2012):2116-2127.
[6] Topp-Jorgensen J. 1988. “Topsøe Integrated Gasoline Synthesis: The TIGAS Process.” In Methane Conversion 36, DM Bibby, CD Chang, RF Howe, S Yurchak (Eds.), pp 293-305, Elsevier Science Publishers, Amsterdam, The Netherlands.
[7] Xia G, JD Holladay, RA Dagle, EO Jones, and Y Wang. 2005. “Development of Highly Active Pd-ZnO/Al2O3 Catalysts for Microscale Fuel Processor Applications.” Chemical Engineering and Technology 28(4):515-519.
[8] Buoudart M and G Djega-Mariadassou. 1984. The Kinetics of Heterogeneous Catalytic Reactions. Princeton University Press, Princeton, New Jersey.
[9] Rezaiyan J and NP Cheremisinoff. 2005. Gasification Technologies: A Primer for Engineers and Scientists. Taylor & Francis Group, Boca Raton, Flordia.
[10] W.R. Grace. 1982. Preliminary Design and Assessment of a 50,000 BPD Coal-to-Gasoline-to-Methanol Plant. Process Engineering and Mechanical Design Reports. Prepared by Ralph H. Parsons Company for the U.S. Department of Energy under Cooperative Agrement No. DE-FC01-80ET-14759, W.R. Grace and Company, Memphis Tennessee.
[11] Cheng WH and HH Kung. 1994. “Overview.” Methanol Production and Use, WH.Cheng and HH Kung (Eds.), Marcel Dekker, New York.
[12] Fiedler E, G Grossmann, DB Kersebohm, G Weiss, and C.Witte. 2005. “Methanol.” Ullmann-s Encyclopedia of Industrial Chemistry, 7th Edition, Wiley-VCH Verlag GmbH & Co., Weinheim, Germany.
7.2
[13] N. Sheppard, T.T. Nguyen. 1978. “The Vibrations Spectra of Carbon Monoxide Chemisorbed on the Surfaces of Metals Catalysts: A Suggested Scheme of Interpretation.” In Advances in Infrared and Raman Spectroscopy, Volume 5, pp 67-148, RJH Clark and RE Hestor (eds.), Heydon and Son Ltd., London, Great Britain.
[14] Lebarbier VMC, RA Dagle, T Conant, JM Vohs, AK Datye, and Y Wang. 2008. “CO/FTIR Spectroscopic Characterization of Pd/ZnO/Al2O3 Catalysts for Methanol Steam Reforming.” Catalysis Letters 122(3–4):223–227. DOI:10.1007/s10562-008-9407-7.
[15] Satterfield C. 1996. Heterogeneous Catalysis in Industrial Practice. Krieger Publishing Company, pp 446-455, Malabar, Florida,.
[16] Sun JT, IS Metcalfe, and M Sahibzada. 1999. “Deactivation of Cu/ZnO/Al2O3 Methanol Synthesis Catalyst by Sintering.” Industrial & Engineering Chemistry Research 38(10):3868-3872.
[17] Ramos FA, AMD de Farias, LEP Borges, JL Monteiro, MA Fraga, EF Sousa-Aguiar, and LG Appel. 2005. “Role of Dehydration Catalyst Acid Properties on One-Step DME Synthesis over Physical Mixtures.” Catalysis Today 101 (2005):39-44.
[18] Yaripour F, F Baghaei, I Schmidt, and J Perregaard. 2005. “Catalytic Dehydration of Methanol to Dimethyl Ether (DME) over Solid-Acid Catalysts.” Catalysis Communications 6 (2005) 147-152.
[19] Iwasa N, O Yamamoto, T Akazawa, S Ohyama, and N Takezawa. 1991. “Dehydrogenation of Methanol to Methyl Formate over Palladium/Zinc Oxide Catalysts.” Journal of the Chemical Society, Chemical Communications (1991):1322-1323. DOI: 10.1039/C39910001322.
[20] Ryndin YA, RF Hicks, AT Bell, and YI Yermakov. 1981. “Effects of Metal-Support Interactions on the Synthesis of Methanol over Palladium.” Journal of Catalysis 70(1981):287-297.
[21] Stocker M. 1999. “Methanol-to-Hydrocarbons: Catalytic Materials and Their Behavior.” Microporous and Mesoporous Materials 29(1999):3-48.
[22] Mokrani T and M Scurell. 2009. “Gas Conversion to Liquid Fuels and Chemicals: The Methanol Route-Catalysis and Processes Development.” Catalysis Reviews 51(2009):49-59.
[23] Howard WL. 2011. “Acetone.” Kirk-Othmer Encyclopedia of Chemical Technology. Published online January 14, 2011, pp 1-15, John Wiley and Sons Inc. DOI: 10.1002/0471238961.0103052008152301.a01.pub3.
[24] Lebarbier VMC, Dagle RA, Kovarik L, Lizarazo JL, King DL, Palo DR. 2012. “Synthesis of Methanol and Dimethyl Ether from Syngas over Pd/ZnO/Al2O3. ” Catalysis Science & Technology 2(2012):2116-2127.
[25] P. Mohanty, K.K. Pant, J. Parikh, D.K. Sharma. 2011. “Liquid Fuel Production from Syngas Using Bifunctional CuO–CoO–Cr2O3 Catalyst Mixed with MFI Zeolite.” Fuel Processing Technology 92(2011):600-608.
7.3
[26] Xia G, JD Holladay, RA Dagle, EO Jones, and Y Wang. 2005. “Development of Highly Active Pd-ZnO/Al2O3 Catalysts for Microscale Fuel Processor Applications.” Chemical Engineering and Technology 28(4):515-519.
[27] Liu S, AC Gujar, P Thomas, T Hossein, and M White. 2009. “Synthesis of Gasoline-Range Hydrocarbons over Mo/HZSM-5 Catalysts.” Applied Catalysis A: General 357(2009) :8-25.
[28] Zhu Y, SB Jones, MJ Biddy, RA Dagle, and DR Palo. 2012. “Single-Step Syngas-to-Distillates (S2D) Process Based on Biomass-Derived Syngas - A Techno-Economic Analysis.” Bioresource Technology 117:341-351. DOI:10.1016/j.biortech.2012.04.027.
[30] Phillips S, A Aden, J Jechura, D Dayton, and T Eggerton. 2007. Thermochemical Ethanol via Indirect Gasification and Mixed Alchohol Synthesis of Lignocellulosic Biomass. NREL/TP-510-41168, National Renewable Energy Laboratory, pp 1-125, Golden Colorado.
[31] Peters MS and KD Timmerhaus (Wds.). 2003. Plant Design and Economics for Chemical Engineers, 5th Edition, McGraw-Hill, Inc., New York.
[32] Dutta A, M Talmadge, J Hensley, M Worley, D Dudgeon, D Barton, P Groenendijk, D Ferrari, B Stears, D Barton, P Groenendijk, D Ferrari, and B Stears. 2011. Process Design and Economics for Conversion of Lignocellulosic Biomass to Ethanol: Thermochemical Pathway by Indirect Gasification and Mixed Alcohol Synthesis. NREL/TP-5100-51400, National Renewable Energy Laboratory, Golden, Colorado.
[33] U.S. Energy Information Administration 2010. Annual Energy Outlook 2010 With Projections to 2035. DOE/EIA-0383(2010), Washington D.C. Last accessed August 2011 at http://www.eia.gov/oiaf/archive/aeo10/pdf/0383%282010%29.pdf.
[34] Spath P, A Aden, T Eggerman, M Ringer, B Wallace, and J Jechura. 2005. Biomass to Hydrogen Production Detailed Design and Economics Utilizing the Battelle Columbus Laboratory Indirectly-Heated Gasifier. NREL/TP-510-37408, National Renewable Energy Laboratory, Golden, Colorado. Available at http://www.nrel.gov/docs/fy05osti/37408.pdf.
[35] Phillips SD, JK Tarud, MJ Biddy, and A Dutta. 2011. Gasoline from Wood via Integrated Gasification, Synthesis, and Methanol-to- Gasoline Technologies. NREL/TP-5100-47594, National Renewable Energy Laboratory, Golden, Colorado. Available at http://www.nrel.gov/docs/fy11osti/47594.pdf.
[36] Lloyd L, DE Ridler, and MV Twigg. 1996. “The Water-Gas Shift Reaction.” Catalyst Handbook, MV Twigg (Ed.), 2nd Edition, Chapter 6, p 283, Manson Publishing Ltd., Frome, London, Great Britain.
[37] U.S. Department of Energy. 2007. Hydrogen from Coal Program RD&D Plan for the Period 2009 through 2016. External Draft, U.S. Department of Energy, Washington, D.C.
[39] Lo-Cat Process. Last accessed Auguest 2011 at http://merichem.com/resources/case_studies/LO_CAT/Desulfurization.pdf.
[40] Kaneko T. 2002. “Coal Liquefaction.” Ullmann's Encyclopedia of Industrial Chemistry. 7th edition, Wiley-VCH, Weinheim, Germany.
[41] Garwood WE, W Lee, and HJ Schoennagel. Hydrotreating of Bottoms Fractions Resulting from Conversion of Methanol to Gasoline in order to Decrease Durene and Produce Distillate. U.S. Patent 4304951. Issued December 8, 1981.
More experimental details for the investigation for the single-step production of gasoline from syngas are provided here. Feed composition used was 57% H2, 4% N2, 29% CO, 9% CO2. N2 was used as a tracer for flow rate measurement. This mix was chosen so that H2:CO ratio would be ~2.0 and CO:CO2 ratio would be ~3.0. All of the single-step synthesis tests that used commercial zeolite used a Si:Al ratio of 40. Tests using zeolites developed at Pacific Northwest National Laboratory had different Si:Al ratios than this.
A schematic of the single-step synthesis test stand is shown in Figure A.1. The test stand is equipped with inlet lines for at least four gases, includes all necessary switching valves for gas blending, bypass, and GC calibration, utilizes an electrically heated conduction-based heater/reactor unit, redundant chilled liquid collection vessels (for switching and for safety).
Figure A.1. Schematic of the Single-Step Synthesis Test Stand used at MBI for Combined-Bed Catalyst Testing of Syngas-To-Gasoline
H2
N2
Feed Mix
He
Flame Arrestor
Vent / Exhaust
HighPressure
Relief ValveShutoff Valve
PressureRegulators
On/OffValves
Mass FlowControllers
On/OffValves
CheckValves
NeedleValve
ReactorPressure Indicators
Vent
Vent / Exhaust
To GasChromatograph
PressurizedCondenser 1
LiquidSample
LiquidWaste
AdjustableBack Pressure
Regulator
Condenser 1Pressure Indicators
Condenser 2PressureIndicator
FixedBack Pressure
Regulator
Industrial DryCompressed
Air
PressurizedCondenser 2
Reactor
NeedleValve
NeedleValve
Exit PressureBack Pressure
Regulator
LowPressure
Relief Valve
AirFilter
CheckValve
CheckValve
Furnace
Appendix B
Sequential vs. Mixed Catalyst Bed Configurations
B.1
Appendix B
Sequential vs. Mixed Catalyst Bed Configurations
Two main configurations of the catalyst bed were investigated, sequential bed and mixed bed. These are illustrated in Figure B.1. Sequential bed simply has the methanol synthesis catalyst as the first part of the bed, followed by the zeolite catalyst. Mixed bed consists of a physical mixture of the two catalysts so that the methanol synthesis functionality is located in proximity to the MTG functionality. Another version of the mixed bed that was investigated consisted of PdZn deposited directly on the zeolite.
In any case, the base flow rate was set so that GHSV through the combined bed was 781 L/L/hr and WHSV was 1245 cc/g/hr. Unless otherwise noted in the experimental/results descriptions below, all of the combined-bed tests were run at this throughput. The PdZnAl:zeolite ratio was 1:4 by volume and 1:3 by weight, unless otherwise noted for a given experiment below. Unless otherwise noted, the operating pressure was ~1000 psig.
Figure B.1. Illustrations of the Two Catalyst Bed Configurations Investigated for Single-Step Syngas to Gasoline (sequential bed [left] and mixed bed [right])
B.1 Sequential Bed
For both the sequential and combined beds, we evaluated the effect of operating temperature between 300°C and 400°C. Typical MTG is operated at ~375°C, but at much lower pressures than we are running for the combined bed. Figure B.2 shows the conversion and methane and ethane selectivities for the sequential bed operating at 300°C, 350°C, 375°C, and 400°C (experiment JL44). Figure B.2 shows the liquid product analysis for these same conditions, with liquid products grouped according to carbon number. It can be seen from that conversion is relatively stable over the course of each temperature condition investigated, with some initial deactivation seen in the 300°C condition (beginning of the experiment). Conversion reaches its maximum at just under 25% at 350°C for the sequential bed. According to Figure B.3, the predominant carbon number in the liquid product is C10. Not shown in the plot is the fact that these C10 hydrocarbons are predominantly methyl-substituted aromatics (tetramethylbenzenes), including the undesirable durene. Lower temperatures tend to allow more C8 and below, where there is more of a mix of branched alkanes and aromatics in the liquid product.
B.2
Figure B.2. Conversion and Some Selectivity Values for the Sequential Bed Operating between 300°C and 400°C at ~1000 psig
Figure B.3. Liquid Product Selectivity Values for the Sequential Bed Operating between 300°C and 400°C at ~1000 psig. Gaseous products (C1‒C5) are not included in this analysis
B.3
B.2 Mixed Bed
The same temperature profile experiment was conducted with the mixed bed configuration, and the conversion results are shown in Figure B.4. It can quickly be seen that rapid deactivation occurred at each temperature tested, but that conversion is significantly higher than the sequential bed at 375°C and 400°C. Methane selectivity is similar between the two beds tested, except at 400°C, where the mixed bed produces much less methane than the sequential bed. However, the mixed bed produces considerably higher amounts of ethane at all four temperatures. The results shown in Figure B.5 indicate the effect of temperature on liquid product composition. Products with carbon number of C9 and lower tend to disappear at higher temperatures, while the C11 fraction grows with increased temperature. Interestingly, the C12 fraction does not change considerably with temperature. These levels of C12 production, however, are much higher than what was produced in the sequential bed.
Figure B.4. Conversion and Some Selectivity Values for the Mixed Bed Operating between 300°C and 400°C at ~1000 psig
B.4
Figure B.5. Liquid Product Selectivity Values for the Sequential Bed Operating between 300°C and 400°C at ~1000 psig. Gaseous products (C1‒C5) are not included in this analysis.
B.3 Post-Mortem Analysis
For both the mixed bed and the sequential bed, the catalyst was analyzed after reaction by XRD. This analysis indicated no significant change in PdZn particle size between the two beds. Both were in the range of 10.2 nm. Interestingly, characterization of both catalysts by TPO and TGA revealed little if any coke formation in either bed. BET studies indicate a loss in pore volume and pore size for the mixed bed catalyst case, most likely due to zeolite structure alteration. As coke would be expected, further analysis and characterization would be needed to definitely ascertain deactivation mechanism.
B.4 Time On-Stream
Using the sequential bed, we conducted a time on-stream analysis for 50 hours. As can be seen from Figure B.6, CO conversion decreased over the 50-hr run and methane selectivity increased. Selectivity to condensable liquid hydrocarbons goes through a maximum of about 54% at about the 15-hr mark and then slowly decreases to about 37% by the 50-hr mark. The profile of the C2‒C5 product selectivity mirrors the condensable liquid selectivity, going through a minimum of about 30% at the 15-hr mark and then slowly increasing to almost 40% by the 50-hr mark.
B.5
Figure B.6. Time On-Stream Analysis of the Sequential Bed (PdZnAl plus HZSM-5) Operating at 375°C and 1000 psig
In conclusion, the mixed vs. sequential bed analysis demonstrate promising results. In the mixed bed scenario the conversion was significantly greater as thermodynamic limitations for methanol synthesis are alleviated as methanol/DME intermediates are further converted to distillate product. However, deactivation does occur. However, in a sequential bed process the stability is much improved.
Appendix C
Process Simulation and Economic Analysis Using Aspen Plus®
C.1
Appendix C
Process Simulation and Economic Analysis Using Aspen Plus®
A scenario-based approach was applied to the biomass-gasification-based S2D system simulation by using Advanced System for Process Engineering Plus (Aspen Plus®). Aspen Plus® is an upgraded simulator based on Aspen®, a deterministic steady-state chemical process simulator. Aspen Plus® includes an extensive thermodynamic database to support energy balance and chemical equilibrium calculations [29]. To simulate a process technology in Aspen Plus®, the technology is described using unit operations that are connected via material, heat, or work streams. Unit operations are simulated by “blocks,” which are computer subroutines in the simulator library that perform mass and energy balance calculations for specific unit operations such as heat exchangers, compressors, pumps, reactors, and other operations. In a large, complicated system models, a superstructure simulation method is applied. For each large process in a system, a hierarchy block containing multiple blocks and streams is developed. The use of superstructure simulation method enables flexible simulation for different scenarios by only changing the related hierarchy block(s) and leaving other hierarchy blocks unchanged. A biomass-gasification-based S2D system superstructure diagram in Aspen Plus® is shown in Figure C.1.
Figure C.1. Biomass gasification-based single-step S2D system superstructure in Aspen Plus®
The performance model provides key operating conditions and inlet/outlet stream flow rates for each unit operation, as well as energy consumed or produced by the process where applicable. This information was used to size standard equipment and as inputs for Aspen Process Economic Analyzer to
C.2
estimate bare equipment costs. Non-standard equipment costs, such as the gasifier, are from literature sources [30]. The equipment costs assume that this is the “nth” plant. That is, all research and development required to commercialize the process at the given scale is complete, the manufacturing processes are mature, and the equipment is readily available. The total capital investment is factored from installed equipment costs according to heuristics given in literatures [30, 31]. All capital costs are reported in 2007 US dollars. Equipment cost escalation is calculated by using the Chemical Engineering Plant Cost Index (CEPCI), and the total capital investment is factored from installed equipment costs. The new NREL report for biomass-gasification-based mixed alcohol synthesis report [32] has updated equipment costs for the gasification and tar reforming processes. The future work will incorporate these new costs. This only changes the absolute values of the study, but does not change the relative comparison results or the conclusions.
Operating cost includes both variable and fixed operating costs. The variable operating costs include raw materials, chemicals, wastes, utilities, and credits of byproducts. Fixed operating cost does not vary with the operation, and mainly consists of maintenance and labor costs. With these costs, the final production cost is calculated as minimum fuel selling price (MFSP), which is determined using a discounted cash flow rate of return analysis. The methodology is identical to that used in Phillips et al. [30] The MFSP is calculated based on capital cost and operating cost. It is the selling price of the fuel that makes the net present value of the process equal to zero with a 10% discounted cash flow rate of return over a 20 year plant life. The stream factor (90%) is assumed for all the cases as a reasonable assumption for “nth” plant. For variable operating cost calculation, the feedstock plant-gate price is assumed to be 70.00 $/dry tonne in 2007 US dollars, which is converted from $66.12/dry US short ton in 2010 US dollars (estimate from Catchlight Energy LLC). LPG is treated as byproduct and its unit price is 18.24 MMBtu/hr (19,227 MJ/hr, 2007$s) at higher heating value (HHV) basis [33]. The electricity price is 0.06366 $/kWh (2007$s) [33]. Table C.1 gives the economic parameters used to calculate the MFSP.
Table C.1. Assumptions Used in the Economic Analysis of the Three S2D Process Configurations
Assumption Value Stream factor 90% General plant recovery period, yrs 7 Internal rate of return, % 10% Plant life, yrs 20 Construction Period First 6 months expenditure Next 12 months expenditure Last 12 months expenditure
2.5 years 8% 60% 32%
Start-up time Revenues Variable Costs Fixed Costs
6 months 50% 75%
100% Working Capital 5% of Total Capital Investment Land 6% of total purchased equipment cost (taken as first year construction
expense)
Source: Phillips et al. 2007 [30]
Appendix D
Major Process Descriptions for Economic Modeling
D.1
Appendix D
Major Process Descriptions for Economic Modeling
D.1 Feed handling and Preparation
The feedstock is assumed to be generic low ash woody biomass. The biomass feedstock (2000 dry metric tonne/day) is dried in directly heated rotary driers. The purpose is to minimize the heat load of the gasifier since moisture vaporization in the gasifier requires a large amount of heat. The drying operation is assumed to reduce the biomass moisture content to 5 wt %. Hot flue gas from the char combustor and tar reformer catalyst regenerator/fuel burner is used to dry the biomass and heat process streams or boiler feed water/steam.
D.2 Gasification
The design and simulation of the gasification step, including the raw syngas composition, are modeled using a correlation relationship based on data from the 9 tonne/day test facility at the Battelle Columbus Laboratory [30] .
Dried wood is fed into the reactor with steam from the steam cycle at a flow rate of 0.4 kg steam/kg of bone-dry wood to fluidize the bed. Gasification reactions are endothermic and the required heat is supplied by circulating hot olivine solids between the gasifier and the combustor. The gasifier is operated at about 879°C and 1.6 bar. A series of cyclone separators are used to remove solid particles from the raw gas leaving the gasifier. The captured solids containing char and olivine are sent to the char combustor, where the olivine is reheated to about 982°C by char combustion. The flue gas carrying hot olivine particles and ash from the char combustor is sent to the primary combustor cyclones. About 99.9% of the olivine is assumed to be captured and flows back to the gasifier, with the remainder being made up by addition of fresh olivine. The olivine circulation flow rate is 27 kg of olivine/kg of bone-dry wood. The ash and the residual particles are captured by secondary cyclones and sent to landfill. The flue gas is used for heating boiler feed water and biomass drying. A regression quadratic function based on reaction temperature is used to estimate the composition of the gas components, tar, and char [34].
D.3 Gas Cleanup and Adjustment
Tar refers to a range of organics, mostly aromatics, formed by the pyrolysis of biomass during the gasification process [9]. In hot syngas, tar is in the vapor phase, will condense if cooled, and thus foul downstream equipment. Cracking tar into CO and H2 not only solves the equipment fouling problem, but also improves the overall system carbon efficiency. In this study, tar is simulated as naphthalene.
A large portion of raw syngas is sent to a catalytic tar reforming unit, which is assumed to be a circulating fluidized-bed reactor. Tar and other hydrocarbons are converted to CO and H2. Most of the recycled off-gas (95 vol%) from the downstream synthesis gas is also sent to the tar reformer to convert methanol and hydrocarbons. The remaining raw syngas and recycled off-gas are sent to the tar reformer catalyst regenerator/fuel combustor. Because tar reforming reactions are endothermic and the reformer is
D.2
assumed to be operated isothermally, a fuel combustor is assumed to be used to provide heat to the reformer reaction bed. Phillips et al. [30] adopted this design, but cautioned that this design may be difficult in practice and very expensive. The tar reformer is simulated by using an isothermal equilibrium reactor model operating at 879°C (inlet) and 1.4 bar. The conversion of major components, such as methane, ethane, tars, is simulated by specifying conversion fractions for these components, which is based on Phillips et al. [30]. The conversion of recycled alcohols is simulated by assuming the reactions reaching equilibrium at the reaction conditions. Shift reaction is also assumed in this process.
The hot effluent of tar reformer is cooled through heat integration with process streams and steam cycle. The gas is scrubbed and cooled in a venturi scrubber and a spray quench chamber to remove residual particulates, ammonia, and other impurities. The cooled, scrubbed gas at about 58°C is compressed to 31 bar. The compressor is simulated by using a multiple-stage air-intercooled compressor model, which consists of five stages. Condensed water from each inter-stage cooler is collected and sent to the steam cycle.
The compressed syngas is split and a portion of it is sent to a water-gas shift (WGS) reactor together with steam from the steam cycle. The split fraction to the WGS process can be adjusted to achieve the required H2:CO ratio for downstream synthesis. The remaining syngas bypasses the WGS process. In a WGS reactor, the CO and H2O react to generate CO2 and H2. The WGS reactor is simulated as a fixed-bed, adiabatic, equilibrium reactor with a temperature approach specified for the shift reaction. The effluent is cooled by the WGS inlet stream and other process streams, and then is cooled by air and cooling water to 43°C. The design basis and simulation of this process is mainly based on references [35-37].
The cleaned gas containing approximately 100 ppmv H2S will poison catalysts in the synthesis process. Therefore, an amine-based acid gas scrubber and a ZnO polishing bed are used for sulfur and CO2 removal. The solvent used in the amine unit is assumed to be monoethanolamine (MEA). In the amine unit, H2S and CO2 are reduced to 50 ppmv and 5 mol%, respectively. The acid gas-liquid removed from the amine unit is heated to 65°C, and then sent to the Lo-Cat process where H2S is absorbed and converted to elemental sulfur in an iron chelate-based solution [38, 39]. The cleaned syngas is heated and sent to a fixed-bed ZnO desulfurization unit to reduce the H2S level to less than 1 ppmv.
D.4 Syngas-to-Distillate Process
The process flow diagram for a single-step S2D process in the simulation is shown in Figure C.1. This figure shows the major operation units in the hierarchy blocks for the S2D synthesis and product purification processes. For the SOT case, the experimental design conditions and product yields were obtained from experimental work described in this report. As shown in Figure C.1, the cleaned syngas from the amine scrubber and ZnO polishing bed containing mainly CO and H2 is compressed to about 22 bar. Then the syngas is preheated by hot process streams to about 200°C and then further heated by the S2D synthesis effluent to 280°C. The single-step S2D reactor is assumed to be as an isothermal, shell-and-tube unit with dual catalyst in the tubes. In Aspen Plus®, the S2D reactor is simulated by a RYIELD reactor. The specifications for the temperature and pressure of this reactor block are 310°C and 22 bar, respectively. The products yield value for each compound is specified. The major hydrocarbons selectivity has been listed in
D.3
Table 2.3. Based on the experimental results, the product distillate mainly contains light gases (CO, CO2, and H2); light hydrocarbons (C1–C4); straight chain paraffins, branched alkanes, naphthenes, and alkyl benzenes (C5–C9); and heavy components, mainly C10 to C12 aromatics. Over 40 components are used to simulate the distillate product from the S2D process. The components and their yield distributions are developed based on the GC/MS analysis data for the products obtained in experimental tests and the elemental (C, H, O) balance for the feed and products.
The S2D reaction is highly exothermic and the reaction heat is assumed to be removed by generating high pressure (59 bar) steam on the shell side of the reactor to maintain the isothermal reaction condition. It is simulated by connecting the net heat stream of the reactor block to the hierarchy block of the steam cycle. For this process, the catalyst is deactivated due to coke formation. Regeneration is assumed to be accomplished by burning off organic deposits with air.
The overall configuration of the goal case is very similar to the SOT case, with the major differences being in the reaction conditions and the product yields. The goal case assumed the same yields and similar reaction conditions as the conventional case. As shown in
Table 2.3, compared to the SOT case, the goal case assumes a higher CO single-pass conversion efficiency and higher distillate (C5+) hydrocarbon selectivity. The goal case also assumes a higher gas-hourly space velocity of 5000 hr-1 for the single-step S2D reaction, which is higher than the 742 hr-1 for the SOT case based on experimental setting. In addition, compared to the SOT case, no heavy gasoline treatment (HGT) is used in the system. The details of this assumption are described in the following section.
The conventional S2D process includes two steps: syngas-to-methanol and MTG. In the methanol synthesis process methanol synthesis from both CO and CO2 are assumed to occur. The methanol synthesis conditions are assumed to be about 250°C and 59 bar. The major reaction of the MTG process is described here. First methanol is partially dehydrated to DME using a methanol dehydration catalyst. This reaction is followed by olefin formation and finally aromatic/ paraffin formation over a zeolite catalyst (ZSM-5). The reaction at the second step is highly exothermic and the temperature is controlled by recycling cooled effluent gas to the reactor. The final hydrocarbon product is predominantly in the gasoline boiling range, with some LPG and fuel gas generated as well. Almost no hydrocarbons with carbon numbers greater than 10 are found in the product because of the shape selectivity of the zeolite [3]. The MTG reactor in this case is assumed to be an adiabatic fixed-bed unit [40]. The process operates at essentially 100% conversion of methanol until the catalyst is deactivated due to carbon formation. Regeneration design is similar to the SOT case. The simulation of conventional S2D process is based on the 1982 Grace report [10].
The hot product stream is cooled recuperatively, then by process streams for heat recovery, and further cooled by air and cooling water. The product stream is sent to a flash tank, where liquid hydrocarbon is separated from non-condensable gases and water. To increase the synthesis efficiency of the S2D process, 85% of the vapor phase is compressed and recycled to the S2D reactor. The remaining vapor phase and the liquid are both sent to the product separation and purification process.
D.4
D.4.1 Product Separation and Purification
The hydrocarbons from the S2D process are separated in a gas fractionation process to produce fuel gas, liquefied petroleum gas (LPG), light gasoline, and heavy gasoline. The purge gas from the MTG process is first dried in a molecular sieve [30] and then cooled to 6.7°C by using refrigerant to further condense the liquid. The uncondensed gases are expanded to 2.4 bar for power recovery and recycled to the tar reformer. The liquid phase is depressurized and more gas is released, which is recycled to the tar reformer. The liquid phase and the raw oil phase from the S2D gas-liquid separator are sent to a de-ethanizer tower to remove ethane and lighter hydrocarbons from the product. The de-ethanizer bottoms are then fractionated in the de-butanizer to produce the feed to the gasoline splitter. The de-butanizer produces a light overhead suitable for sale as liquefied petroleum gas (LPG). Most of the de-butanizer bottoms (a stream containing C5+ hydrocarbon) are sent to the gasoline splitter, but a small portion is recycled to the de-ethanizer as a lean oil solvent.
D.4.2 Heavy Gasoline Treatment
Durene is a low melting point component, which if not removed, can cause freezing point problems in the gasoline. For the SOT case, the experimental durene yield is high (about 10 wt% in the hydrocarbon product) so, gasoline splitting and HGT are required. Light gasoline containing hydrocarbons in the C5 to C9 range are separated in the overhead flow of the gasoline splitter. The light gasoline is cooled and sent to gasoline storage as product. The bottom flow from the gasoline splitter is heavy gasoline with hydrocarbons numbering C9 and above, which is treated in the HGT. The HGT removes durene via hydrogenation. The design of HGT for the SOT case is based on the Garwood et al. patent [41], assuming the hydrogen feed is purchased. The stabilized heavy gasoline is combined with the lighter gasoline from the de-butanizer and sent to product storage.
In the goal case, the durene content is assumed to be lower than minimum volume allowed in conventional gasoline, requiring neither gasoline splitter nor HGT steps. The purpose of this assumption is to investigate the impact of removing the HGT unit on the system capital and operating cost. The goal case is assumed to have an optimal design and no HGT is required. The conventional case assumed a HGT process for durene conversion, which is based on the 1982 Grace report [10].
D.4.3 Steam Cycle
The electricity is assumed to be generated by superheated steam expansion in an extraction steam turbine. High-pressure steam is recovered from the gas-cooling sections of the gasifier and steam reformer. Medium-pressure steam is generated from the synthesis reactor and hot product stream cooling. Part of the steam is extracted for process heating purposes.
PNNL-22984
Distribution
No. of No. of Copies Copies
Distr.1
# Name Organization Address City, State and ZIP Code
# Organization Address City, State and ZIP Code Name Name Name Name Name (#)
# Name Organization Address City, State and ZIP Code
# Foreign Distribution # Name
Organization Address Address line 2 COUNTRY
# Local Distribution Pacific Northwest National Laboratory Name Mailstop Name Mailstop Name Mailstop Name Mailstop Name (PDF)