Abstract: Detecting and characterizing single nanoparticles and airborneviruses are of paramount importance for disease control and diagnosis, forenvironmental monitoring, and for understanding size dependent propertiesof nanoparticles for developing innovative products. Although singleparticle and virus detection have been demonstrated in various platforms,single-shot size measurement of each detected particle has remained asignificant challenge. Here, we present a nanoparticle size spectrometryscheme for label-free, real-time and continuous detection and sizing ofsingle Influenza A virions, polystyrene and gold nanoparticles using splitwhispering-gallery-modes (WGMs) in an ultra-high-Q resonator. We showthat the size of each particle and virion can be measured as they continu-ously bind to the resonator one-by-one, eliminating the need for ensemblemeasurements, stochastic analysis or imaging techniques employed inprevious works. Moreover, we show that our scheme has the ability toidentify the components of particle mixtures.
References and links1. E. Betzig, J. K. Trautmann, T. D. Harris, J. S. Weiner, and R. L. Kostelak, “Breaking the diffraction barrier:
optical microscopy on a nanometric scale,” Science 251, 1468–1470 (1991).2. R. G. Knollenberg, “The measurement of latex particle sizes using scattering ratios in the rayleigh scattering size
range,” J. Aerosol Sci. 20, 331–345 (1989).3. F. Vollmer and S. Arnold, “Whispering-gallery-mode biosensing: label-free detection down to single molecules,”
Nat. Meth. 5, 591–596 (2008).4. F. Vollmer, S. Arnold, and D. Keng, “Single virus detection from the reactive shift of a whispering-gallery mode,”
Proc. Natl. Acad. Sci. U.S.A. 105, 20701–20704 (2008).5. I. M. White, H. Oveys, and X. Fan, “Liquid-core optical ring-resonator sensors,” Opt. Lett. 31, 1319–1321 (2006).6. A. M. Armani, R. P. Kulkarni, S. E. Fraser, R. C. Flagan, and K. J. Vahala, “Label-free, single-molecule detection
with optical microcavities,” Science 10, 783-787 (2007).7. S. Arnold, S. I. Shopova, and S. Holler, “Whispering gallery mode bio-sensor for label-free detection of single
molecules: thermo-optic vs. reactive mechanism,” Opt. Express 18, 281–287 (2010).8. T. Lu, H. Lee, T. Chen, S. Herchakb, J.-H. Kim, S. E. Frasera, R. C. Flagand, and K. Vahala, “High sensitivity
nanoparticle detection using optical microcavities,” Proc. Natl. Acad. Sci. U.S.A. 108, 5976–5979 (2011).
#148606 - $15.00 USD Received 2 Jun 2011; revised 18 Jul 2011; accepted 19 Jul 2011; published 9 Aug 2011(C) 2011 OSA 15 August 2011 / Vol. 19, No. 17 / OPTICS EXPRESS 16195
9. T. P. Burg, M. Godin, S. M. Knudsen, W. Shen, G. Carlson, J. S. Foster, K. Babcock, and S. R. Manalis, “Weigh-ing of biomolecules, single cells and single nanoparticles in fluid,” Nature 446, 1066–1069 (2007).
10. A. K. Naik, M. S. Hanay, W. K. Hiebert, X. L. Feng, and M. L. Roukes, “Towards single-molecule nanomechan-ical mass spectrometry,” Nat. Nanotechnol. 4, 445C450 (2009).
11. S. Wang, X. Shana, U. Patela, X. Huanga, J. Lua, J. Lid, and N. Tao, “Label-free imaging, detection, and massmeasurement of single viruses by surface plasmon resonance,” Proc. Natl. Acad. Sci. U.S.A. 107, 16028–16032(2010).
12. A. Mitra, B. Deutsch, F. Ignatovich, C. Dykes, and L. Novotny, “Nano-optofluidic detection of single viruses andnanoparticles,” ACS Nano 4, 1305–1312 (2010).
13. F. Patolsky, G. Zheng, O. Hayden, M. Lakadamyali, X. Zhuang, and C. M. Lieber, “Electrical detection of singleviruses,” Proc. Natl. Acad. Sci. U.S.A. 101, 14017–14022 (2004).
14. J. Zhu, S. K. Ozdemir, Y.-F. Xiao, L. Li, L. He, D.-R. Chen, and L. Yang, “On-chip single nanoparticle detectionand sizing by mode splitting in an ultrahigh-Q microresonator,” Nat. Photonics 4, 46–49 (2010).
15. D. S. Weiss, V. Sandoghdar, J. Hare, V. Lefevre-Seguin, J.-M. Raimond, and S. Haroche, “Splitting of high-QMie modes induced by light backscattering in silica microspheres,” Opt. Lett. 20, 1835–1837 (1995).
16. M. L. Gorodetsky, A. D. Pryamikov, and V. S. Ilchenko, “Rayleigh scattering in high-Q microspheres,” J. Opt.Soc. Am. B 17, 1051–1057 (2000).
17. D. K. Armani, T. J. Kippenberg, S. M. Spillane, and K. J. Vahala, “Ultrahigh-Q toroid microcavity on a chip,”Nature 421, 925–928 (2003).
18. A Mazzei, S Gotzinger, L De S Menezes, G Zumofen, O Benson, and V Sandoghdar, “Controlled coupling ofcounterpropagating whispering-gallery modes by a single Rayleigh scatterer: a classical problem in a quantumoptical light,” Phys. Rev. Lett. 99, 173603 (2007).
19. L. Chantada, N. I. Nikolaev, A. L. Ivanov, P. Borri, and W. Langbein, “Optical resonances in microcylinders:response to perturbations for biosensing,” J. Opt. Soc. Am. B 25, 1312–1321 (2008).
20. J. Zhu, S. K. Ozdemir, L. He, and L. Yang, “Controlled manipulation of mode splitting in an optical microcavityby two Rayleigh scatterers,” Opt. Express 18, 23535–23543 (2010).
21. X. Yi, Y.-F. Xiao, Y.-C. Liu, B.-B. Li, Y.-L. Chen, Y. Li, and Q. Gong, “Multiple-Rayleigh-scatterer-inducedmode splitting in a high-Q whispering-gallery-mode microresonator,” Phys. Rev. A, 83, 023803 (2011).
22. The Universal Database of the International Committee on Taxonomy of Viruses (ICTVdB,http://www.ictvdb.org/ICTVdB/index.htm).
23. S. K. Ozdemir, J. Zhu, L. He, and L. Yang, “Estimation of Purcell factor from mode-splitting spectra in an opticalmicrocavity,” Phys. Rev. A 83, 033817 (2011).
24. K. R. Hiremath and V. N. Astratov, “Perturbations of whispering gallery modes by nanoparticles embedded inmicrocavities,” Opt. Express 16, 5421–5426 (2008)
25. H.-C. Ren, F. Vollmer, S. Arnold, and A. Libchaber, “High-Q microsphere biosensor—analysis for adsorption ofrodlike bacteria,” Opt. Express 15, 17410–17423 (2007)
26. W. Kim, S. K. Ozdemir, J. Zhu, L. He, and L. Yang, “Demonstration of mode splitting in an optical microcavityin aqueous environment,” Appl. Phys. Lett. 97, 071111 (2010).
27. M. Noto, D. Keng, I. Teraoka, and S. Arnold, “Detection of protein orientation on the silica microsphere surfaceusing transverse electric/transverse magnetic whispering gallery modes,” Biophys J. 92, 4466–4472 (2007).
28. I. Teraoka and S. Arnold, “Theory on resonance shifts in TE and TM whispering gallery modes by non-radialperturbations for sensing applications,” J. Opt. Soc. Am. B. 23, 1381–1389 (2006).
29. J. Knittel, T. G. McRae, K. H. Lee, and W. P. Bowen, “Interferometric detection of mode splitting for whisperinggallery mode biosensors,” Appl. Phys. Lett. 97, 123704 (2010).
30. M. Noto, D. Kenga, I. Teraoka, and S. Arnold, “Detection of protein orientation on the silica microsphere surfaceusing transverse electric/transverse magnetic whispering gallery modes,” Biophys. J. 92, 3366–4472 (2007).
31. X. Yi, Y.-F. Xiao, Y. Li, Y.-C. Liu, B.-B. Li, Z.-P. Liu, and Q. Gong, “Polarization-dependent detection of cylindernanoparticles with mode splitting in a high-Q whispering-gallery microresonator,” Appl. Phys. Lett. 97, 203705(2010).
32. L. He, S. K. Ozdemir, J. Zhu, and L. Yang, “Ultrasensitive detection of mode splitting in active optical micro-cavities,” Phys. Rev. A 82, 053810 (2010).
1. Introduction
With the increasing presence of nanoparticles in daily lives, there is a growing interest in as-sessing their benefits and risks. Meanwhile, there is also a strong need to detect and charac-terize biological nanoparticles such as viruses, which are responsible for the outbreak of manyinfectious diseases. A critical step in this assessment is to establish label-free, reliable and cost-effective techniques for real-time and on-site detection and quantification of individual virusesand nanoparticles. This will facilitate studies of physical and biological properties of single
#148606 - $15.00 USD Received 2 Jun 2011; revised 18 Jul 2011; accepted 19 Jul 2011; published 9 Aug 2011(C) 2011 OSA 15 August 2011 / Vol. 19, No. 17 / OPTICS EXPRESS 16196
viruses, and of size and material dependent properties of nanoparticles at single particle level.Among various techniques [1–13], micro/nano-sized photonic [3–8] and electromechani-
cal [9, 10] resonators are emerging as forerunners for label-free detection of single nanoparti-cles and molecules due to their immense susceptibility to perturbations in their environmentswhich enhances sensitivity and resolution, and due to the increasing demand for shrinking de-vice dimensions to achieve massive parallelism and integration with the existing micro/nano-systems.
The sensing mechanism used in the existing photonic and electromechanical resonators re-lies on the detection of the spectral shift of a resonance mode upon the landing of a nanoparticlewithin the mode volume. The amount of the spectral shift depends on both the position of theparticle and its properties such as mass, size, refractive index or polarizability. Thus, althougheach arriving particle or virion can be detected, accurate quantitative measurement of the prop-erties of each arriving particle and virion cannot be done. Instead, statistical analysis, such asbuilding histograms of event probability versus spectral shift for ensembles of sequentially ar-riving particles of similar properties, is used to extract the required information (e.g., size, massor polarizability) [4, 10]. This prevents single-shot measurement of each particle and real-timesizing capabilities. Moreover, an equally important issue affecting these schemes is the absenceof a reference. The shift induced by a nanoparticle is very small, and it is sensitive to instru-mental noise and environmental disturbances. Thus, discriminating between the interactions ofinterest and the interfering perturbations becomes difficult.
Recently, we have introduced position-independent size measurement for a single nanoparti-cle by using scattering-induced mode-splitting in an ultra-high-quality (Q) WGM microtoroidresonator [14]. Although this prototype scheme allowed to overcome some difficulties (i.e.,position-dependence and lack of reference) associated with measurement of nanoparticles,there remained critical issues to be solved. First, the sizing method is applicable only for WGMwithout observable splitting. One has to find a splitting-free WGM for measurement of theparticle. Since intrinsic mode splitting (e.g., not intentionally induced or caused by the targetscatterers) [15,16] takes place in almost all practical realizations of ultra-high-Q resonators dueto contaminations or structural inhomogeneities, it is difficult to find such an initially splitting-free WGM. Second, position independent size estimation was valid only for the first nanopar-ticle as the previous model did not explain how the split modes are affected when the particlessequentially enter the mode volume after the first one.
In this study, we demonstrate a technique which overcomes the above mentioned limitationsof existing resonator-based schemes thus allowing the detection, counting and size measure-ment of consecutively adsorbed nanoparticles and virions one-by-one at single particle res-olution. This new mode splitting based approach requires neither simultaneous excitation,frequency-locking and tracking of multiple modes of a resonator nor histogram preparationsor stochastic analysis.
We achieved label-free detection and accurate size-measurement of InfA virions, gold (Au)and polystyrene (PS) particles down to R=30 nm. The ability to detect and measure singlevirions/nanoparticles allows determining their polarizability and size distributions. The demon-strated techniques offer the possibility of an ultra-compact single nanoparticle/biomolecule sizespectrometry system for in-lab or in-field use.
2. Experiments
Single Virus/Nanoparticle Size Spectrometry Figure 1(a) schematically depicts our exper-imental system. Microresonators used in our experiments are silica microtoroids prepared byphotolithography followed by CO2 laser re-flow [17]. The resonators have quality factors above107 and diameters below 40 μm. A tunable 670 nm band laser is used in experiments with viri-
#148606 - $15.00 USD Received 2 Jun 2011; revised 18 Jul 2011; accepted 19 Jul 2011; published 9 Aug 2011(C) 2011 OSA 15 August 2011 / Vol. 19, No. 17 / OPTICS EXPRESS 16197
tunable laser
tapered fiber
photodetector
nozzle
50 100 150 200 2500.92
0.94
0.96
0.98
1
1.02
Frequency (MHz)
Tran
smis
sion
a
b
Fig. 1. Experimental Setup (a) Simplified schematic of the virion/nanoparticle size spec-trometry system, showing the virion/nanoparticle deposition through a nozzle onto a fibertaper coupled microtoroid resonator. The inset displays the scanning electron micrographof single InfA virions adsorbed on the surface of a resonator. (b) Typical transmission spec-trum of the system showing virion induced mode splitting.
ons and nanoparticles smaller than R=70 nm, and a 1550 nm band laser is used in experimentswith bigger particles. A fiber taper prepared from a standard single mode fiber by heat-and-pull technique is used to couple light into and out of the microresonator. Transmitted light isdetected by a photodetector which is connected to an oscilloscope for monitoring the trans-mission spectra (Fig. 1(b)). The spectra are acquired to the computer at rate of 10 frames persecond, and processed by double Lorenzian curve fitting to find the frequencies and linewidthsof the resonances.
Mode splitting can be induced either by the scattering centers due to structural inhomo-geneities (i.e., intrinsic mode splitting) [15,16] or by the scatterers intentionally introduced intothe resonator mode volume [14, 15, 18]. The underlying physics of the interaction between aresonant mode and a single sub-wavelength scatterer in the mode volume was studied using thedipole approximation [18]. The resonator-scatterer interaction lifts the frequency-degeneracy ofthe two counter-propagating WGMs of the resonator and splits the single resonance into two,leading to two standing wave modes (SWMs). Consequently, the two SWMs are identified inthe transmission spectrum as a doublet with two spectrally shifted resonance modes of differentlinewidths (Fig. 1(b)).
For the deposition of nanoparticles and viruses, a set-up consisting of a differential mobilityanalyzer (DMA) and a nozzle with an inner tip diameter of 80 μm was used. First, particlesare carried out by compressed air using a collision atomizer. The solvent in droplets is thenevaporated in a dryer with the silica gel desiccants. Solid particles are further neutralized bya radioactive source such that they have a well-defined charge distribution. Then they are sentto the DMA where they are classified according to their electrical mobility. Particles within anarrow range of mobility can exit through the output slit. The nozzle was placed at about 300
#148606 - $15.00 USD Received 2 Jun 2011; revised 18 Jul 2011; accepted 19 Jul 2011; published 9 Aug 2011(C) 2011 OSA 15 August 2011 / Vol. 19, No. 17 / OPTICS EXPRESS 16198
μm away from the microtoroid, and particles are blown directly towards the microtoroid. Puri-fied and inactivated Influenza virus X-31 A/AICHI/68 was purchased in 4-(2-hydroxyethyl)-1-piperazineethanesulfonic acid (Hepes) buffer from Charles River Laboratories. The virus sam-ple was passed through a 0.2 μm nylon membrane filter to remove aggregates. Gold nanoparti-cles (50 and 100 nm) were purchased from British Biocell International Limited. PS nanopar-ticles (50–135 nm) are from Thermo Scientific (Duke Standards 3K series).
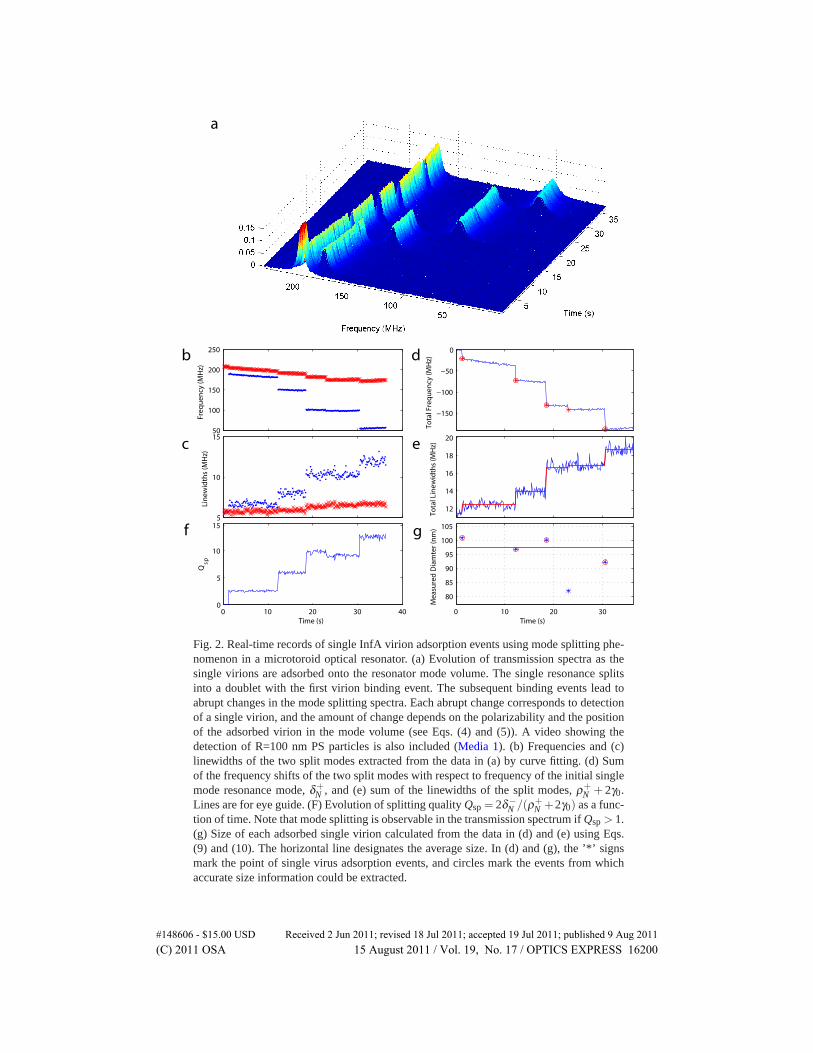
Figure 2 shows the mode splitting spectra induced by InfA virions entering the resonatormode volume one-by-one. With the arrival of the first virion, the single resonance splits intotwo. The subsequent single virion adsorptions lead to redistribution of the existing SWMs andabrupt jumps in the splitting spectra (Fig. 2(a)). The sudden changes in the frequencies andlinewidths of the resonance modes signal the detection of particle adsorption events, and theamount of change depends on the virion size and its position in the mode volume. In the nextsection, we will explain how to take advantage of the split modes for constructing a position-independent measurement scheme for individual scatterers. The mode splitting resonance fre-quencies and linewidths extracted from the spectra in Fig. 2(a) show step changes correspond-ing to each individual virion adsorption event (Figs. 2(b) and 2(c)). Processing this data allowsto extract the polarizability and hence the size of each virion (Fig. 2(g)), as will be shown in thenext section. Note that particles deposited outside the mode volume do not affect the WGM, sothey have no effect on the resonance spectrum.
3. Theory
Single Particle Model Let’s denote the two SWMs formed after the adsorption of a singlenanoparticle/virion as lower and higher frequency modes with the corresponding resonancefrequencies and linewidths denoted as (ω−
1 ,γ−1 ) and (ω+1 ,γ+1 ). The dipole approximation pre-
dicts that the spectral distance of these two modes is given by the coupling coefficient betweenthe counter-propagating WGMs as 2g=−α f 2(r)ω/V , and the linewidth difference due to cou-pling of the WGMs to the environment via scattering is given as 2Γ=α2 f 2(r)ω4/3πν3V . Hereω is the angular resonant frequency, V is the microcavity mode volume, ν = c/
√εm with c rep-
resenting the speed of light, and f (r) is a scalar quantity and designates the normalized modeintensity distribution. The polarizability α of the scatterer is α = 4πR3(εp − εm)/(εp + 2εm)for a spherical particle of radius R and electric permittivity εp in a surrounding medium ofelectric permittivity εm (e.g., εm = 1 for air). Subsequently, the frequency shift (Δω−
1 ,Δω+1 )
and linewidth change (Δγ−1 ,Δγ+1 ) of the split modes (doublet) with respect to the resonancefrequency ω0 and the linewidth γ0 of the initial (pre-scatterer) WGM are
Δω−1 = ω−
1 −ω0 = 2g1, Δω+1 = ω+
1 −ω0 = 0 (1)
Δγ−1 = γ−1 − γ0 = 2Γ1, Δγ+1 = γ+1 − γ0 = 0. (2)
Thus, for εm = 1, the polarizability of the scatterer becomes
α1 =−Γ1
g1
3λ 3
8π2 =− Δγ−1Δω−
1
3λ 3
8π2 (3)
which is independent of the position r of the scatterer in the mode volume. In a typical ex-periment, 2g and 2Γ, i.e. the frequency separation and linewidth difference of the two splitmodes, are measured from the transmission spectrum, and subsequently, the polarizability ofthe scatterer is derived using Eq. (3), assuming particles are spherical.
Multi-Particle Model In the case of multiple scatterers, with each new scatterer entering theresonator mode volume, the resonator-scatterer interaction changes, leading to redistribution ofSWMs. Consequently, the locations of nodes and anti-nodes of the SWMs with respect to theindividual scatterers are modified (Media 1).
#148606 - $15.00 USD Received 2 Jun 2011; revised 18 Jul 2011; accepted 19 Jul 2011; published 9 Aug 2011(C) 2011 OSA 15 August 2011 / Vol. 19, No. 17 / OPTICS EXPRESS 16199
Fig. 2. Real-time records of single InfA virion adsorption events using mode splitting phe-nomenon in a microtoroid optical resonator. (a) Evolution of transmission spectra as thesingle virions are adsorbed onto the resonator mode volume. The single resonance splitsinto a doublet with the first virion binding event. The subsequent binding events lead toabrupt changes in the mode splitting spectra. Each abrupt change corresponds to detectionof a single virion, and the amount of change depends on the polarizability and the positionof the adsorbed virion in the mode volume (see Eqs. (4) and (5)). A video showing thedetection of R=100 nm PS particles is also included (Media 1). (b) Frequencies and (c)linewidths of the two split modes extracted from the data in (a) by curve fitting. (d) Sumof the frequency shifts of the two split modes with respect to frequency of the initial singlemode resonance mode, δ+
N , and (e) sum of the linewidths of the split modes, ρ+N + 2γ0.
Lines are for eye guide. (F) Evolution of splitting quality Qsp = 2δ−N /(ρ+
N +2γ0) as a func-tion of time. Note that mode splitting is observable in the transmission spectrum if Qsp > 1.(g) Size of each adsorbed single virion calculated from the data in (d) and (e) using Eqs.(9) and (10). The horizontal line designates the average size. In (d) and (g), the ’*’ signsmark the point of single virus adsorption events, and circles mark the events from whichaccurate size information could be extracted.
#148606 - $15.00 USD Received 2 Jun 2011; revised 18 Jul 2011; accepted 19 Jul 2011; published 9 Aug 2011(C) 2011 OSA 15 August 2011 / Vol. 19, No. 17 / OPTICS EXPRESS 16200
The locations of each scatterers with respect to each other in the resonator mode volumedetermines the distribution of SWMs. Assuming N-scatterers in the mode volume, we defineφN as the spatial phase distance between the antinode of the ω−
N mode and the 1st scatterer,and βi as the spatial phase distance between the i-th and the 1st scatterer. We can write thefrequency shift and the linewidth broadening experienced by the split modes as
Δω−N =
N
∑i=1
2gi cos2(ψNi), Δω+N =
N
∑i=1
2gi sin2(ψNi) (4)
Δγ−N =N
∑i=1
2Γi cos2(ψNi), Δγ+N =N
∑i=1
2Γi sin2(ψNi) (5)
where ψNi = φN −βi is the spatial phase distance between the antinode of the ω−N mode and
i-th scatterer. 2gi and 2Γi only depend on the αi with the relation defined in the single modecase. They respectively characterize the splitting and linewidth difference of the split modes ifthe i-th scatterer is the only scatterer in the mode volume, i.e. i.e. a single scatterer locates at theanti-node of one SWM. When multiple particles bind to the microcavity at arbitrary locations,the anti-node does not necessarily correspond to the location of a particle. The deviation ofthe i-th scatterer from the anti-node can be characterized by the spatial phase distance, ψNi,which can be used to scale the particle-field interactions. Since the SWMs exhibit sinusoidalspatial patterns, the cos2(. . .) and sin2(. . .) terms in Eqs. (4) and (5) correct the interactionstrength between a scatter with each of the two SWMs. Imposing the condition that the SWMsdistribute themselves to maximize mode splitting [19, 20], we find that φN should be adjustedto satisfy
tan(2φN) =∑N
i=1 gi sin(2βi)
∑Ni=1 gi cos(2βi)
. (6)
Equivalently, one SWM is maximally shifted and the other SWM is minimally shifted, and thetwo SWMs are orthogonal to each other. The resonance wavelength of a SWM is proportionalto, by a factor of azimuthal wavenumber, the round-trip optical path length. Therefore max-imizing or minimizing the frequency (wavelength) shift equals to maximizing or minimizingthe optical round trip path length. The underlying physical mechanism can be intuitively under-stood from the Fermat’s principal, which states that rays of light traverse the path of stationary(could be maximal or minimal) time [20, 31].
Next, we define δ−N = Δω+
N − Δω−N = ω+
N − ω−N as the mode splitting between the two
modes and δ+N = Δω+
N + Δω−N = ω+
N + ω−N − 2ω0 as the total frequency shift. Similarly,
ρ−N = Δγ+N − Δγ−N = γ+N − γ−N corresponds to the linewidth difference between the two split
modes and ρ+N = Δγ+N +Δγ−N = γ+N + γ−N −2γ0 corresponds to the sum of the linewidth change.
Using the definitions of δ±N and ρ±
N and Eqs. (4) and (5), we find
δ−N = 2
N
∑i=1
gi cos(2ψNi), δ+N = 2
N
∑i=1
gi (7)
ρ−N = 2
N
∑i=1
Γi cos(2ψNi), ρ+N = 2
N
∑i=1
Γi (8)
In practical realizations, it is not possible to know the exact values of ψNi, hence δ−N and ρ−
N , toextract useful information of the deposited scatterers. However, one can use δ+
N and ρ+N because
they only depend on gi and Γi which are directly related to the polarizability of the i-th scatterer.
#148606 - $15.00 USD Received 2 Jun 2011; revised 18 Jul 2011; accepted 19 Jul 2011; published 9 Aug 2011(C) 2011 OSA 15 August 2011 / Vol. 19, No. 17 / OPTICS EXPRESS 16201
Consequently, we can write the polarizability of the N-th particle αN as
αN = −ΓN
gN
3λ 3
8π2 =−3λ 3
8π2
ρ+N −ρ+
N−1
δ+N −δ+
N−1
= −3λ 3
8π2
(γ+N + γ−N )− (γ+N−1 + γ−N−1)
(ω+N +ω−
N )− (ω+N−1 +ω−
N−1)(9)
which states that the polarizability of the N-th scatterer can be calculated just by comparing thetotal frequencies and linewidths of the split modes right before and after its deposition. Thenthe radius RN can be calculated as
RN =
[αN
4πεp +2εp −1
]1/3
. (10)
4. Discussion
Mode Splitting Size Spectrometry of Single InfA Virions The spectrogram shown in Fig. 2(a)presents examples of transmission spectra obtained in experiments with InfA virions. With eachconsecutive individual nanoparticle adsorption, the frequency and the linewidth of the splitmodes change abruptly. The heights of discrete jumps depend on the positions of the virionsrelative to the SWMs according to Eqs. (4)–(6).
Extracted frequencies and linewidths of the split resonances from the experimental datashown in Fig. 2(a) are depicted in Figs. 2(b,c). This information is subsequently used to cal-culate δ+
N and ρ+N (Fig. 2(d) and 2(e)). Single virion adsorption events are clearly visible as
discrete jumps in Figs. 2(d) and 2(e). Although the height of each discrete jump depends onthe position of each virion within the resonator mode volume, we can accurately measure thesize regardless of the virion position. Using Eqs. (9) and (10), we estimated the polarizabilityfrom which the size of the adsorbed virions was derived and presented in Fig. 2(g). Assuming arefractive index of 1.48 [11] for virions, we calculated the radii of the adsorbed virions to be inthe range 46−55 nm, for the data in Fig. 2. As seen in Fig. 2(e), the change in total linewidthρ+
N for the fourth virion adsorption event is within the noise level of our system. Althoughthe estimated size for this virion differs from the expected nominal size, this does not preventdetecting this virion thanks to the distinct change in total frequency δ+
N (Fig. 2(d)).We obtained the polarizability and size distributions of InfA virions by performing many
experiments using different resonators. The results are depicted in Figs. 3(a) and 2(b). Measuredradius R = 53.2± 5.5 nm for InfA virions agrees very well with the values reported in theliteratures [4, 11, 22].
Having identified that the developed model and the scheme allow measuring the polarizabil-ity and size of individual InfA virions, we set out to measure polarizability and size distributionsof Au and PS nanoparticles. For comparison, we show in Figs. 3(a) and 3(c) the experimentallyobtained polarizability distributions of Au nanoparticles with R = 50 nm and R = 100 nm. Fig-ure 3(d) depicts the distribution of estimated sizes for PS particles of R = 100 nm and R = 135nm. The measured distributions of the tested nanoparticles are significantly different correlatingwith their sizes and material properties.
Size Resolution and Detection Limit For PS particles with nominal radius of R = 100±1.7nm and R = 135± 2.1 nm, our size estimation yielded R = 101.2±9.05 nm and R = 135.9±9.96 nm, respectively. The standard deviations of measured polarizability distributions (Fig.3(a) and 3(c)) for Au particles are 32% and 31%, respectively for R = 50 nm and R = 100nm. These are slightly larger than the 24% polarizability deviation estimated from the 8% sizedeviation claimed by the manufacturer.
#148606 - $15.00 USD Received 2 Jun 2011; revised 18 Jul 2011; accepted 19 Jul 2011; published 9 Aug 2011(C) 2011 OSA 15 August 2011 / Vol. 19, No. 17 / OPTICS EXPRESS 16202
20 30 40 50 60 70 800
5
10
15
20
Even
t Fre
quen
cy %
Radius (nm)
40 60 80 100 120 140 160 1800
10
20
30
Even
t Fre
quen
cy %
Radius (nm)
c
a
d
b
10−22
10−21
10−200
5
10
15
20
Even
t Fre
quen
cy %
Polarizability (m3)
10−21
10−200
5
10
15
20
25
Even
t Fre
quen
cy %
Polarizability (m3 )
InfA 50nm gold
100nm gold50nm gold
InfA
100nm PS135nm PS
Fig. 3. Single virus/nanoparticle size spectrometry using mode splitting in microtoroid res-onators. Polarizabilities and sizes are calculated from transmission spectra according toEqs. (9) and (10). (a) Measured polarizability distributions of InfA virions and 50 nm Aunanoparticles. (b) Measured size distribution of InfA virions with average radius at 53.2nm. (c) Measured polarizability distributions of 50 nm and 100 nm Au particles. (d) Meas-ured size distrbutions of 100 nm and 135 nm polystyrene (PS) particles. Red curves areGaussian fits to the experimentally obtained distributions.
The standard deviation of the estimated particle sizes and polarizabilities using our techniquehave four main contributions: (i) Standard deviation of the particles, (ii) detection noise and thelaser frequency fluctuations, (iii) curve fitting noise in extracting the resonance frequencies andlinewidths of the split modes, and (iv) fluctuations in the taper-resonator gap. We performed allexperiments in normal laboratory environment with no active control of the conditions. Thus,we believe that the reported results can be improved by proper conditioning and control of laserphase and intensity noise as well as taper-resonator gap fluctuations.
Theoretical detection limit of our scheme is mainly dependent on Q/V of the resonator andthe wavelength of the resonance. For a dielectric nanoparticle of refractive index 1.5, detectionlimit is around R = 10 nm with an ultra-high-Q resonance in the 670 nm wavelength band. Inour experiments using microtoroids with Q ≥ 108, the smallest detected PS particles were ofradii R = 20 nm (nominal value provided by the manufacturer), and the smallest PS particlesdetected and accurately measured were of radii R = 30 nm. These are the smallest dielectricnanoparticles ever detected and measured using optical resonators.
We performed accurate size measurement of up to 50 nanoparticles consecutively depositedon a single WGM resonator with high-Q, without cleaning of the resonator. On the other hand,hundreds of virions or nanoparticles can be detected with the same resonator. This discrepancyin the detection and measurement limits can be explained as follows. In order to detect a singlevirion/nanoparticle binding event, it is sufficient to detect any change in either the resonancefrequencies or the linewidths. However, accurate size measurement requires that the changesin both the frequencies and the linewidths are accurately measured. Thus, size measurementimposes a much stricter condition. For example, as the number of particles in the resonatormode volume increases, the increasing scattering loss leads to broadening of the resonancelinewidths. Eventually, the change induced in the linewidths by a single virion/nanoparticlefalls within the noise level (i.e., similar to the fourth virion event in Fig. 2). In such a case,linewidth information is partially or completely lost, and size information cannot be extracted
#148606 - $15.00 USD Received 2 Jun 2011; revised 18 Jul 2011; accepted 19 Jul 2011; published 9 Aug 2011(C) 2011 OSA 15 August 2011 / Vol. 19, No. 17 / OPTICS EXPRESS 16203
correctly. However, there may still be a discernible change in frequency which would allowdetection of particle binding. Indeed, accurate detection of resonance frequency changes has ahigher saturation limit and is less prone to noise than the linewidth measurement.
Measurement of Nanoparticle Mixtures We challenged our system with a mixture of PSand gold nanoparticles with radii R = 50 nm. The measured polarizability distributions areshown in Fig. 4. The two maxima are easily seen and the two distributions have small overlapsuggesting that our method can be reliably used to detect multiple components of a homoge-nously mixed ensemble of particles and to decide whether the given composition of particleensemble is mono or poly-modal. This is expected as our scheme measures nanoparticles one-by-one. No apriori information is needed to differentiate particles of different polarizabilities.
10−22
10−21
10−200
2
4
6
8
10
Even
t Fre
quen
cy %
Polarizability (m3)
Fig. 4. Measured polarizability distributions of a homogenous mixture of PS and Au par-ticles with radii 50 nm. Bimodality of the mixture is accurately determined from the pro-cessing of mode splitting spectra. Red curves are the Gaussian fits to the experimentallyobtained distributions. The left peak corresponds to PS particles and the right peak corre-sponds to Au particles.
Resolvability of Mode Splitting In order to resolve mode splitting in the transmission spec-tra after the deposition of the N-th particle, δ−
N > ρ+N /2+γ0 should be satisfied [23,24]. Conse-
quently, mode splitting quality Qsp = 2δ−N /(ρ+
N +2γ0) should be larger than one, Qsp > 1 [23].The change in Qsp as the InfA virions bind to the resonator is shown in Fig. 2(f) where wesee that Qsp > 1 is satisfied during the measurements. As the particle binding continues, eachadditional scatterer increases the linewidths, at some point Qsp may become less than oneand mode splitting can no longer be resolved. However, even in such cases, one can extractsome useful information if we assume that mode splitting is much smaller than the individuallinewidths ω+
N −ω−N � γ−N ,γ+N , and the two resonances have similar linewidths γ−N � γ+N . In
such a case, the transmission spectrum will show a single lorentzian peak with a linewidth of
γN =√
γ−N γ+N � (γ−N + γ+N )/2 and a resonance at ωN � (ω−N +ω+
N )/2. This expressions thencan be used in Eqs. (9) and (10) to calculate the polarizability and the size of the N-th particle,provided that γN − γN−1 and ωN −ωN−1 are resolvable [25]. It should be noted that working inthe split mode regime allows a lower measurable particle size for single particle analysis.
Measurement of Ensembles of InfA Virions Discussions and experimental results pre-sented in the previous sections clearly demonstrate that our scheme is very effective and effi-cient in estimating the polarizability of individual nanoparticles entering the resonator modevolume one-by-one. Indeed, during continuous deposition of nanoparticles, mode splittingspectra at any instant is related to the effective polarizability of already deposited nanoparti-cles. If we assume that N-particles are deposited to the mode volume of the resonator, we canassign an effective polarizability αeff sensed by the resonator using
αeff =−3λ 3
8π2
ρ−N
δ−N
=−3λ 3
8π2
(γ+N − γ−N )
(ω+N −ω−
N )(11)
#148606 - $15.00 USD Received 2 Jun 2011; revised 18 Jul 2011; accepted 19 Jul 2011; published 9 Aug 2011(C) 2011 OSA 15 August 2011 / Vol. 19, No. 17 / OPTICS EXPRESS 16204
If all the deposited particles are the same, Eqs. (7) and (8) reveal that αeff of Eq. (11) corre-sponds to the polarizability of a single particle. For verification, we used the data presented inFig. 2 for InfA virions. The calculated size using Eq. (11) is given in Fig. 5. The result coincideswell with the sizes of single virions acquired in Fig. 2(g). Notice that the noise level decreasesas the splitting quality Qsp increases (Fig. 2(f)). This method of size estimation requires thatall the particles on the resonator have very similar sizes and materials, and the mode splittinghas decent quality. For example, the effective polarizability of a virus ensemble coated ontoa resonator pre-treated with specific antibody receptors can be measured using this approach.Selectivity of virus-antibody binding will then determine the accuracy of this scheme.
0 10 20 30 400
10
20
30
40
50
60
70
Time (s)
Radi
us (n
m)
Fig. 5. Estimation of the size of InfA virions by applying Eq. (11) on the data in Fig. 2. Thefluctuations in size estimation decreases as the splitting quality Qsp increases (Fig. 2(f)).
5. Conclusion
We have shown that adsorption of individual viruses and nanoparticles leads to discrete changesin the mode splitting spectra of a WGM microcavity. We developed an accurate and efficientmethod to detect and measure individual nanospecies one-by-one as they are adsorbed in themode volume of a microresonator and experimentally verified it using InfA virions, PS andAu nanoparticles of various sizes. We achieved this by developing a new theoretical modeland measurement strategy which take into account the effect of multiple scatterers depositedon an optical WGM resonator. Contrary to the existing schemes, this new approach worksequally well regardless of whether there is intrinsic mode splitting or whether a particle isdeposited in the resonator mode volume before the actual measurement starts. The particlesare characterized accurately regardless of their positions in the mode volume without the needfor complicated processes such as stochastic analysis or excitation and tracking of multipleresonant modes. Moreover, our method is capable of identifying the modality of mixtures ofnanoparticle ensembles. Thus, the proposed single nanoparticle size spectrometry techniqueprovides a suitable platform for in-situ, real-time and highly sensitive detection and sizing ofindividual nano-sized particles and viruses.
Since nanoparticle induced mode splitting has been demonstrated in water [26], the tech-niques developed here could be effectively extended to aqueous environment and incorporatedinto microfluidic or lab-on-chip devices which will pave the way for detecting and sorting ofsingle bio- molecules/particles based on their polarizability or size. Although in this work, weconsidered spherical particles and isotropic polarizability, our method could be applied to dis-tinguish between spherical and nonspherical particles by probing the particles with light fieldsof orthogonal polarizations [27, 28]. Moreover, the demonstrated techniques are not limited tomicrotoroidal resonators and in principle can be used with any WGM resonator (e.g., micro-
#148606 - $15.00 USD Received 2 Jun 2011; revised 18 Jul 2011; accepted 19 Jul 2011; published 9 Aug 2011(C) 2011 OSA 15 August 2011 / Vol. 19, No. 17 / OPTICS EXPRESS 16205
sphere, microdisk or microring), independent of the mode number and polarization. We shouldnote that for spherical particles, the estimated polarizability using our technique is the same forall polarizations; however, for non-spherical particles different polarizations will give differentpolarizabilities. This can be used to estimate the shape and size of the particles. [25,30,31] Fur-ther improvements in detection and size measurement limits could be made by improving thesystem stability, using noise reduction methods (e.g. [8, 29]), as well as employing gain-mediadoped microresonators [32].
We believe that the abilities provided by this single nanoparticle size spectrometry schemewill find applications in in bio/chemical sensing, environmental monitoring, pharmaceuticaldiagnosis and biomedical researches and nanotechnologies where size dependent properties ofindividual particles and their interactions play significant roles.
Acknowledgments
The authors gratefully acknowledge the support from NSF under Grant No. 0954941. Thiswork was performed in part at the NRF-NNIN (NSF Grant No. ECS-0335765) of WashingtonUniversity in St. Louis. We also thank W. Kim, L. Li, F. Monifi for discussions.
#148606 - $15.00 USD Received 2 Jun 2011; revised 18 Jul 2011; accepted 19 Jul 2011; published 9 Aug 2011(C) 2011 OSA 15 August 2011 / Vol. 19, No. 17 / OPTICS EXPRESS 16206