19
SingTel: Asia’s leading communications group CLSA Investors‟ Forum 2011

SingTel: Asia’s leading
communications group
CLSA Investors‟ Forum 2011
2
Forward looking statement – important note
The following presentation contains forward looking statements by the management
of Singapore Telecommunications Limited ("SingTel"), relating to financial trends for
future periods, compared to the results for previous periods.
Some of the statements contained in this presentation that are not historical facts are
statements of future expectations with respect to the financial conditions, results of
operations and businesses, and related plans and objectives. Forward looking
information is based on management's current views and assumptions including, but
not limited to, prevailing economic and market conditions. These statements involve
known and unknown risks and uncertainties that could cause actual results,
performance or events to differ materially from those in the statements as originally
made. Such statements are not, and should not be construed as a representation as
to future performance of SingTel. In particular, such targets should not be regarded as
a forecast or projection of future performance of SingTel. It should be noted that the
actual performance of SingTel may vary significantly from such targets.
“S$” means Singapore dollars and "A$" means Australian dollars unless otherwise
indicated. Any discrepancies between individual amounts and totals are due to
rounding.

01 // Overview
02 // Singapore
03 // Australia
04 // Associates & joint ventures
05 // Financial position & outlook
Agenda
3
4
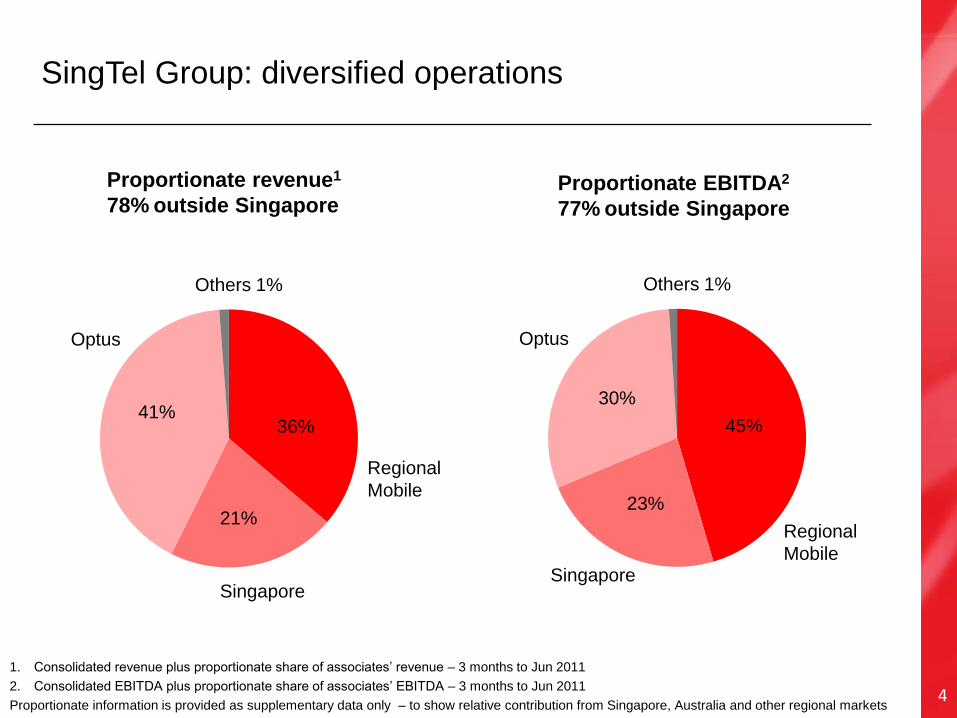
SingTel Group: diversified operations
Singapore
Optus
Regional
Mobile
Proportionate EBITDA2
77% outside Singapore
Others 1%
45%
30%
23%
1. Consolidated revenue plus proportionate share of associates‟ revenue – 3 months to Jun 2011
2. Consolidated EBITDA plus proportionate share of associates‟ EBITDA – 3 months to Jun 2011
Proportionate information is provided as supplementary data only – to show relative contribution from Singapore, Australia and other regional markets
Singapore
Optus
Regional
Mobile
Proportionate revenue1
78% outside Singapore
Others 1%
36% 41%
21%

5
Pre-tax earnings4
› down 10%
› stable in constant
currency & excl Bharti
Africa losses
EBITDA2
› down 4%
Net profit › down 3%
Resilient operations in Singapore and Australia
Revenue › up 7%
S$916m Group
performance
Singapore S$567m
Optus A$560m
Regional Mobile S$472m
1. All figures for quarter ended 30 June 2011. Comparisons based on June 11 vs June 10 quarter
2. Excludes Group and International Business corporate costs
3. Group mobile subscribers, including SingTel, Optus and Regional Mobile Associates
4. Based on the Group‟s share of Regional Mobile Associates Profit Before Tax and exceptionals
S$4,605m
S$1,557m
A$2,313m
416m
Revenue › up 2%
Revenue › up 3%
Customers3
› up 19%
EBITDA
› up 1%

01 // Overview
02 // Singapore
03 // Australia
04 // Associates & Joint Ventures
05 // Financial position
Agenda
6

Leading and shaping the market;
engaging the digital consumer with multimedia services
Mobile – extending our lead
Asia’s 1st premium priority
mobile broadband service
› faster & more reliable mobile
Internet connectivity
Market share2 45.3%
› up 0.9% pts
Record postpaid additions3
› +57,000
Building innovative exclusive apps
› Hyper-local apps that leverage our local
knowledge & complements consumer lifestyles
De!ite
AMPed
Drive smartphone adoption and data usage
Data (ex SMS) as % of ARPU
› 19%
Wireless broadband customers up 72%
› 975k
Revenue
› up 9%
inSing.com
NightOut
Skoob WheresApp
Roam Track
Mo4U
inSing
ILoveDeals
SingTel
Xplorer
1. All figures for quarter ended, or as at 30 June 2011. Comparisons based on June 11 vs June 10 quarter, unless otherwise stated
2. Overall mobile customer market share as at June 2011
3. June 2011 vs March 2011
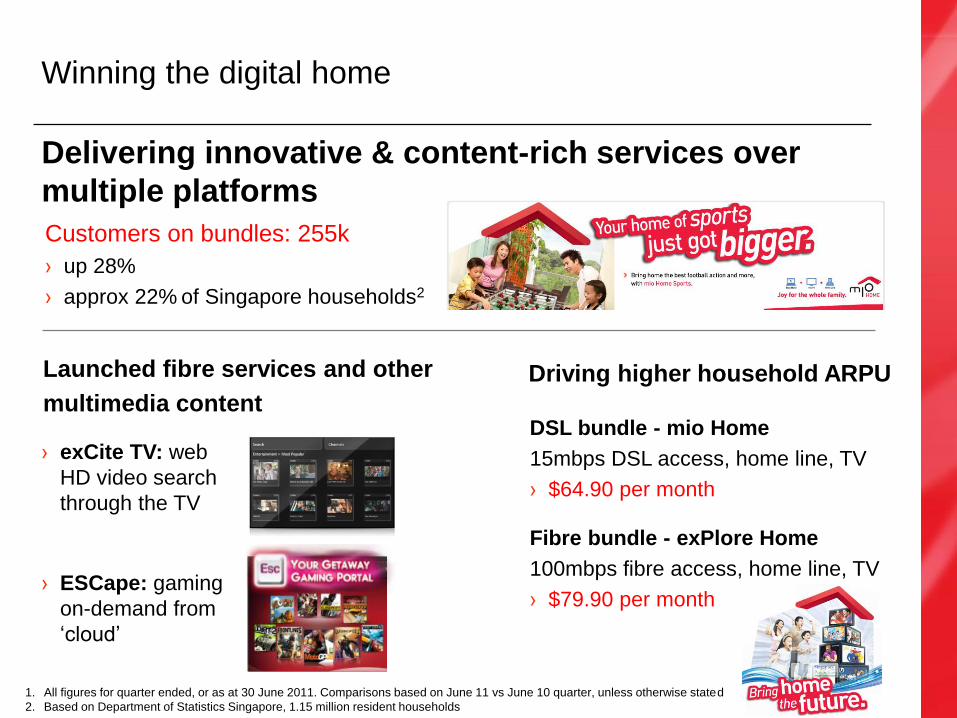
Delivering innovative & content-rich services over
multiple platforms
Winning the digital home
Launched fibre services and other
multimedia content
Driving higher household ARPU
Fibre bundle - exPlore Home
100mbps fibre access, home line, TV
› $79.90 per month
DSL bundle - mio Home
15mbps DSL access, home line, TV
› $64.90 per month
Customers on bundles: 255k
› up 28%
› approx 22% of Singapore households2
› exCite TV: web
HD video search
through the TV
› ESCape: gaming
on-demand from
„cloud‟
1. All figures for quarter ended, or as at 30 June 2011. Comparisons based on June 11 vs June 10 quarter, unless otherwise stated
2. Based on Department of Statistics Singapore, 1.15 million resident households

Vertical industry focus:
› Education
› Financial services
› Healthcare
› Hospitality & media
› Transport & logistics
Telco 1.0
Telco 2.0
Integrated one-stop ICT experience for businesses
Telco 3.0
Managed infrastructure › Extend managed infrastructure leadership
Professional Services
Managed Services › Drive managed & professional services to higher scale
Cloud computing services › Offer end-to-end cloud computing solutions
Business Solutions on-demand:
› Infrastructure
› Applications
› Connectivity
› Managed services

01 // Overview
02 // Singapore
03 // Australia
04 // Associates & Joint Ventures
05 // Financial position
Agenda
10

Optus Mobile: driving strategic differentiation
Mobile
Customer Experience leadership
› Strengthening internal processes
› Driving customer loyalty
› Better understanding of the customer
Market share2
› stable
1. All figures for quarter ended, or as at 30 June 2011. Comparisons based on June 11 vs June 10 quarter, unless otherwise stated
2. Service revenue market share, 6-months to June 11 vs June 10, based on three telco‟s disclosures
Mobile service revenue
› up 3%
Mobile EBITDA
› stable
Deliver relevant and personalised
digital services to customers
Increase investment in our
mobile network
FINALISE trials of
LTE
COMPLETE upgrade
to HSDPA+
CONTINUE regional
expansion
INVEST in metro network
depth
Optus Smart Safe TV Now
12

Optus Fixed: delivering profitability via on-net focus
Consumer & SMB fixed
Consumer on-net revenue
› down 1%
EBITDA
› up 5%
EBITDA margin up 2% points
› 18%
Business & Wholesale fixed
Revenue
› stable
EBITDA
› up 1%
EBITDA margin stable
› 26%
Strengthening our position in lead-up to NBN
Bundling, innovating & differentiating
in mass market Leveraging our ICT and cloud
capability
12 1. All figures for quarter ended, or as at 30 June 2011. Comparisons based on June 11 vs June 10 quarter, unless otherwise stated

01 // Overview
02 // Singapore
03 // Australia
04 // Associates & Joint Ventures
05 // Financial position
Agenda
13

14
Significant footprint across Asia & Africa
#4 in Pakistan
30%
#1 in Singapore
100%
#1 in Thailand
21%
#1 in Indonesia
35%
#2 in Philippines
47%
#5 in Bangladesh
45%
#2 in Australia
100%
Africa
Shareholding
by Airtel
% denotes equity interest
5
9
10
12 7 8
4
14
13
6 2
11
15
3 1
16
#1 in India
32%
South Asia
Bangladesh 70%, Sri Lanka 100%
9.DR Congo 98.5%
10.Zambia 96.4%
11.Uganda 100%
12.Kenya 100%
13.Tanzania 60%
14.Malawi 100%
15.Madagascar 100%
16.Seychelles 100%
1.Sierra Leone 100%
2.Burkina Faso 100%
3.Ghana 75%
4.Niger 90%
5.Nigeria 65.7%
6.Chad 100%
7.Gabon 90%
8.Congo Brazzaville 90%

15
Effective stake (%) 32.3% 35.0% 21.3% 47.3 30.0 45.0
Mobile penetration 72%1 93% 115% 95% 65% 46%
Market position #11 #1 #1 #2 #4 #5
Market share (%) 20%1 46% 44% 31%
2 16% 2%
Growing our Pan-Asia & Africa customer base
Growth in customers (%)
Mobile customers (m) 102
32 17
28
1.7
27%
24%
16%
8% 15%
13% 3%
South Asia Africa
175
46
1. For India market only
2. As at Mar 11

01 // Overview
02 // Singapore
03 // Australia
04 // Associates & Joint Ventures
05 // Financial position
Agenda
16

Sound financial position
S$913 million
Solid balance sheet
Net debt
› S$5.3 billion
Net debt : EBITDA & share of
associates‟ pre-tax profits
› 0.8x
Strong cash flow
Ratings
› S&P: A+
› Moody‟s: Aa2
55% to 70% of underlying net profit
FY10/11 dividends:
› 15.8¢ ordinary dividend : 66% of underlying net profit
› 10.0¢ special dividend
Dividend policy
Singapore
› S$227 million
Optus
› S$267 million
Associates‟ dividends
› S$420 million
1. All figures for quarter ended, or as at 30 June 2011. Comparisons based on June 11 vs June 10 quarter, unless otherwise stated
› up 18%

FY12 Guidance
Revenue Singapore &
Australia
grow at low single digit level
EBITDA Singapore
Australia
stable
grow at low single digit level
Capex Singapore:
Australia:
approx S$900 million
approx A$1.2 billion
Free cash
flow
Singapore:
Australia:
approx S$1.3 billion
above A$1 billion
Ordinary
dividends from
Regional Mobile
Associates:
Stable 18
FY12 Outlook


