14
REDUCTION OF WASTEWATER A Story of Sipchem Journey toward Sustainability Ahmed Shaheen Al-Khaldi Sipchem - Utilities Operations Manager 1

REDUCTION OF WASTEWATER A Story of Sipchem Journey toward
Sustainability
Ahmed Shaheen Al-Khaldi Sipchem - Utilities Operations Manager
1
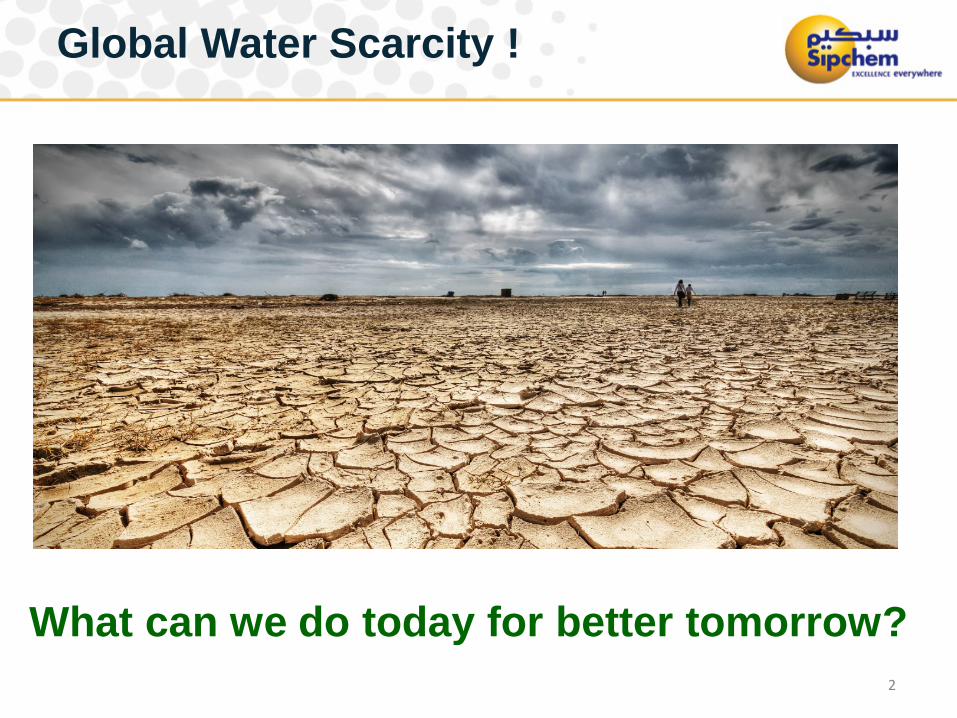
Global Water Scarcity !
2
What can we do today for better tomorrow?

Wire & Cable, EVA/LDPE, EVA film, PBT, and TMF plant commenced operations.
2012 Established
marketing unit in Singapore
Acquired Aectra, (Marketing in Europe)
Achieved Responsible Care Certification
1999 Incorporated as a
closed joint stock company
2005
Methanol plant commenced operations
2006 Went public
through a successful IPO
2007 Established
Sipchem Marketing Company
2010 CO, Acetic Acid,
and VAM plants commenced operations
2011 2013 EA / BA plants
commenced operations
2014
BDO plant commenced operations
2004
Most products were produced in KSA for the first time by Sipchem
2015 MANAR
inauguration
Sipchem A Story of Growth
3
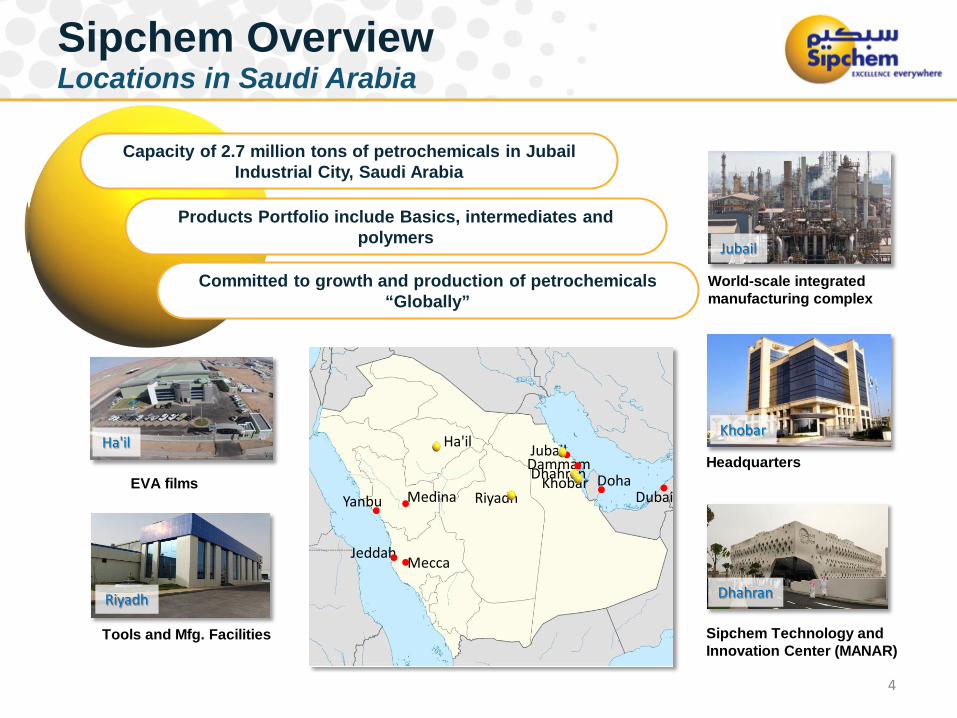
Sipchem Overview Locations in Saudi Arabia
Khobar
Jubail
Dhahran
Sipchem Technology and Innovation Center (MANAR)
Headquarters
World-scale integrated manufacturing complex
Riyadh
Jubail ● Dammam ●
Riyadh
Jeddah ● Mecca ●
Medina ● Yanbu ●
Doha ● Dubai ● Dhahran ● Khobar
Ha'il
Tools and Mfg. Facilities
Ha'il
EVA films
Capacity of 2.7 million tons of petrochemicals in Jubail Industrial City, Saudi Arabia
Products Portfolio include Basics, intermediates and polymers
Committed to growth and production of petrochemicals
“Globally”
4

Surplus/Deficit
Jubail Industries Water Supply & Demand Statistics
2020
470 464
2019
470 464
29 6 5 6 15
2018
470 455
2017
47
441
57
2021
470 465 470
2016
470
423
2015
470
418
Net Availability Peak Demand
Potable Water in ‘000 m3/day
Surplus/Deficit 22 22
-38 -37 -12
22
-23
2021
180 158
120 132
2015
97 120
2020 2017
120
157
2016
120
180 158
2019
180 158
2018
158
Peak Demand Net Availability
Industrial Wastewater in ‘000 m3/day
5

Sipchem Sustainability Strategy
6
7
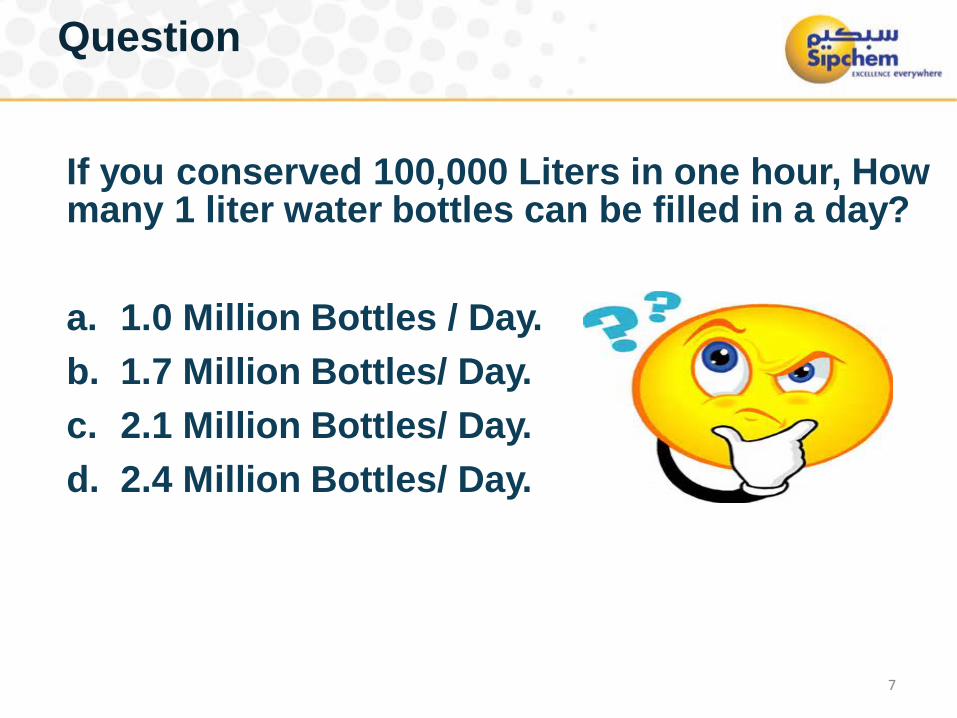
Question
If you conserved 100,000 Liters in one hour, How many 1 liter water bottles can be filled in a day? a. 1.0 Million Bottles / Day. b. 1.7 Million Bottles/ Day. c. 2.1 Million Bottles/ Day. d. 2.4 Million Bottles/ Day.

Sipchem Wastewater Scheme Overview
Sulfate Removal System
Stream E = 105 m3/hr
TOC = 4,000 ppm TDS = 22,000 ppm pH = 1 - 1.5
Cake for disposal Sludge
Biological System
Stream B = 47 m3/hr
TOC = 1,000 ppm TDS = 2,000 ppm pH = 5 - 11
Retention Basin
Biosludge
Final Discharge
Wastewater Discharge 125 m3/hr
TOC <800 ppm TDS <2,000 ppm pH = 5 - 11
Filtrate
Carbon Filter
Stream A = 5 m3/hr
8 m3/hr
Stream D = 28 m3/hr TOC <. 800 ppm pH = 5 - 11
Stream C = 43 m3/hr
PCR Unit 65 m3/hr
40 m3/hr
DMW Plant
35 m3/hr
8
Total Wastewater flow 228 m3/hr
100 m3/hr Conductivity < 800 µS/cm TOC <. 50 ppm Ammonia < 110 ppm pH = 5 - 11
Conductivity < 50 µS/cm TOC < 20 ppm pH = 5 - 11

Process Condensate Recovery Unit
Demin Plant & Process Condensate Recovery 9
Conductivity < 1 µS/cm. Silica < 20 ppb
Seawater Ammonia <3 ppm TOC <75 ppm Free Chlorine = 0.2 - 0.5 ppm
Conductivity < 800 µS/cm TOC < 50 ppm Ammonia < 110 ppm

Challenges and Process Design Improvements
Unit Challenges Problem Improvements
Carbon Filter High Differential Pressure
Inadequate backwash Upgraded under lateral drain from flat to Spiral shape
Cation Bed High Differential Pressure
Upstream Carbon Media Fines Slippage causing resin fouling
Upgraded carbon media to higher strength's grade
Cation Bed Performance decline
Diluted Wax present in process condensate
Process Optimization and eliminate the stream containing the wax.
10
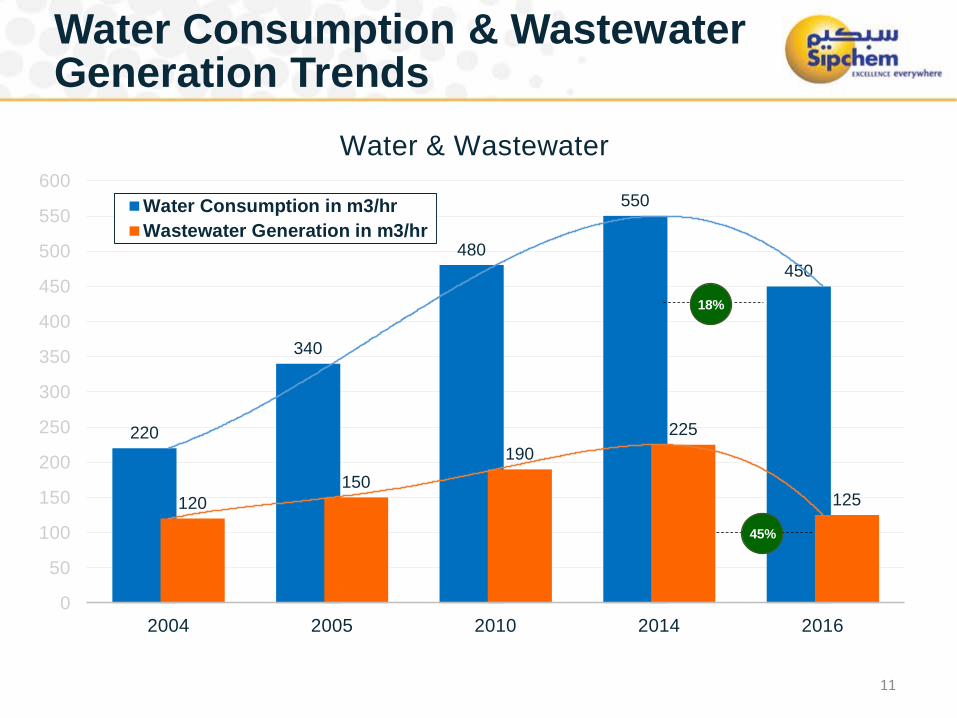
220
340
480
550
450
120 150
190 225
125
0
50
100
150
200
250
300
350
400
450
500
550
600
2004 2005 2010 2014 2016
Water & Wastewater
Water Consumption in m3/hrWastewater Generation in m3/hr
18%
45%
Water Consumption & Wastewater Generation Trends
11

12
What is The Next Ambition?
Further reduction of wastewater by 65%. Supplementary savings of fresh water intake by 20%.
Conclusion
Not only get the SAVINGS (1.80 M $) but most importantly it’s
Preserving the Natural Resources
“BEING BETTER HUMANS ”
13

The End
Thank You!!!
14


