SURVEY OF INCOME AND PROGRAM PARTICIPATION USERS’ GUIDE (Supplement to the Technical Documentation) Third Edition Washington, D.C. 2001 Prepared by: Westat 1650 Research Boulevard Rockville, Maryland 20850 In association with: Mathematica Policy Research, Inc. 600 Maryland Avenue, S.W., Suite 550 Washington, D.C. 20024-2512 Contract No. 50-YABC-7-66016 U.S. DEPARTMENT OF COMMERCE ECONOMICS AND STATISTICS ADMINISTRATION U.S. CENSUS BUREAU
Transcript
SURVEY OF INCOMEAND PROGRAM PARTICIPATION
USERS’ GUIDE
(Supplement to the Technical Documentation)
Third EditionWashington, D.C.
2001
Prepared by:
Westat1650 Research BoulevardRockville, Maryland 20850
In association with:
Mathematica Policy Research, Inc.600 Maryland Avenue, S.W., Suite 550
Washington, D.C. 20024-2512
Contract No. 50-YABC-7-66016
U.S. DEPARTMENT OF COMMERCEECONOMICS AND STATISTICS ADMINISTRATION
U.S. CENSUS BUREAU
Acknowledgments
The third edition of the Survey of Income and Program Participation (SIPP) Users' Guide wasprepared for the U.S. Census Bureau by Westat. Charles T. Nelson was the Government ProjectOfficer for the project within the Census Bureau, and Pat Doyle also provided invaluable supportand guidance to the effort. Many other staff from a number of divisions within the Census Bureaushared their expertise and provided useful comments. In particular, we would like to thank PatrickBenton, John Boies, Judith Hubbard Eargle, Donald Keathly, Karen Ellen King, Gordon Lester,Stephen Mack, Mike McMahon, Thomas Palumbo, Donna Riccini, and Mahdi Sundukchi.
Chapters of the third edition were prepared by Louis Rizzo, Marianne Winglee, Alan Martinson,and Ilene France of Westat; Larry Radbill of Mathematica Policy Research, Inc.; Julie Sykes(then of Mathematica Policy Research, Inc.); and Elizabeth Sheley (Independent Consultant).Alan Martinson, Marty Franklin, Laurie Tomasino, and Carol Dominique of Westat providededitorial and production support; Julie Phillips (Independent Consultant) prepared the Index; andAna Horton of Westat designed the cover. Garrett Moran served as the Westat Project Director.
**************
Because this edition of the Users' Guide builds on the previous editions, we also include thefollowing acknowledgments, which appeared in the second edition.
The first edition of the Survey of Income and Program Participation (SIPP) Users' Guide wasprepared by Daniel Kasprzyk (then Office of the Director), Pat Doyle (Mathematica PolicyResearch, Inc.), Arnold Goldstein (Population Division), Patricia Kelly (Office of the Director),and David B. McMillen (then Office of the Director).
The second edition was prepared by the Data Access and Use Staff of the Data User ServicesDivision. Geneva Burns coordinated the effort, assisted by Jackson Morton and J. Paul Wyatt.Andrea Meier of the Survey of Income and Program Participation Branch in the StatisticalMethods Division prepared Chapter 8, "SIPP Cross-Sectional Weighting Procedures," under thedirection of Rajendra P. Singh. We would like to thank our colleagues within the Census Bureauand our SIPP file users for their helpful comments.
Evolution and History of SIPP...........................................................................1-1Uses of SIPP ......................................................................................................1-3The Survey.........................................................................................................1-4Nonsampling Errors, Sampling Errors, and Weighting.....................................1-6SIPP Public Use Files ........................................................................................1-7Comparison of SIPP with Other Surveys...........................................................1-9Guide to This Document..................................................................................1-11Where to Go for More Information .................................................................1-13
2 SIPP Sample Design and Interview Procedures .................................................2-1
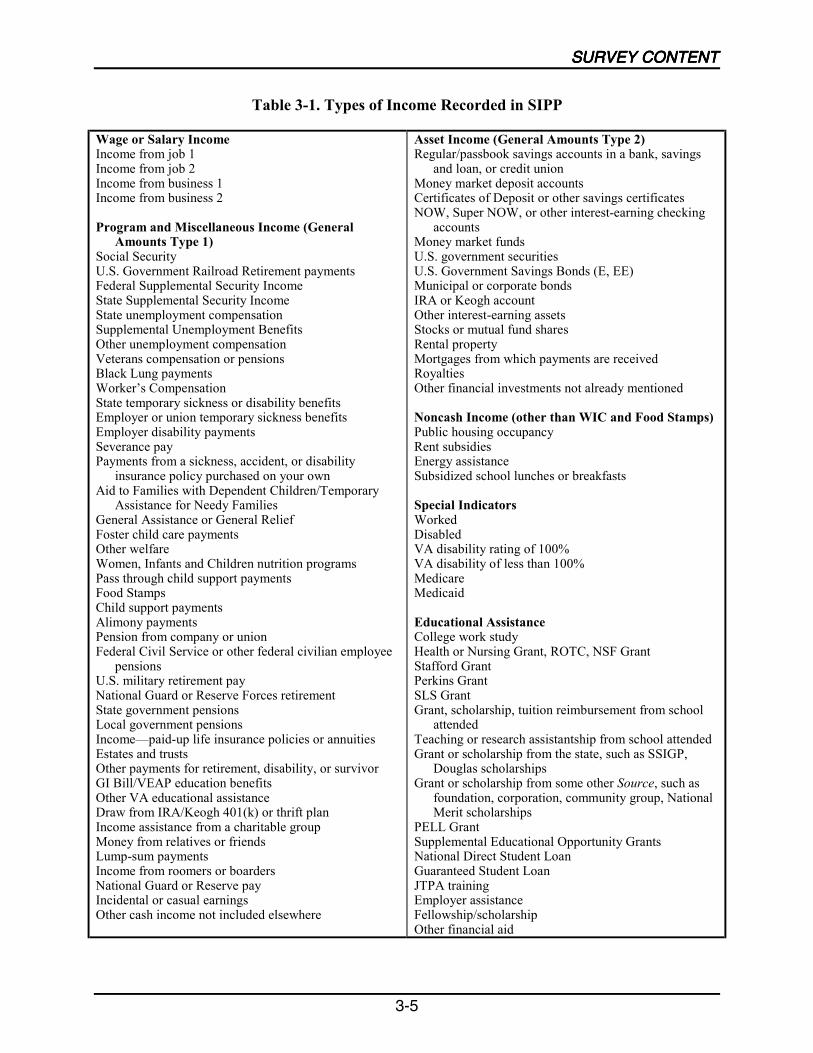
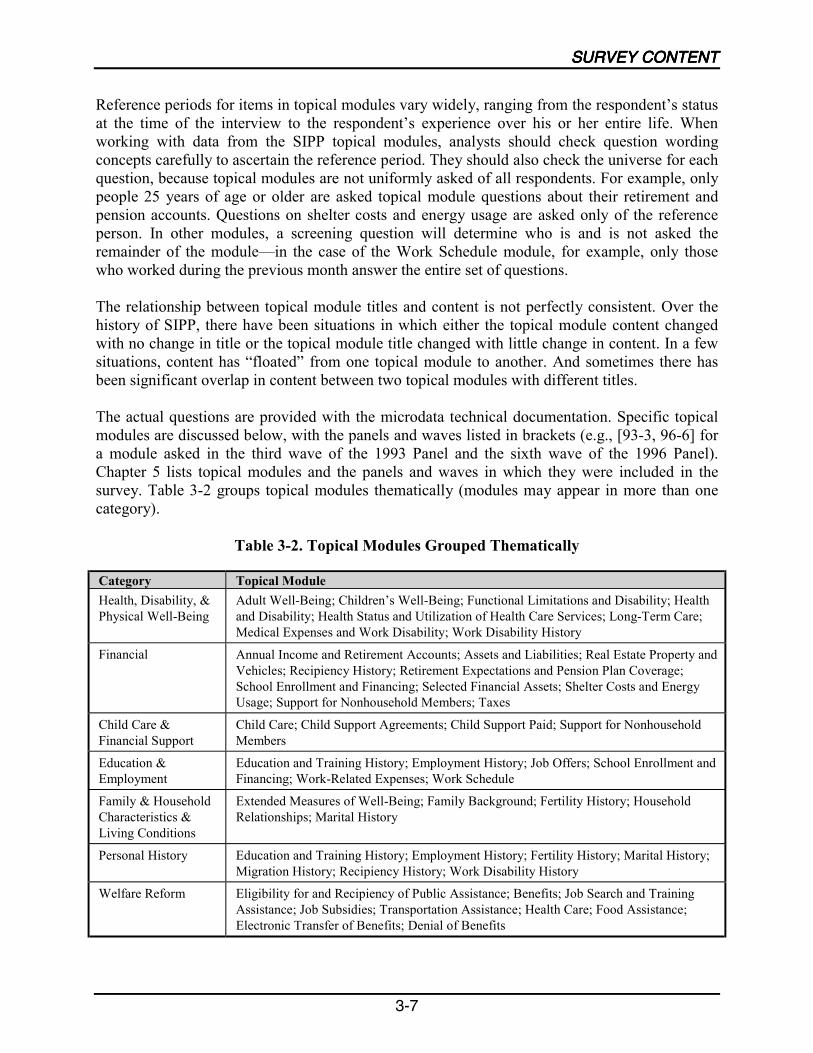
The SIPP Interview............................................................................................3-1Core Content ......................................................................................................3-2Topical Content..................................................................................................3-6
4 Data Editing and Imputation................................................................................4-1
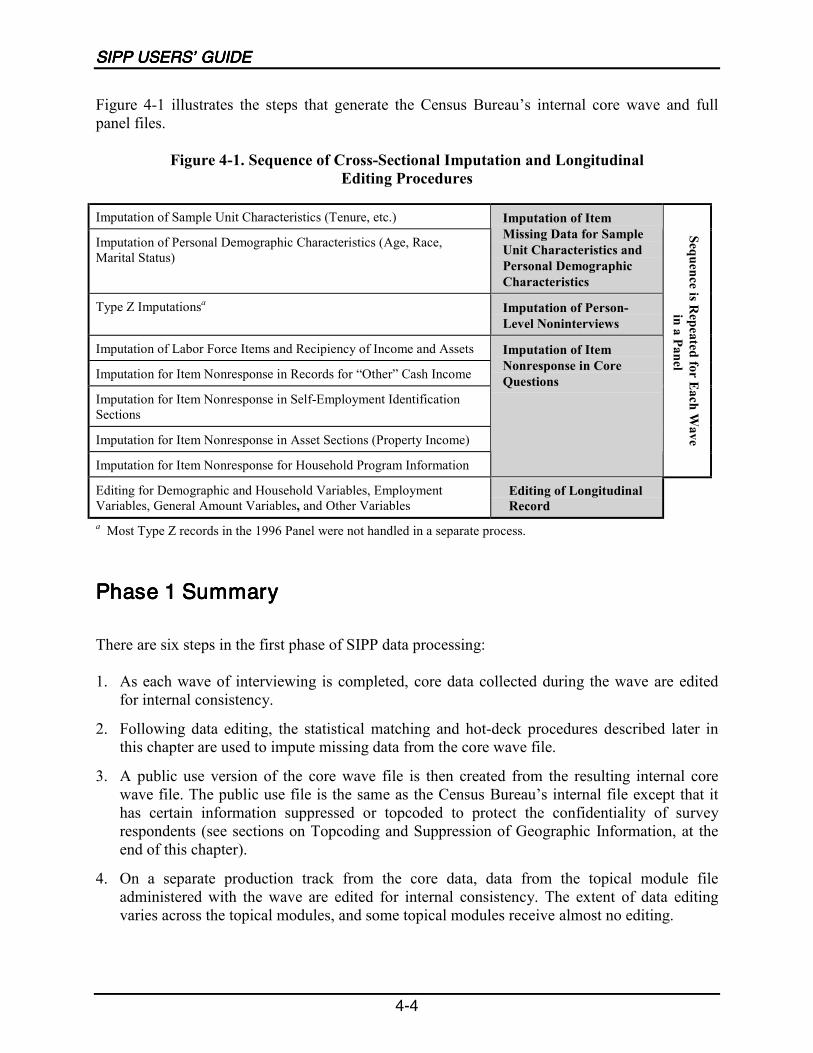
Types of Missing Data .......................................................................................4-1Goals of Imputation ...........................................................................................4-2Assessing the Influence of Imputed Data on Analysis ......................................4-3An Overview of the Process ..............................................................................4-3Phase 1: Data Editing and Imputation Procedures for the Core Wave Files .....4-6Phase 2: Data Editing Procedures for the Full Panel Files ..............................4-15Confidentiality Procedures for the Public Use Files........................................4-17
Published Estimates from SIPP .........................................................................5-1SIPP Public Use Microdata Files.......................................................................5-1Sources for Obtaining SIPP Microdata............................................................5-12Other Sources of Information About SIPP ......................................................5-13
Undercoverage ...................................................................................................6-1Nonresponse.......................................................................................................6-1Measurement Errors...........................................................................................6-2Effects of Nonsampling Error on Survey Estimates ..........................................6-3
Direct Variance Estimation................................................................................7-1Using GVFs to Approximate Variance Estimates .............................................7-4Variance Estimation with Imputed Data............................................................7-6
8 Using Sampling Weights on SIPP Files................................................................8-1
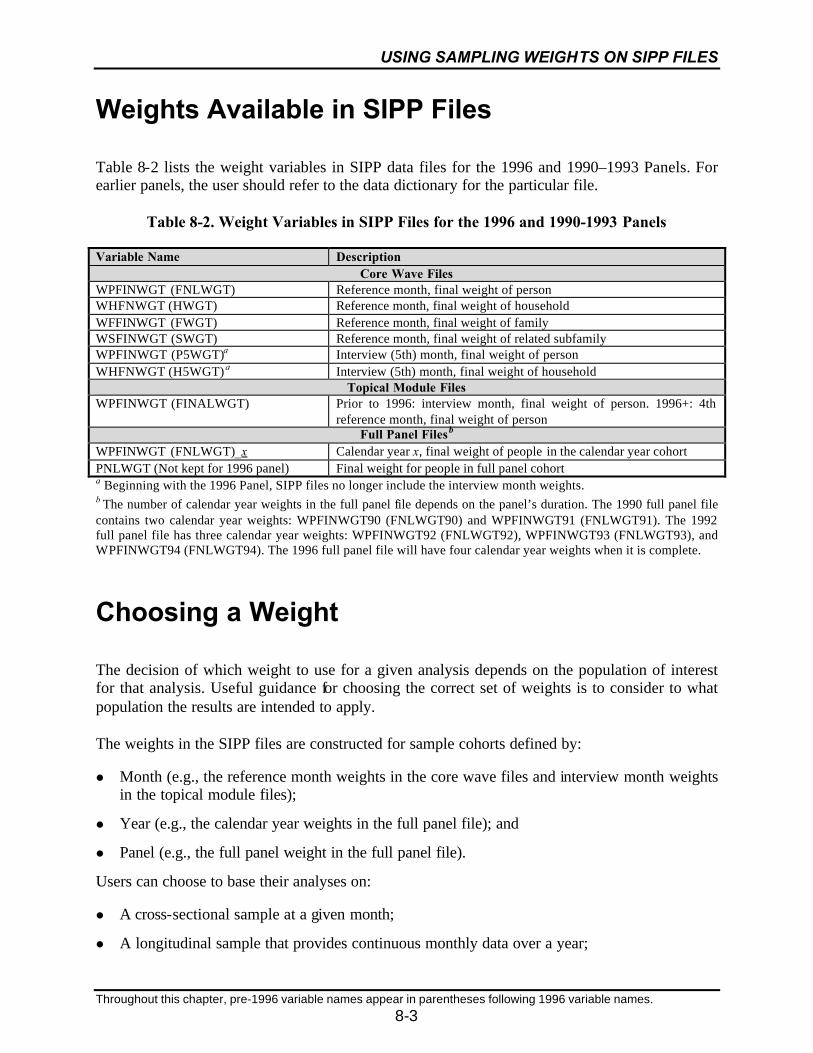
What Weights Are and Why They Should Be Used..........................................8-1Weights Available in SIPP Files........................................................................8-3Choosing a Weight.............................................................................................8-3How Weights Are Constructed ..........................................................................8-4Using Weights in the Core Wave Files..............................................................8-8Using Weights in the Topical Module Files ....................................................8-16Using Weights in the Full Panel File ...............................................................8-16Pooling Data from Two or Three Panels .........................................................8-19
9 The SIPP Public Use Files .....................................................................................9-1
Types of SIPP Data Files ...................................................................................9-1Understanding the ID Variables in SIPP ...........................................................9-2Identifying Persons and Their Relationships .....................................................9-4Working with Multiple Files..............................................................................9-9The Balance of Section II...................................................................................9-9
10 Using the Core Wave Files ..................................................................................10-1
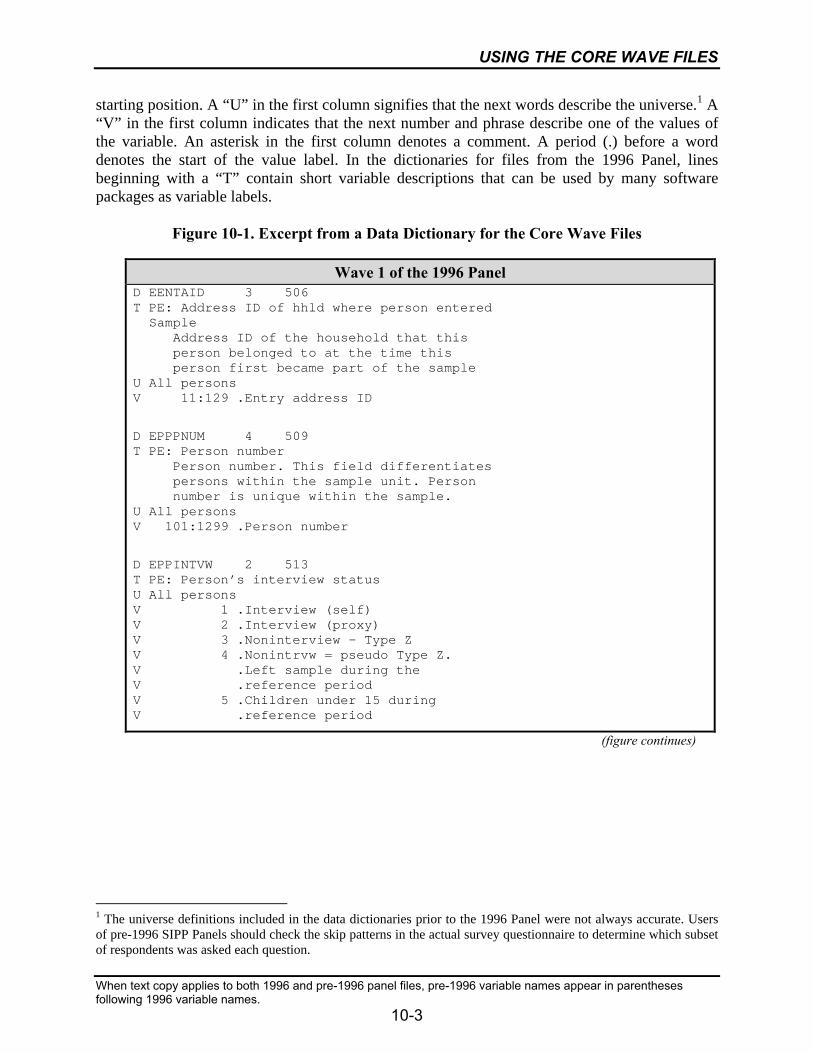
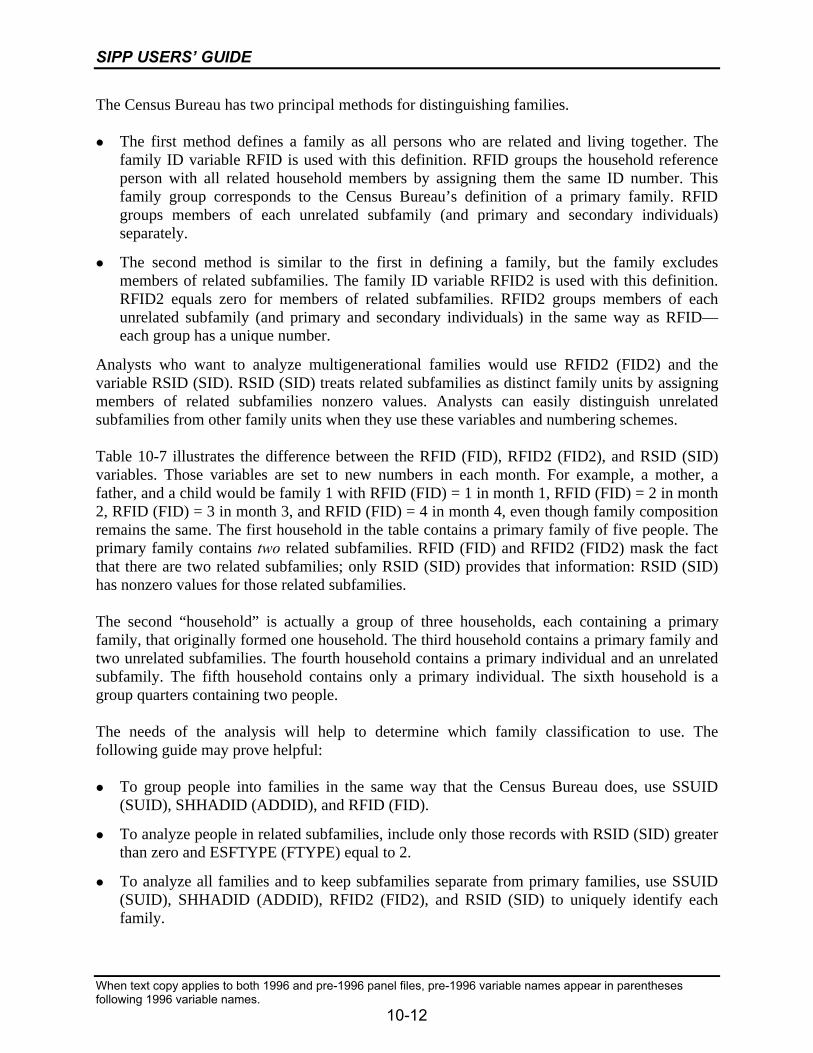
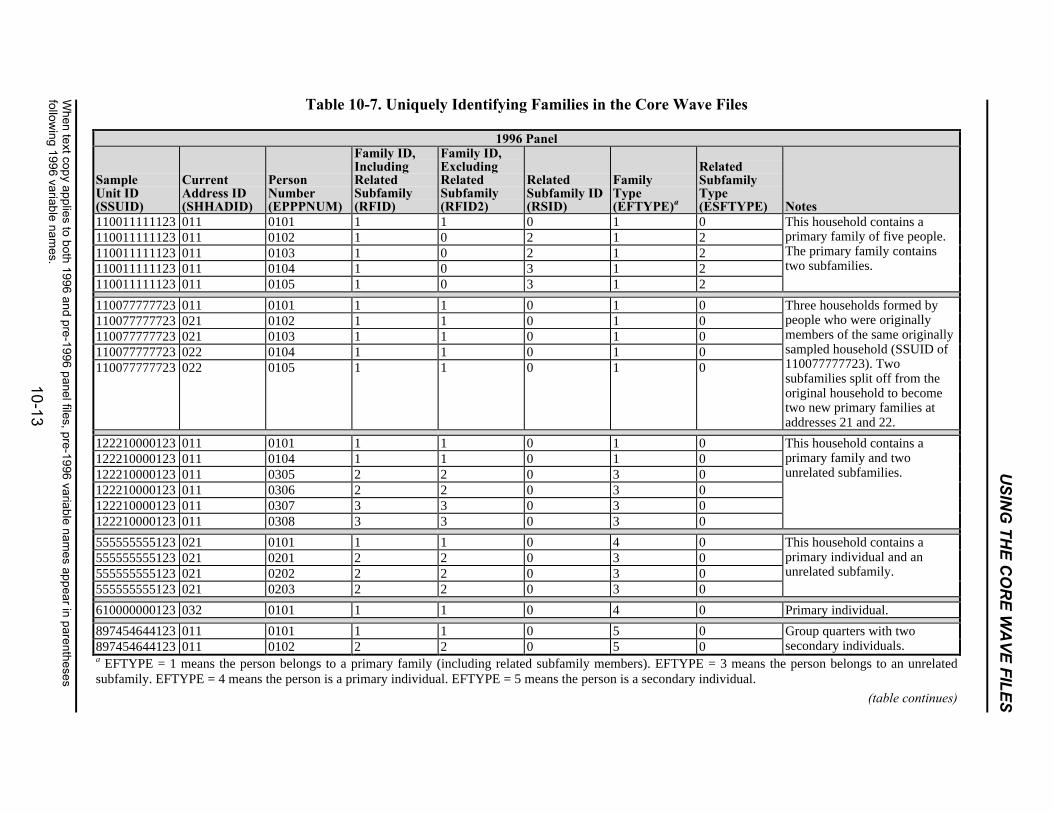
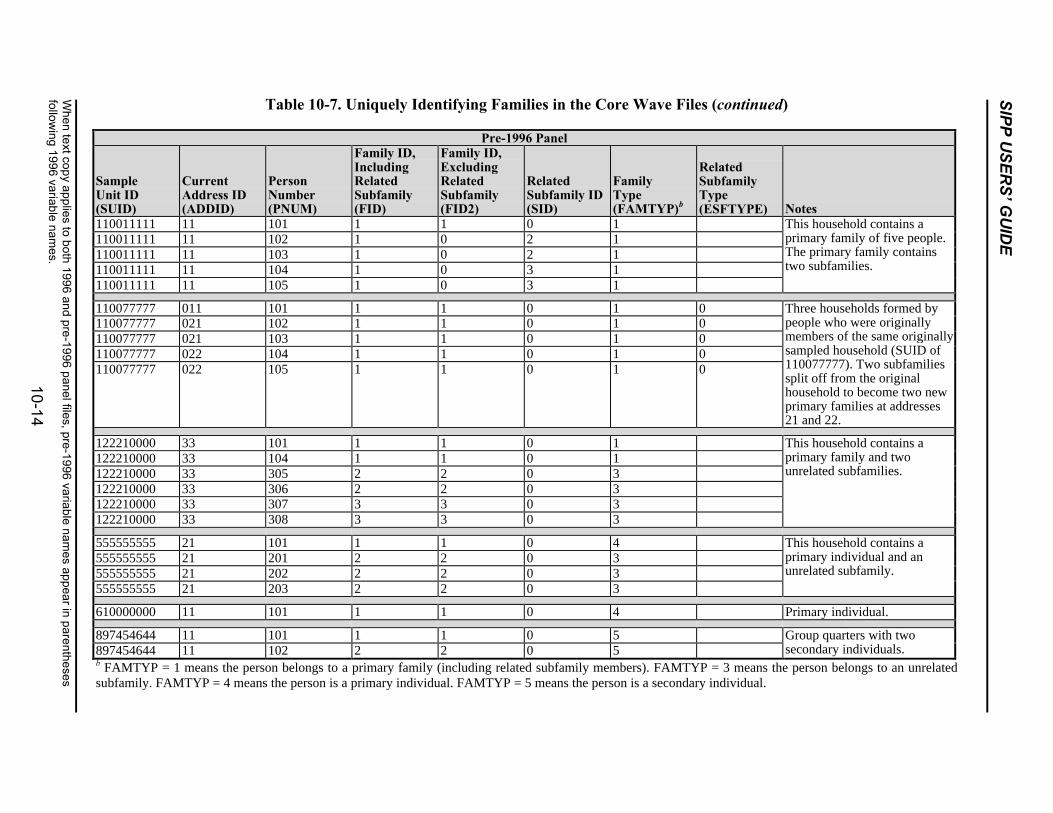
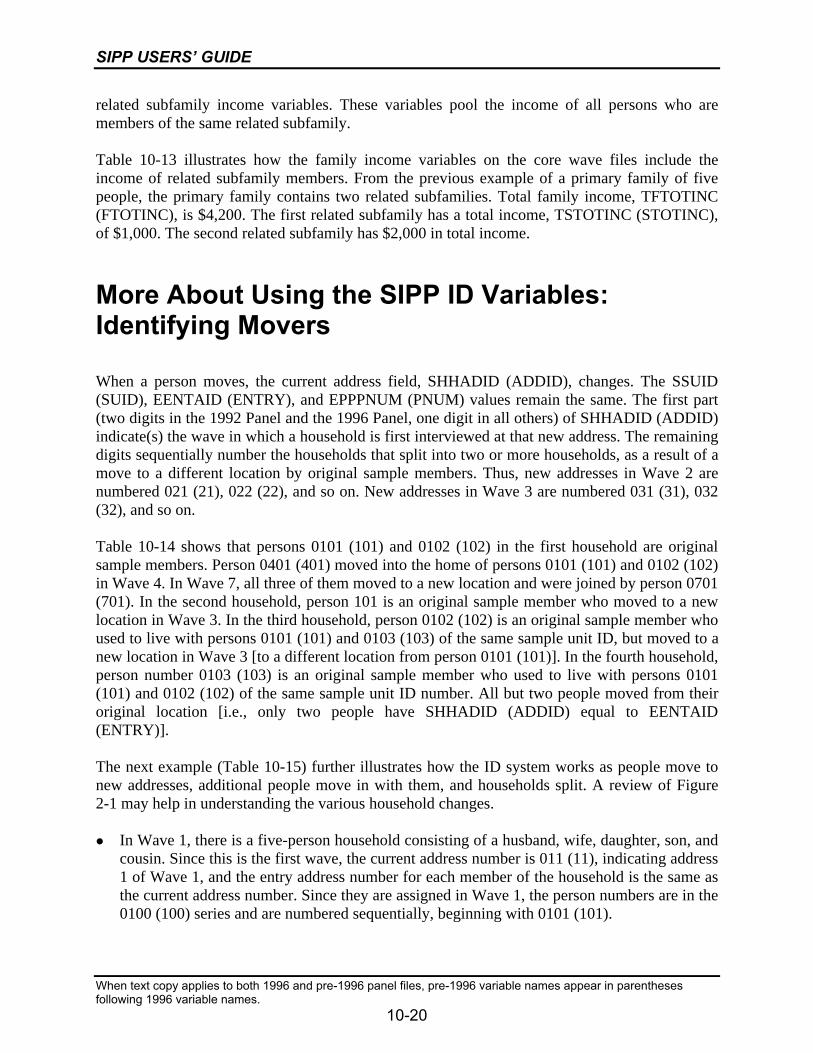
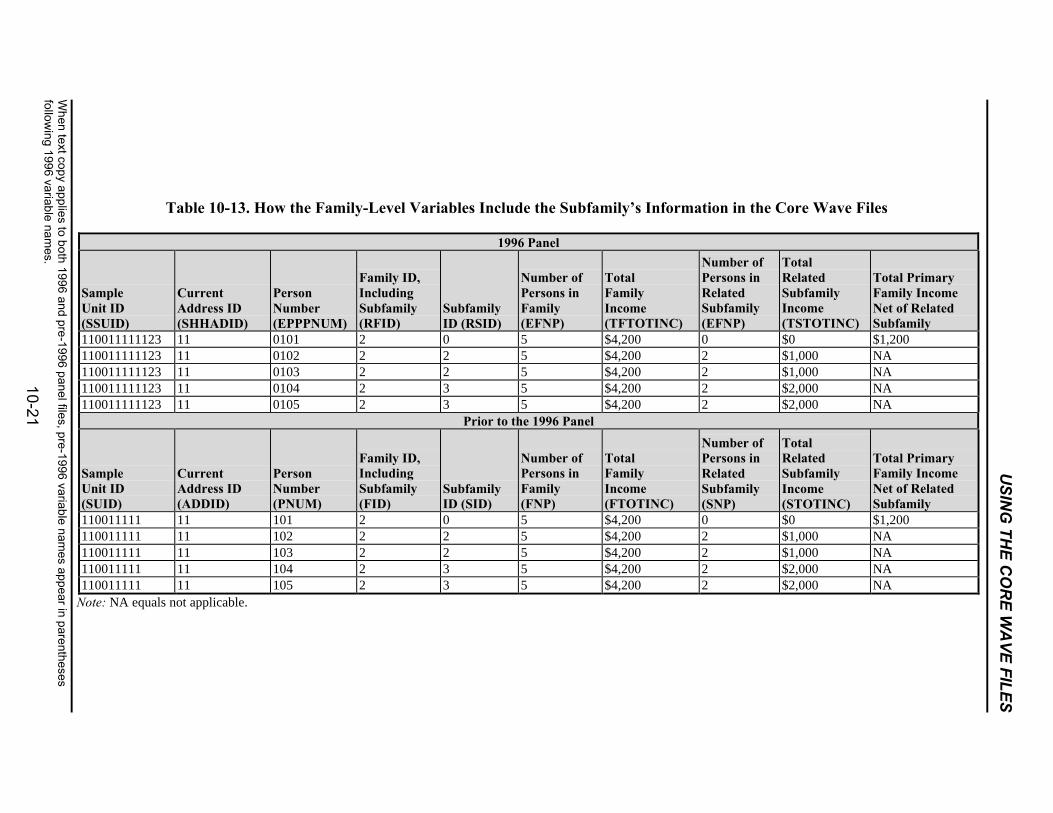
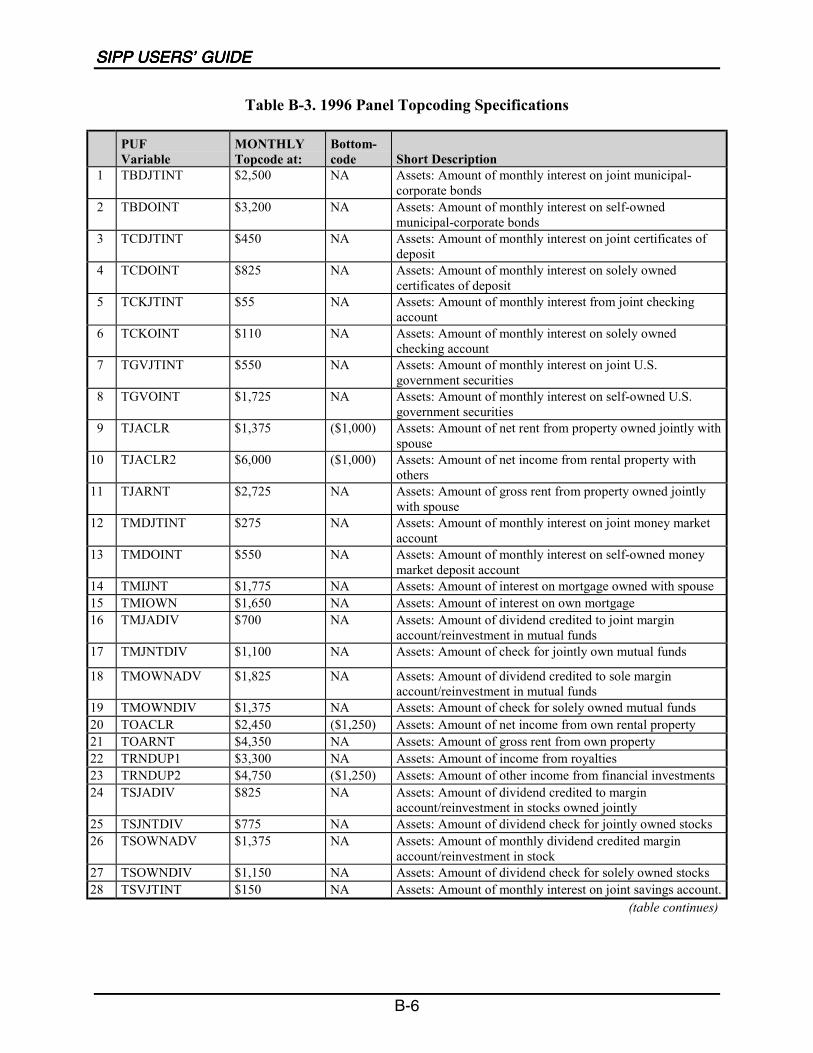
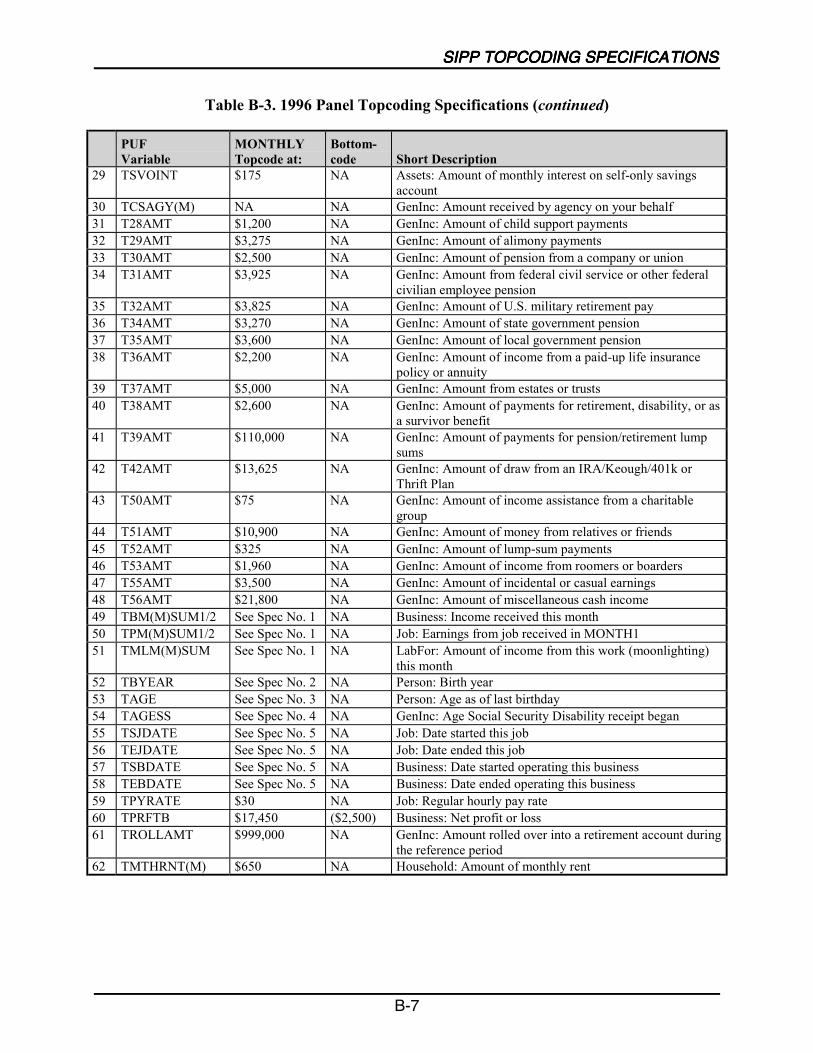
Using the Technical Documentation of the Core Wave Files..........................10-2Relationship of the Core Wave Data Files to the SIPP Survey Instrument .....10-4Structure of the Core Wave Files.....................................................................10-6Identifying Persons ..........................................................................................10-6Identifying Households....................................................................................10-9Identifying Families .......................................................................................10-11Other Variables Describing Household and Family Composition ................10-15More About Using the SIPP ID Variables: Identifying Movers....................10-20Identifying Program Units .............................................................................10-26Income Topcoding in the 1996 Panel ............................................................10-29
CONTENTS
iii
Chapter Page
10 Using the Core Wave Files (Cont.)
Topcoding Prior to the 1996 Panel ................................................................10-35Using Allocation (Imputation) Flags .............................................................10-36Using Weights................................................................................................10-37Identifying States ...........................................................................................10-38Identifying Metropolitan Areas......................................................................10-39
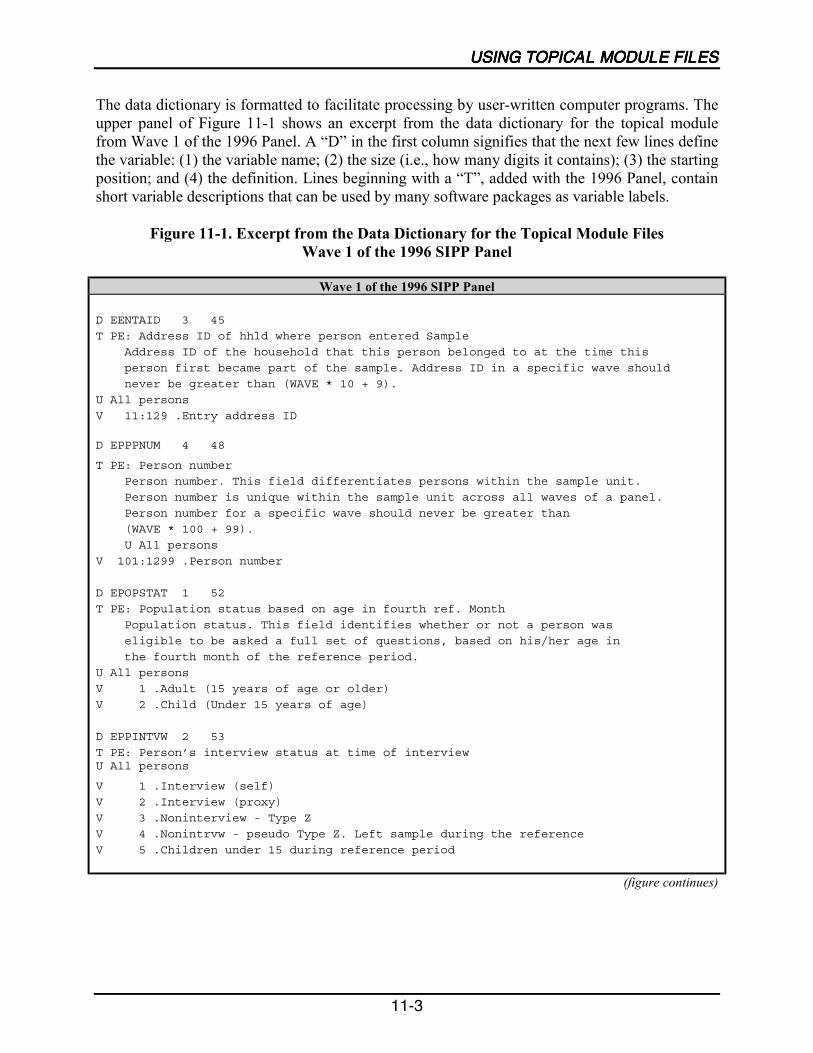
11 Using Topical Module Files.................................................................................11-1
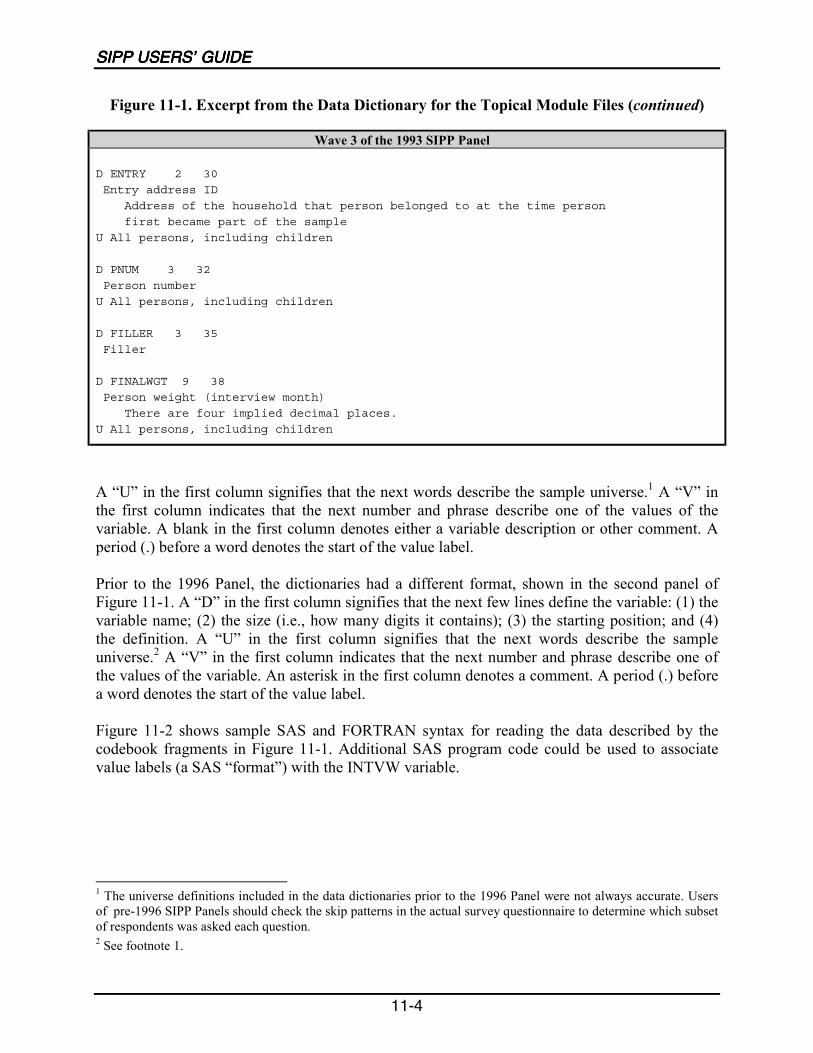
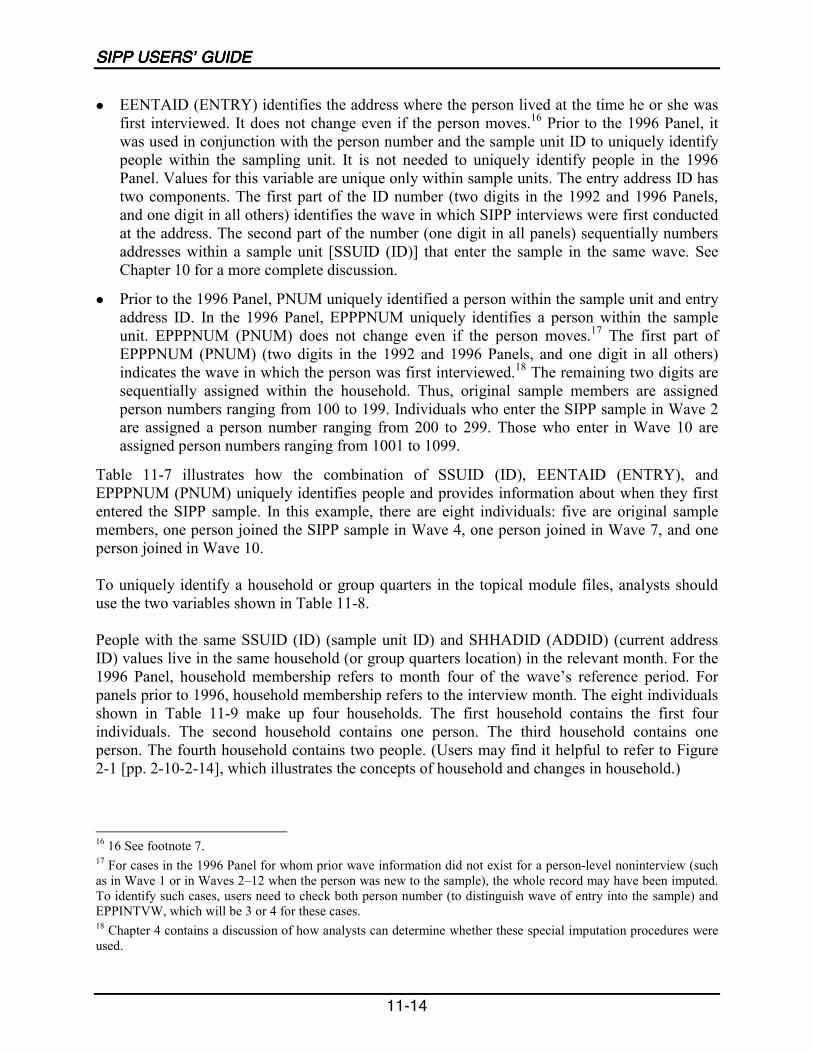
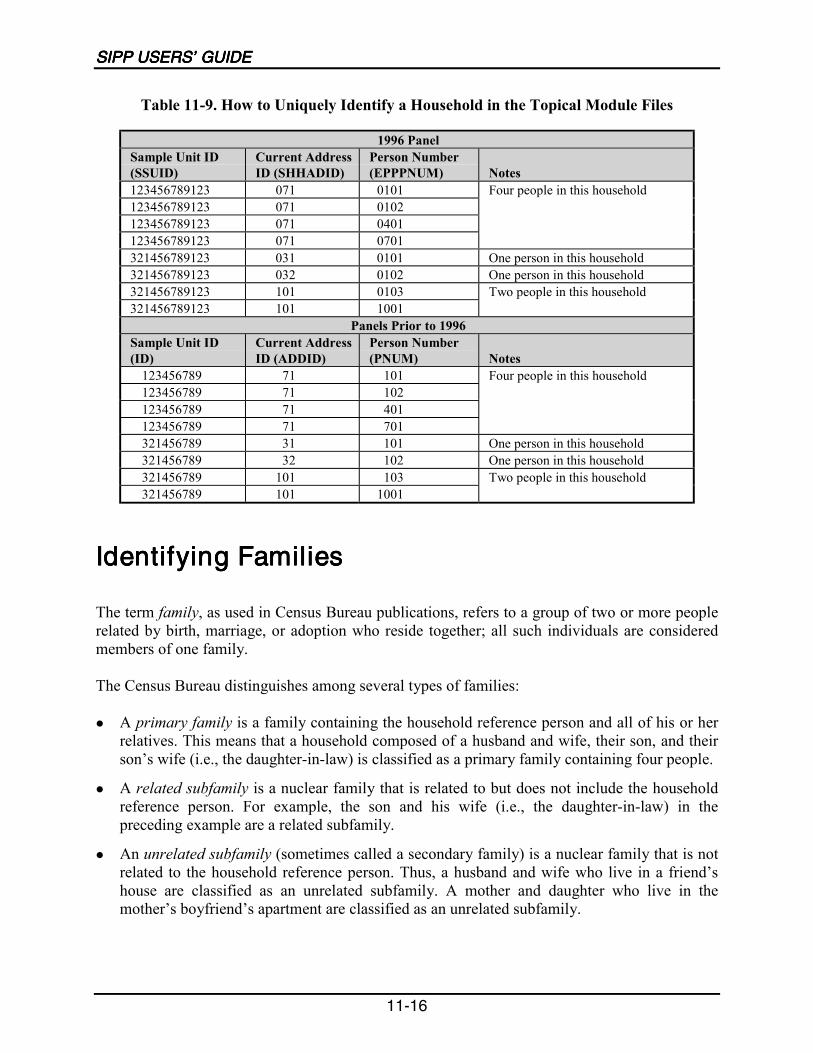
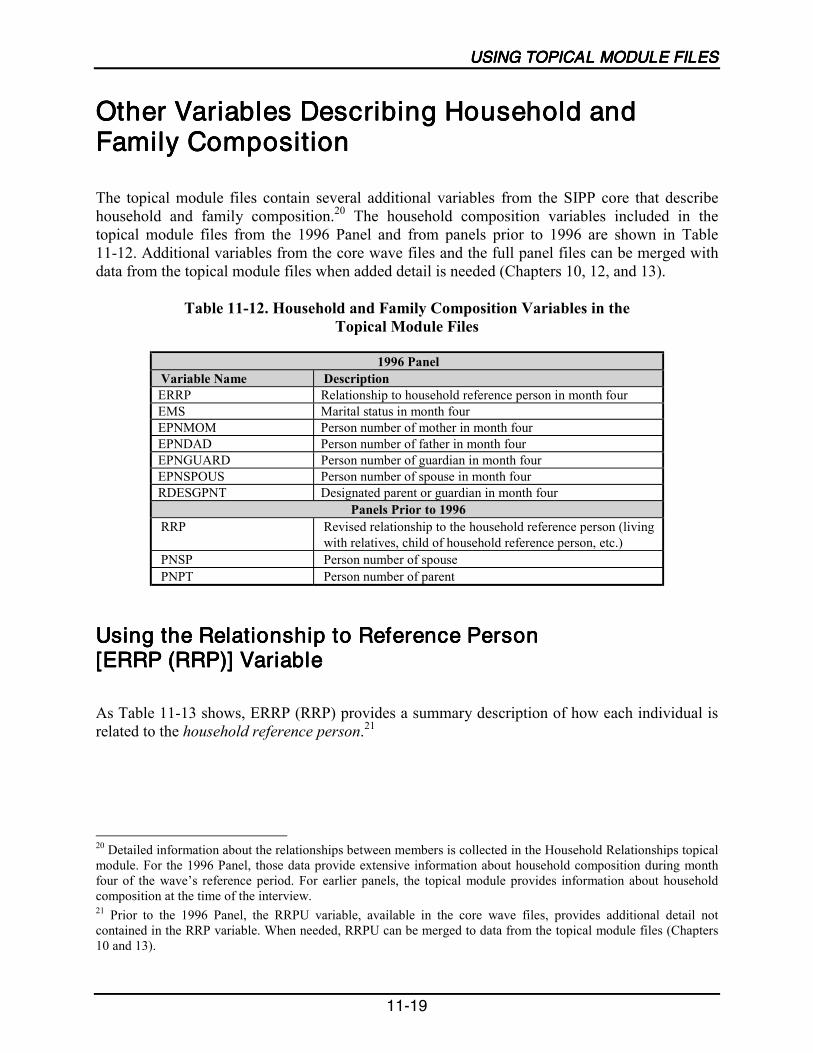
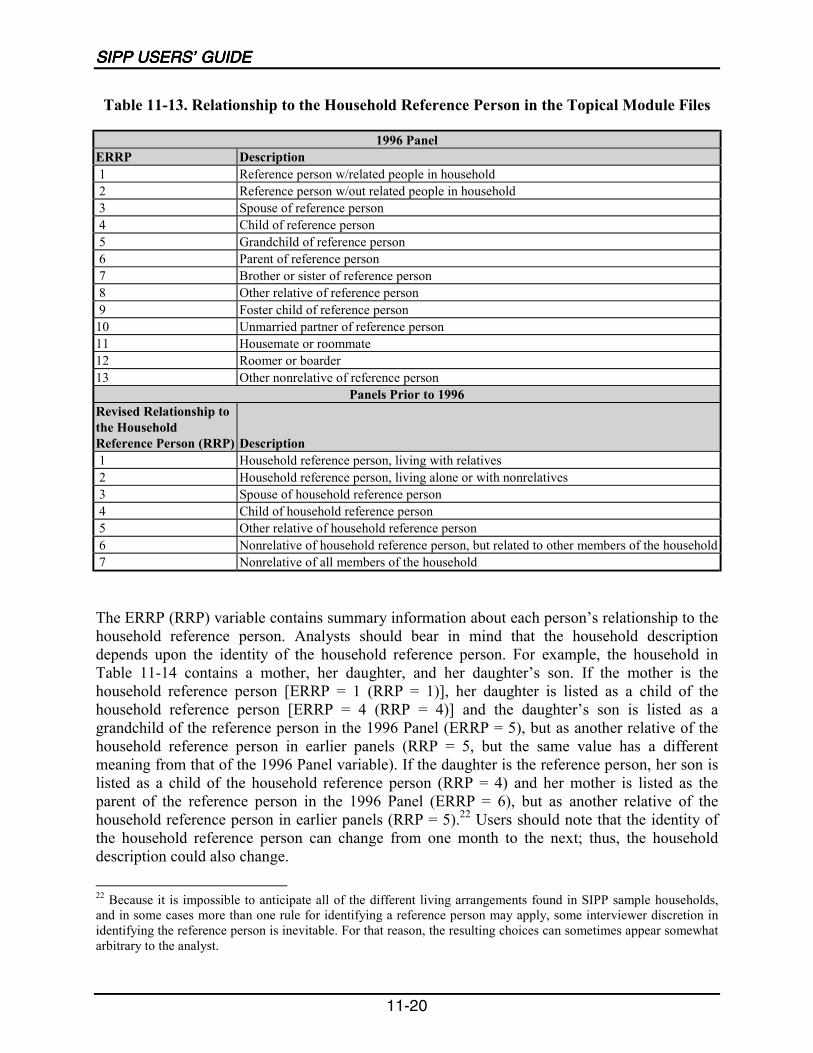
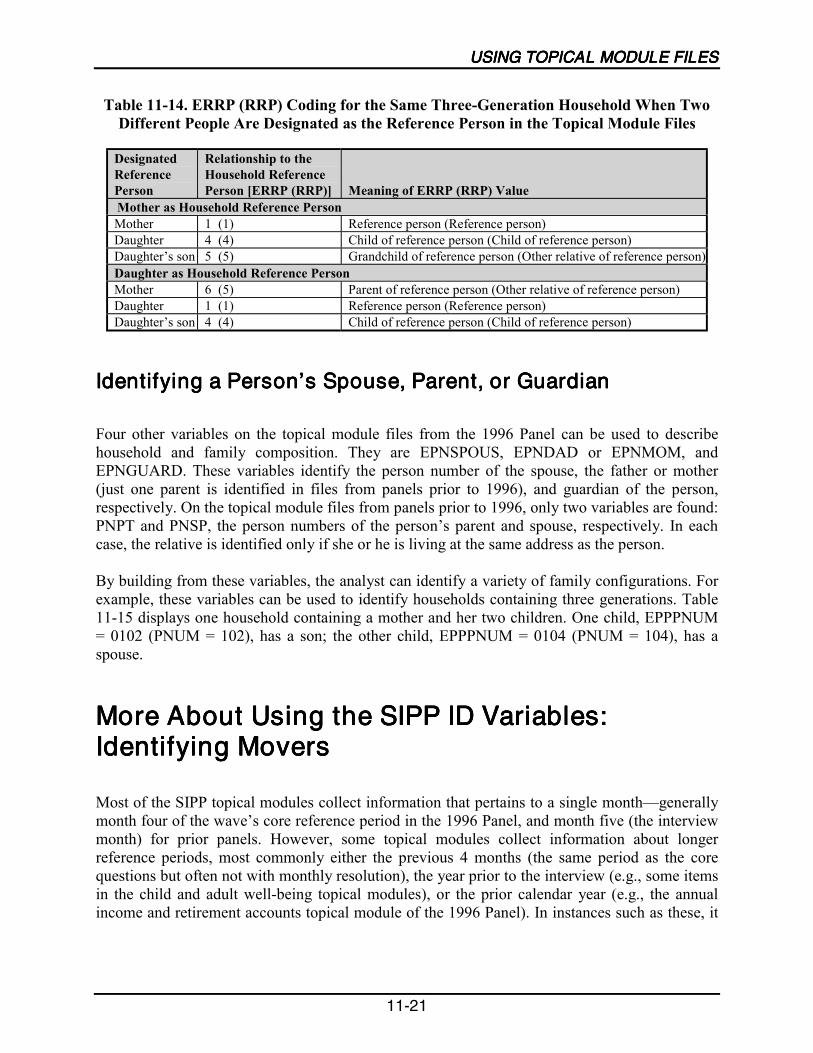
Using the Technical Documentation of the Topical Module Files ..................11-2Relationship of the Topical Module Data Files to the Survey Instrument ......11-6Structure of the Topical Module Files .............................................................11-7Reference Periods and Samples .......................................................................11-8Using a Person’s Monthly Interview Status Variables ....................................11-9Comparison of Variables in the Topical Module and Core Wave Files ........11-11Identifying People..........................................................................................11-13Identifying Families .......................................................................................11-16Other Variables Describing Household and Family Composition ................11-19More About Using the SIPP ID Variables: Identifying Movers....................11-21Topcoding ......................................................................................................11-27Using Allocation (Imputation) Flags .............................................................11-28Using Weights................................................................................................11-28Identifying States ...........................................................................................11-29Identifying Metropolitan Areas......................................................................11-29
12 Using the 1990–1993 Full Panel Longitudinal Research Files .........................12-1
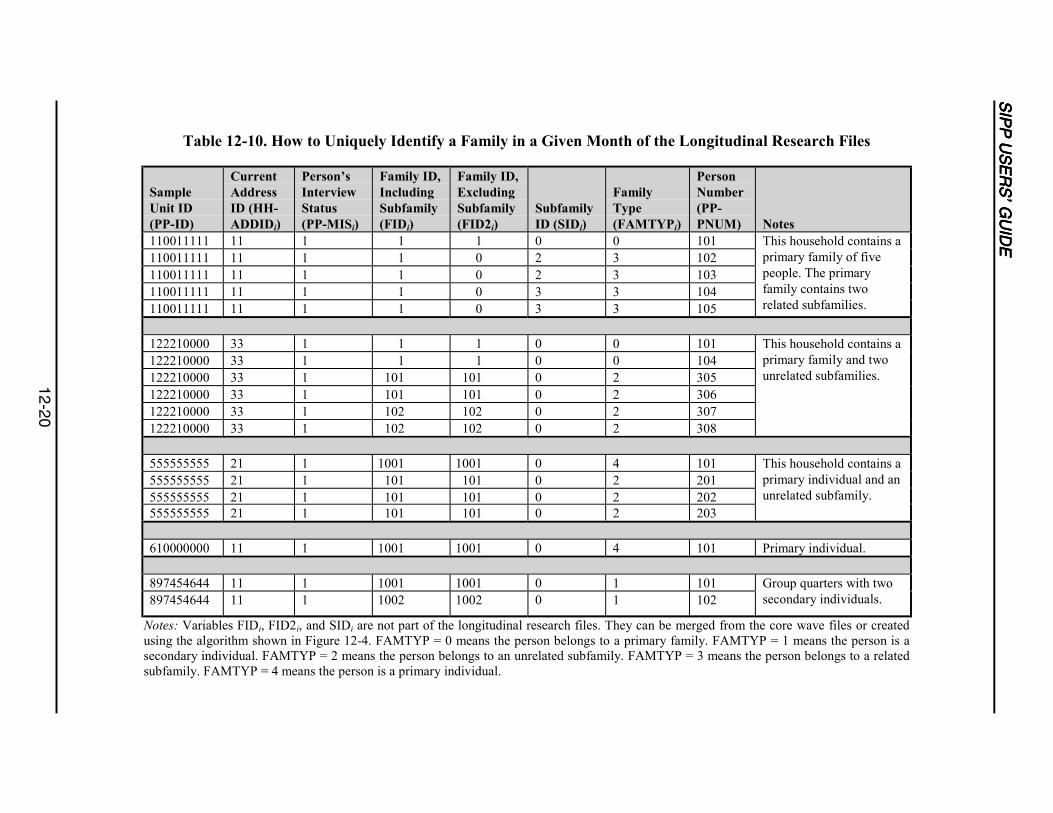
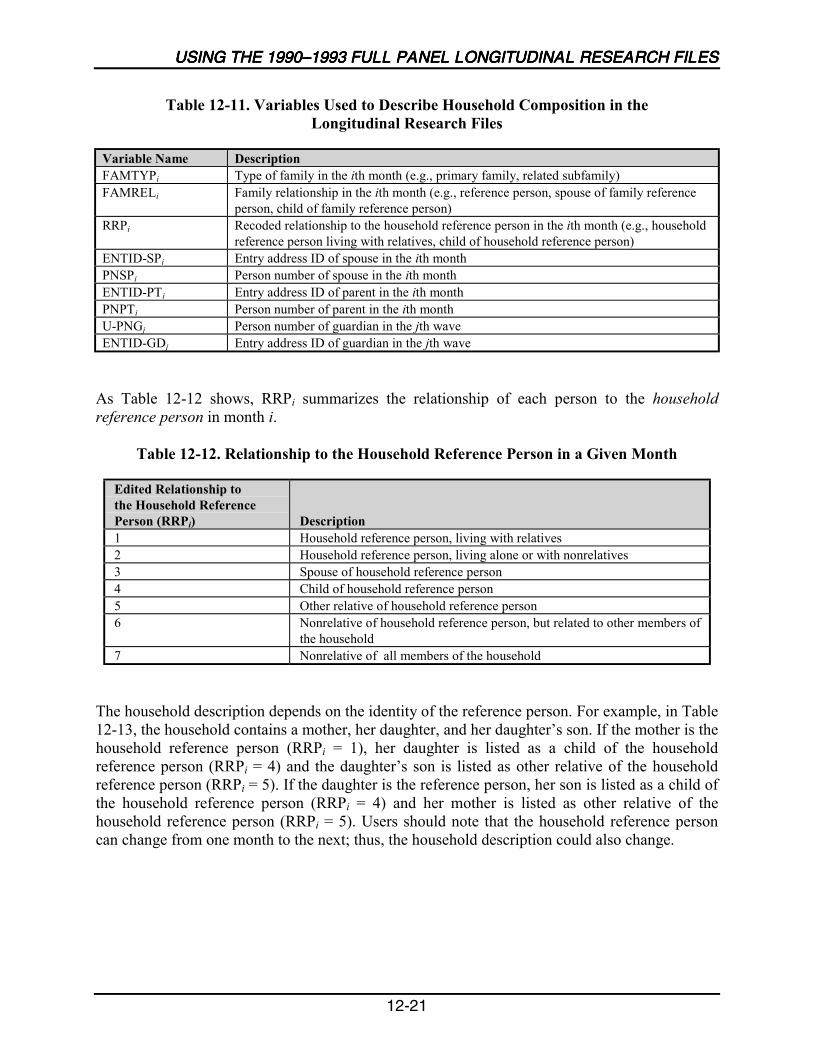
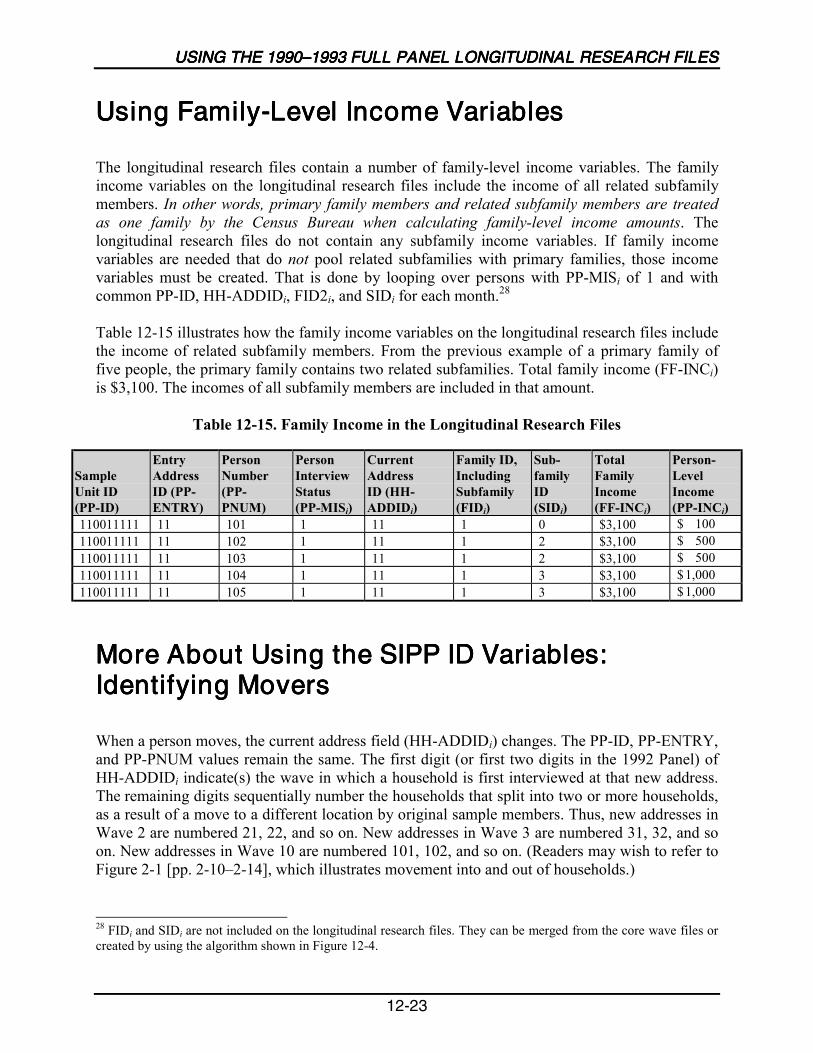
Using the Technical Documentation of the 1990–1993Longitudinal Research Files ............................................................................12-2Relationship of the Longitudinal Research Data Files to theSIPP Survey Instrument...................................................................................12-5Structure of the Longitudinal Research Files...................................................12-6How to Align Data by Calendar Month...........................................................12-7Using the Monthly Interview Status (PP-MIS) Variables ...............................12-9Identifying Persons ........................................................................................12-13Identifying Households..................................................................................12-15Identifying Families .......................................................................................12-16Variables Describing Household and Family Composition...........................12-19Using Family-Level Income Variables ..........................................................12-23More About Using the SIPP ID Variables: Identifying Movers....................12-23Identifying Program Units .............................................................................12-28Using the Unearned Income Variables ..........................................................12-30
SIPP USERS’ GUIDE
iv
Chapter Page
12 Using the 1990–1993 Full Panel Longitudinal Research Files (Cont.)
Income Topcoding .........................................................................................12-31Using Allocation (Imputation) Flags .............................................................12-37Using Weights................................................................................................12-37Identifying States ...........................................................................................12-38Identifying Metropolitan Areas......................................................................12-38
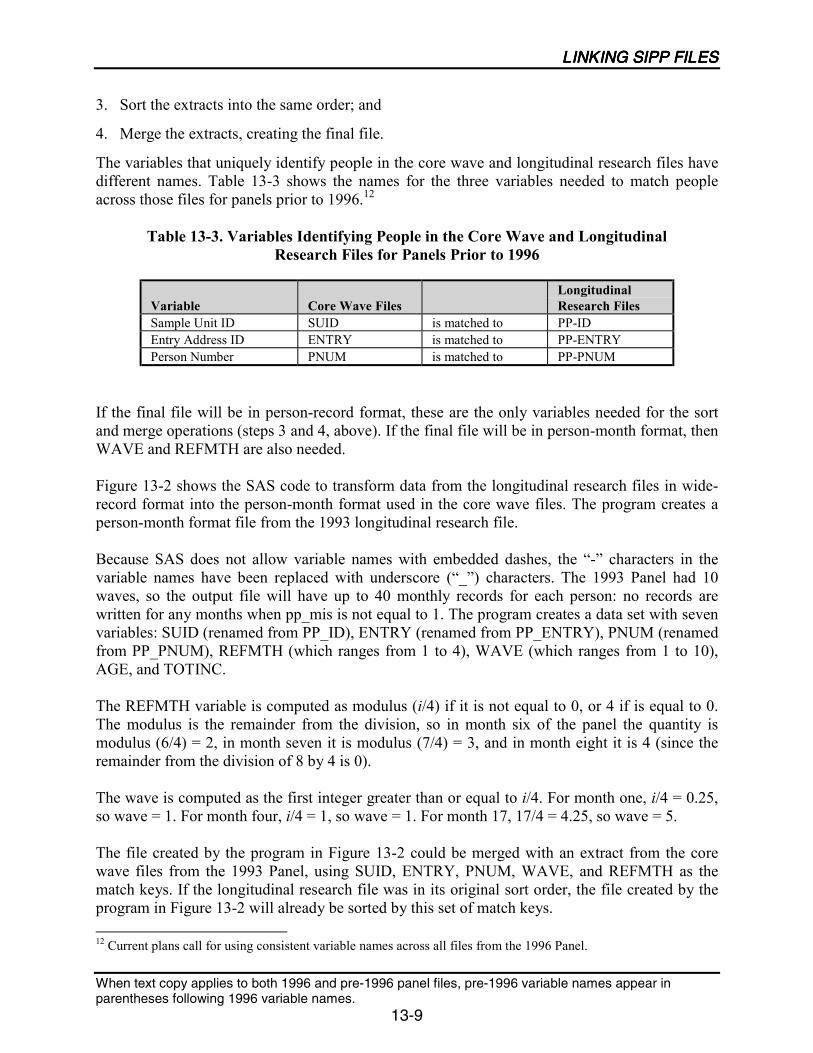
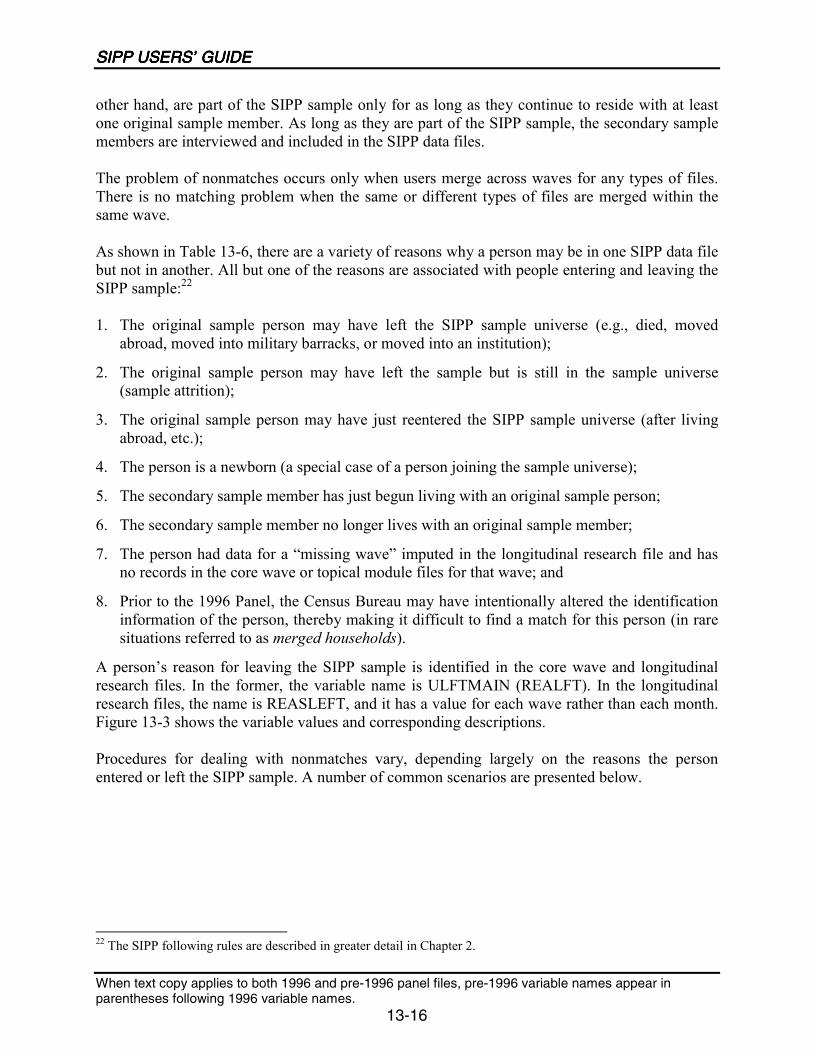
13 Linking Core Wave, Topical Module, and Longitudinal Research Files .......13-1
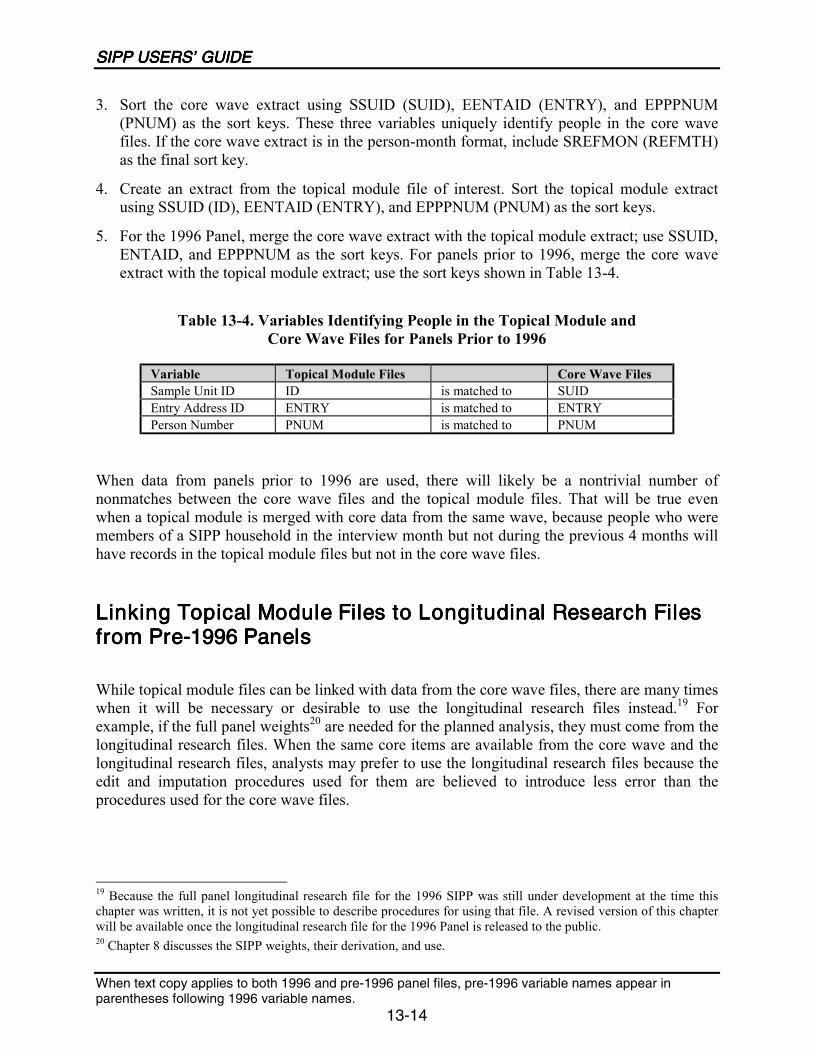
Procedures for Linking Files............................................................................13-2Nonmatches When Merging Files .................................................................13-15
Appendix
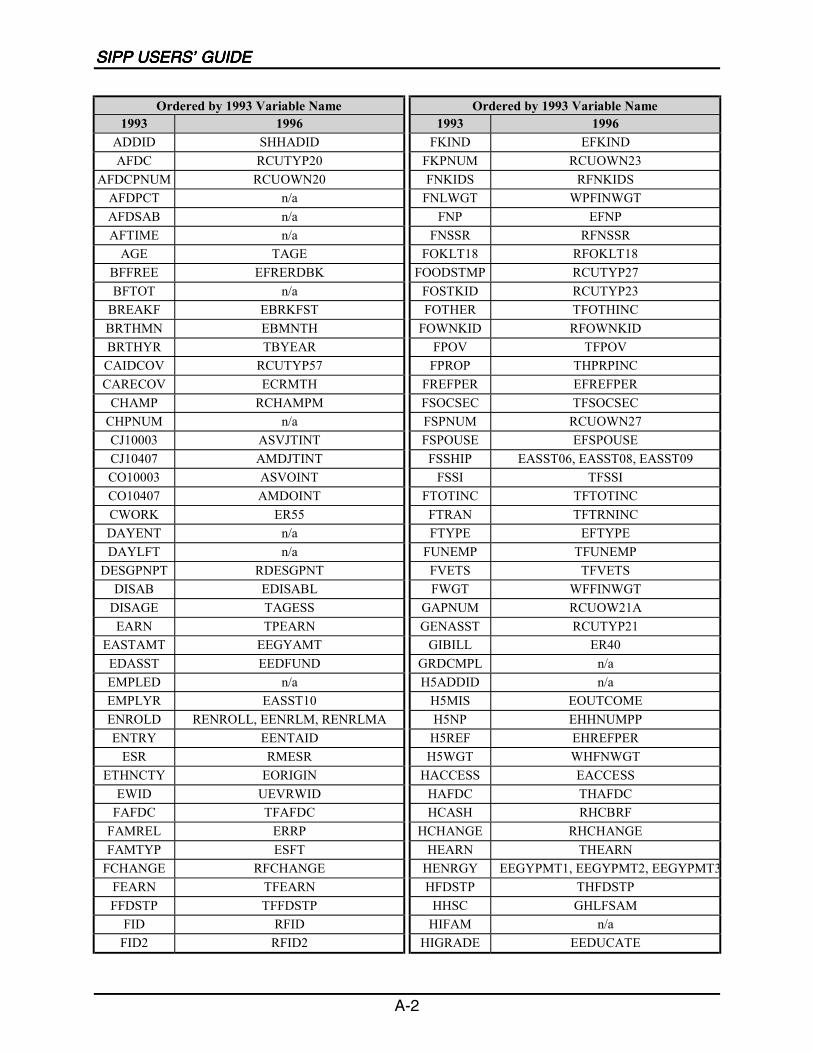
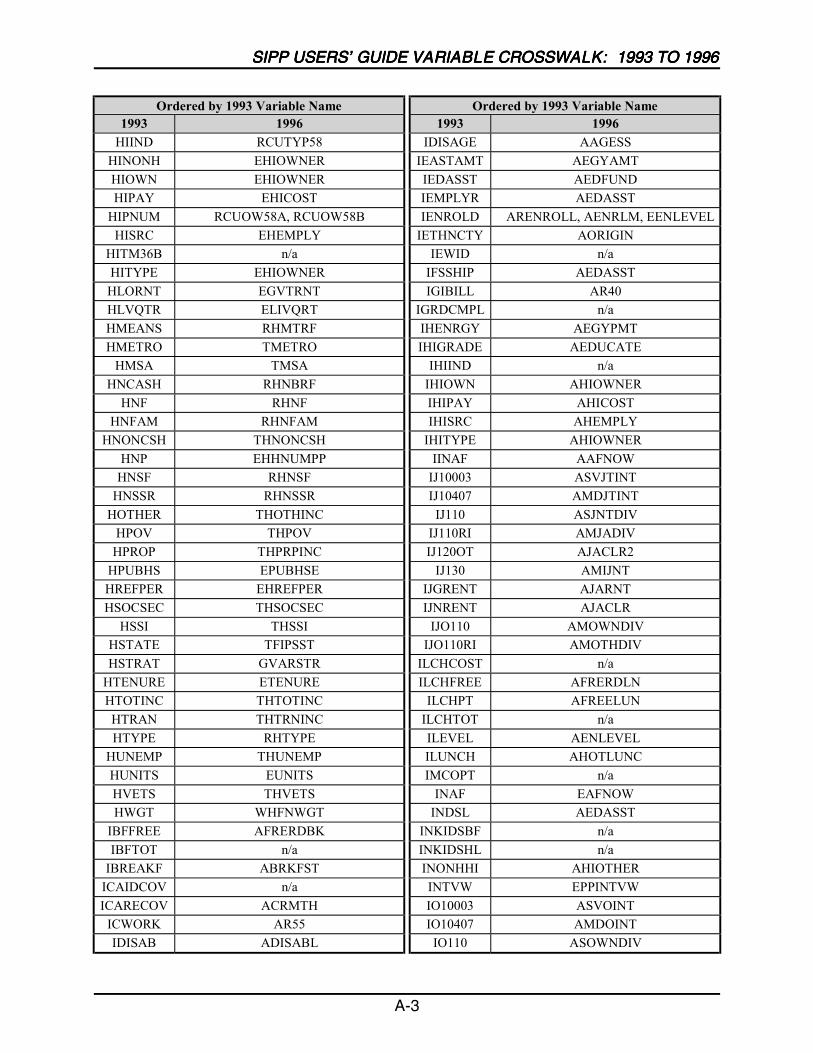
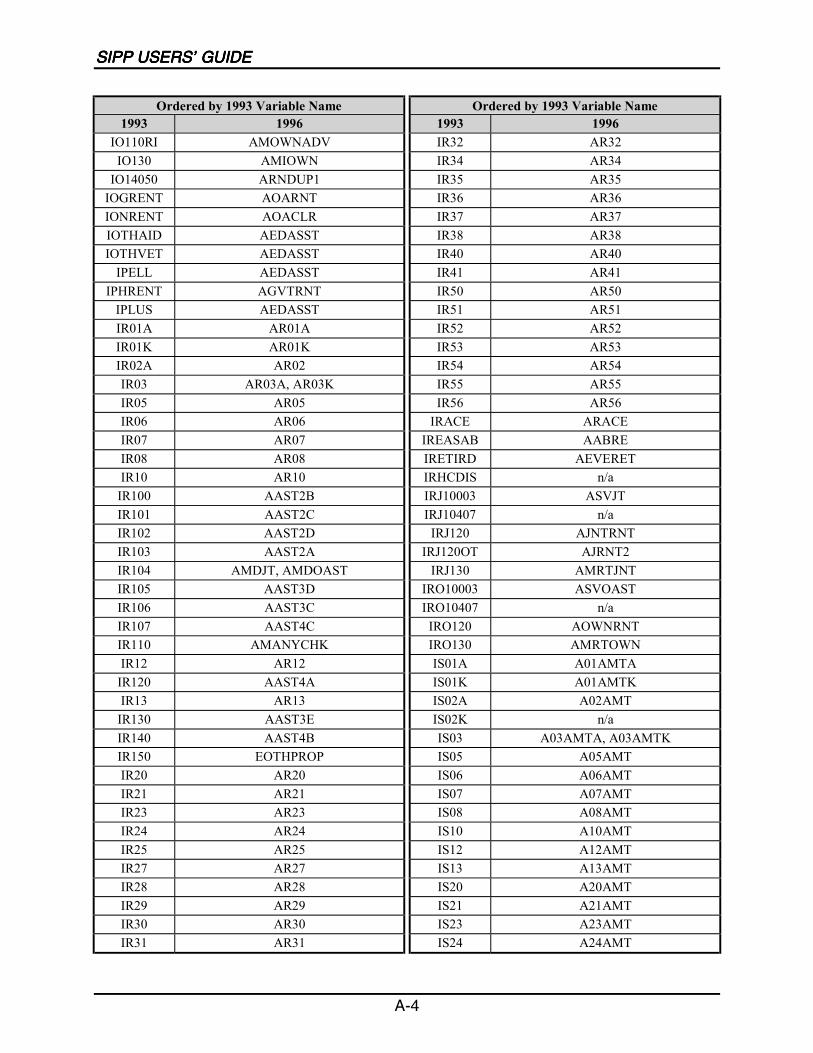
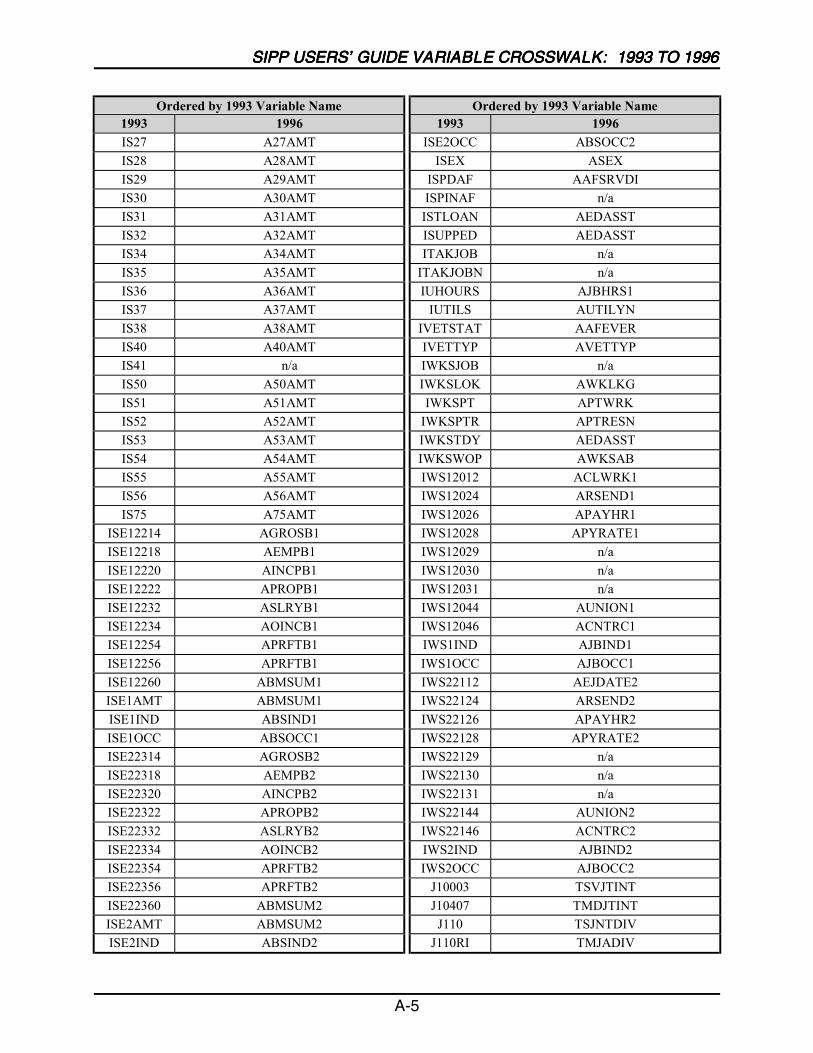
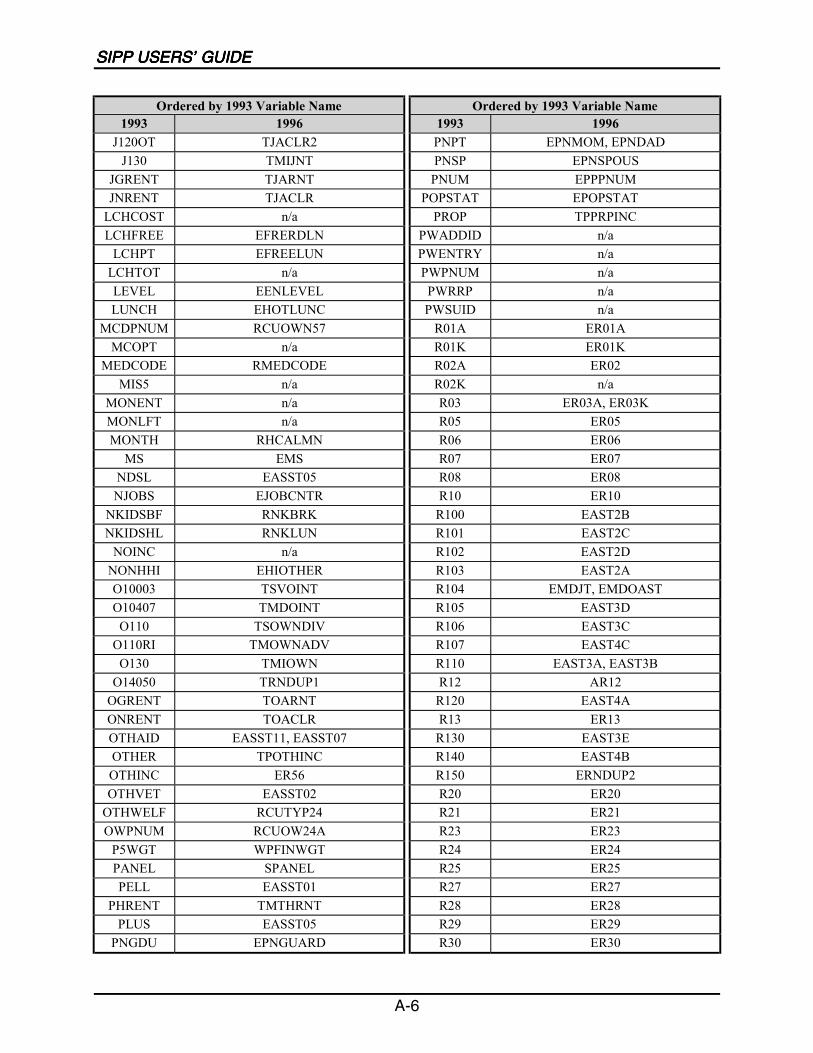
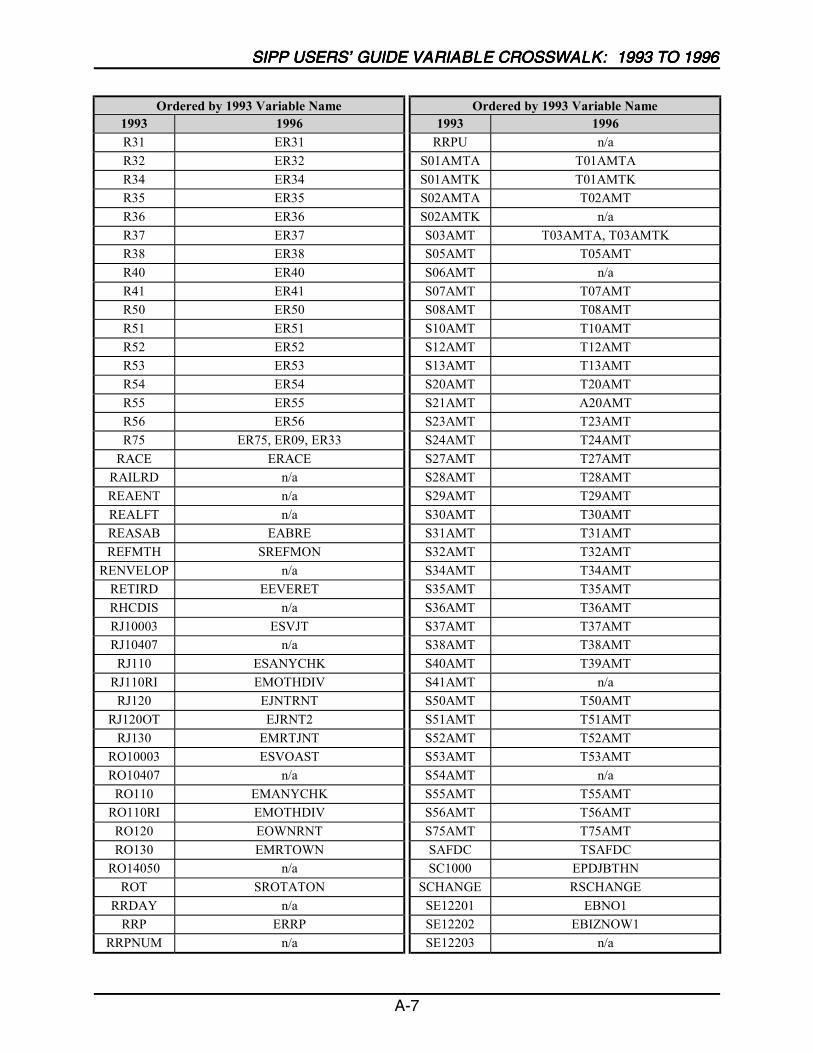
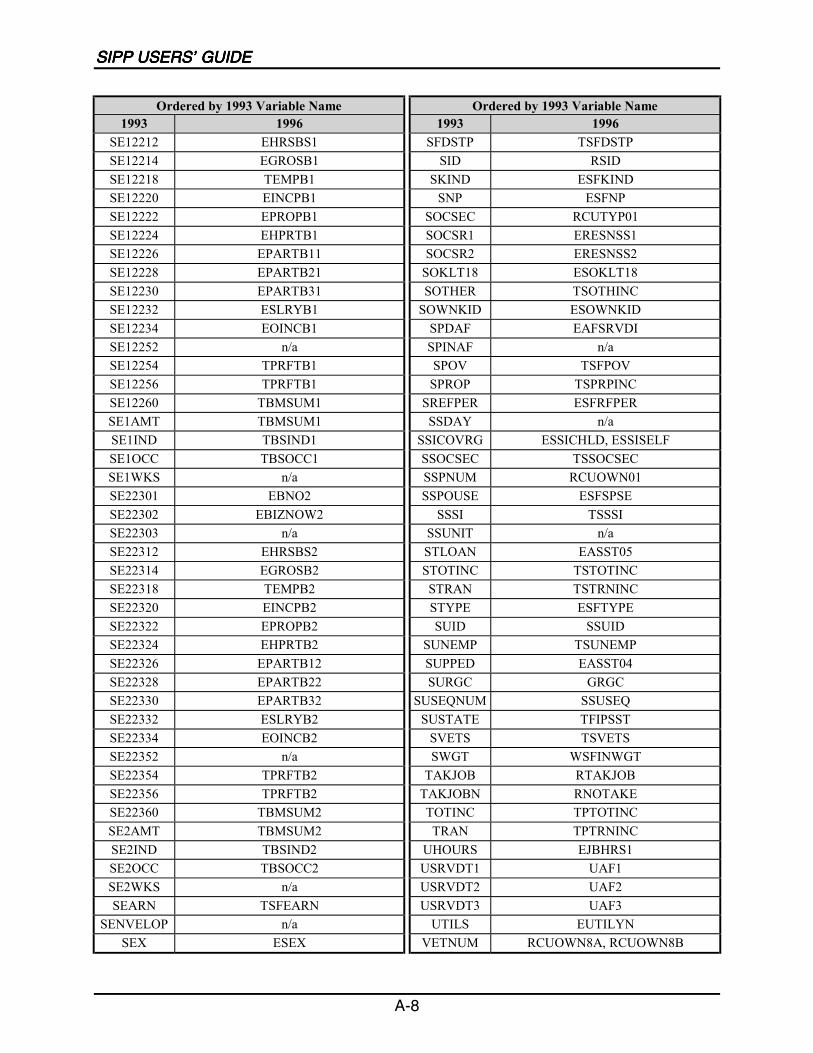
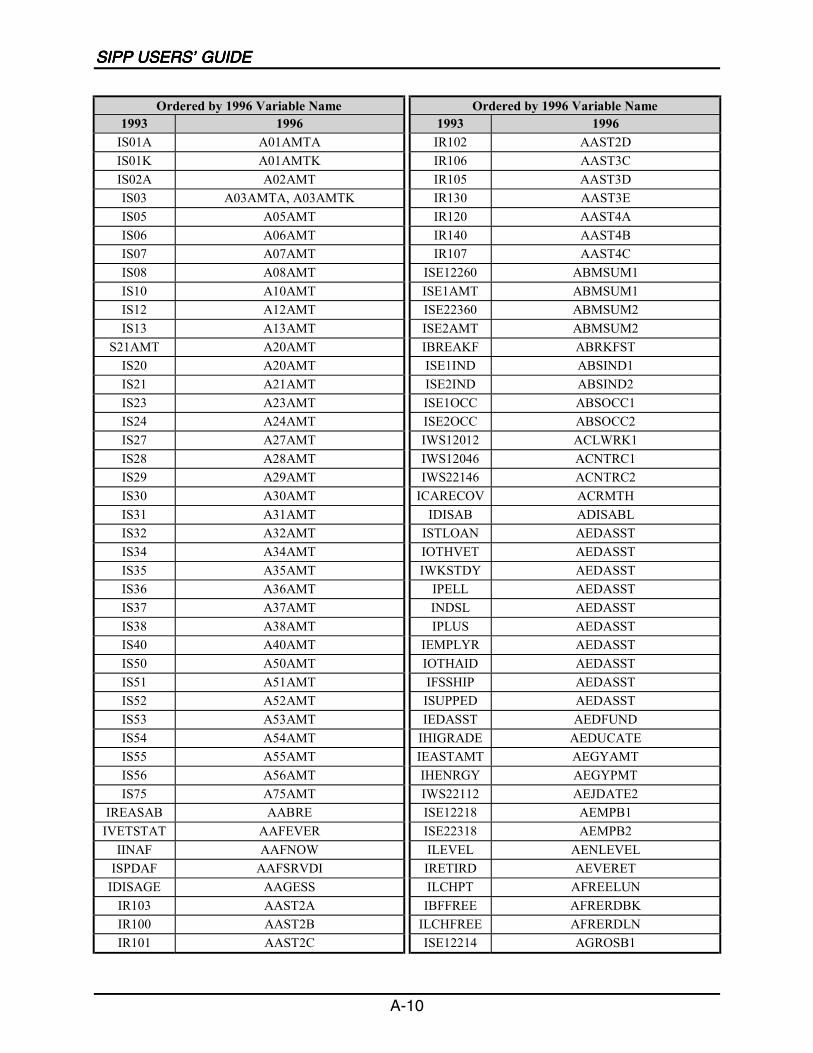
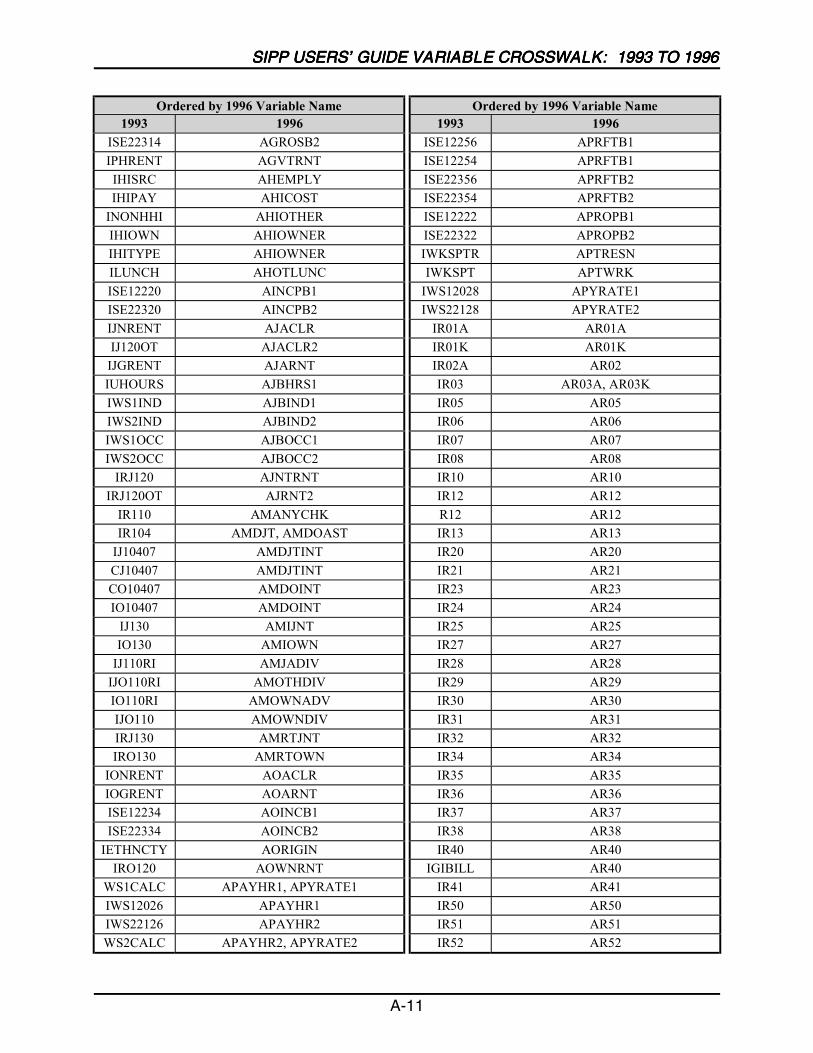
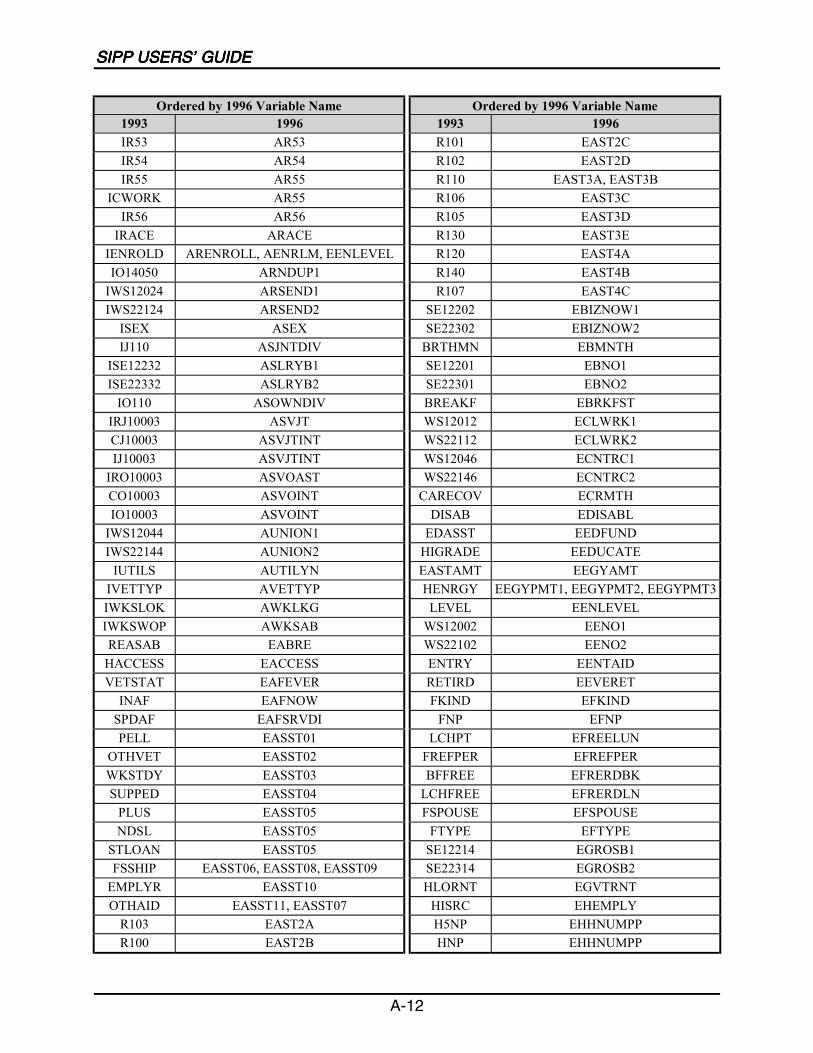
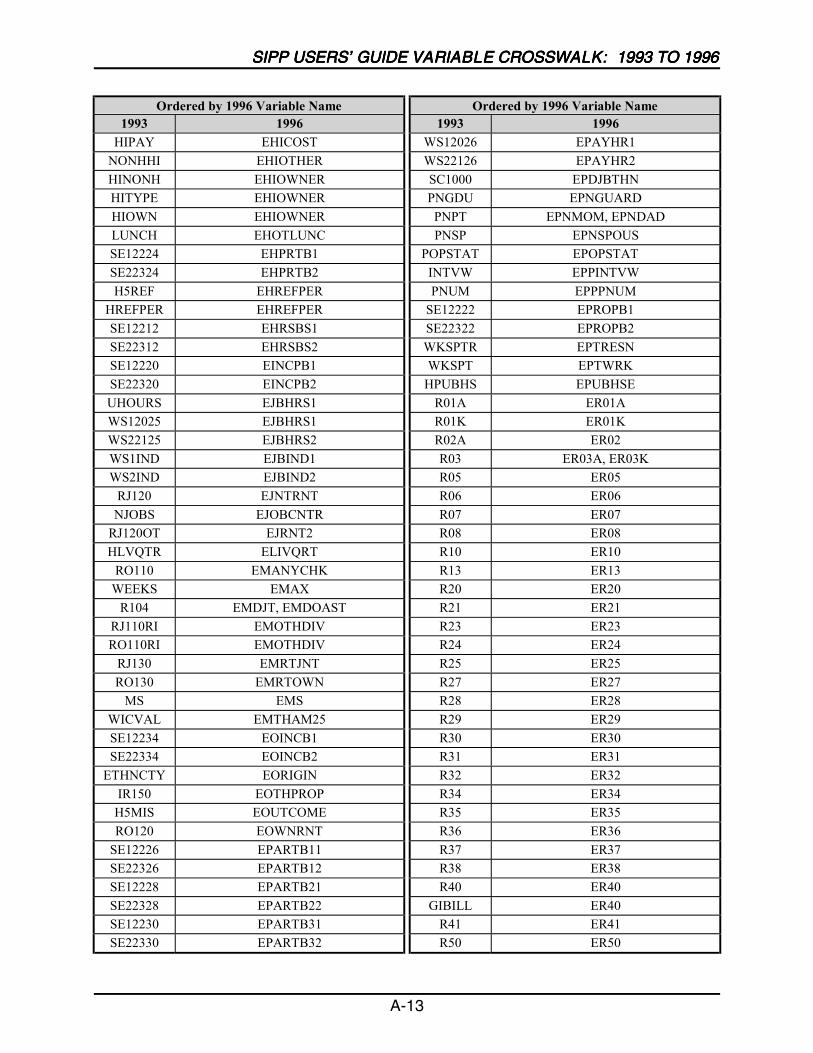
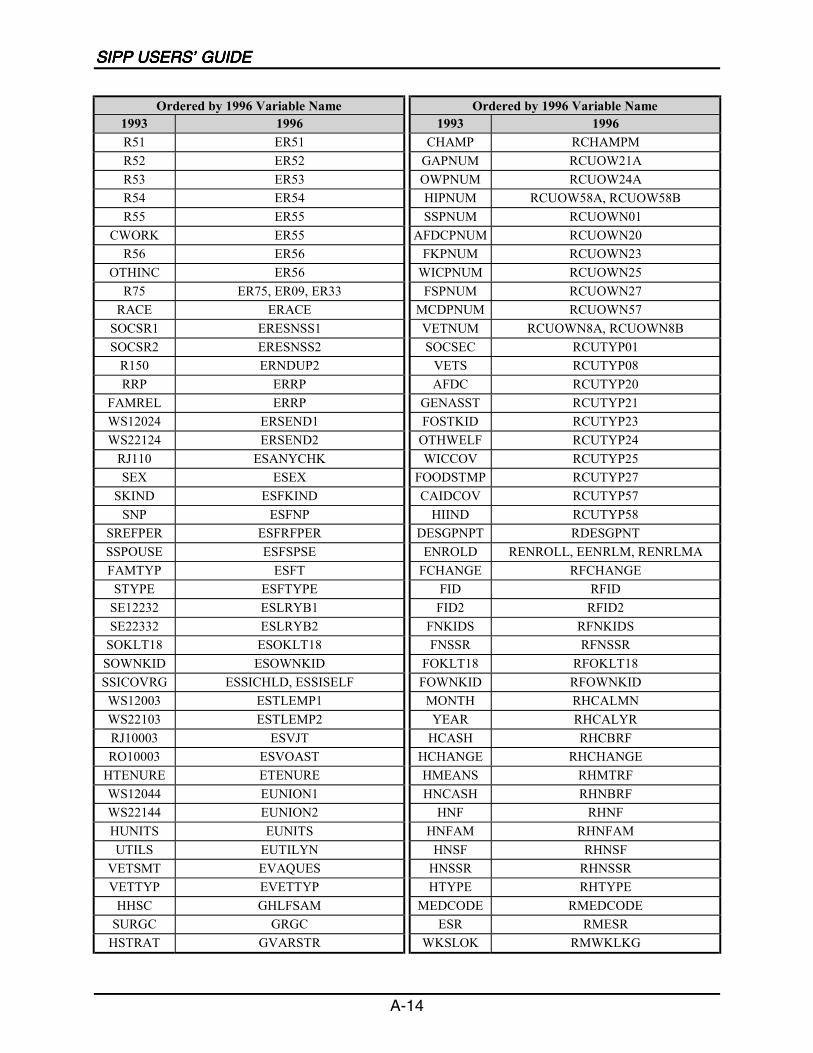
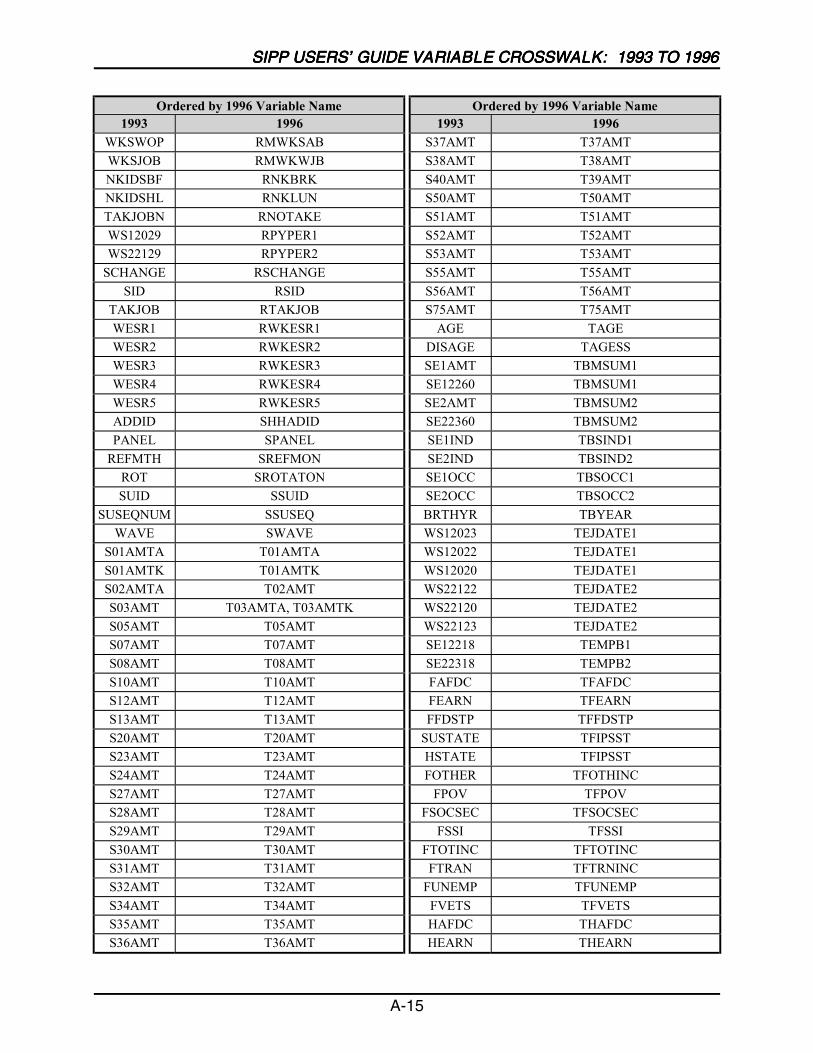
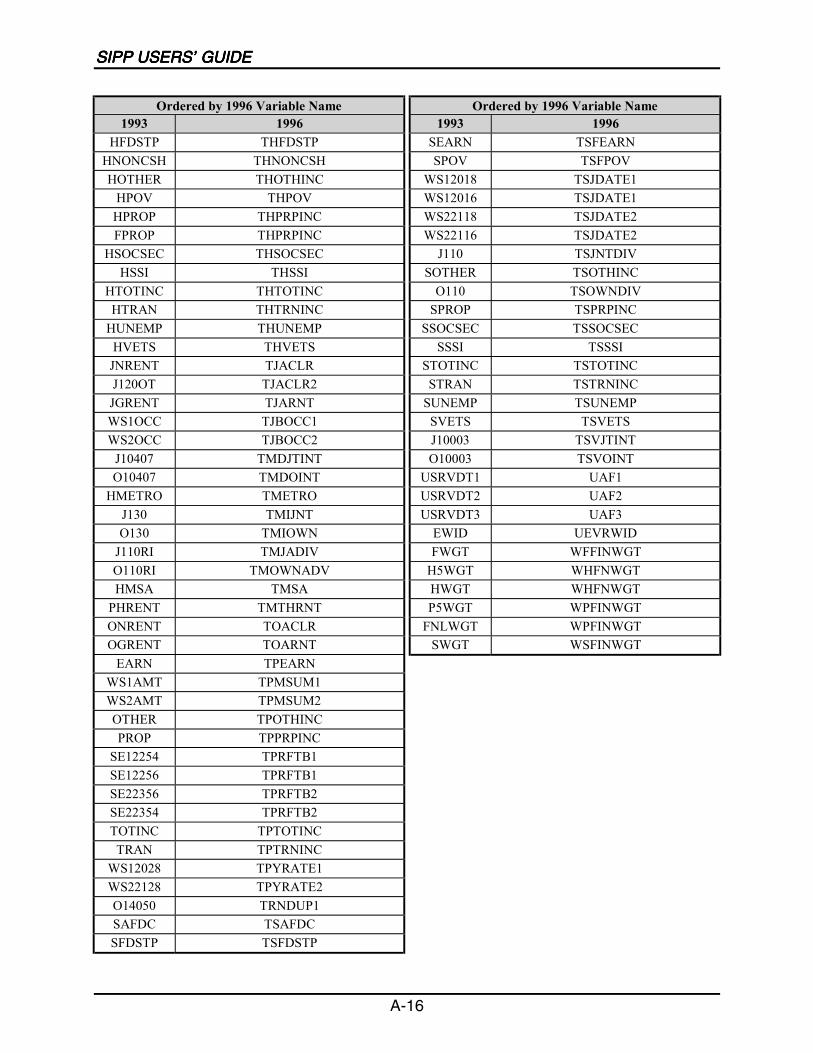
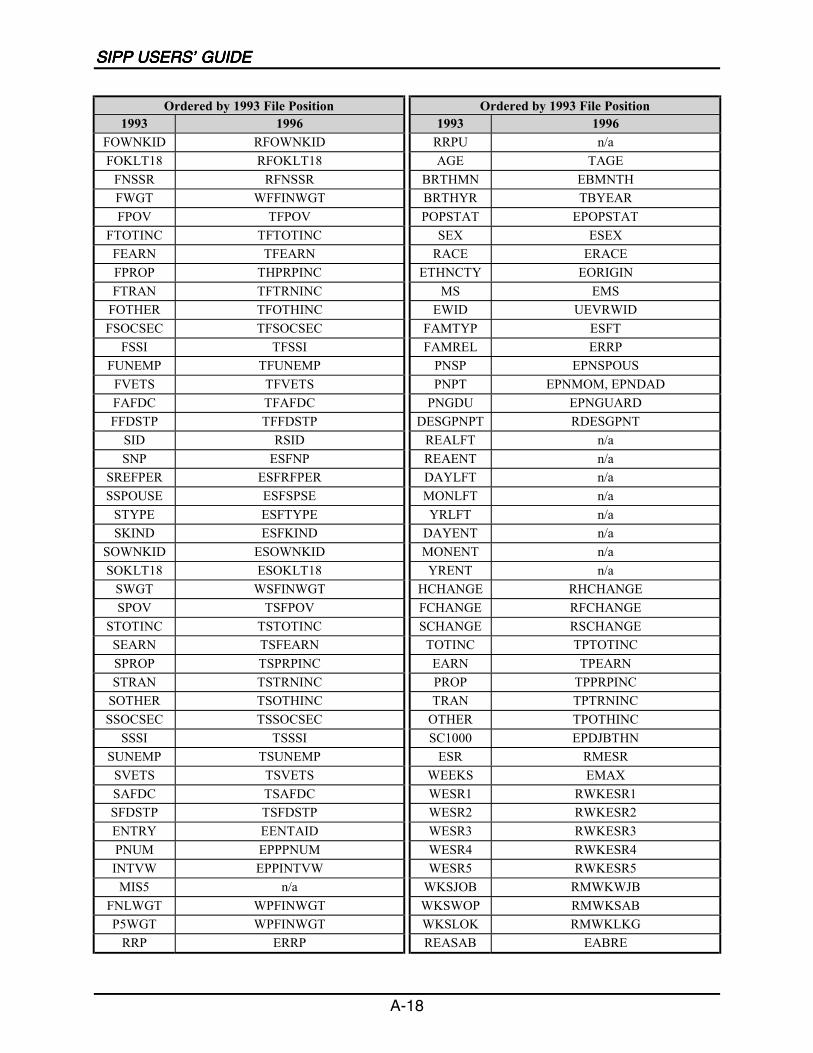
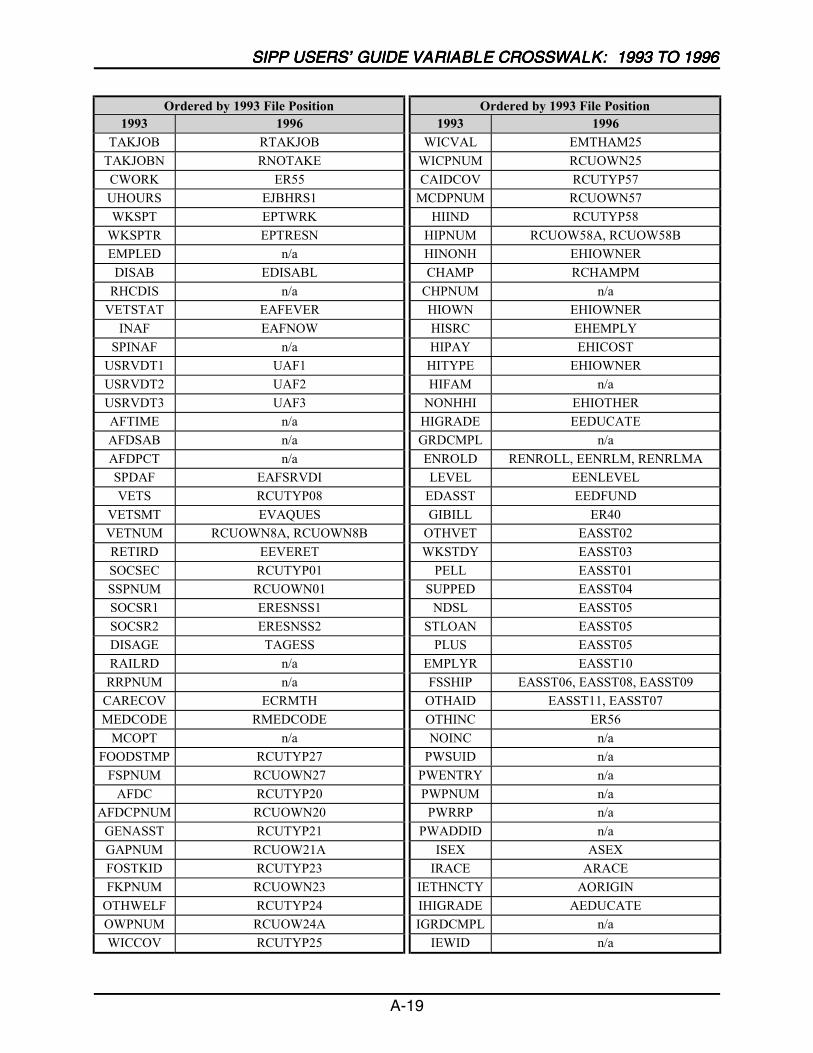
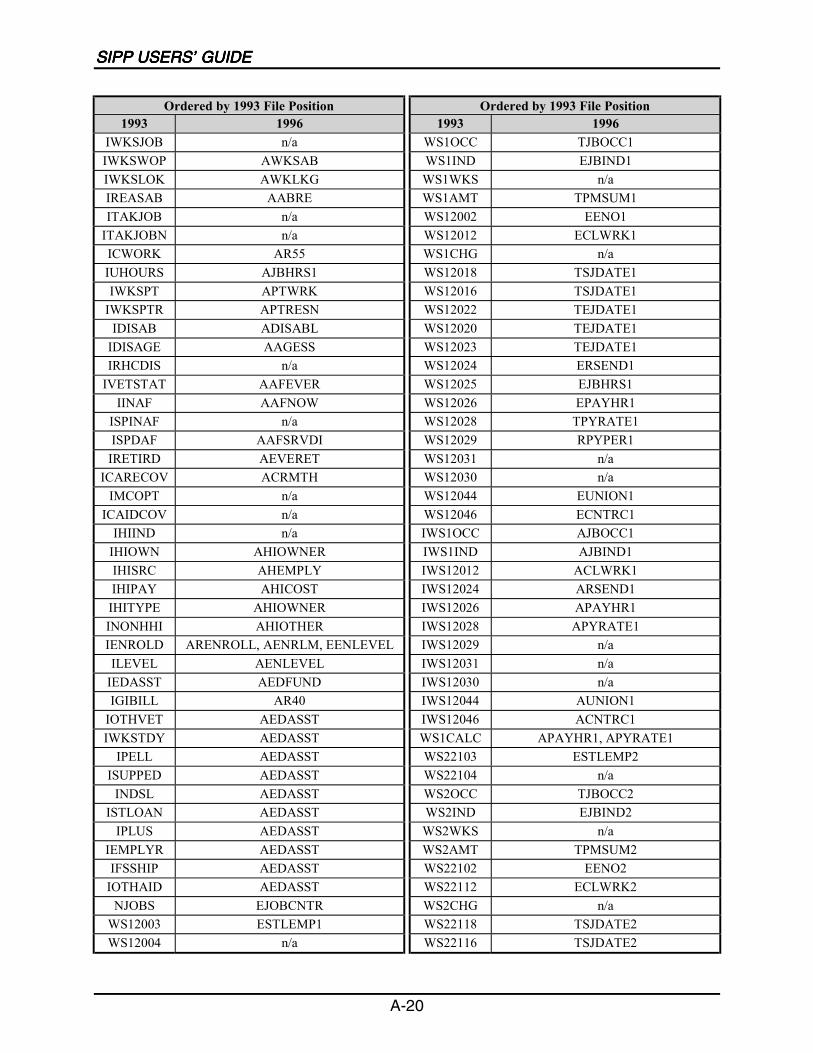
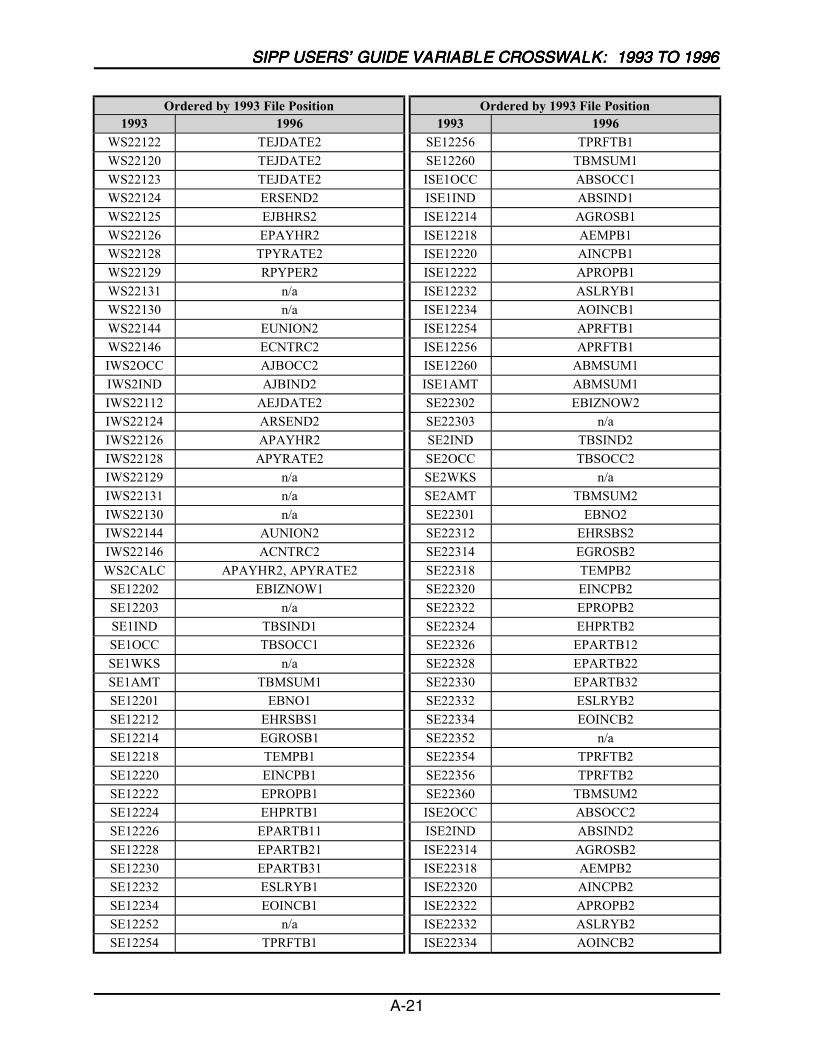
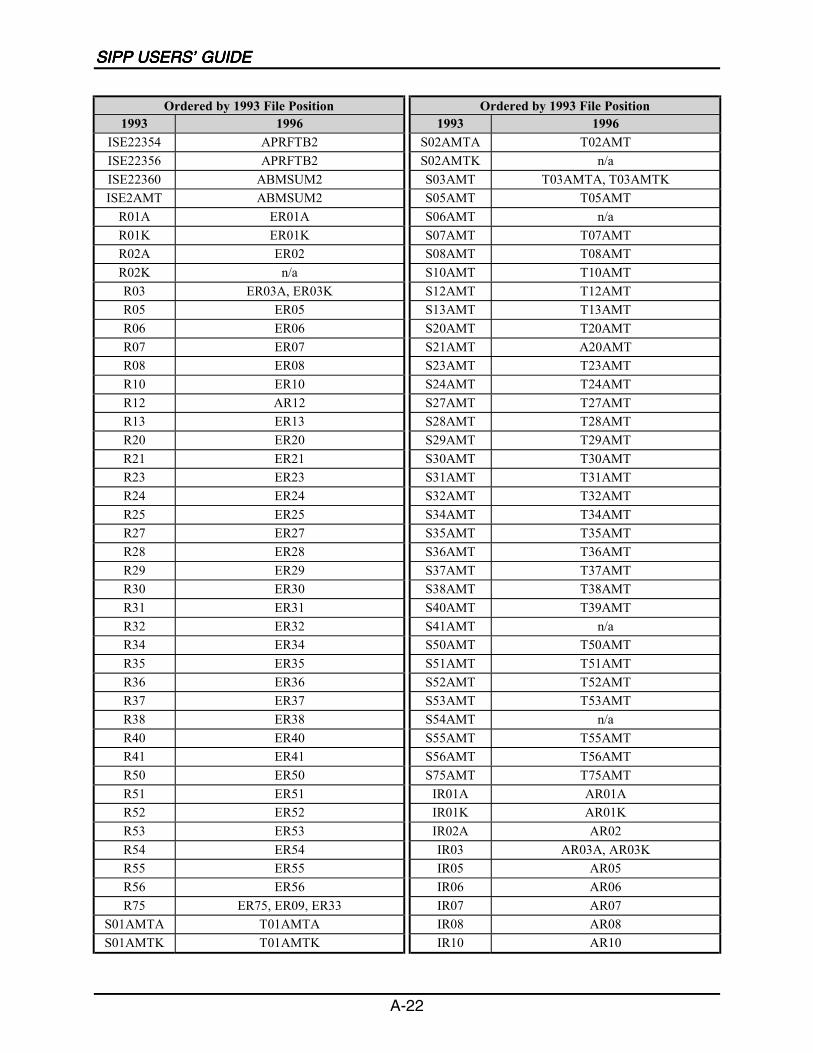
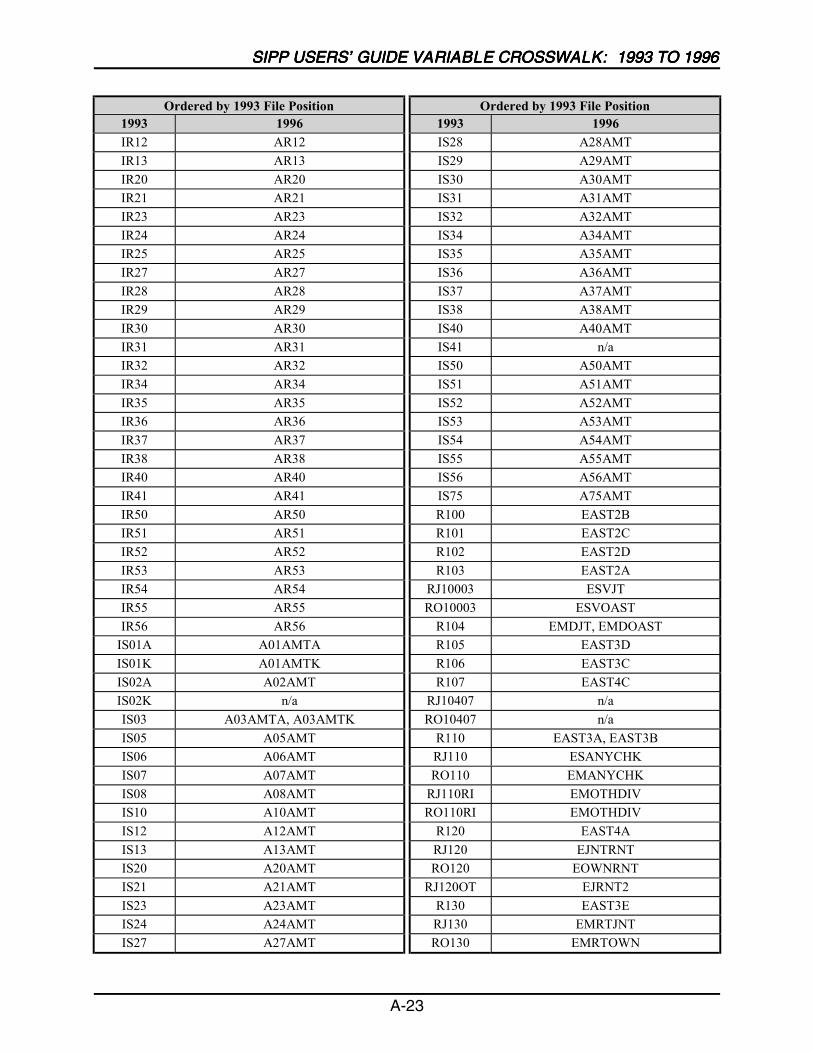
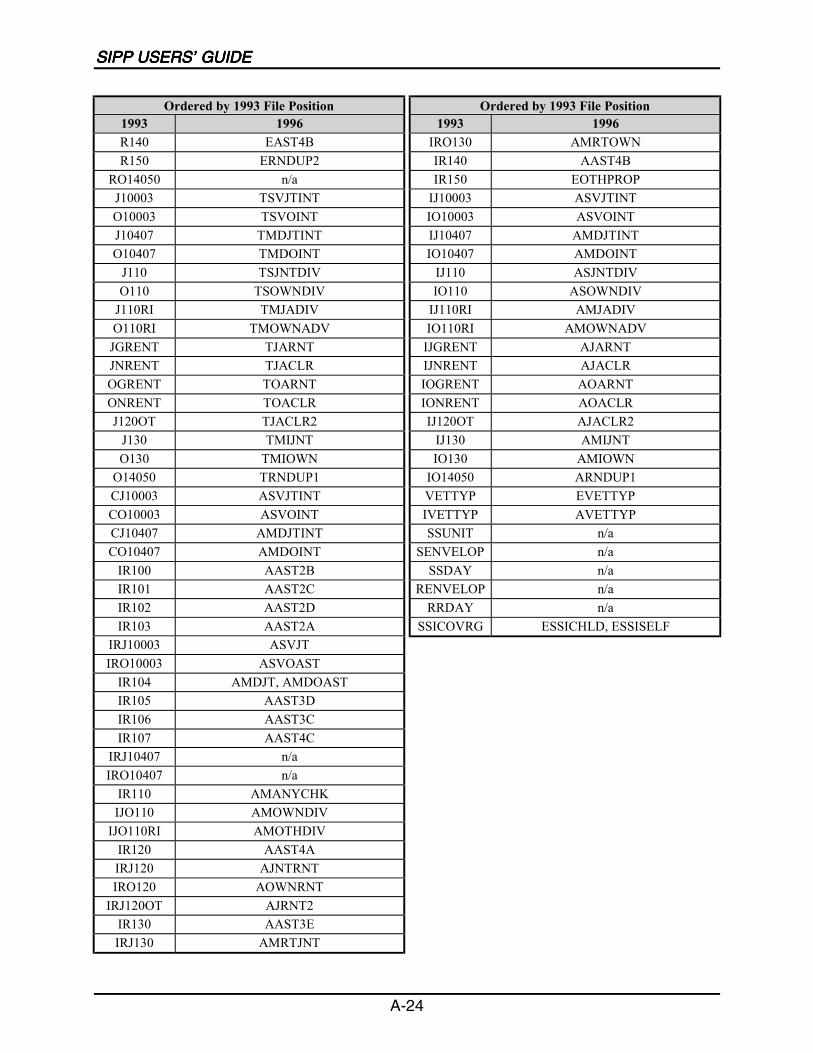
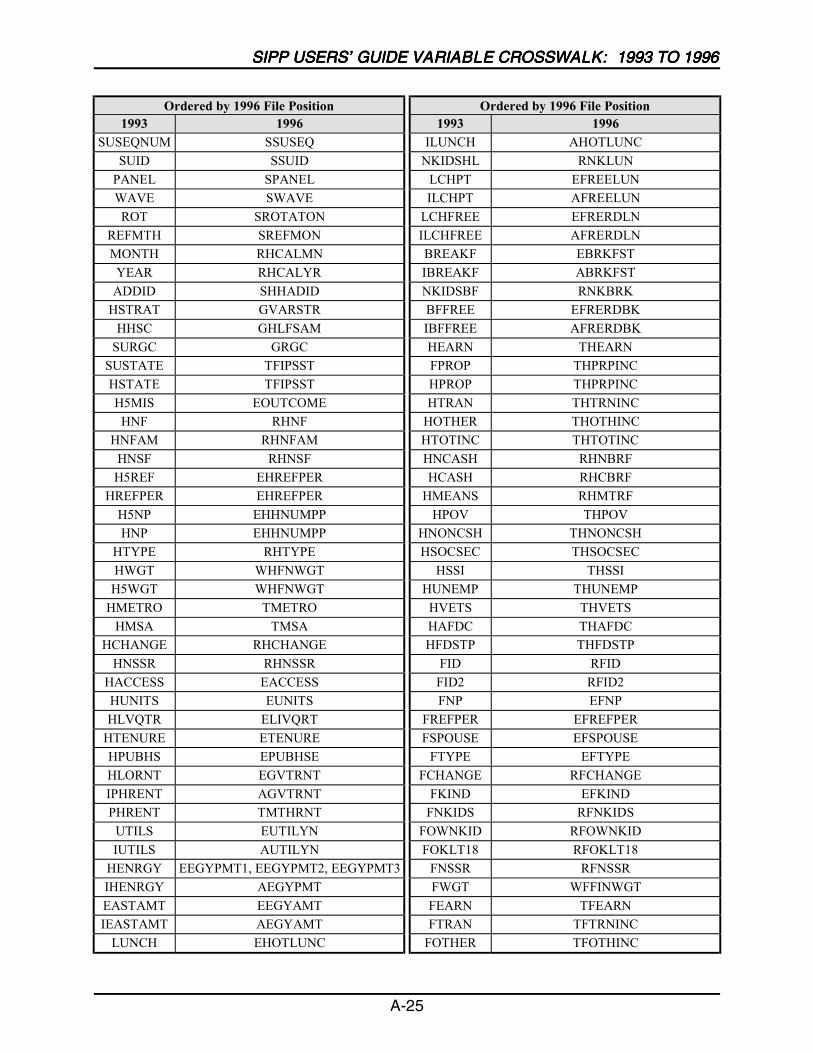
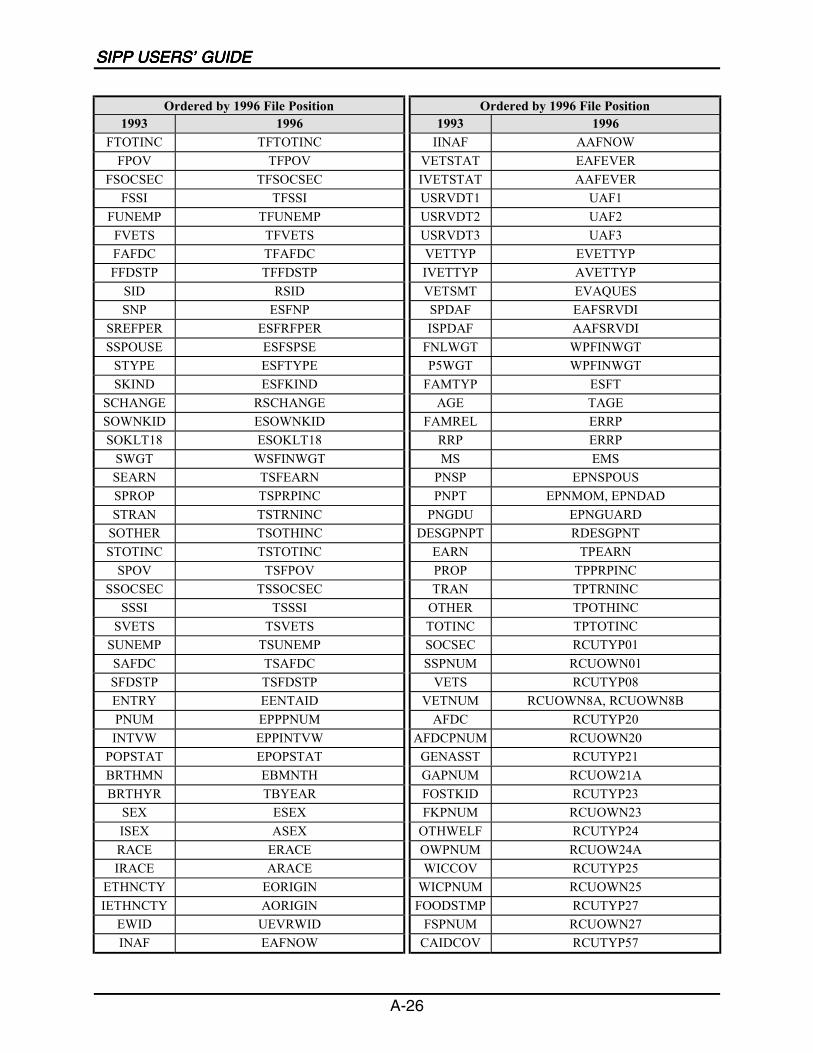
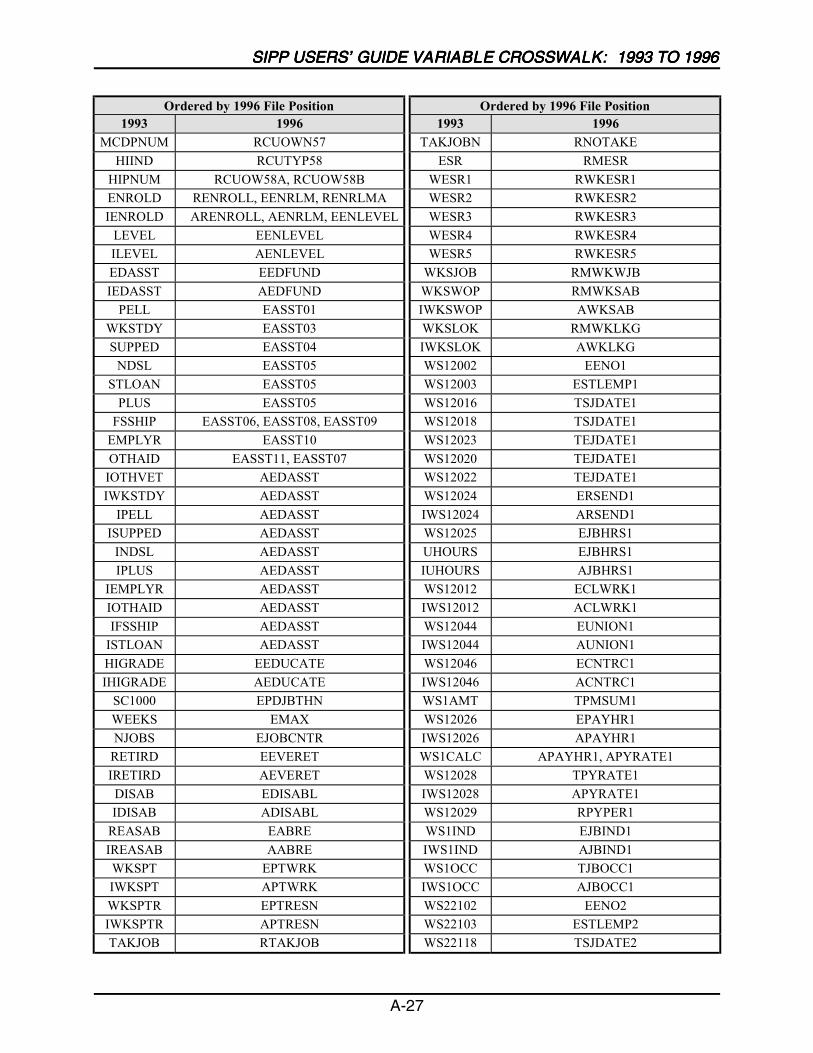
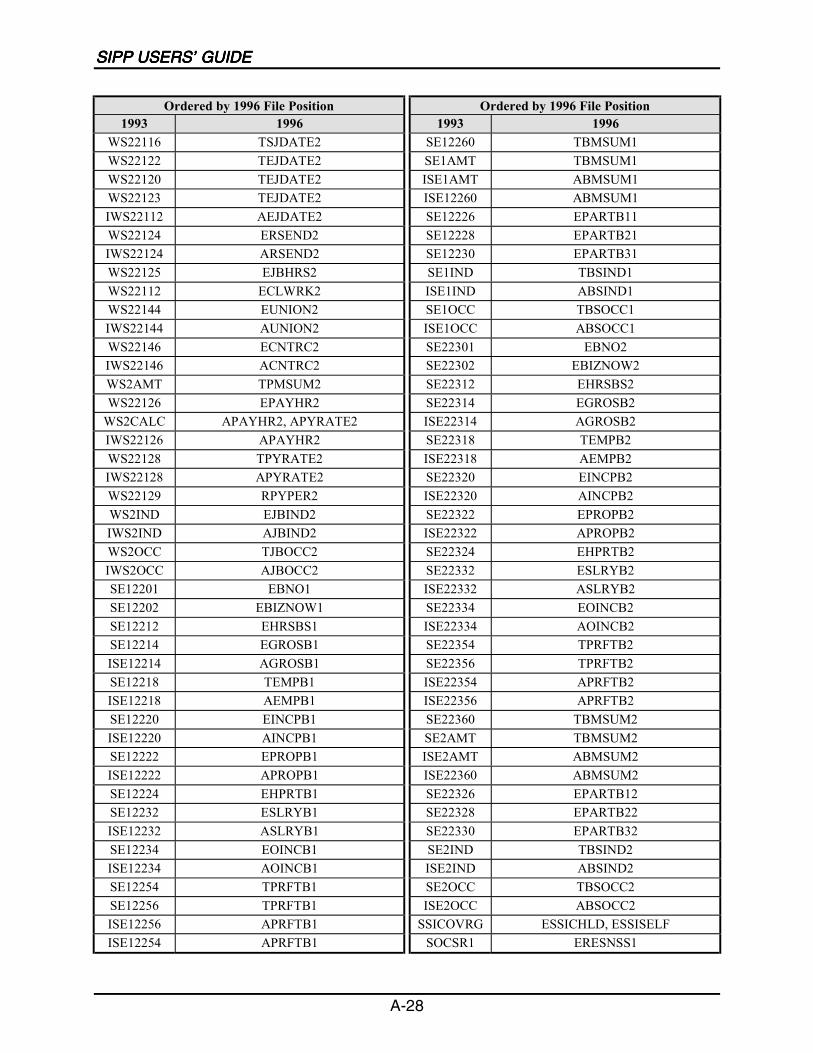
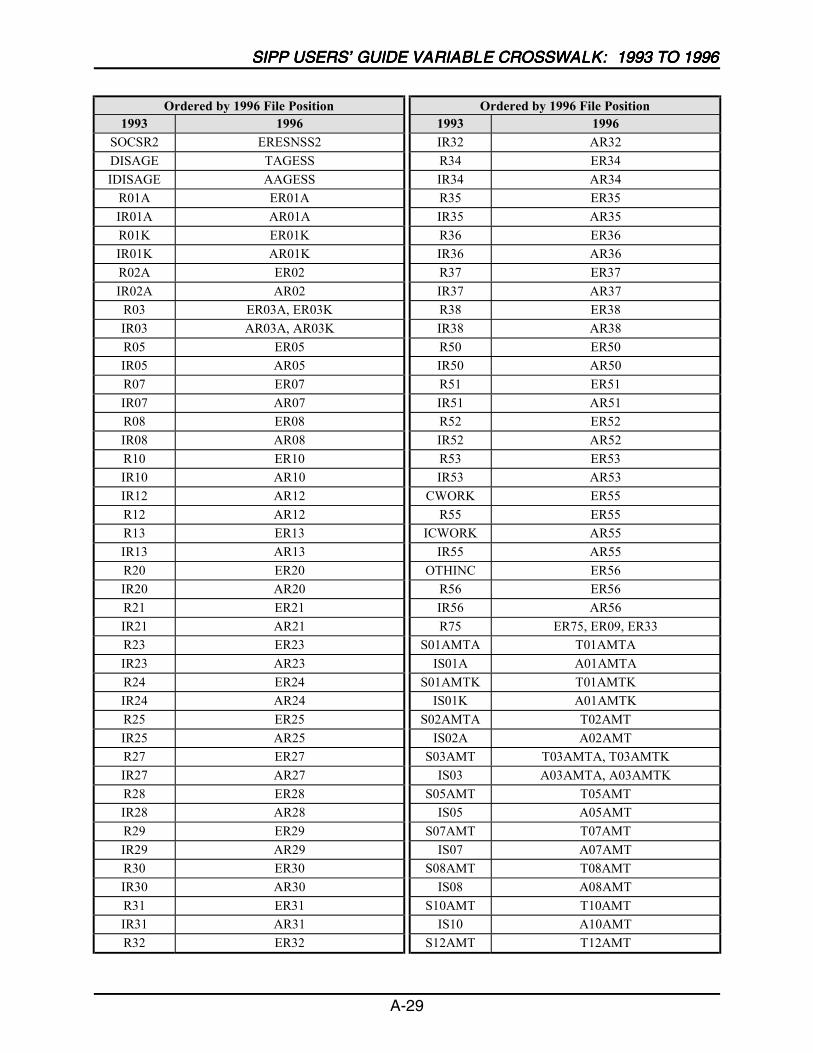
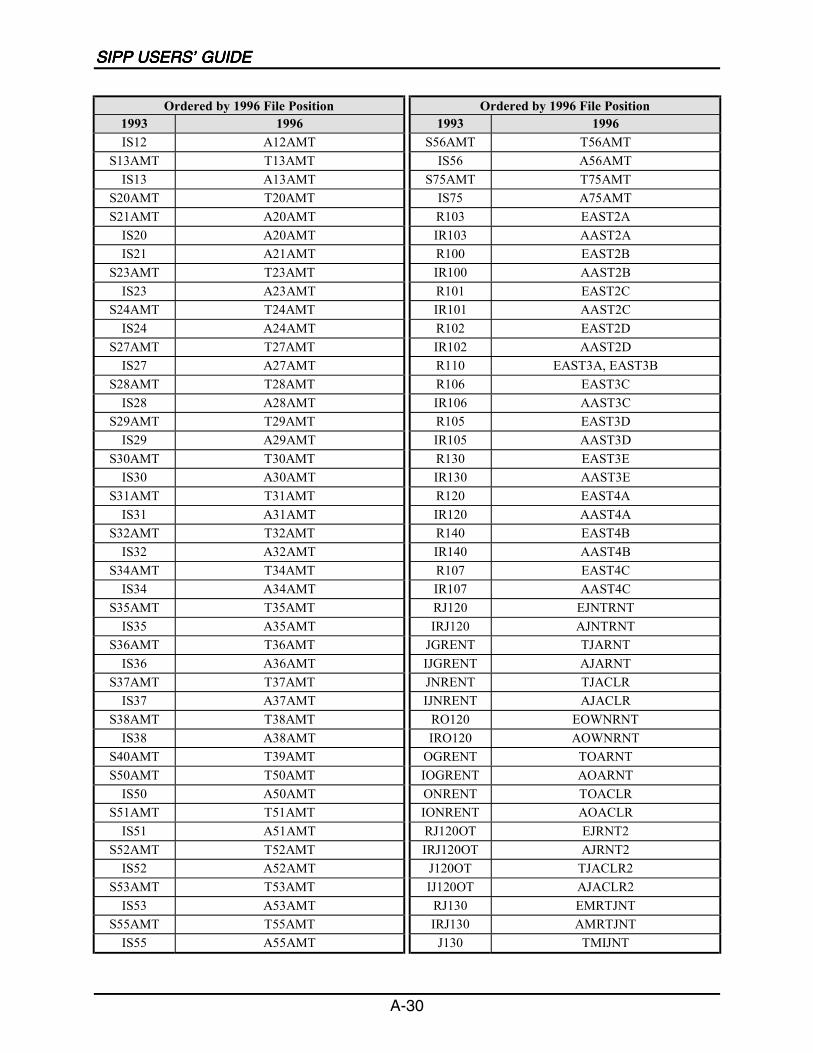
A SIPP Users’ Guide Variable Crosswalk: 1993 to 1996 ......................................A-1
B SIPP Topcoding Specifications ............................................................................ B-1
Earnings ............................................................................................................ B-1Year of Birth (TBYEAR).................................................................................. B-4Age (TAGE)...................................................................................................... B-4Age at Receipt of Social Security Disability Benefits (TAGESS) ................... B-5Age Respondent Started Job or Business (TSJDATE, TEJDATE,TSBDATE, TEBDATE) ................................................................................... B-5
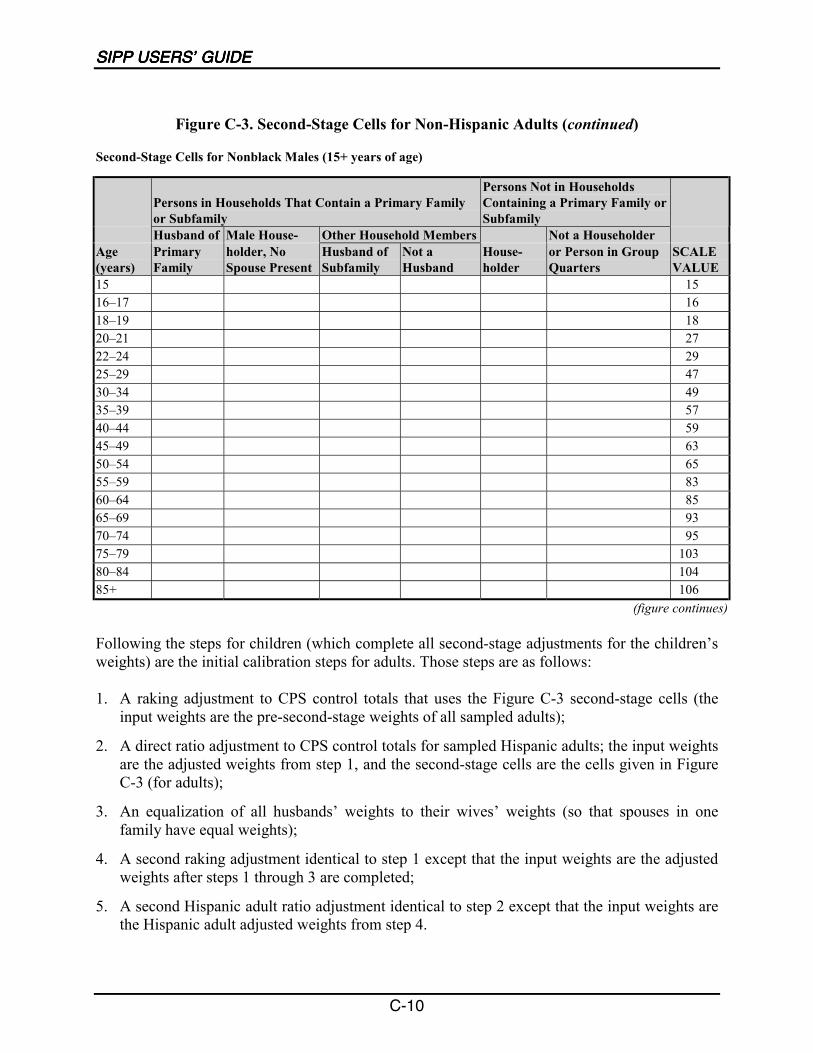
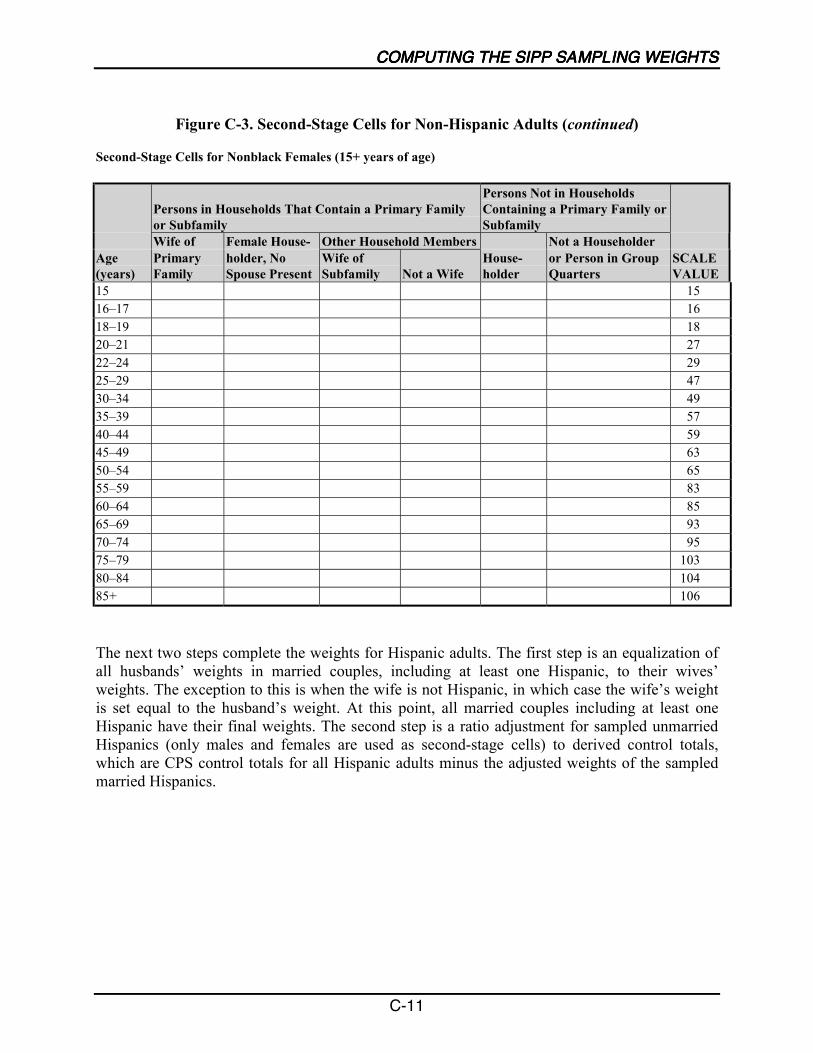
C Computing the SIPP Sample Weights................................................................. C-1
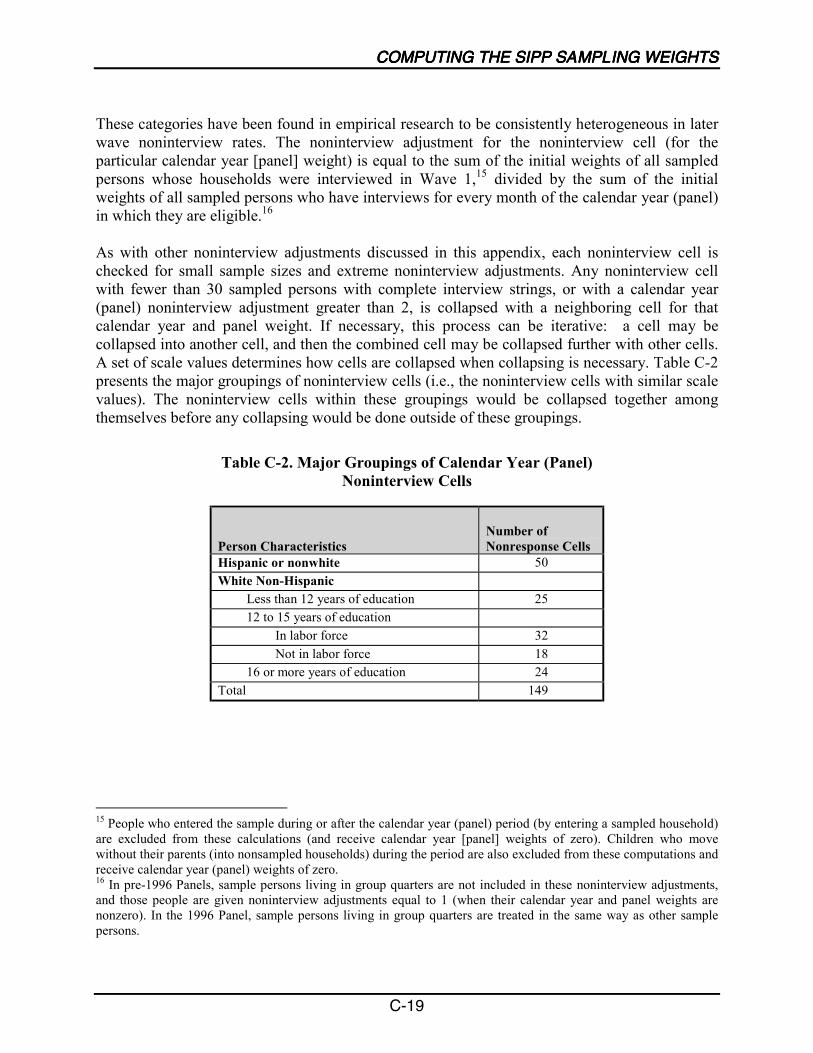
Wave 1 Weights................................................................................................ C-1Wave 2+ Weights............................................................................................ C-12Calendar Year and Panel Weights .................................................................. C-17
D Acronyms ...............................................................................................................D-1
E Glossary ................................................................................................................. E-1
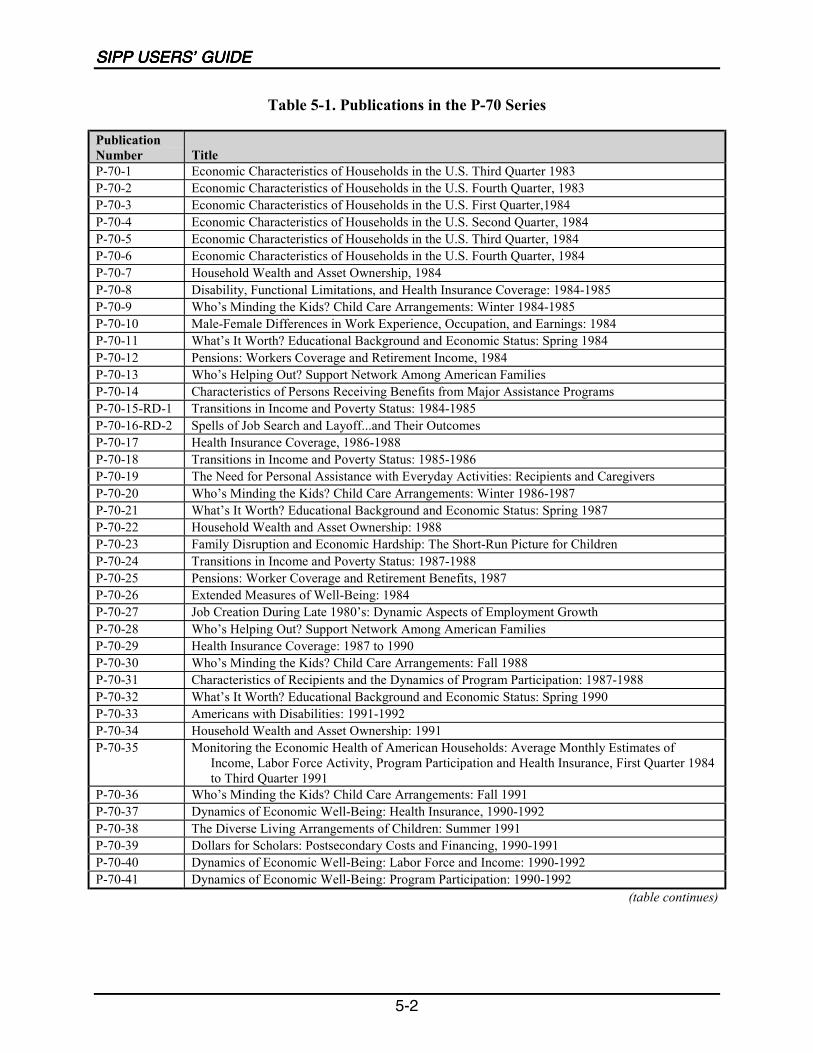
5-1 Publications in the P-70 Series ................................................................................5-2
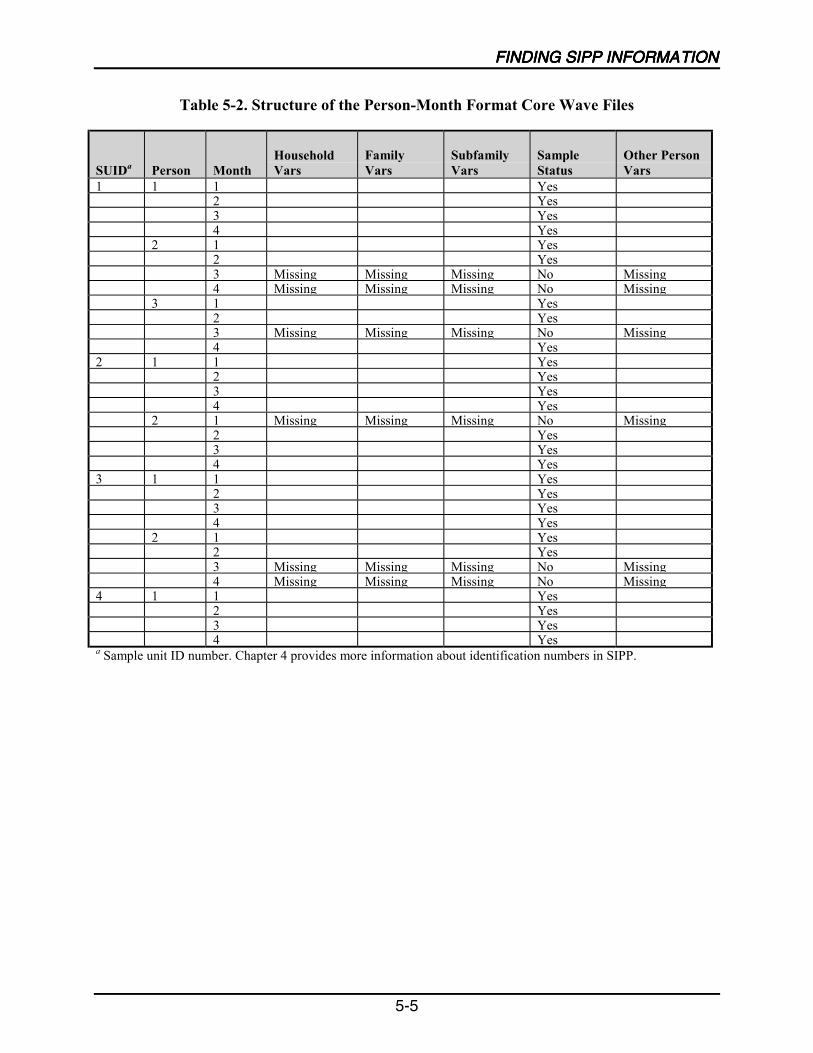
5-2 Structure of the Person-Month Format Core Wave Files ........................................5-5
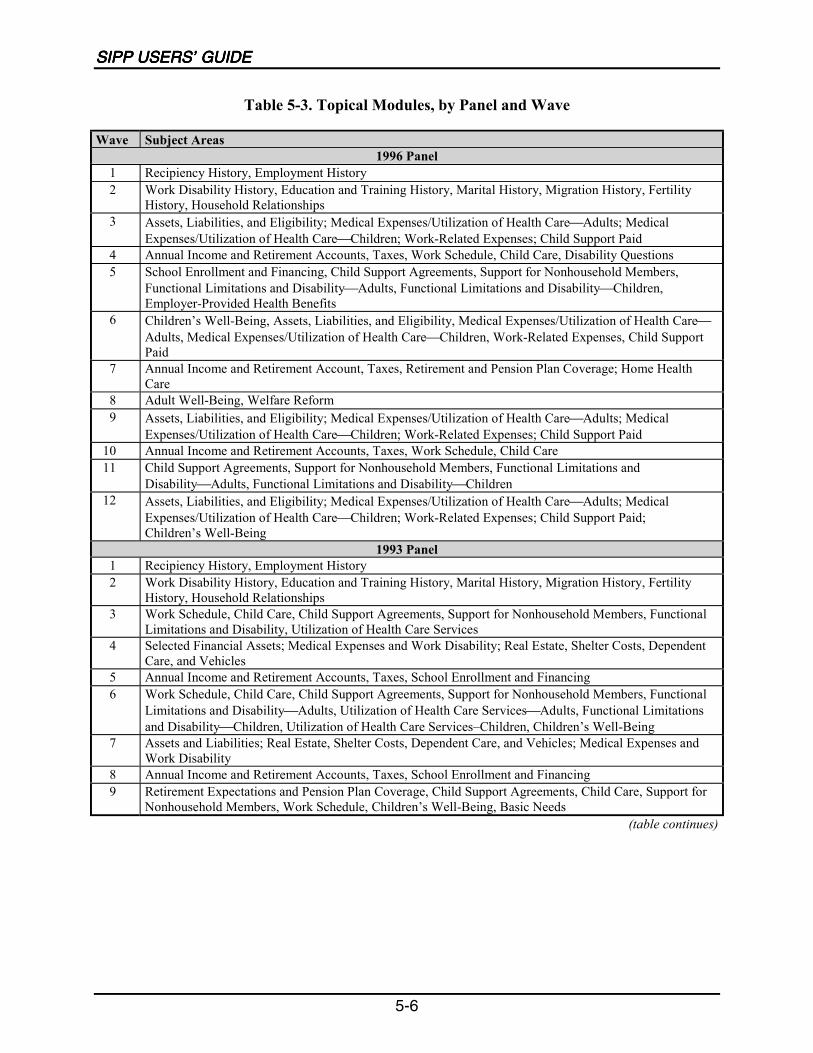
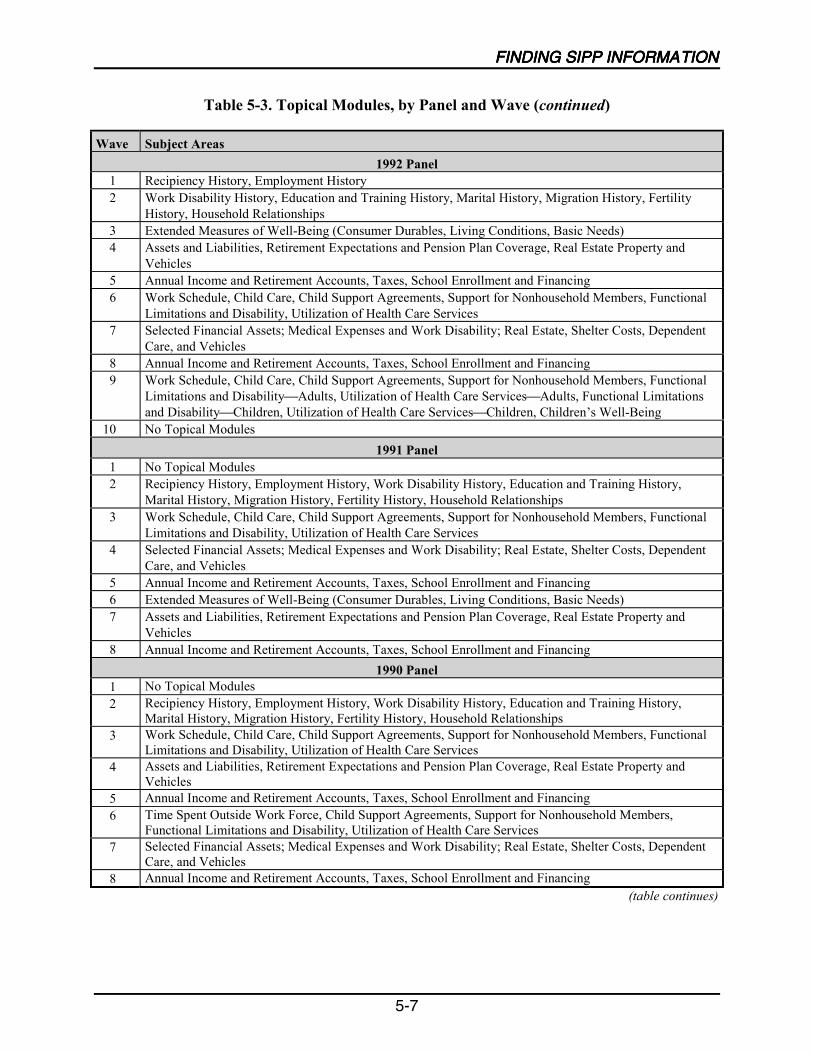
5-3 Topical Modules, by Panel and Wave .....................................................................5-6
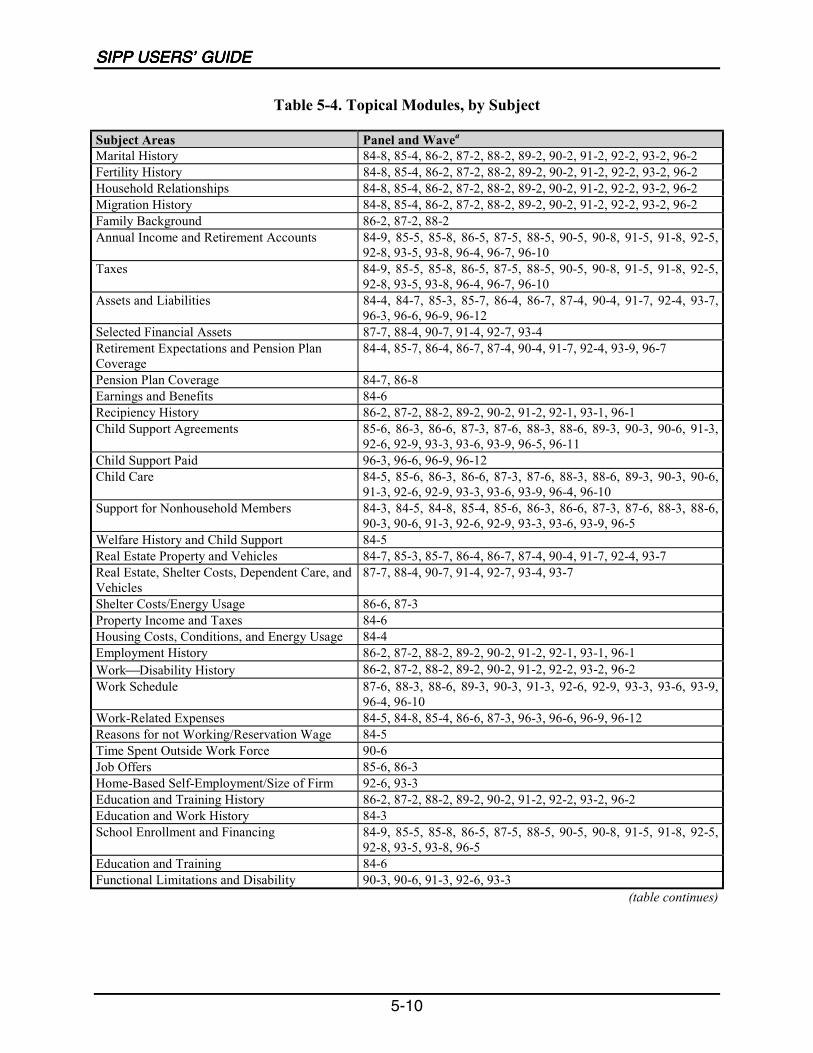
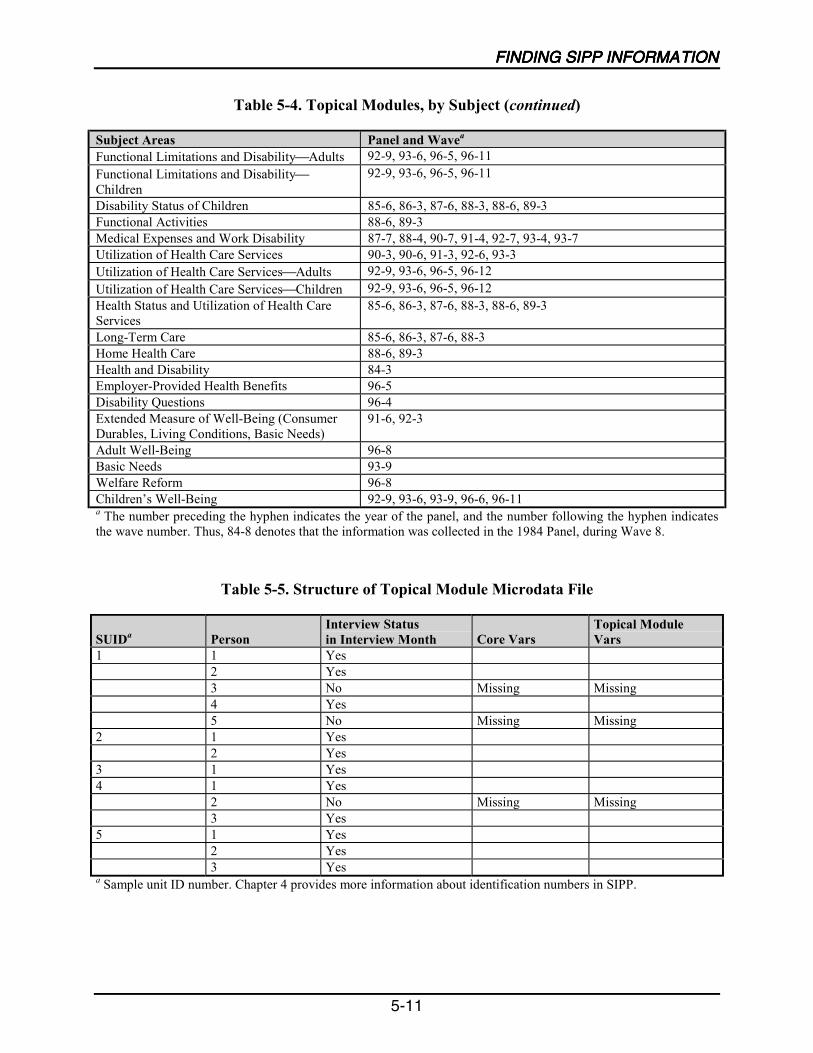
5-4 Topical Modules, by Subject .................................................................................5-10
5-5 Structure of Topical Module Microdata File .........................................................5-11
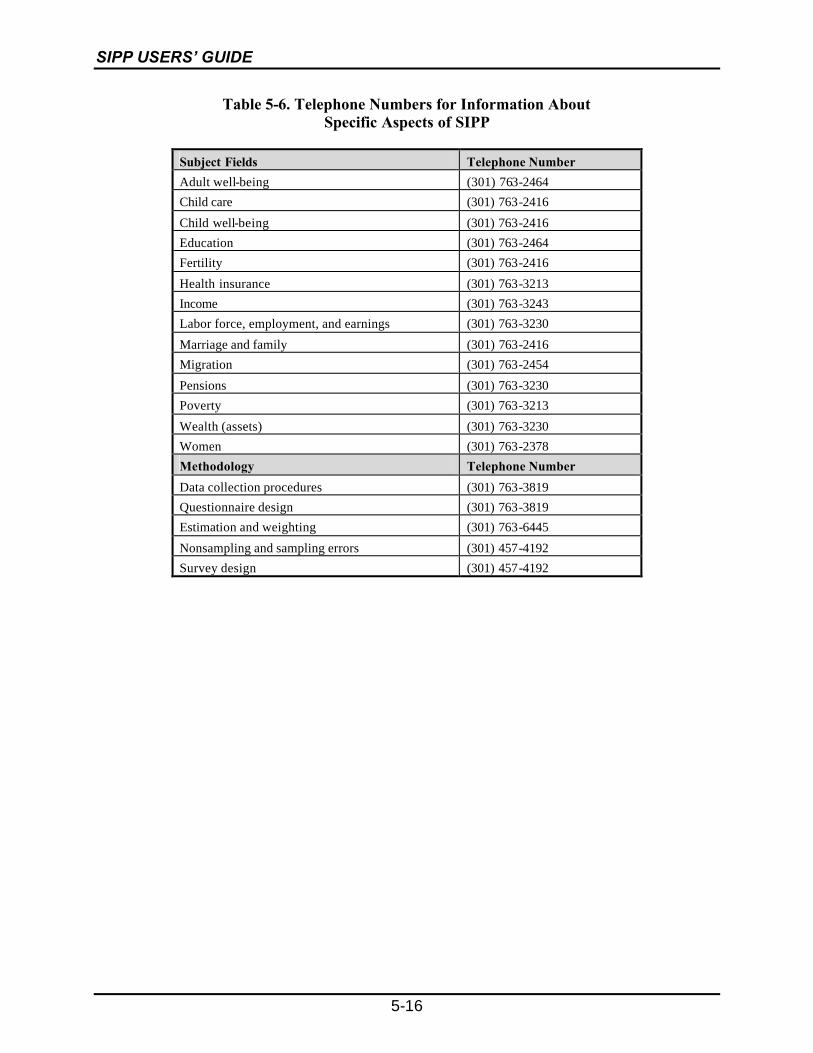
5-6 Telephone Numbers for Information About Specific Aspects of SIPP .................5-16
7-1 Variance Stratum Code and Variance Unit Code in SIPP Files, 1990–1993 ..........7-3
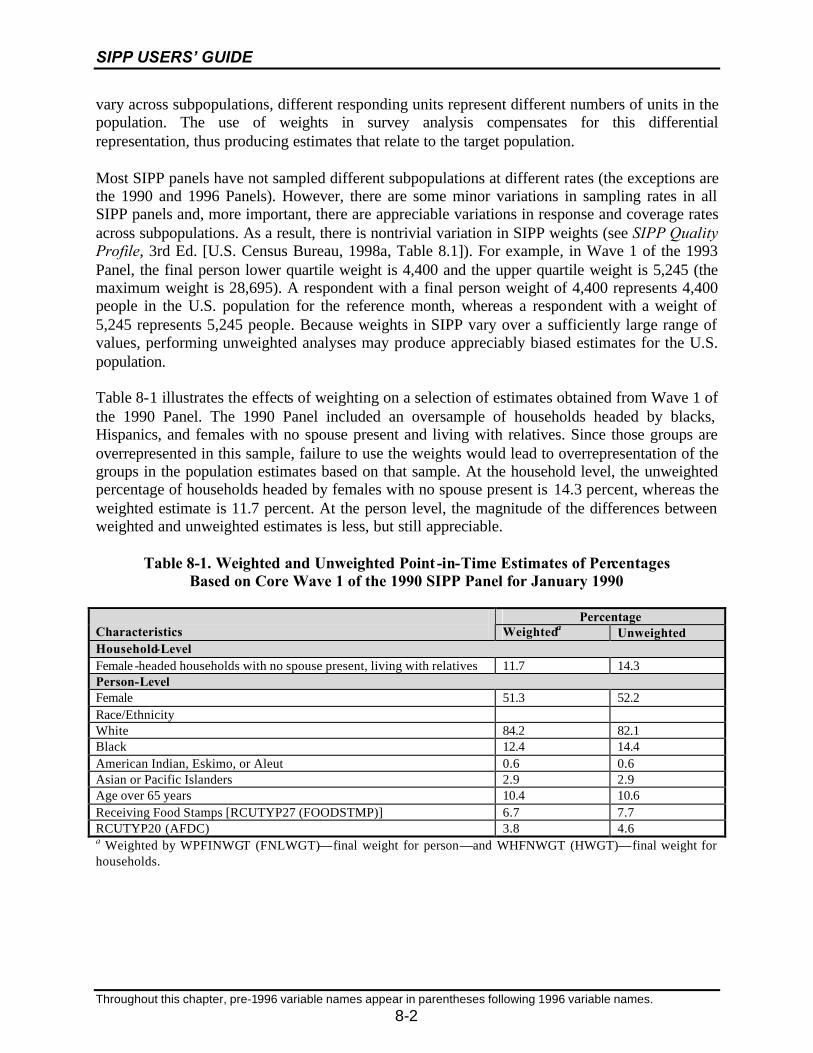
8-1 Weighted and Unweighted Point-in-Time Estimates of PercentagesBased on Core Wave 1 of the 1990 SIPP Panel for January 1990 ..........................8-2
8-2 Weight Variables in SIPP Files for the 1996 and 1990–1993 Panels......................8-3
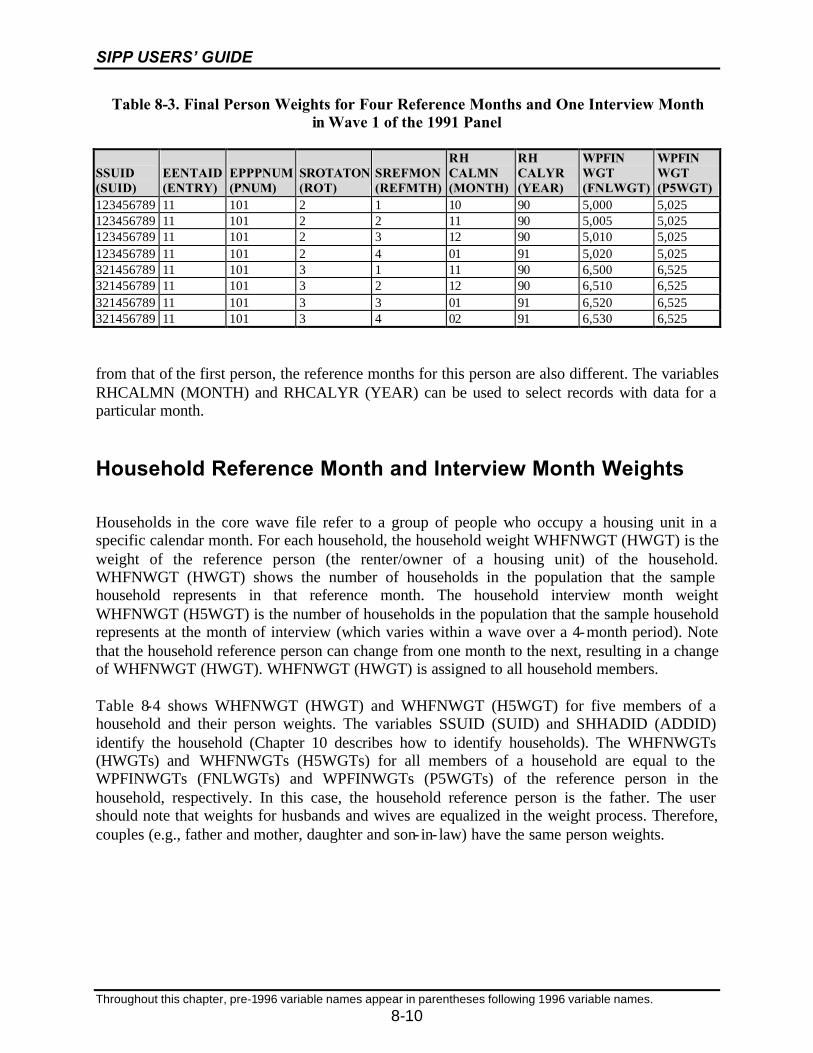
8-3 Final Person Weights for Four Reference Months and One Interview Monthin Wave 1 of the 1991 Panel ..................................................................................8-10
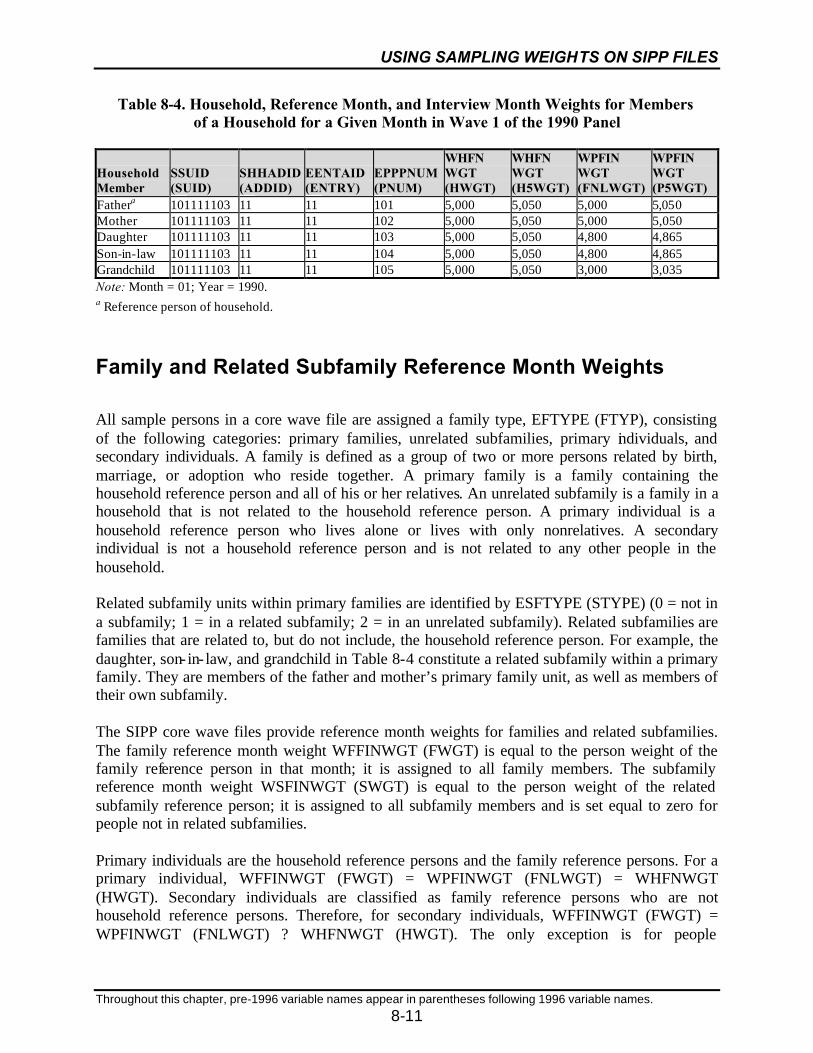
8-4 Household, Reference Month, and Interview Month Weights for Membersof a Household for a Given Month in Wave 1 of the 1990 Panel..........................8-11
8-5 Family and Subfamily Reference Months Weights, by RHTYPE (HTYPE),EFTYPE (FTYPE), and ESFTYPE (STYPE) in Wave 1 of the 1990 Panel .........8-13
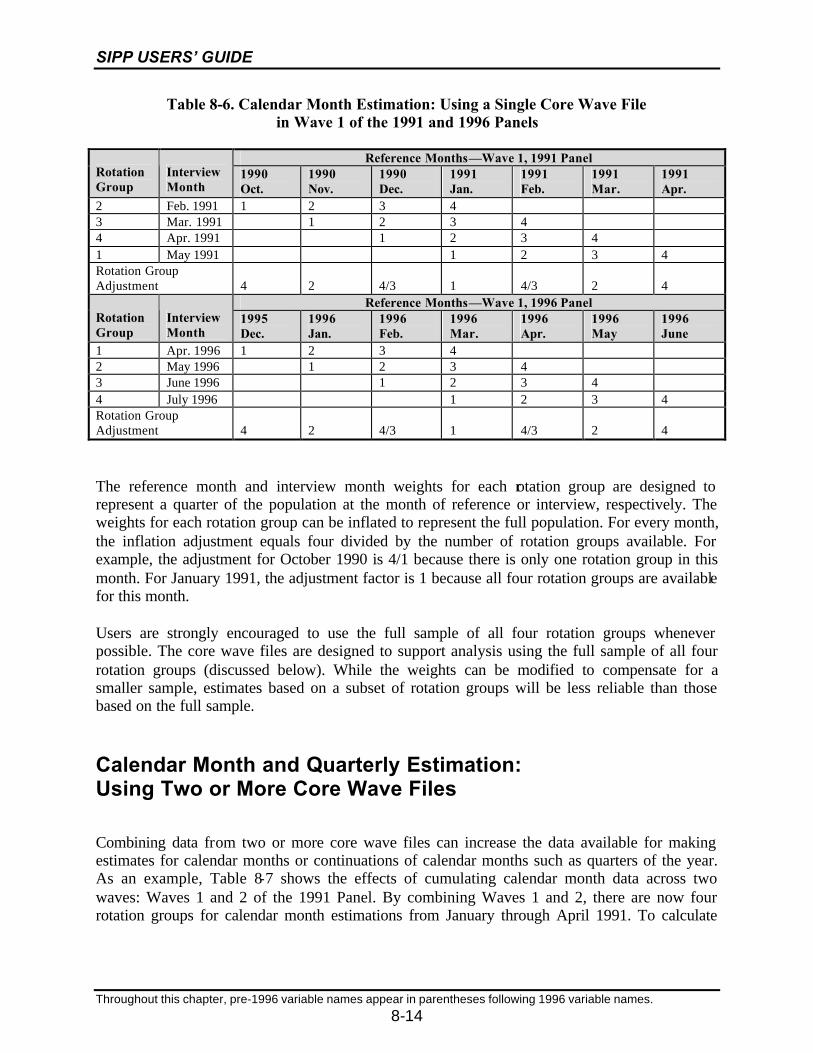
8-6 Calendar Month Estimation: Using a Single Core Wave File in Wave 1of the 1991 and 1996 Panels ..................................................................................8-14
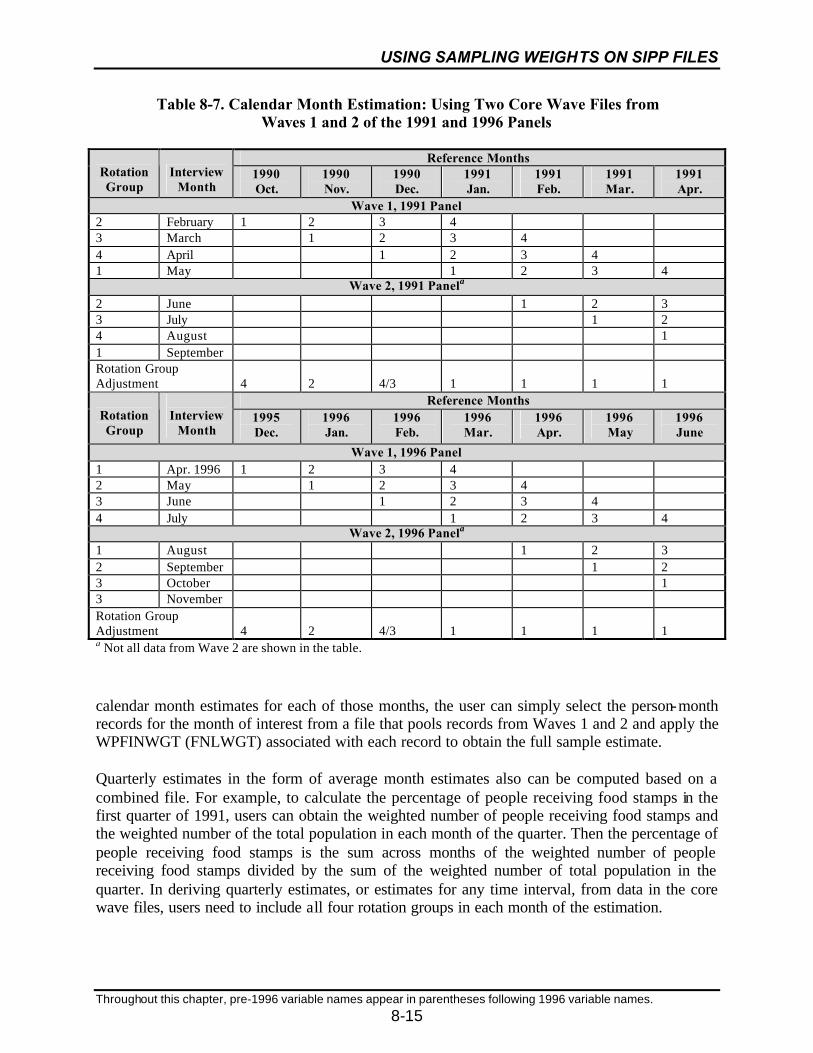
8-7 Calendar Month Estimation: Using Two Core Wave Files from Waves 1and 2 of the 1991 and 1996 Panels ........................................................................8-15
8-8 Calendar Year and Panel Weights, 1990–1993 .....................................................8-17
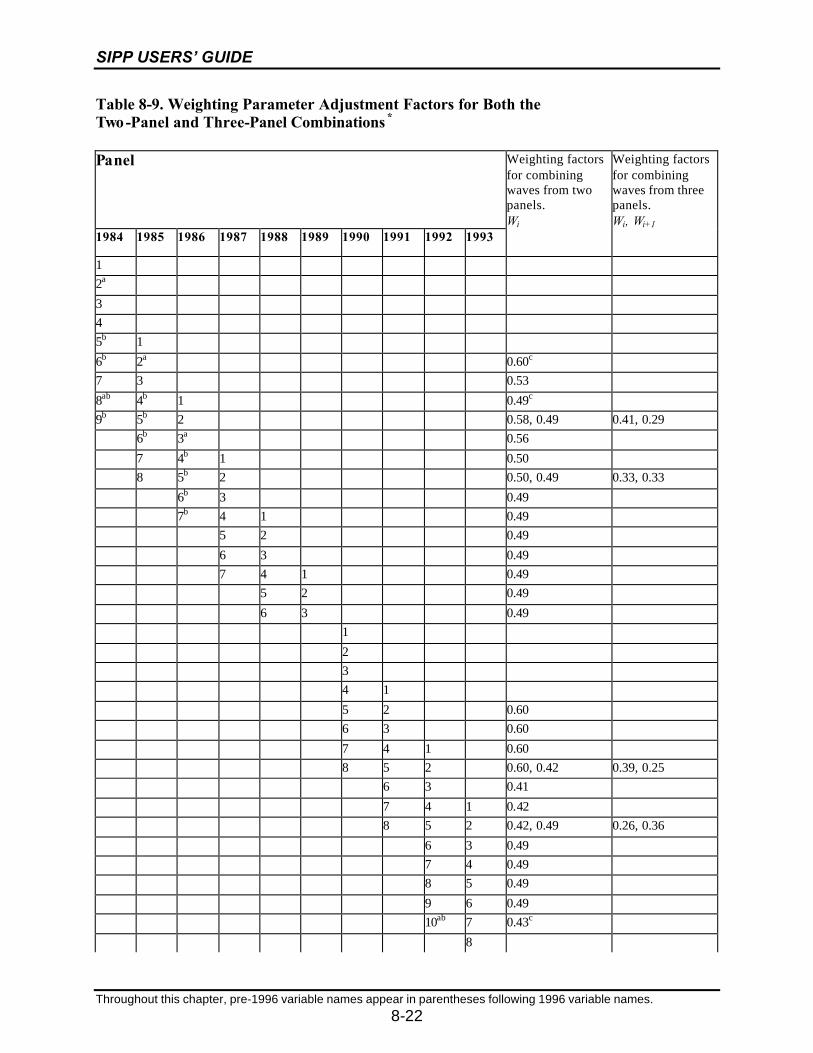
8-9 Weighting Parameter Adjustment Factors for Both the Two-Panel andThree-Panel Combinations.....................................................................................8-21
SIPP USERS’ GUIDE
vi
Table Page
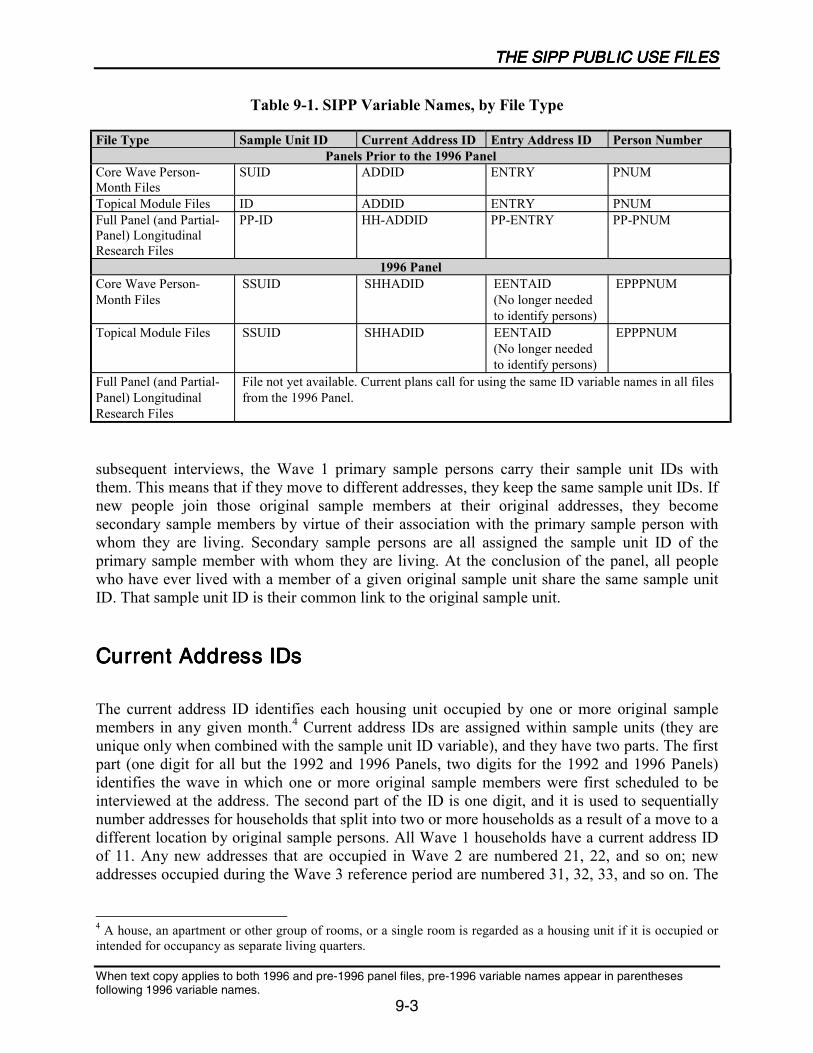
9-1 SIPP Variable Names, by File Type ........................................................................9-3
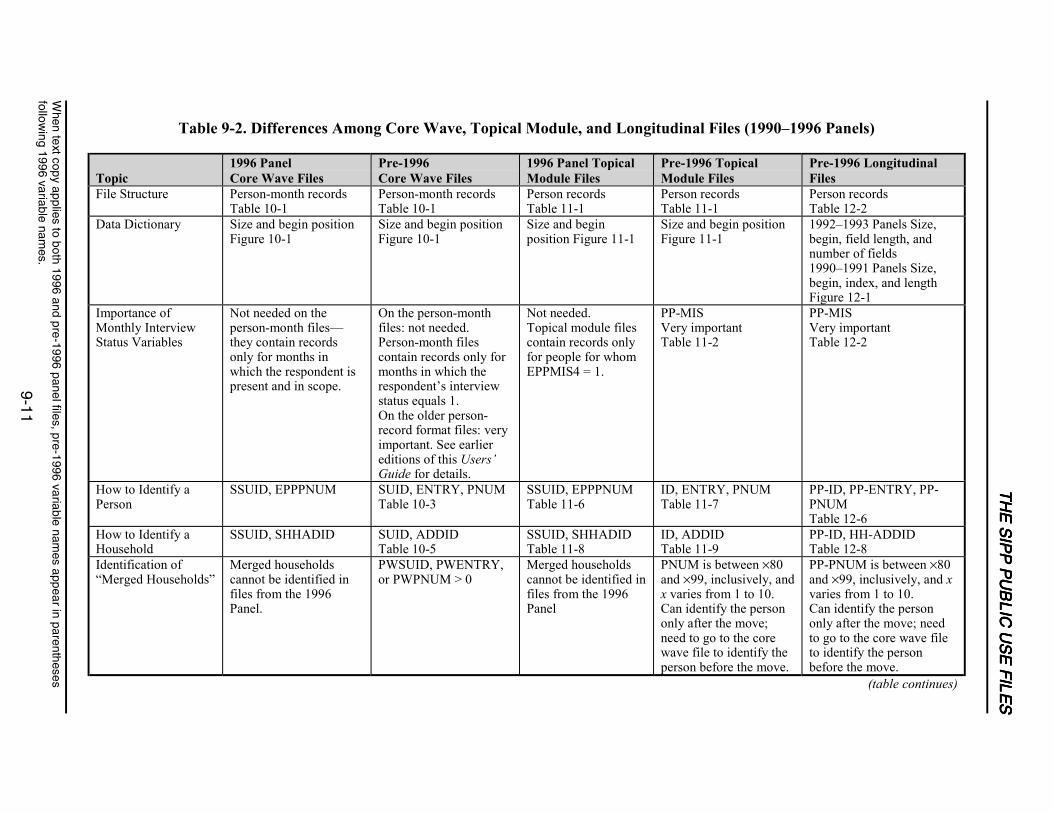
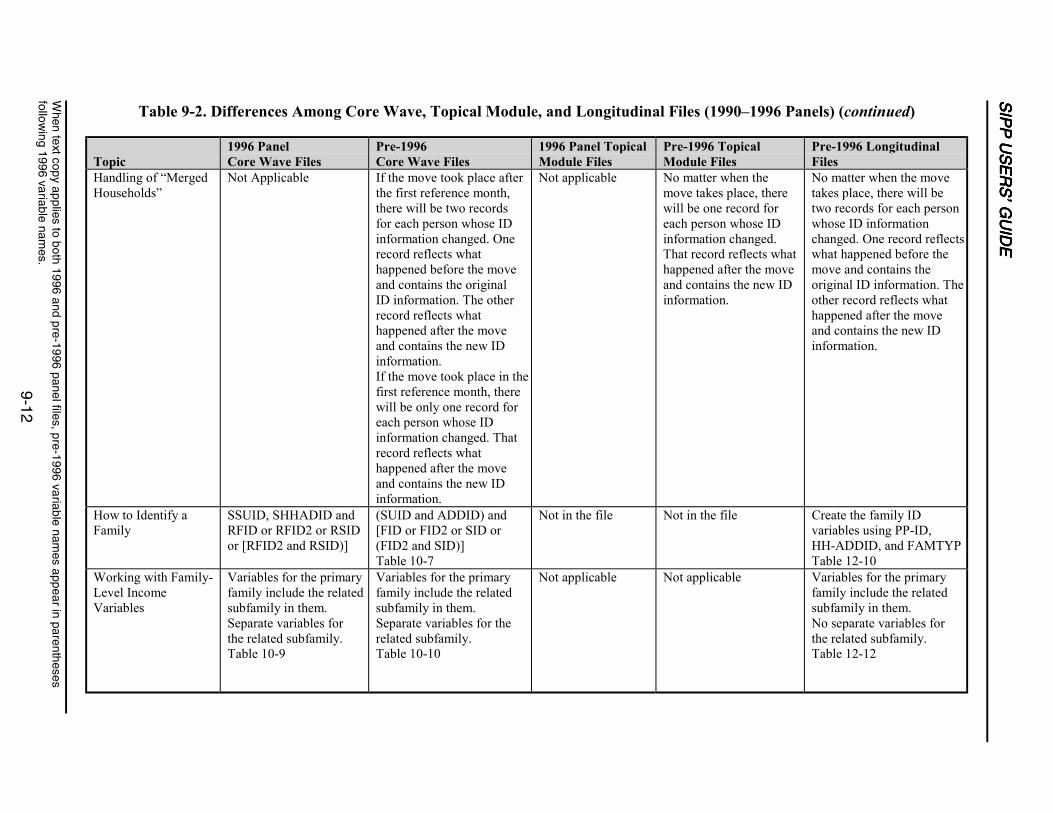
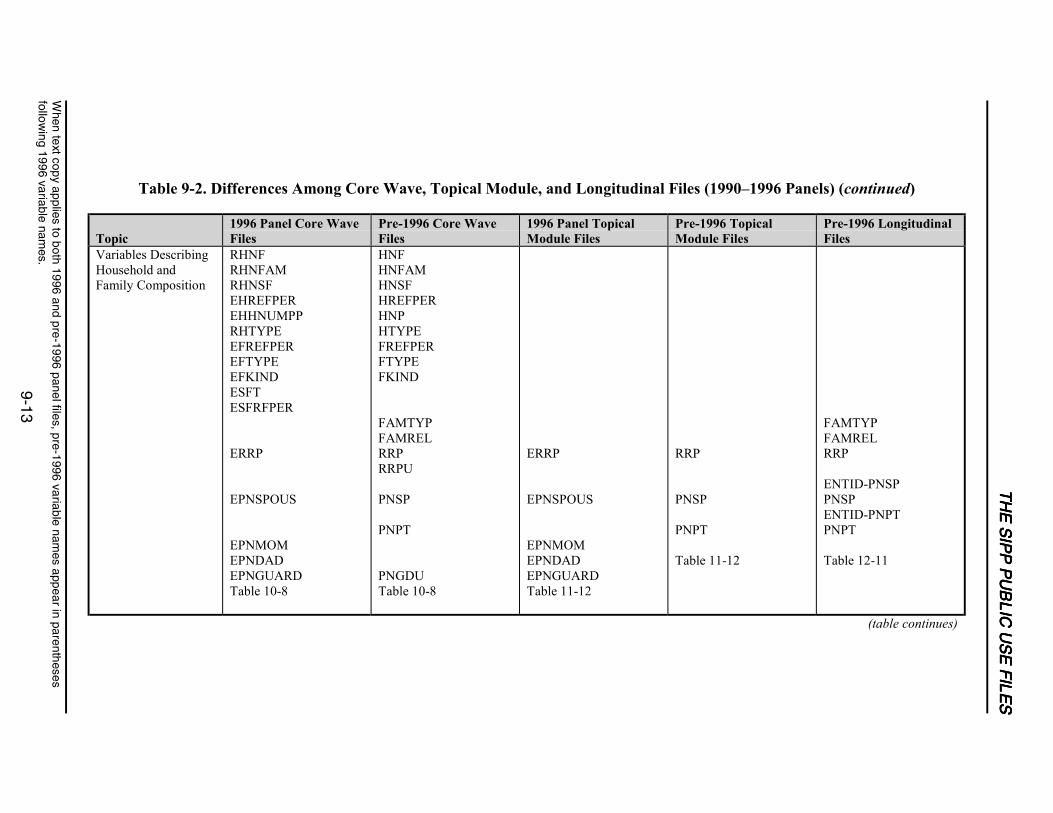
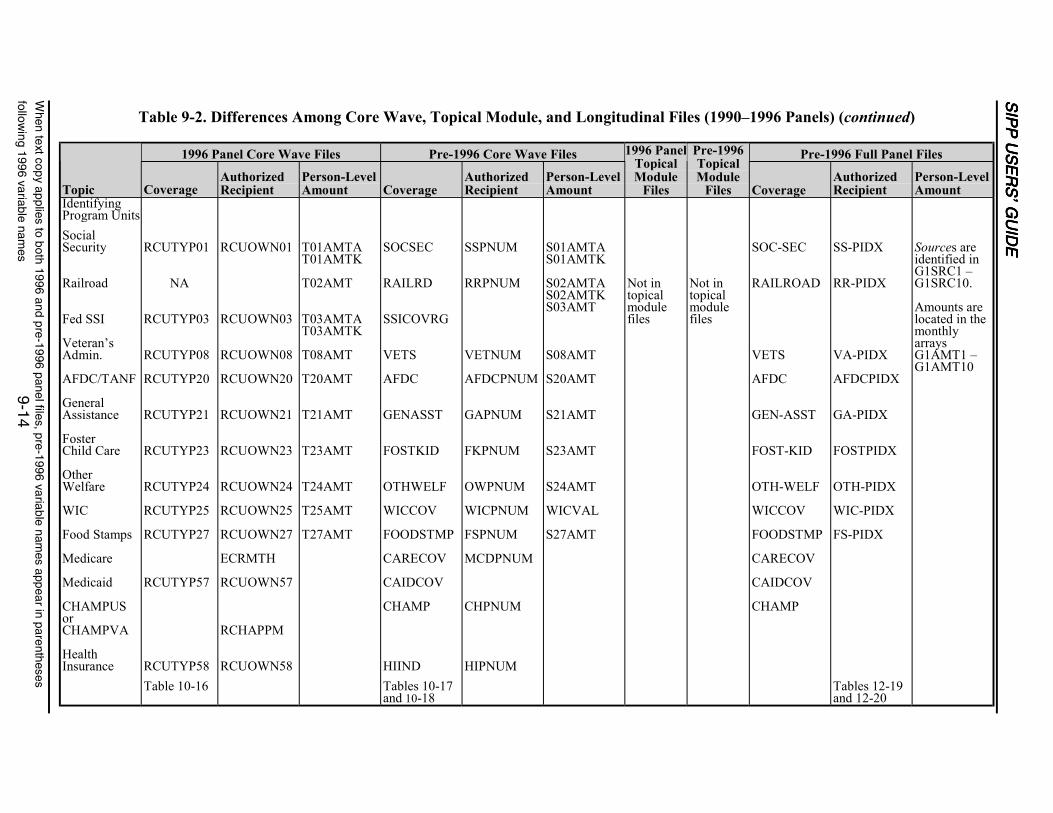
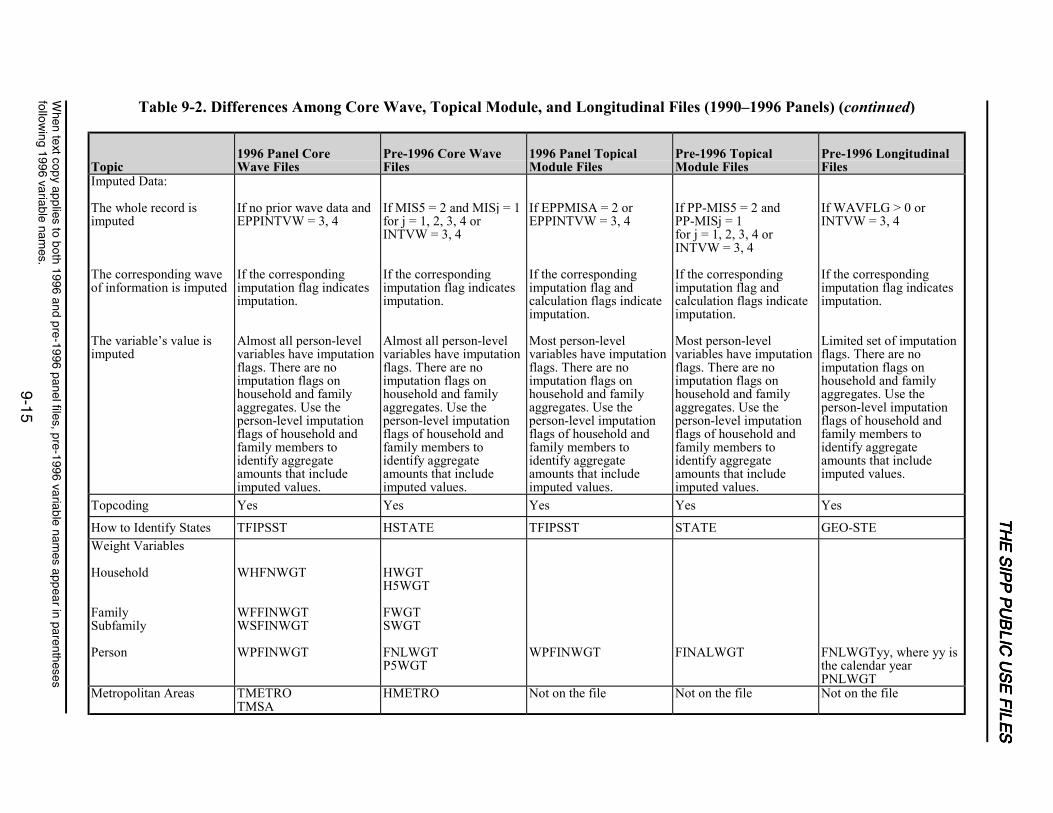
9-2 Differences Among Core Wave, Topical Module, and Longitudinal Files(1990–1996 Panels) ...............................................................................................9-11
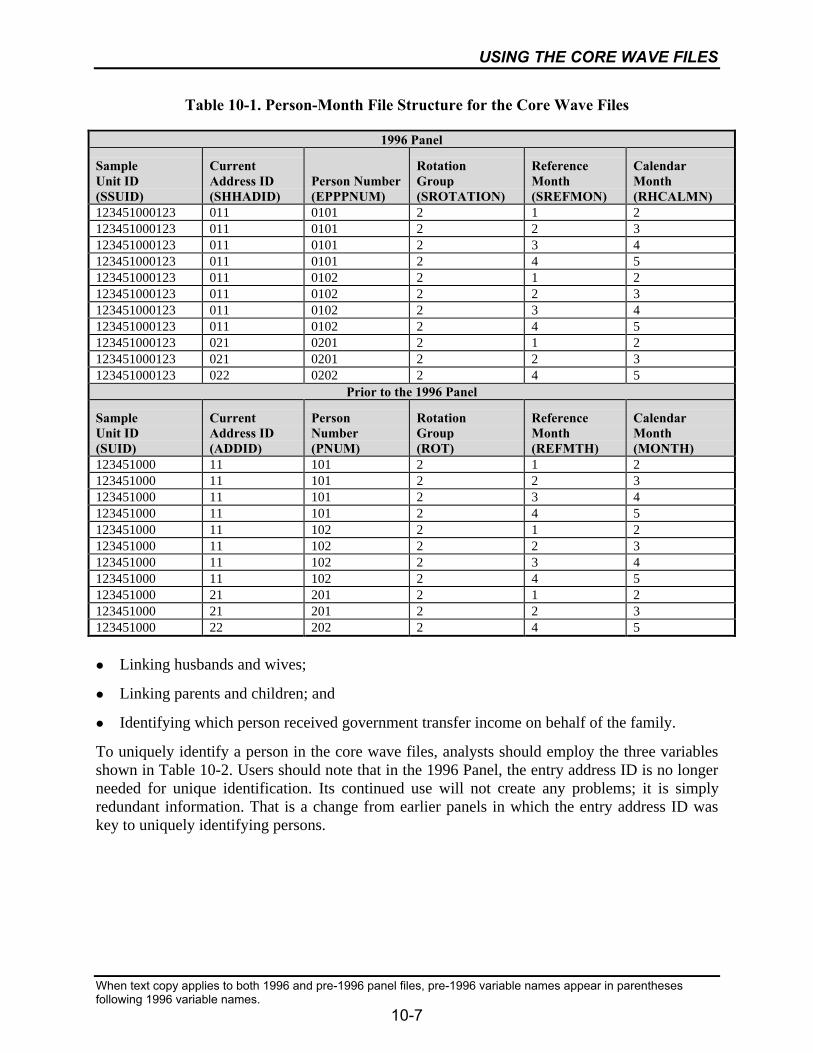
10-1 Person-Month File Structure for the Core Wave Files ..........................................10-7
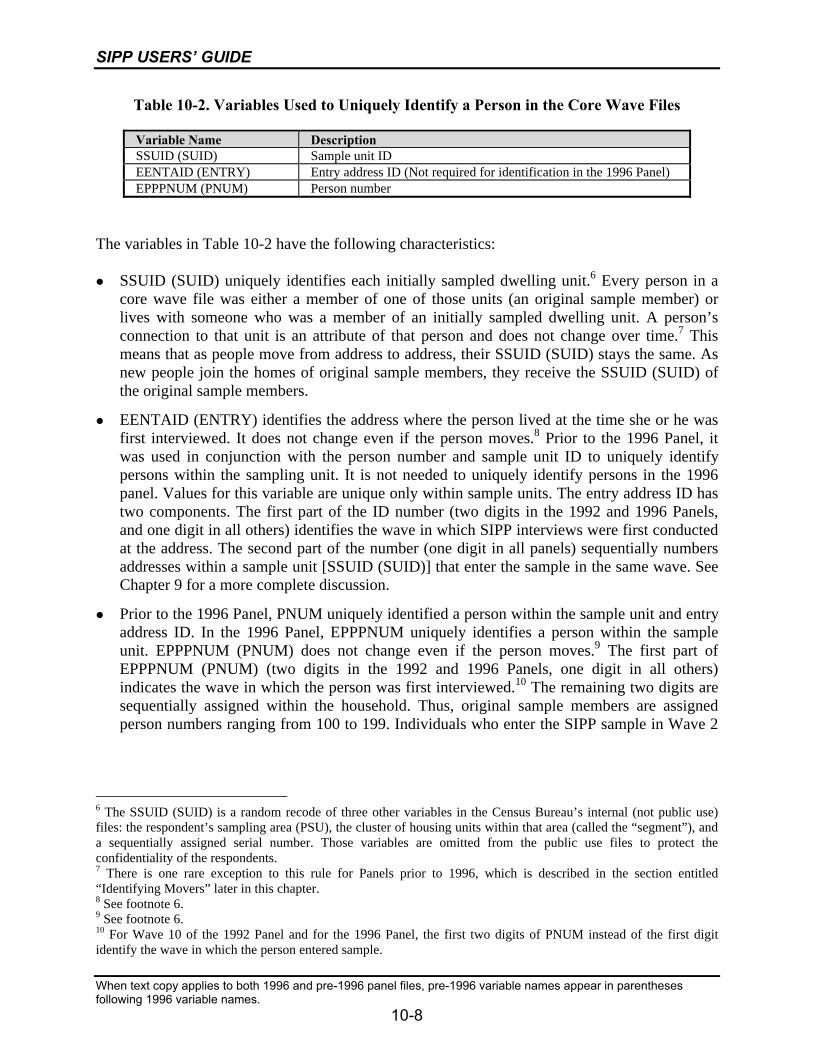
10-2 Variables Used to Uniquely Identify a Person in the Core Wave Files.................10-8
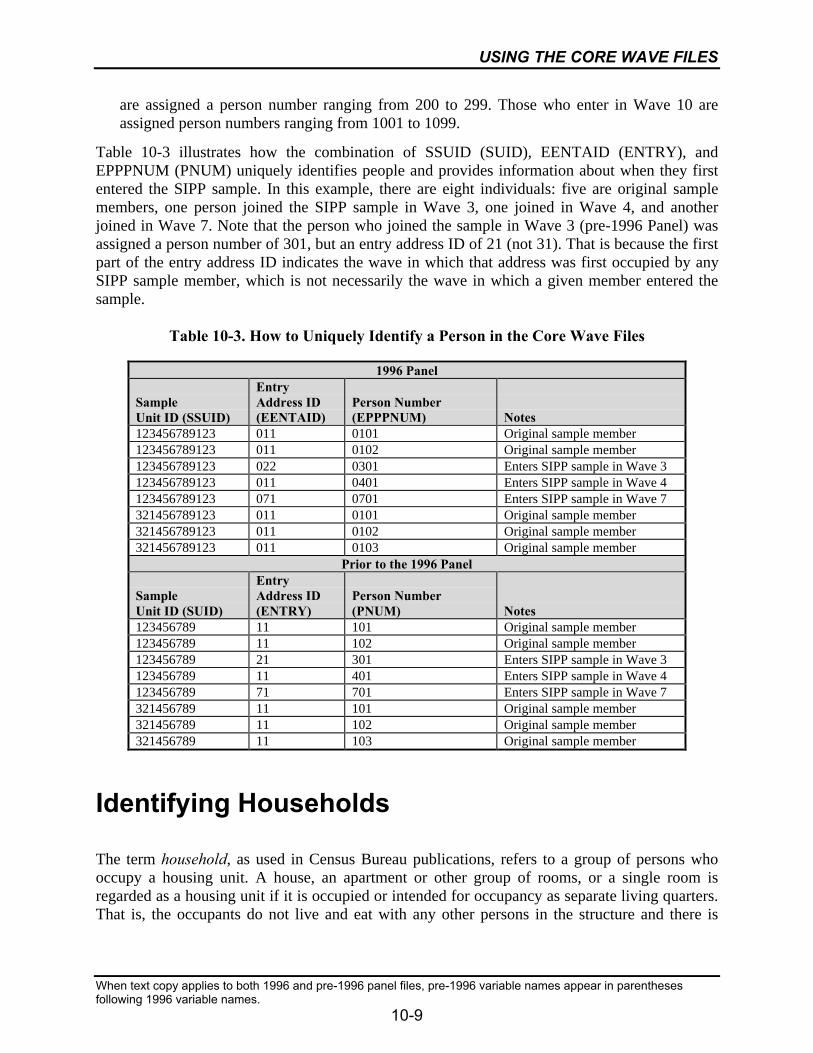
10-3 How to Uniquely Identify a Person in the Core Wave Files..................................10-9
10-4 Variables Used to Uniquely Identify a Household or Group Quarters in theCore Wave Files...................................................................................................10-10
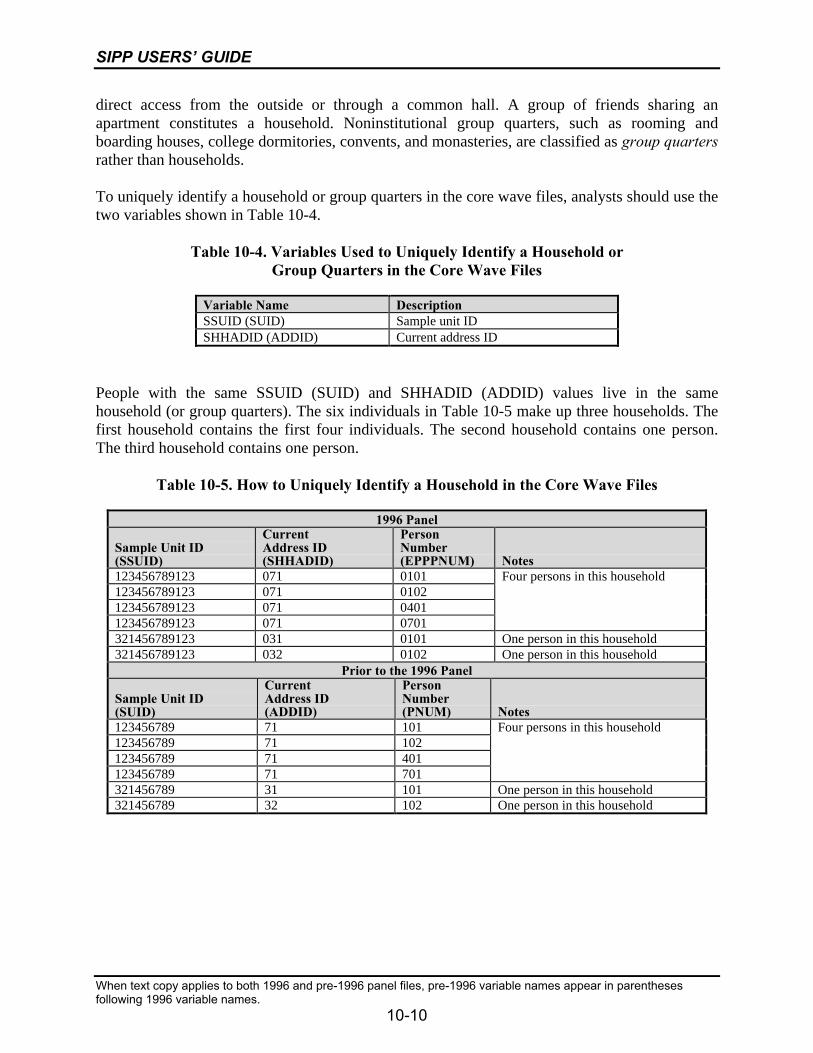
10-5 How to Uniquely Identify a Household in the Core Wave Files .........................10-10
10-6 Variables Used to Uniquely Identify a Family in the Core Wave Files ..............10-11
10-7 Uniquely Identifying Families in the Core Wave Files .......................................10-13
10-8 Variables Describing Household and Family Composition in theCore Wave Files...................................................................................................10-15
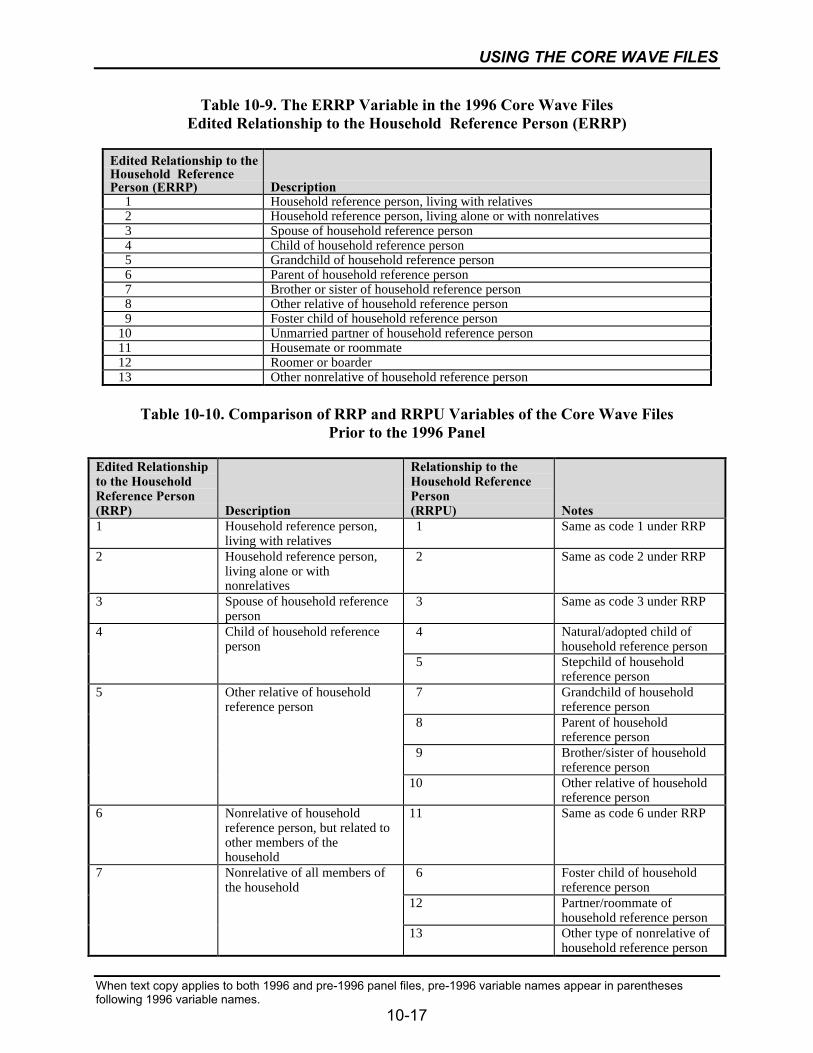
10-9 The ERRP Variable in the 1996 Core Wave Files...............................................10-17
10-10 Comparison of RRP and RRPU Variables of the Core Wave FilesPrior to the 1996 Panel.........................................................................................10-17
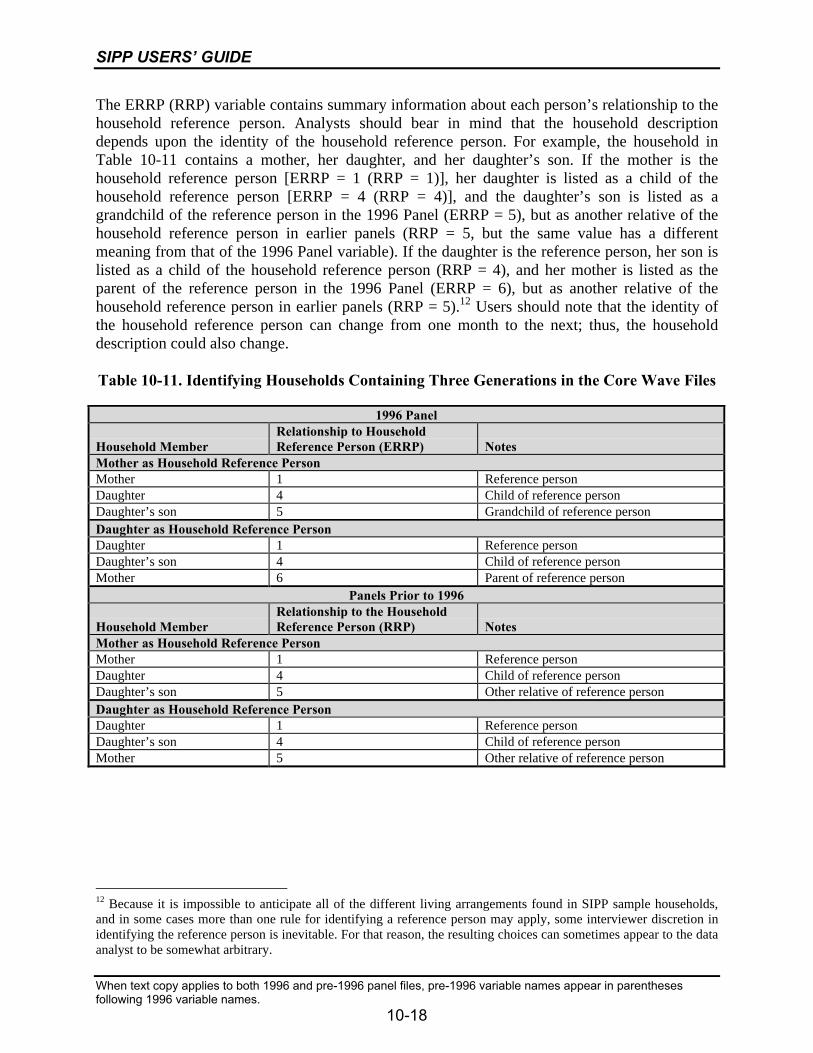
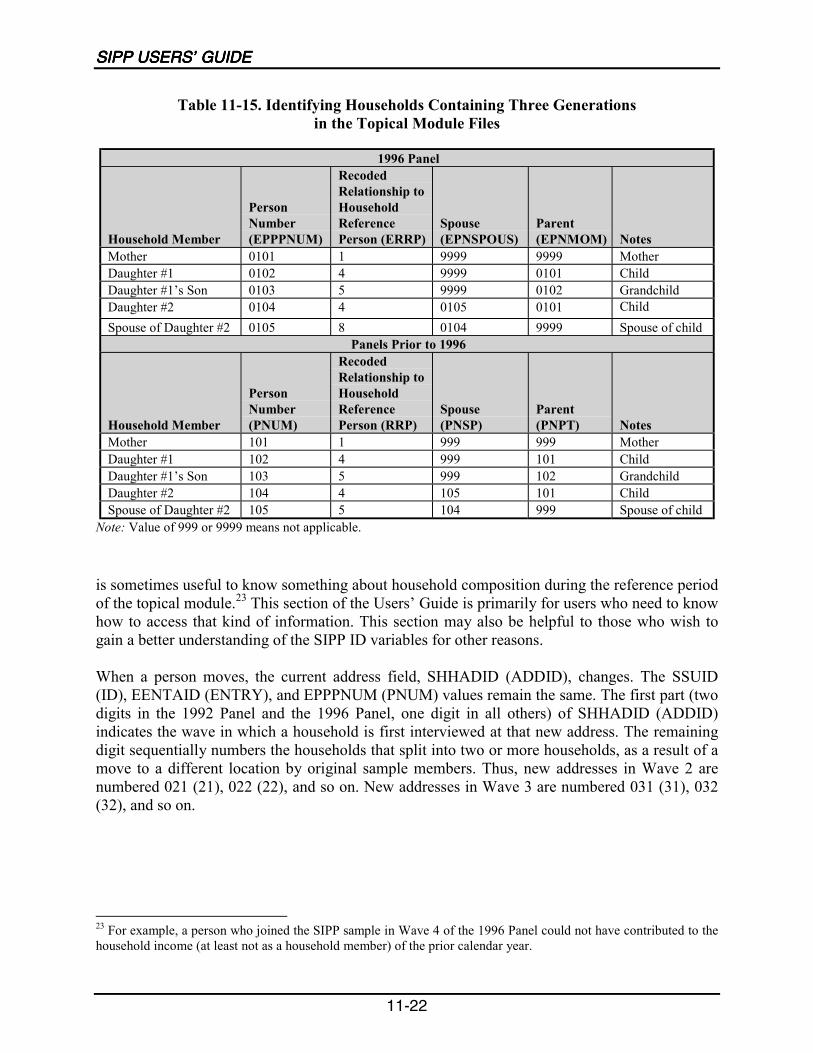
10-11 Identifying Households Containing Three Generations in theCore Wave Files...................................................................................................10-18
10-12 Identifying Households Containing Three Generations in theCore Wave Files...................................................................................................10-19
10-13 How the Family-Level Variables Include the Subfamily’s Informationin the Core Wave Files.........................................................................................10-21
10-14 Identifying Movers in the Core Wave Files.........................................................10-22
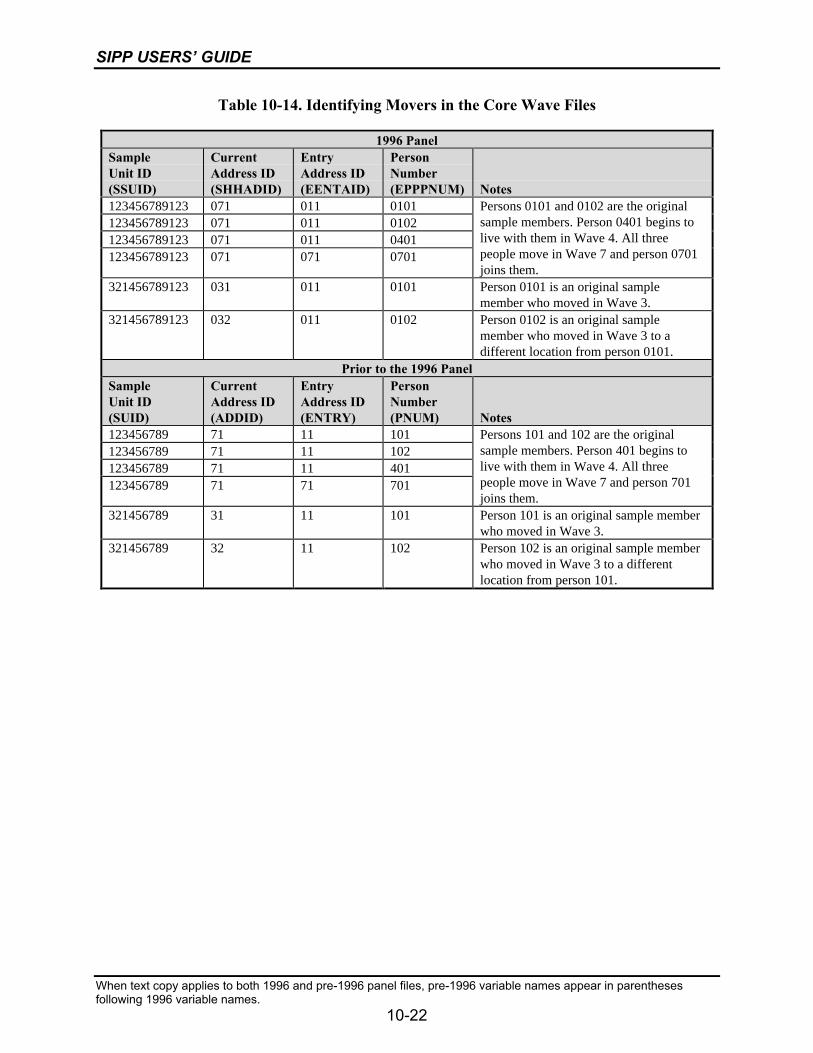
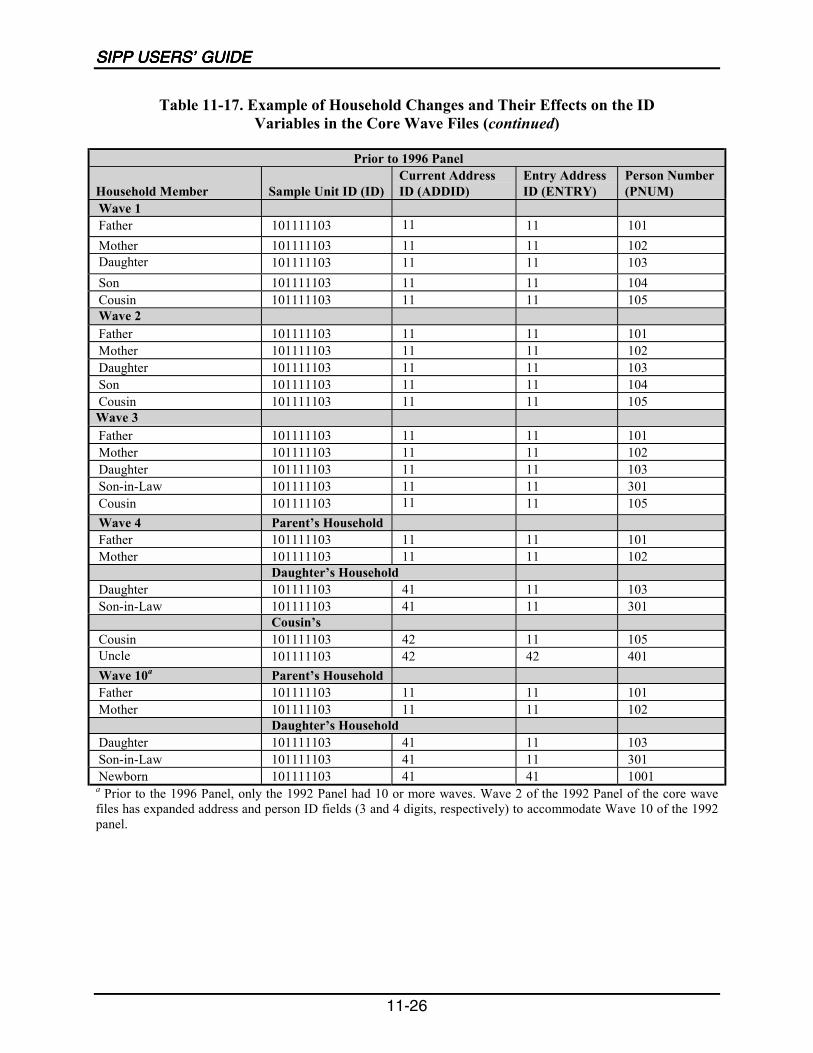
10-15 Example of Household Changes and Their Effects on the ID Variablesof the Core Wave Files ........................................................................................10-23
10-16 Variables Describing Participation in Government Transfer Programsand Health Insurance Programs in the Core Wave Files .....................................10-27
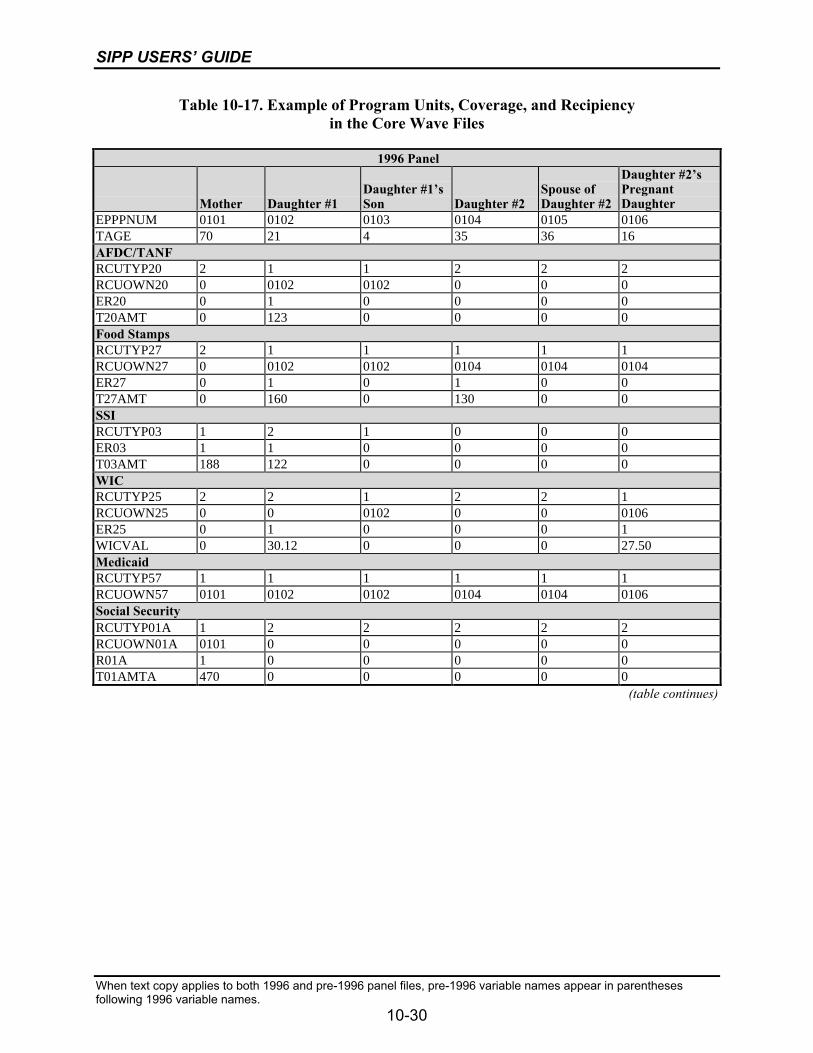
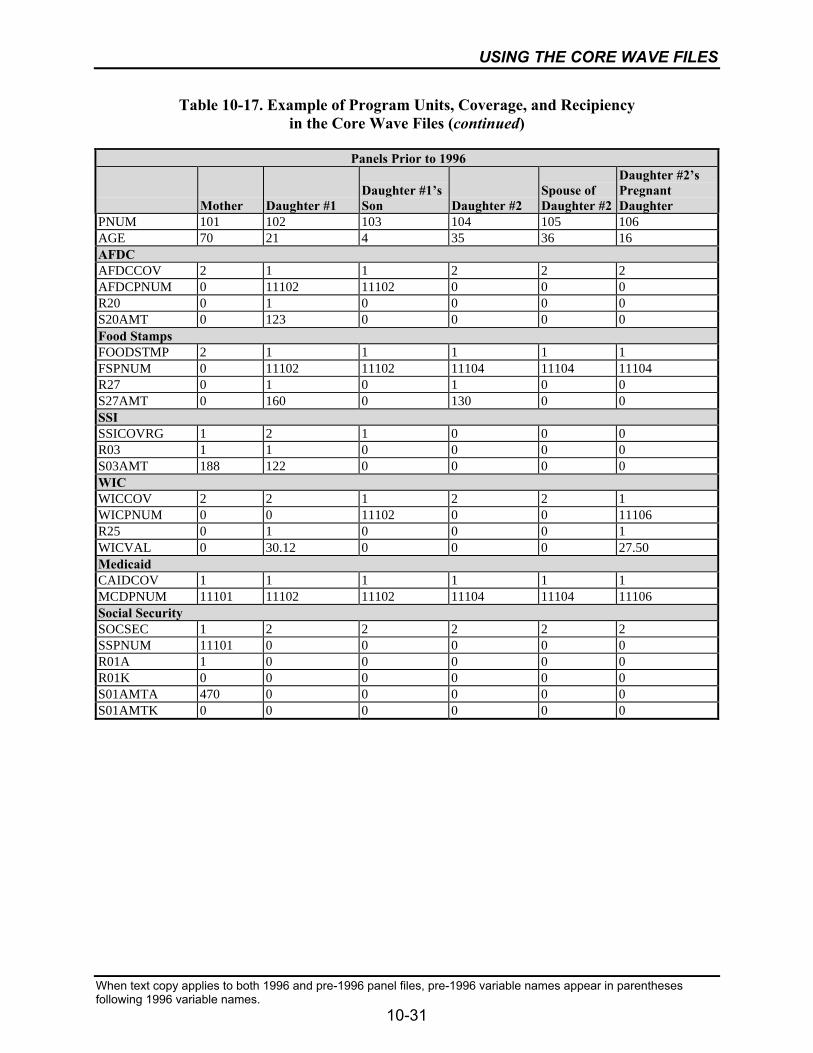
10-17 Example of Program Units, Coverage, and Recipiency in theCore Wave Files...................................................................................................10-30
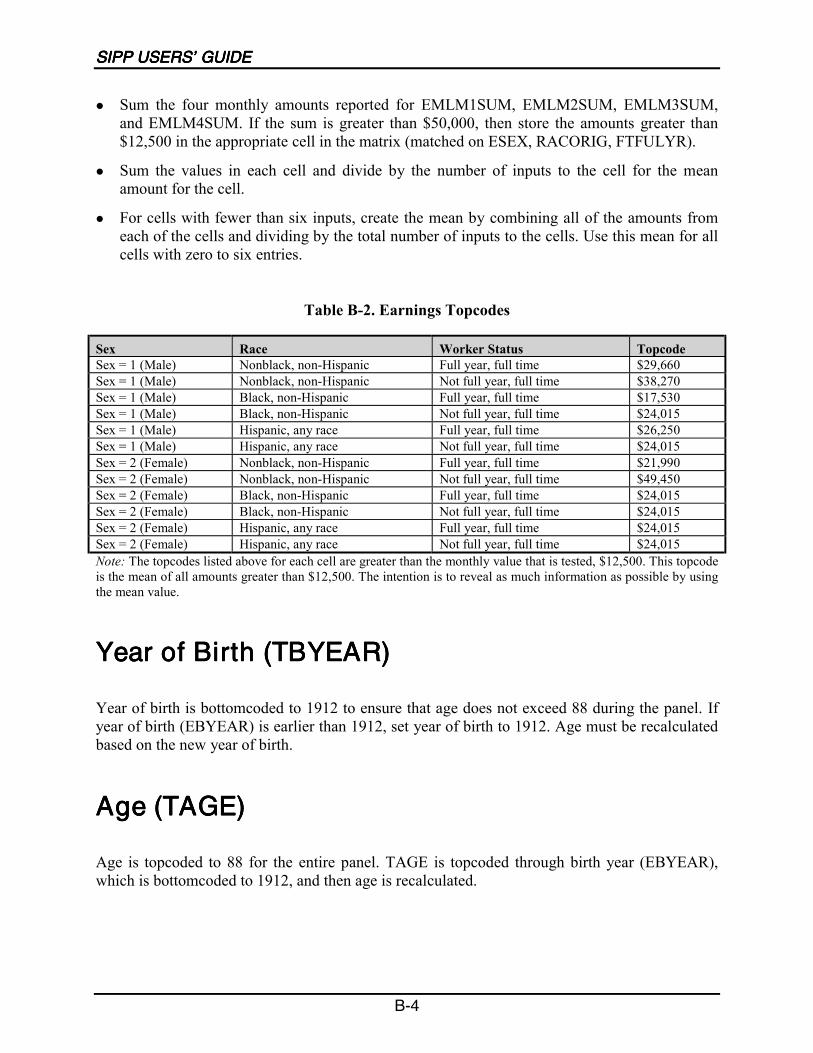
10-18 Topcoding Criteria for the 1996 Panel.................................................................10-32
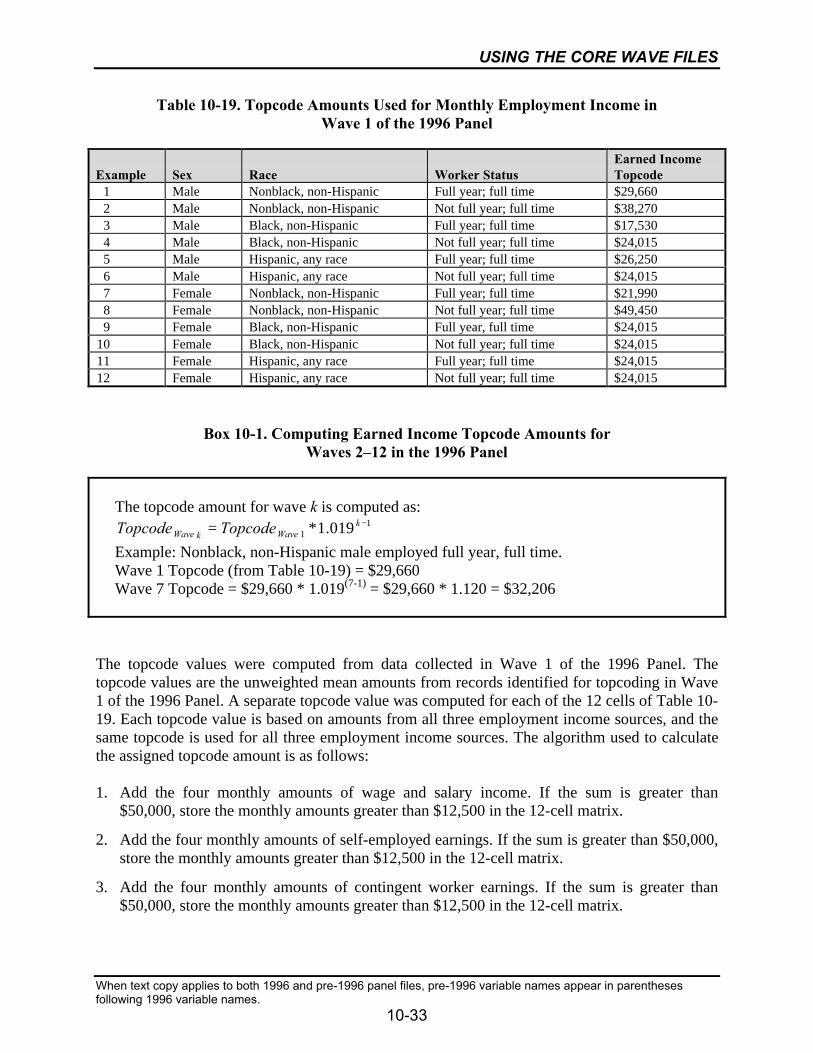
10-19 Topcode Amounts Used for Monthly Employment Income in Wave 1of the 1996 Panel .................................................................................................10-33
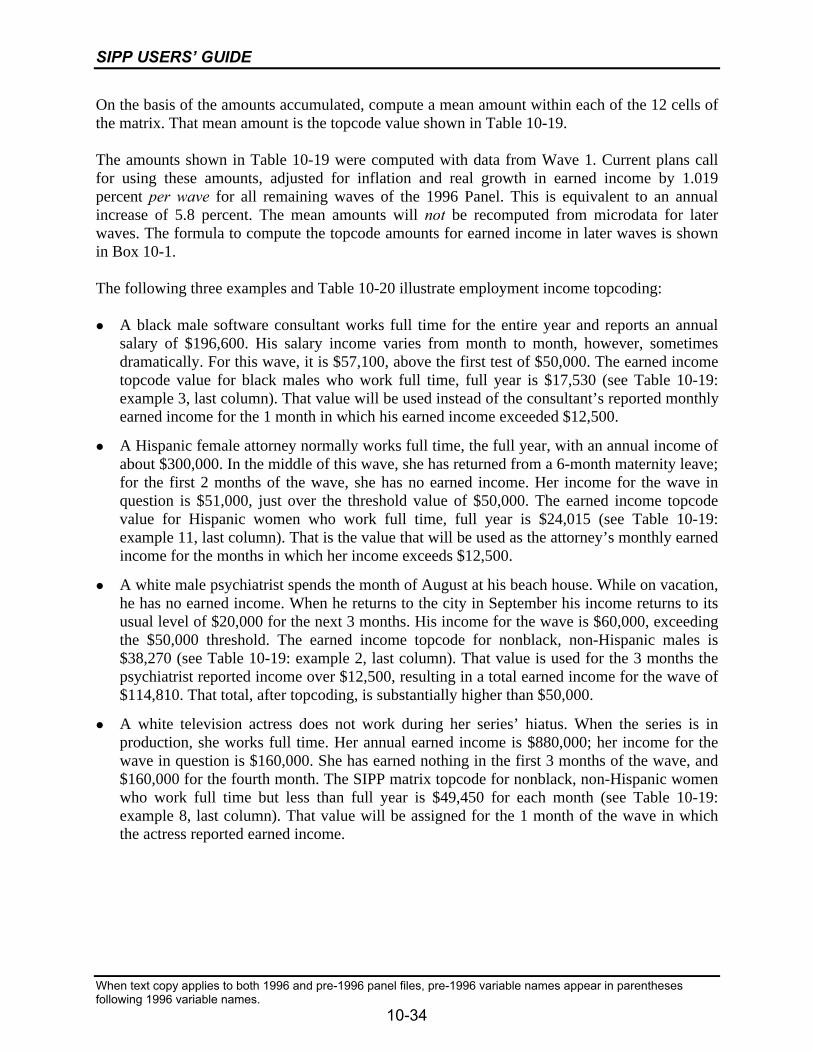
10-20 Example of Employment Income Topcoding in the 1996 Panel .........................10-35
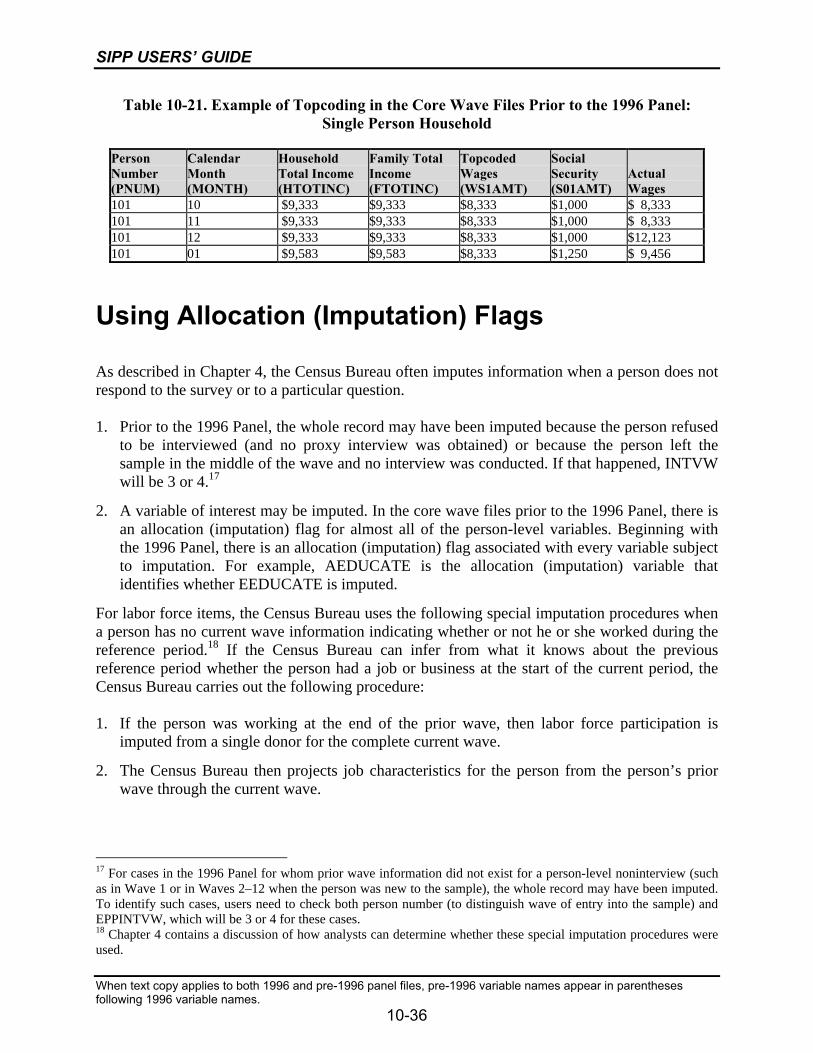
10-21 Example of Topcoding in the Core Wave Files Prior to the 1996 Panel:Single Person Household .....................................................................................10-36
CONTENTS
vii
Table Page
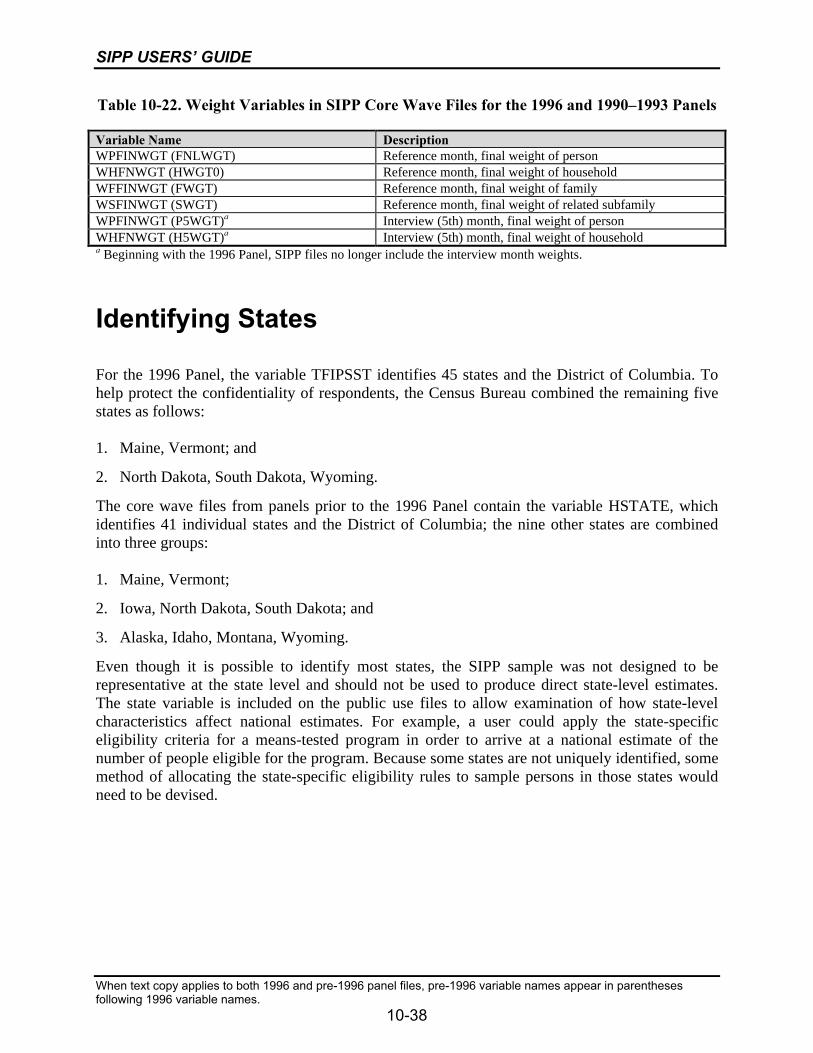
10-22 Weight Variables in SIPP Core Wave Files for the 1996 and1990–1993 Panels ................................................................................................10-38
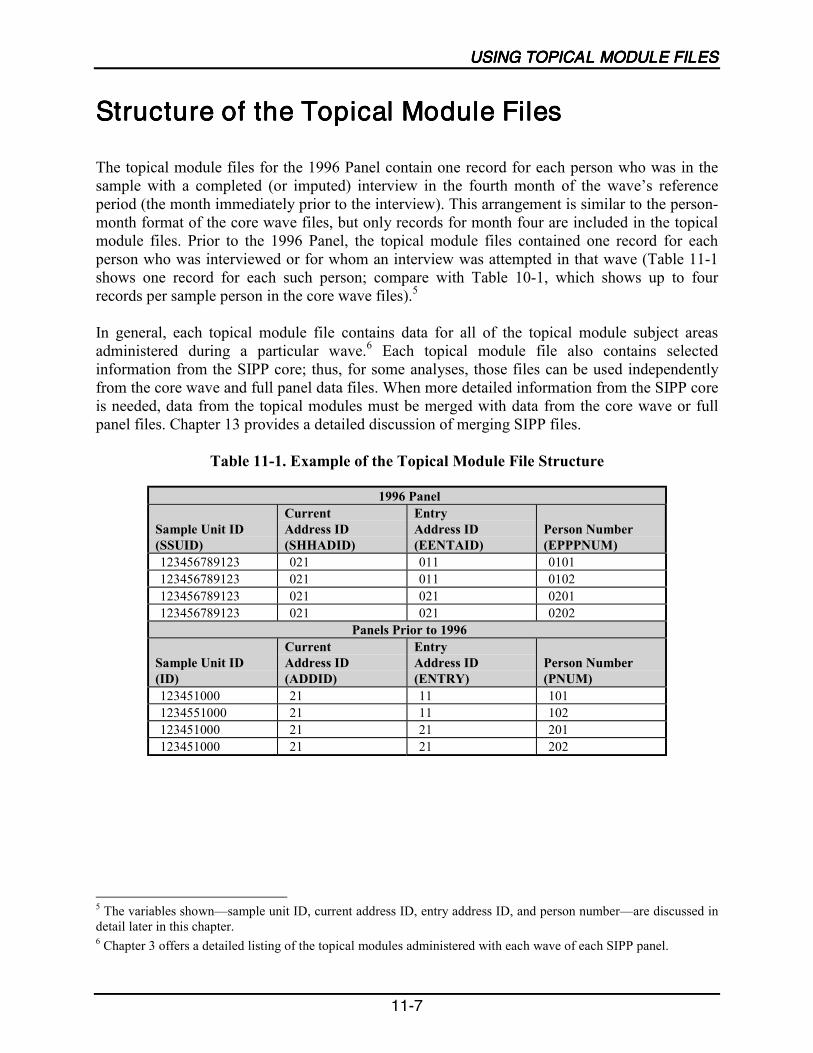
11-1 Example of the Topical Module File Structure......................................................11-7
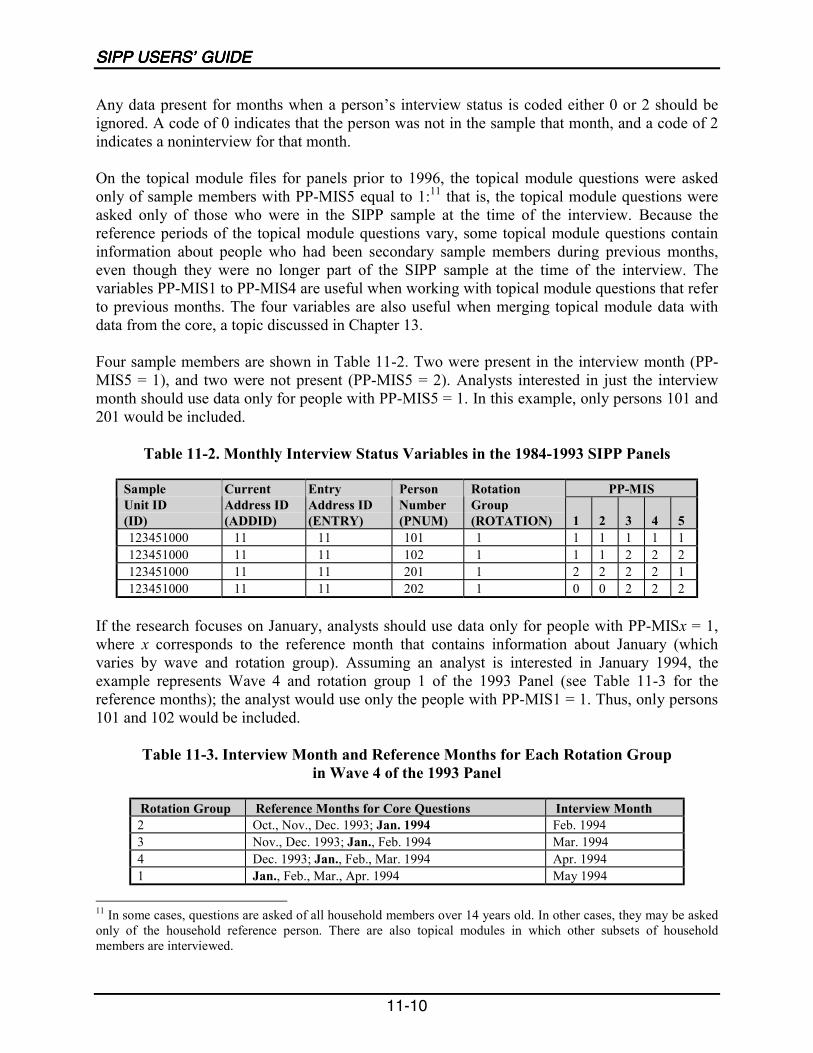
11-2 Monthly Interview Status Variables in the 1984–1993 SIPP Panels...................11-10
11-3 Interview Month and Reference Months for Each Rotation Group inWave 4 of the 1993 Panel ....................................................................................11-10
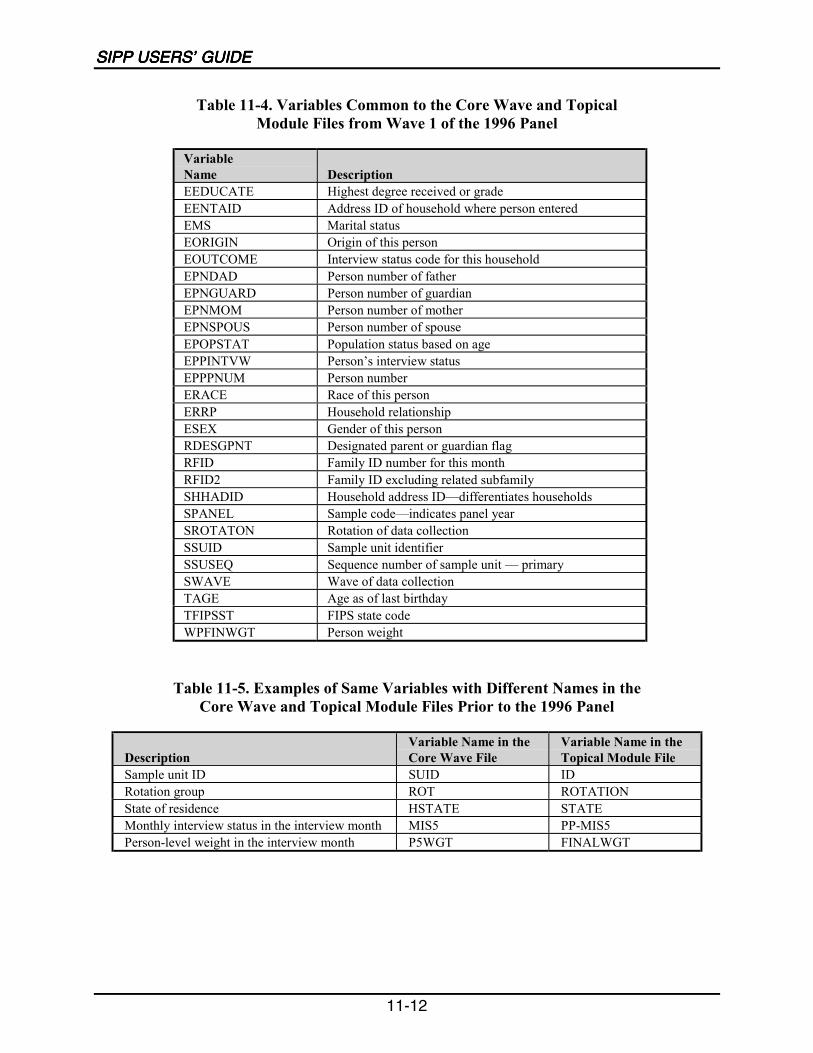
11-4 Variables Common to the Core Wave and Topical Module Files fromWave 1 of the 1996 Panel ....................................................................................11-12
11-5 Examples of Same Variables with Different Names in the Core Waveand Topical Module Files Prior to the 1996 Panel ..............................................11-12
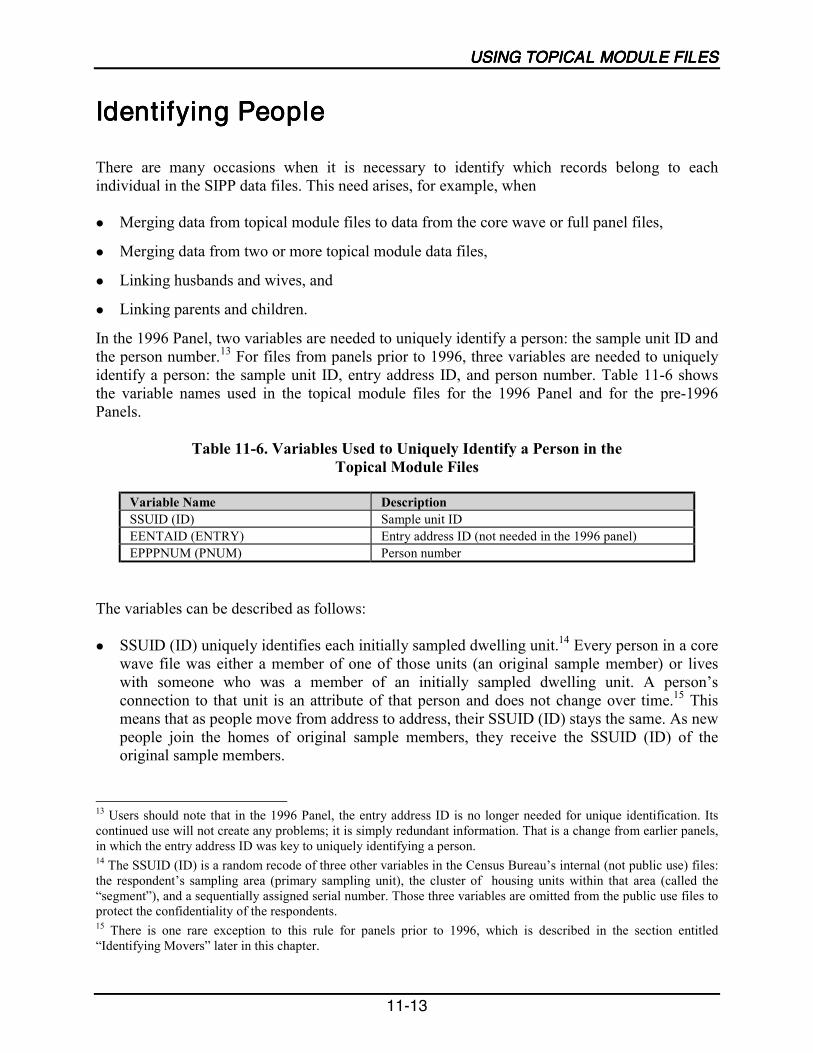
11-6 Variables Used to Uniquely Identify a Person in the Topical Module Files .......11-13
11-7 How to Uniquely Identify a Person in the Topical Module Files ........................11-15
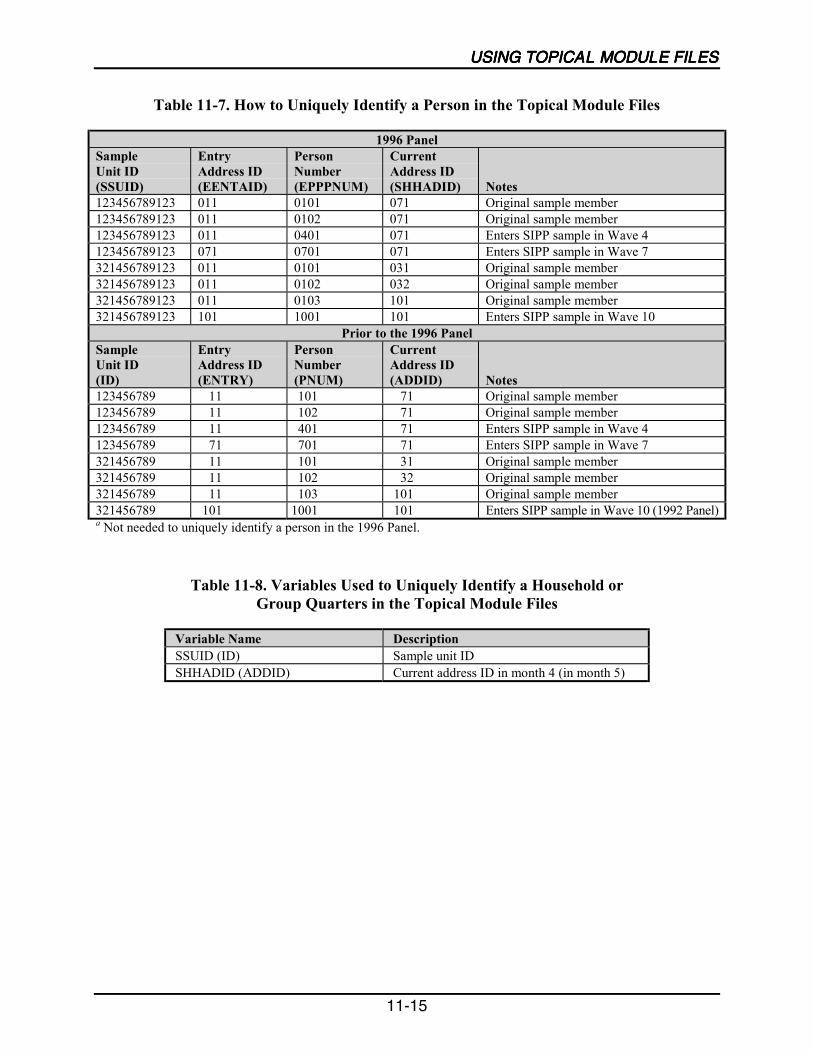
11-8 Variables Used to Uniquely Identify a Household or Group Quartersin the Topical Module Files .................................................................................11-15
11-9 How to Uniquely Identify a Household in the Topical Module Files..................11-16
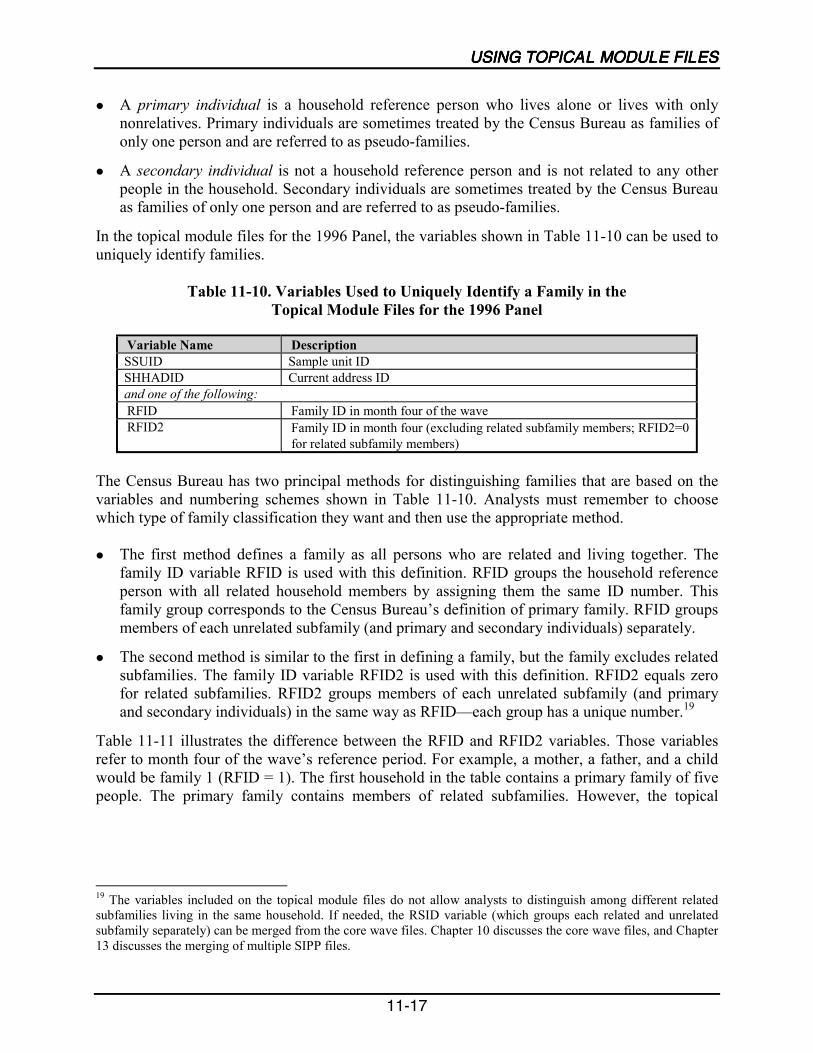
11-10 Variables Used to Uniquely Identify a Family in the Topical Module Filesfor the 1996 Panel ................................................................................................11-17
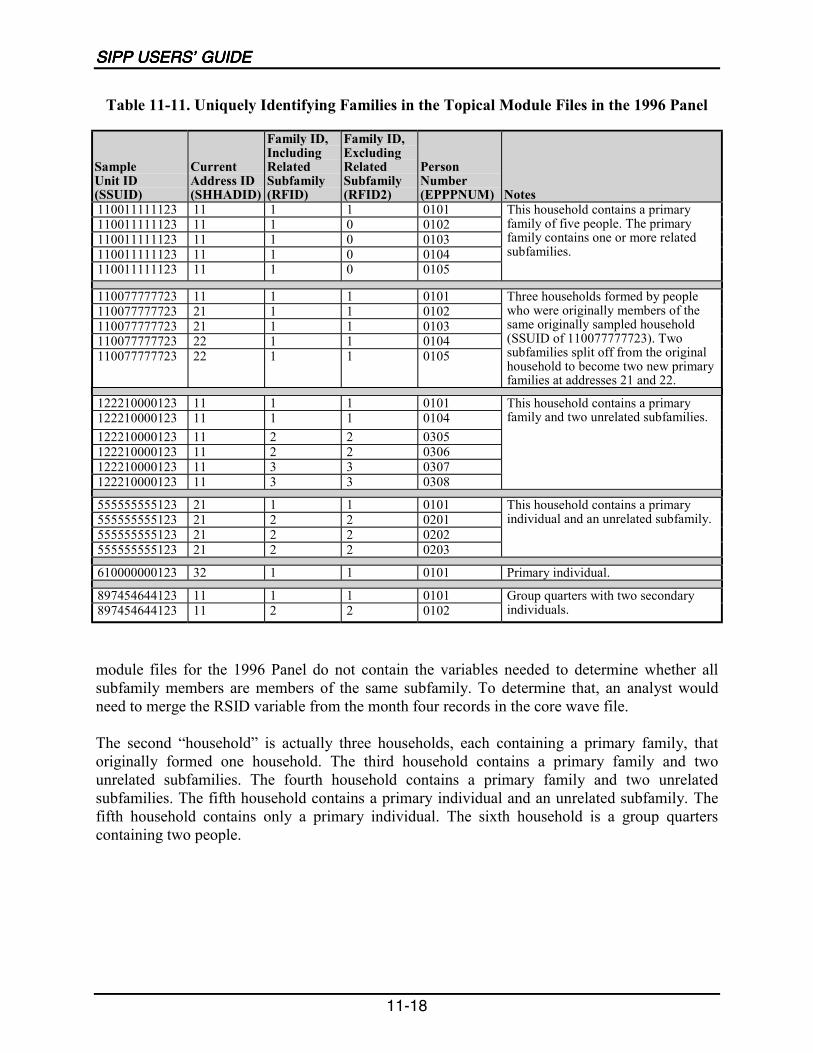
11-11 Uniquely Identifying Families in the Topical Module Files in the 1996 Panel...11-18
11-12 Household and Family Composition Variables in the Topical Module Files......11-19
11-13 Relationship to the Household Reference Person in the Topical Module Files ..11-20
11-14 ERRP (RRP) Coding for the Same Three-Generation Household WhenTwo Different People Are Designated as the Reference Person in theTopical Module Files ...........................................................................................11-21
11-15 Identifying Households Containing Three Generations in theTopical Module Files ...........................................................................................11-22
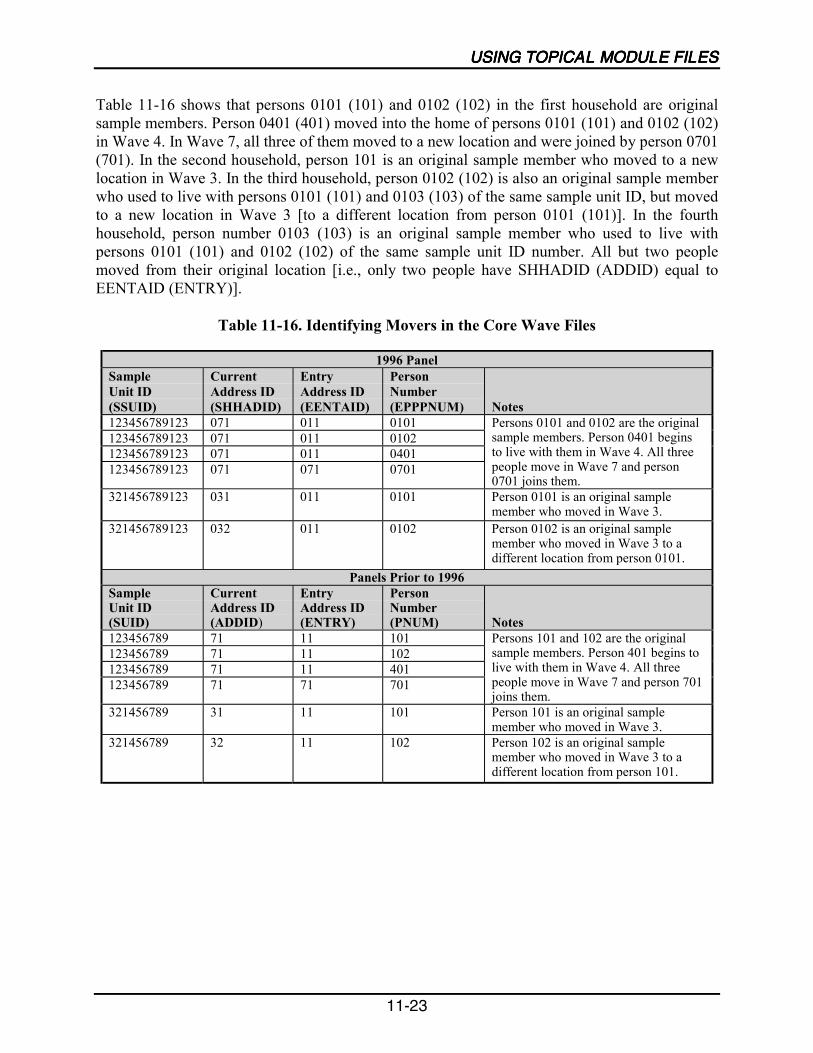
11-16 Identifying Movers in the Core Wave Files.........................................................11-23
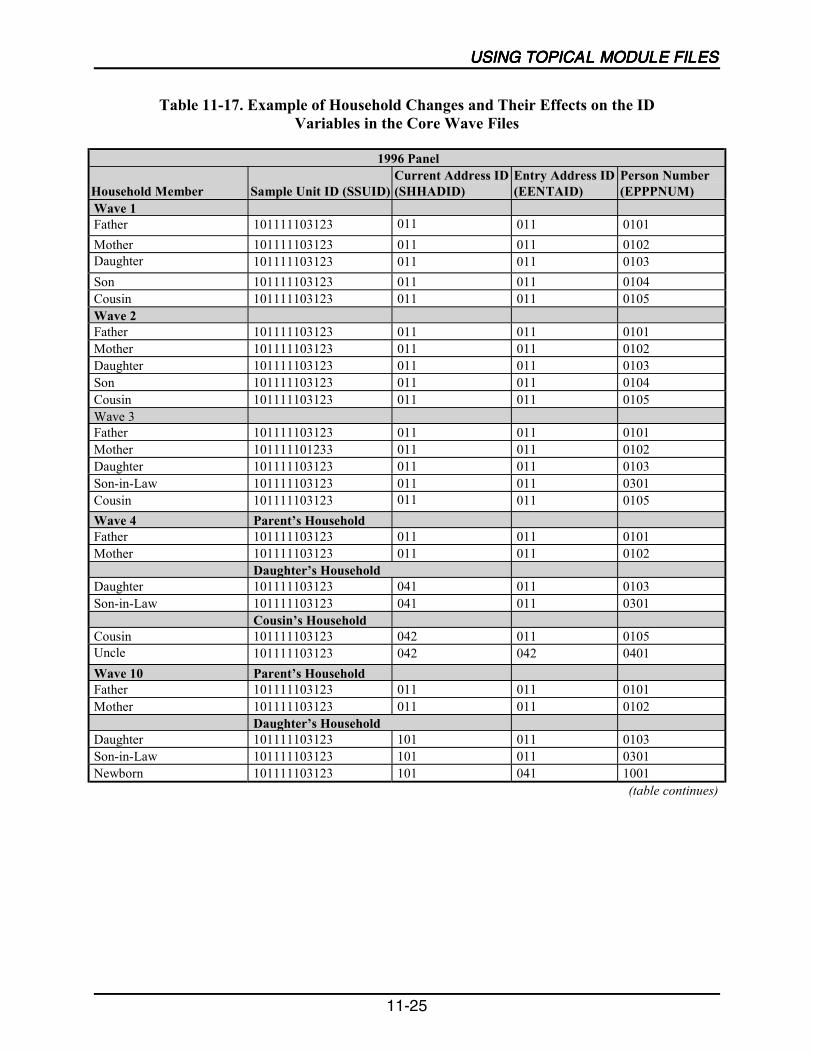
11-17 Example of Household Changes and Their Effects on the ID Variablesin the Core Wave Files.........................................................................................11-25
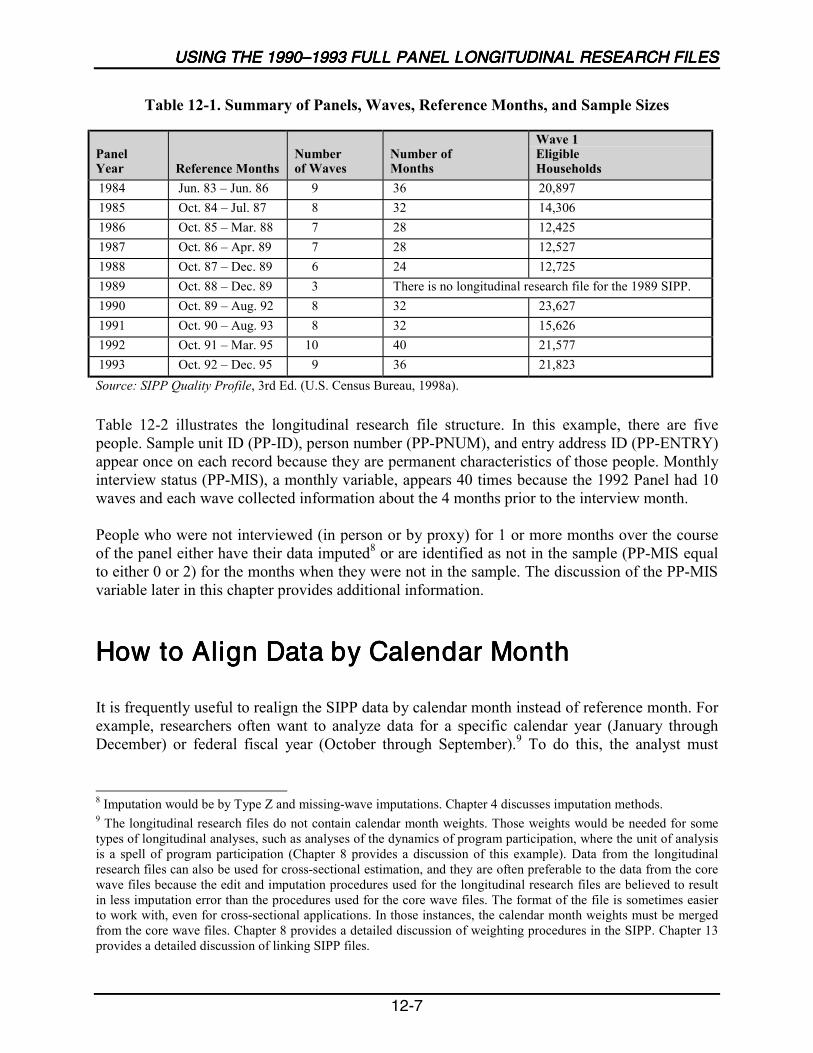
12-1 Summary of Panels, Waves, Reference Months, and Sample Sizes......................12-7
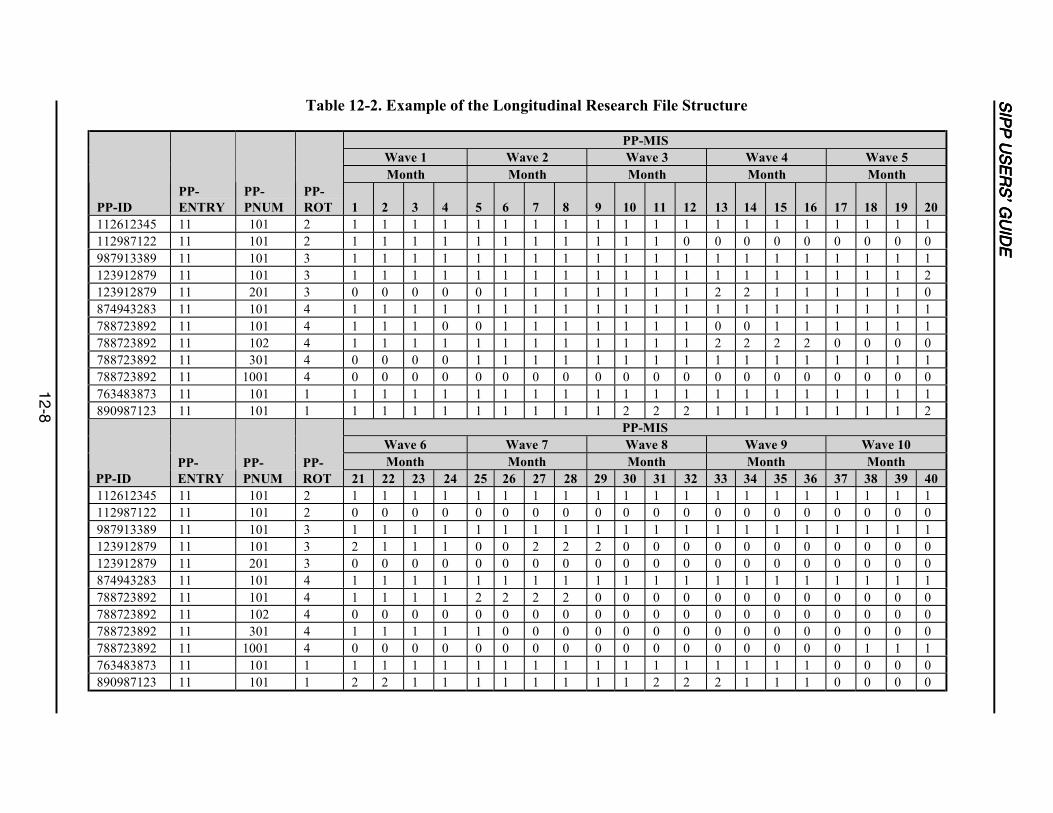
12-2 Example of the Longitudinal Research File Structure ...........................................12-8
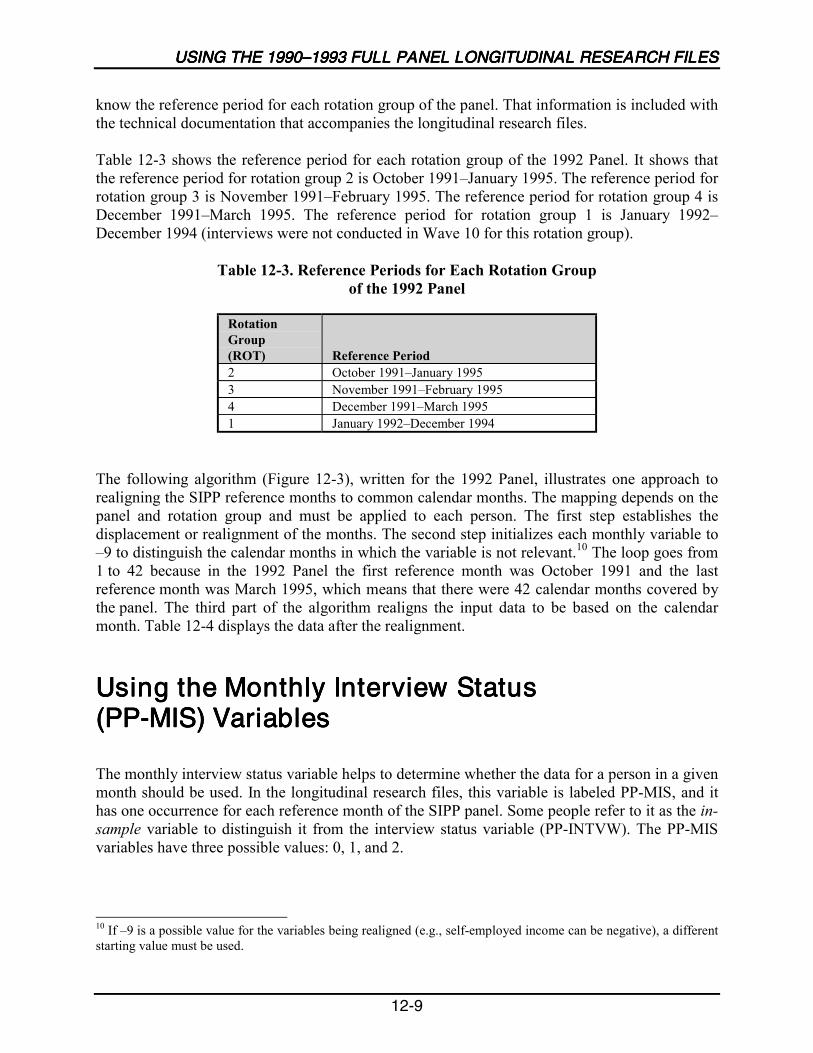
12-3 Reference Periods for Each Rotation Group of the 1992 Panel.............................12-9
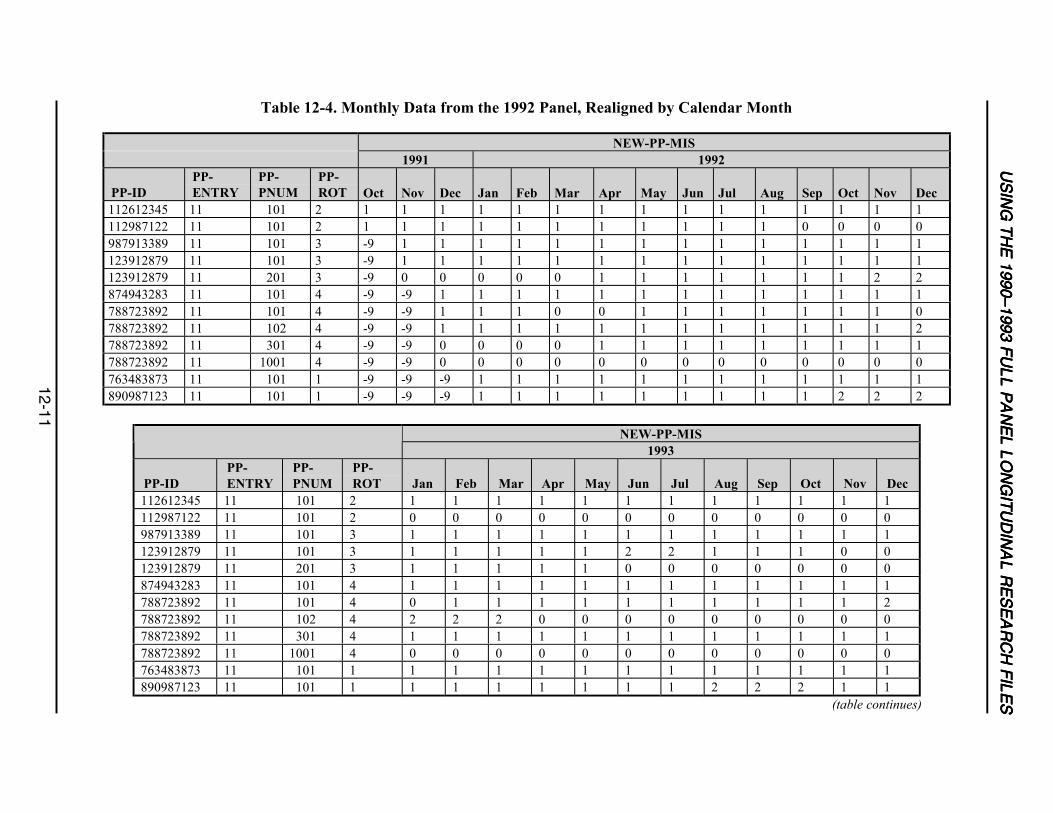
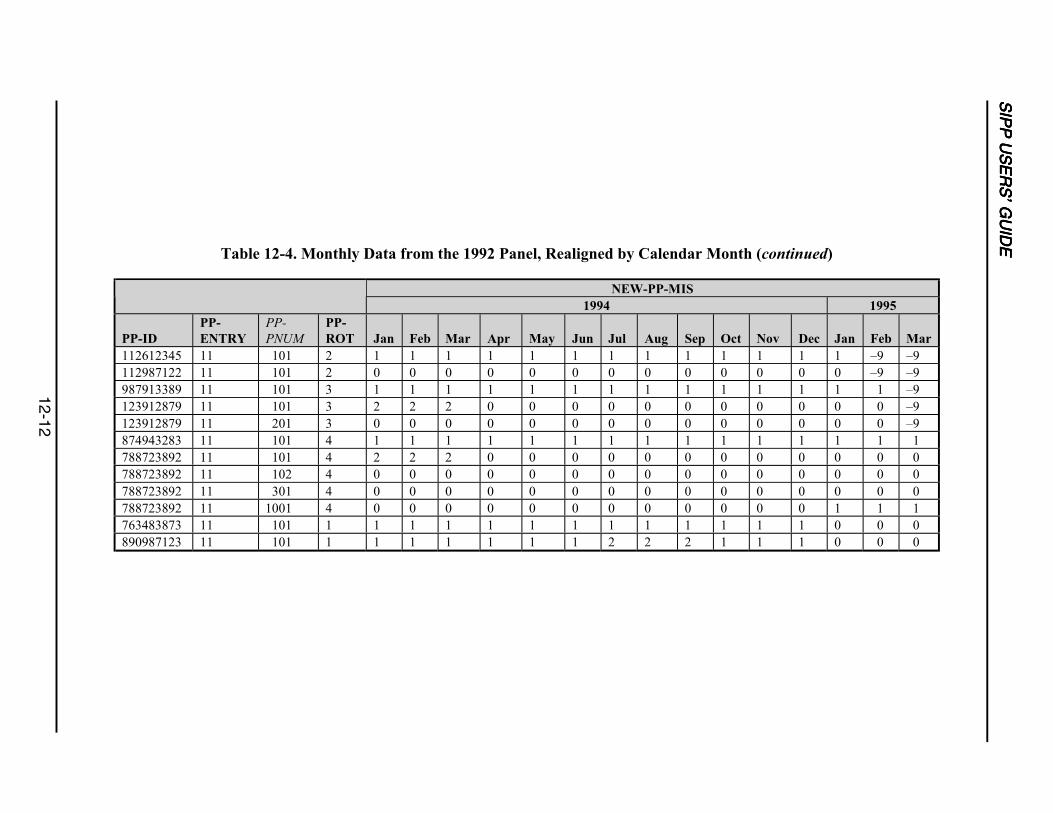
12-4 Monthly Data from the 1992 Panel, Realigned by Calendar Month ...................12-11
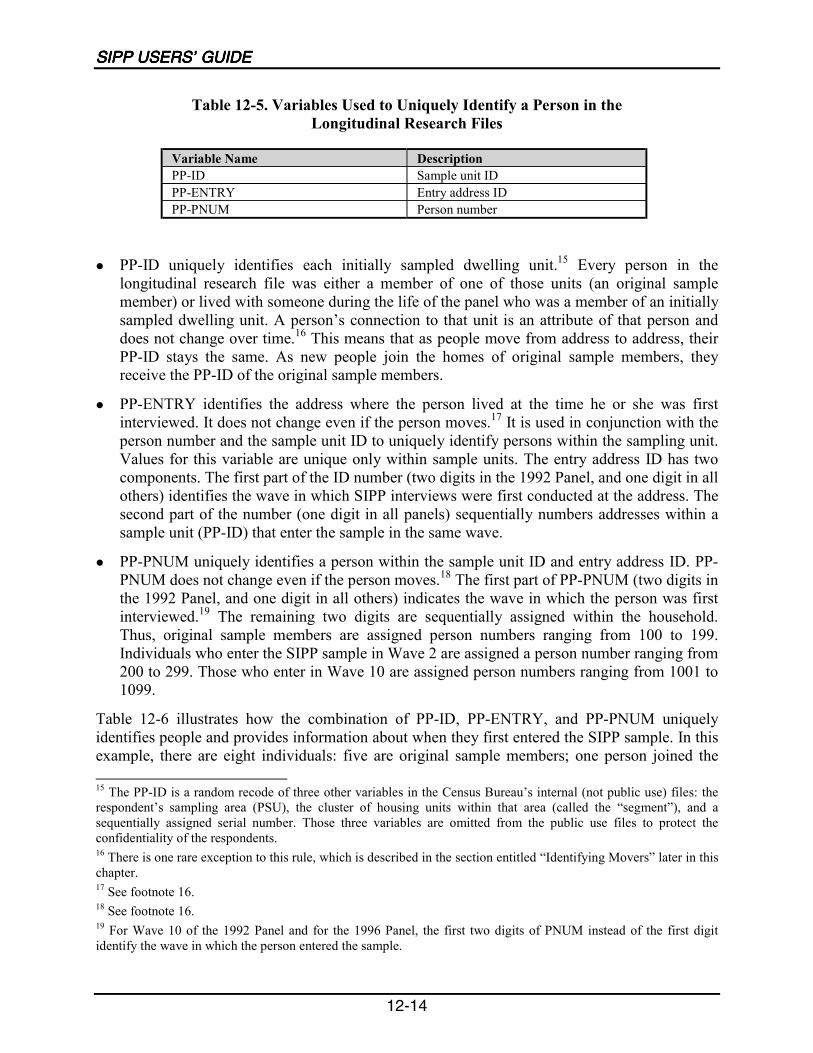
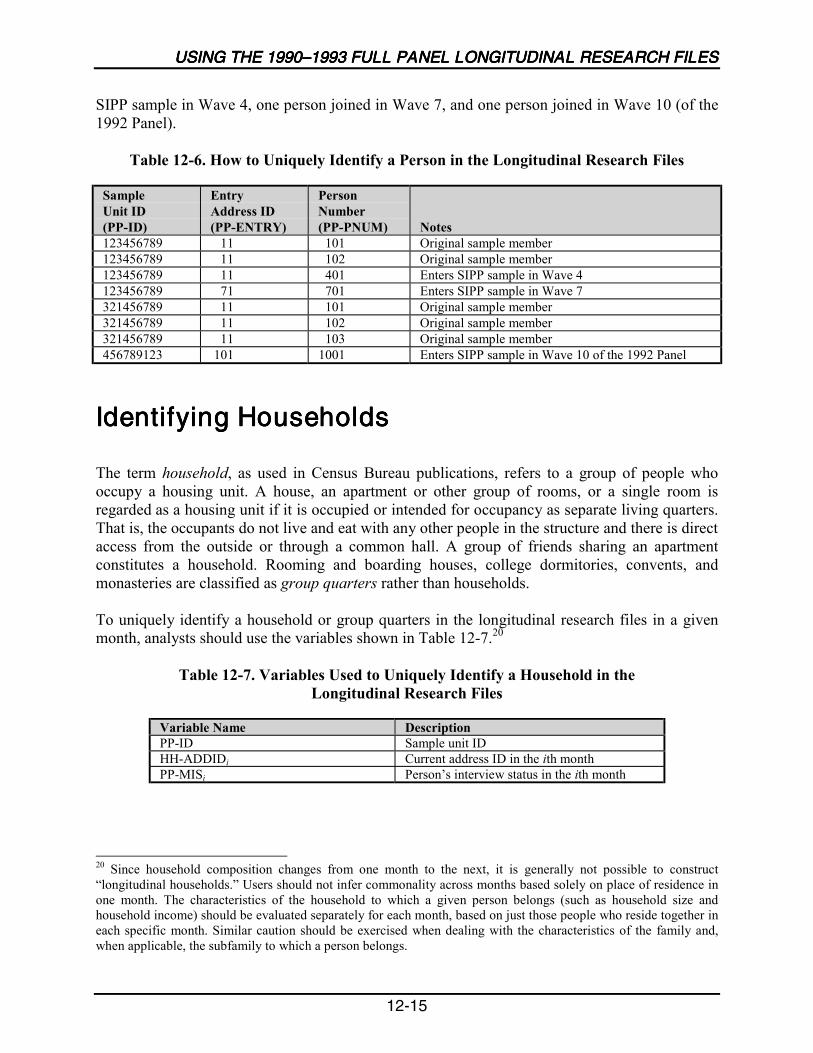
12-5 Variables Used to Uniquely Identify a Person in theLongitudinal Research Files ................................................................................12-14
SIPP USERS’ GUIDE
viii
Table Page
12-6 How to Uniquely Identify a Person in the Longitudinal Research Files .............12-15
12-7 Variables Used to Uniquely Identify a Household in theLongitudinal Research Files ................................................................................12-15
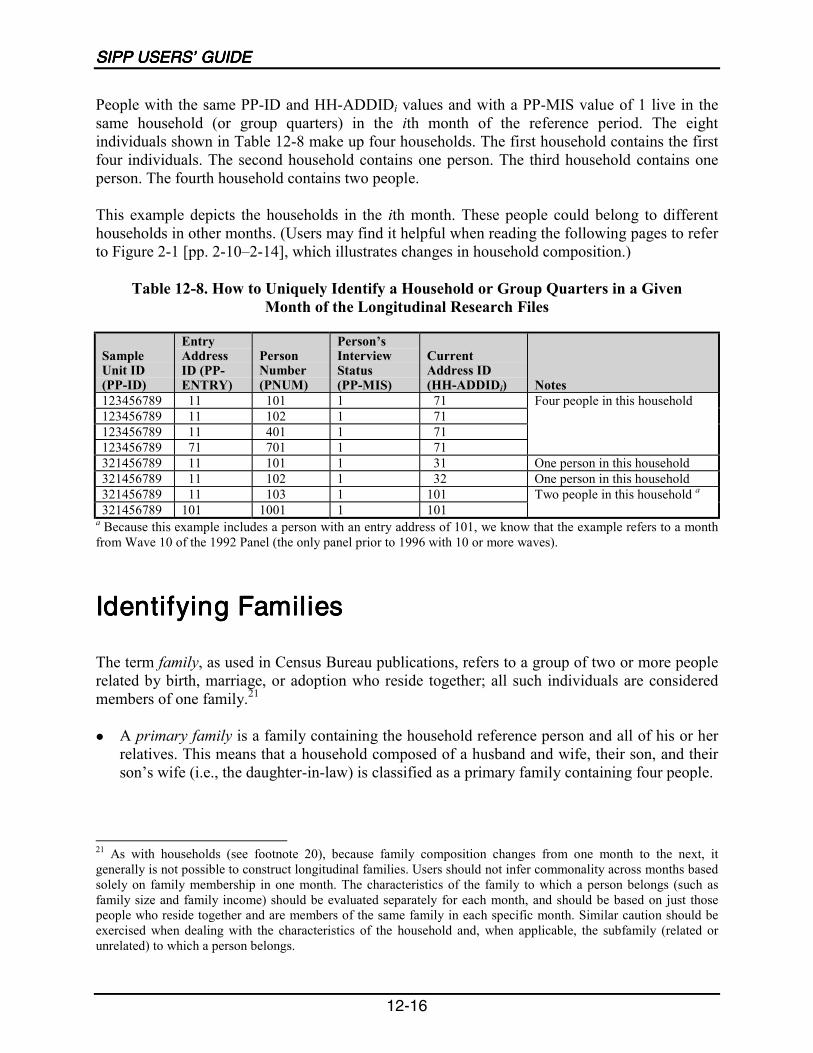
12-8 How to Uniquely Identify a Household or Group Quarters in a GivenMonth of the Longitudinal Research Files...........................................................12-16
12-9 Variables Used to Identify Families in the Longitudinal Research Files ............12-18
12-10 How to Uniquely Identify a Family in a Given Month of theLongitudinal Research Files ................................................................................12-20
12-11 Variables Used to Describe Household Composition in theLongitudinal Research Files ................................................................................12-21
12-12 Relationship to the Household Reference Person in a Given Month...................12-21
12-13 Using RRP to Identify Households Containing Three Generationsin the Longitudinal Research Files ......................................................................12-22
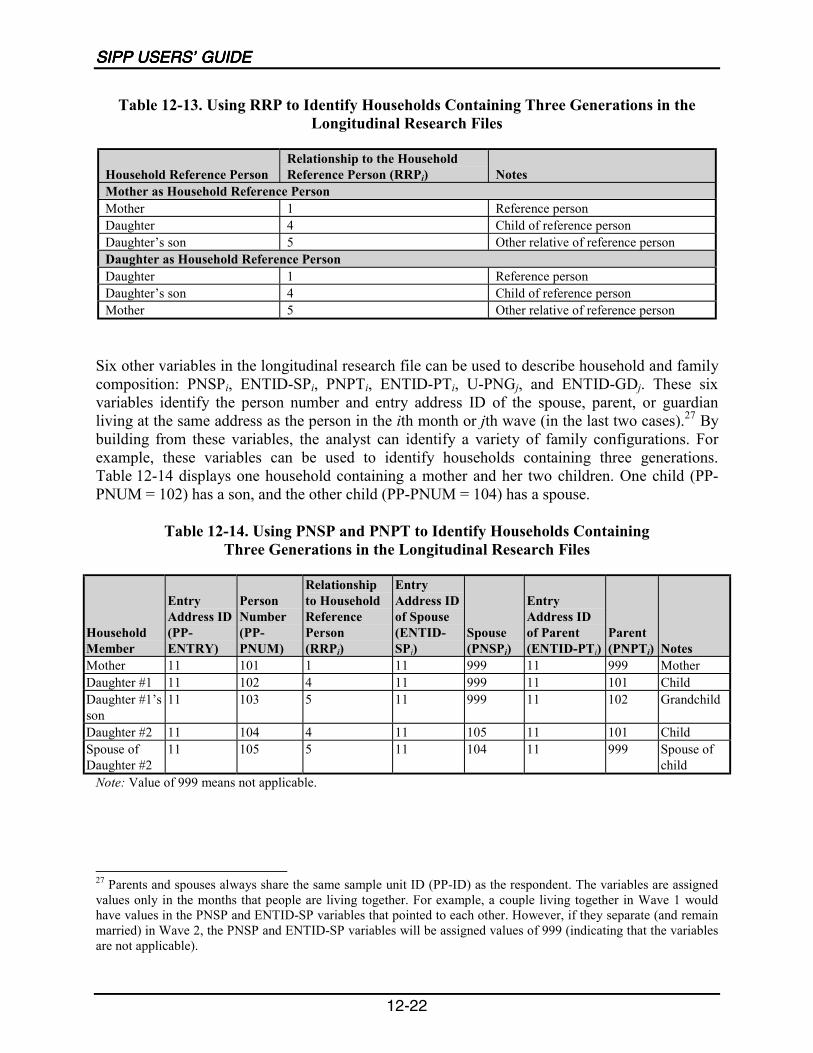
12-14 Using PNSP and PNPT to Identify Households ContainingThree Generations in the Longitudinal Research Files........................................12-22
12-15 Family Income in the Longitudinal Research Files .............................................12-23
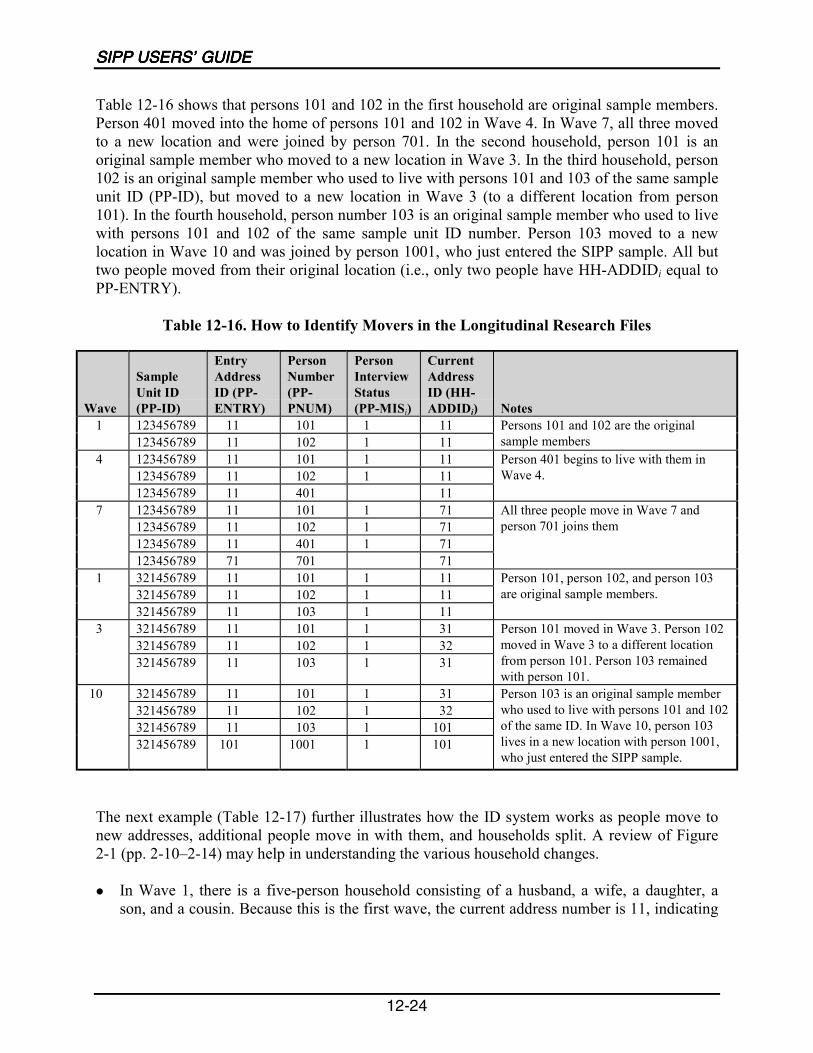
12-16 How to Identify Movers in the Longitudinal Research Files...............................12-24
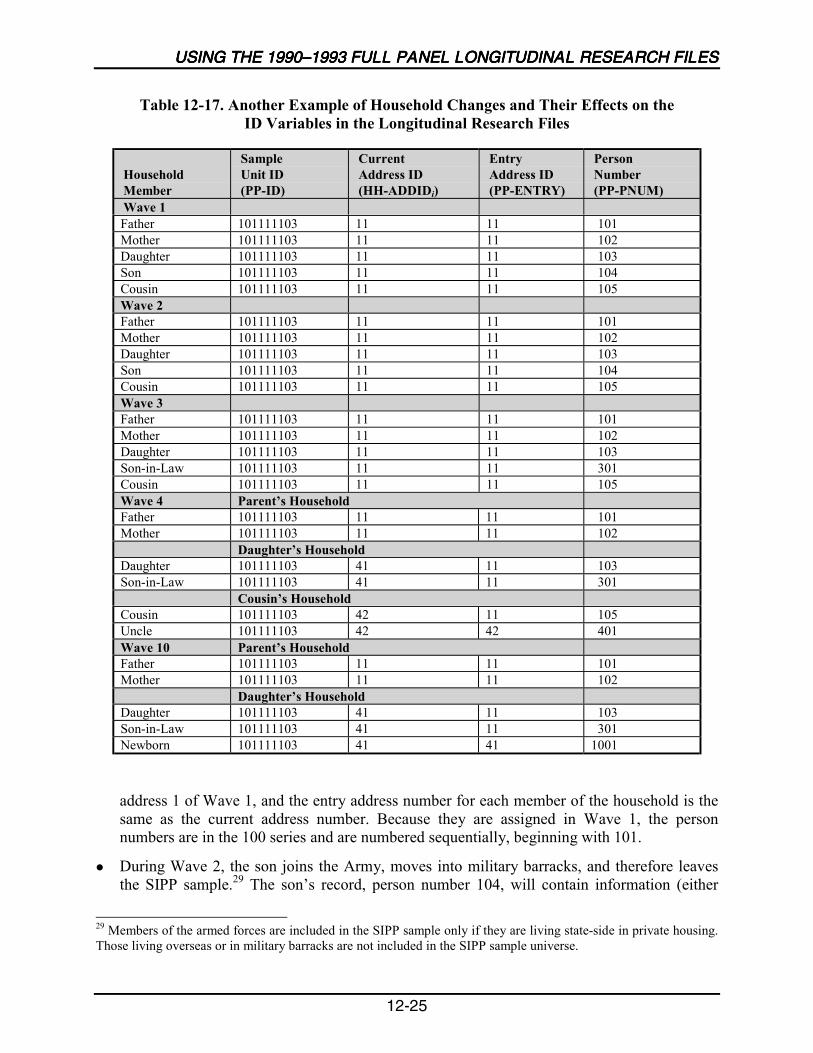
12-17 Another Example of Household Changes and Their Effects on theID Variables in the Longitudinal Research Files .................................................12-25
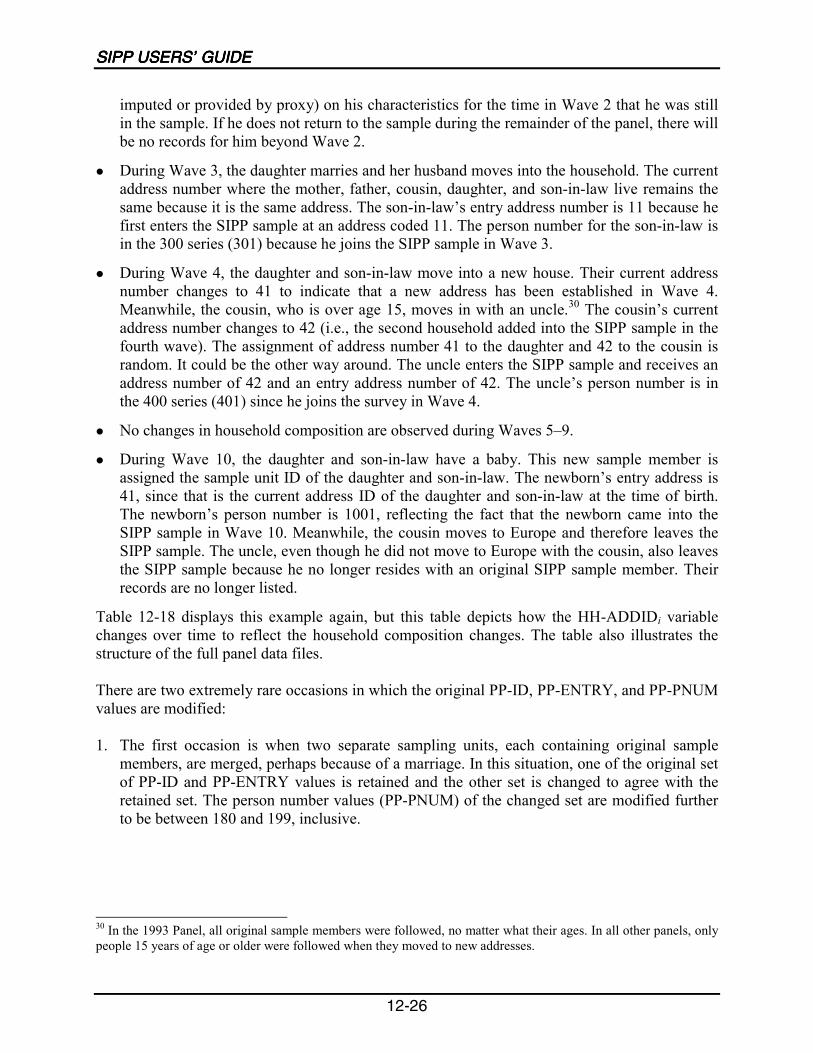
12-18 Household Changes and Their Effects on the Household ID (HH-ADDIDi)Variable in the Longitudinal Research File .........................................................12-27
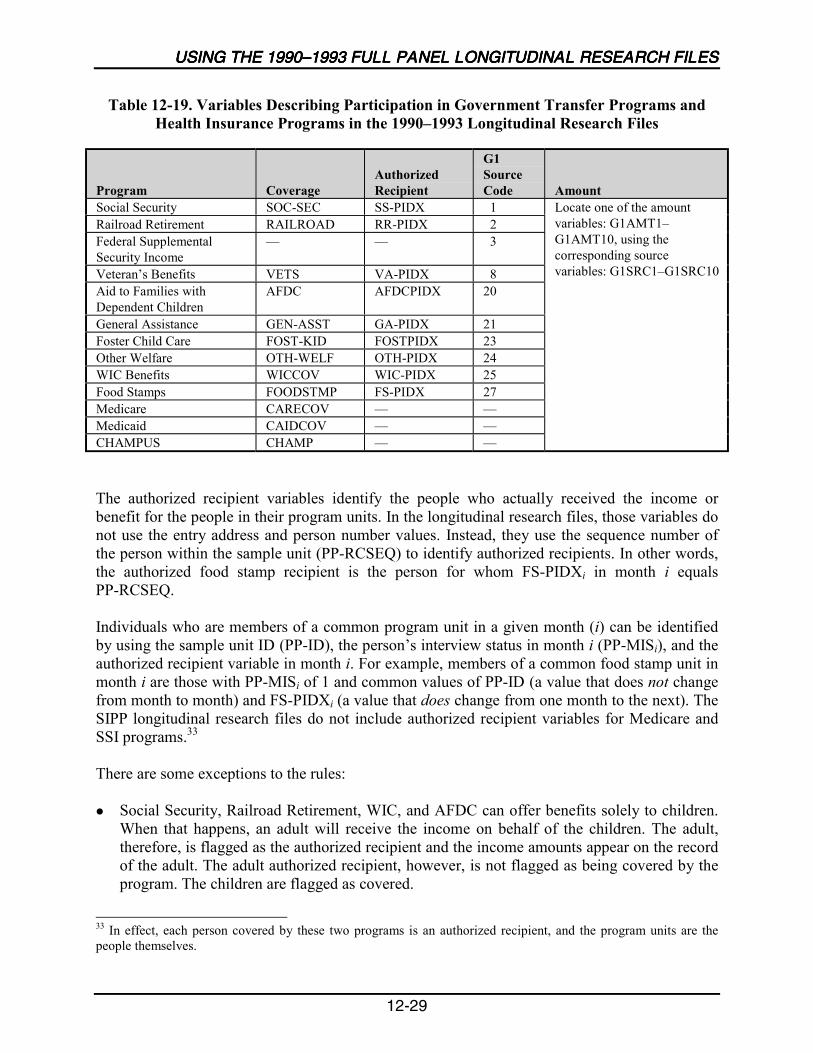
12-19 Variables Describing Participation in Government Transfer Programs andHealth Insurance Programs in the 1990–1993 Longitudinal Research Files .......12-29
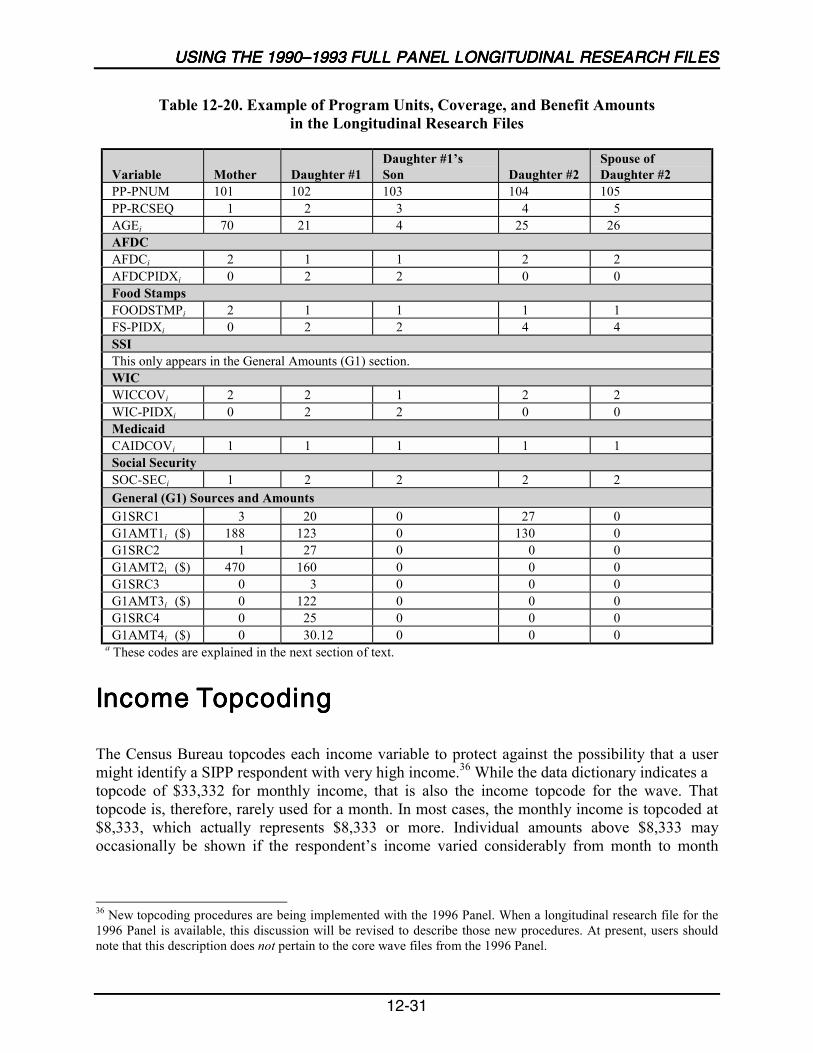
12-20 Example of Program Units, Coverage, and Benefit Amounts in theLongitudinal Research Files ................................................................................12-31
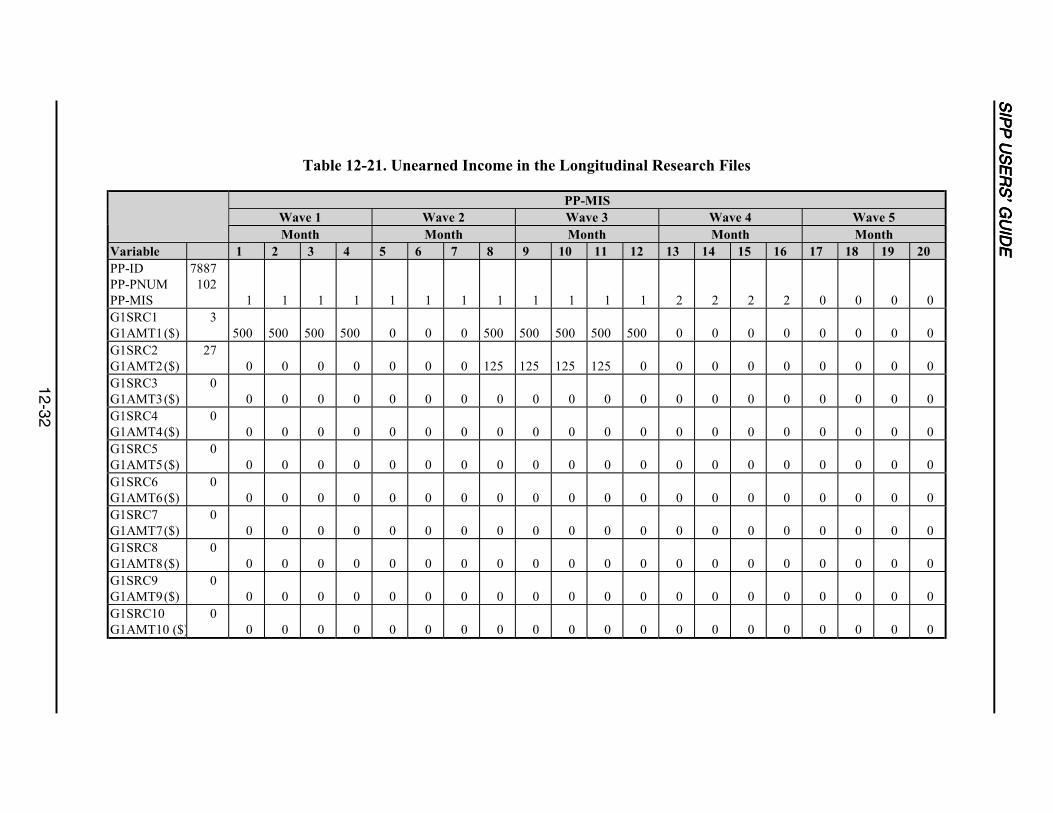
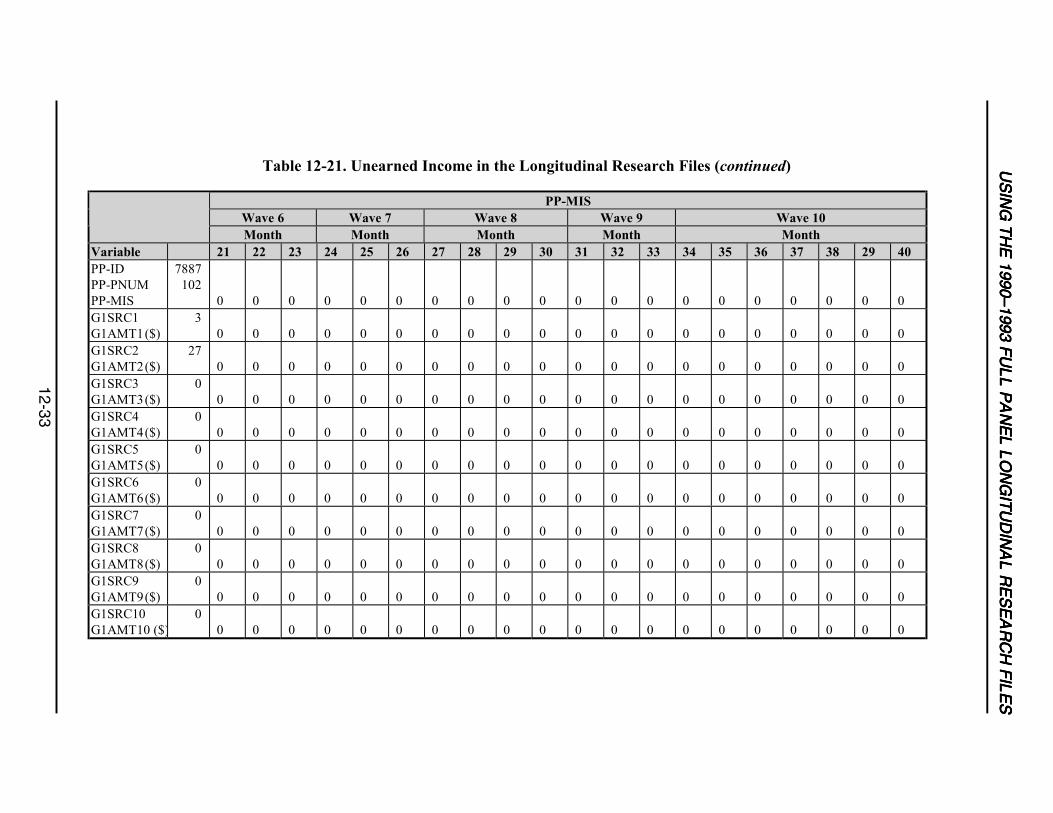
12-21 Unearned Income in the Longitudinal Research Files .........................................12-32
12-22 User-Created SSI and FSP Variables Using the Unearned Income Variablesin the Longitudinal Research Files ......................................................................12-34
12-23 Example of Topcoding in the Longitudinal Research Files.................................12-37
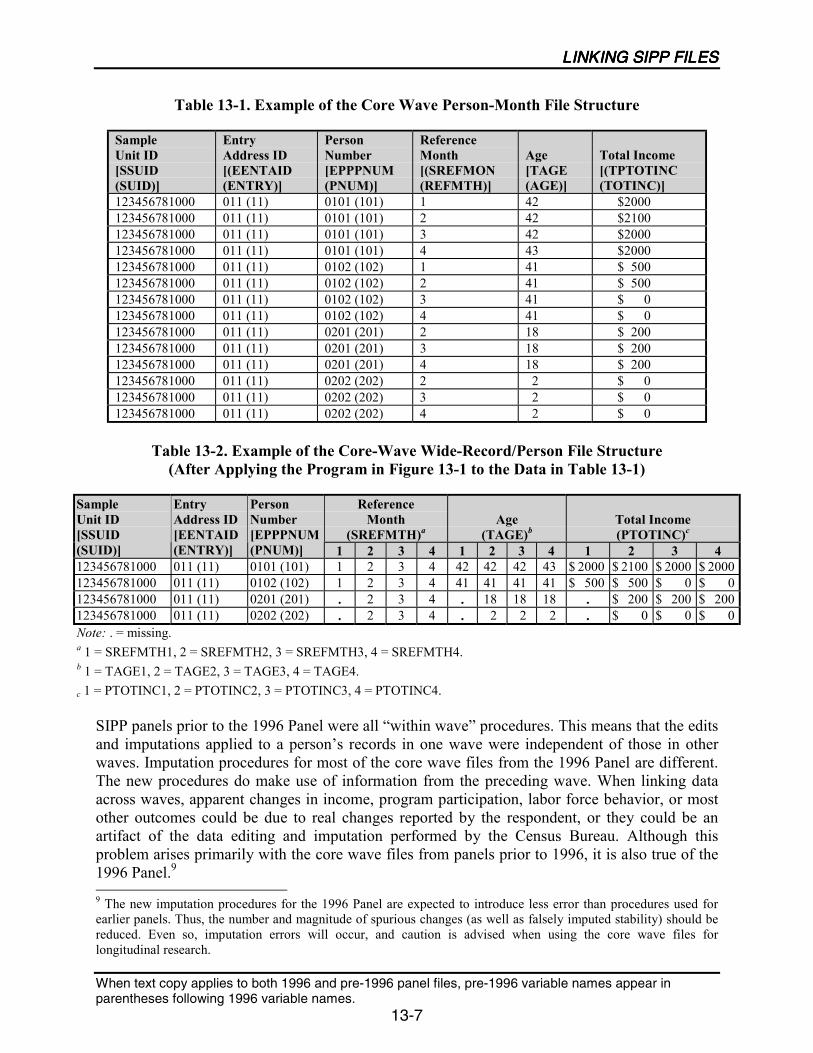
13-1 Example of the Core Wave Person-Month File Structure .....................................13-7
13-2 Example of the Core-Wave Wide-Record/Person File Structure(After Applying the Program in Figure 13-1 to the Data in 13-1).........................13-7
13-3 Variables Identifying People in the Core Wave and LongitudinalResearch Files for Panels Prior to 1996.................................................................13-9
CONTENTS
ix
Table Page
13-4 Variables Identifying People in the Topical Module and Core Wave Filesfor Panels Prior to 1996 .......................................................................................13-14
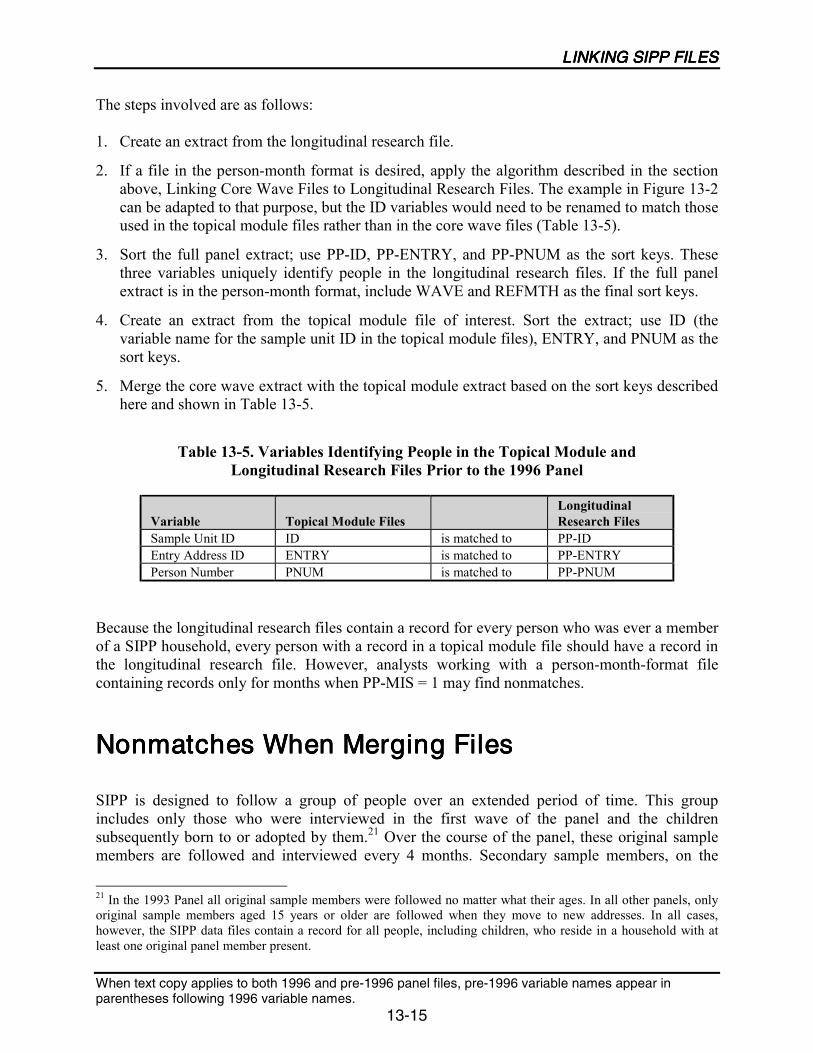
13-5 Variables Identifying People in the Topical Module andLongitudinal Research Files Prior to the 1996 Panel...........................................13-15
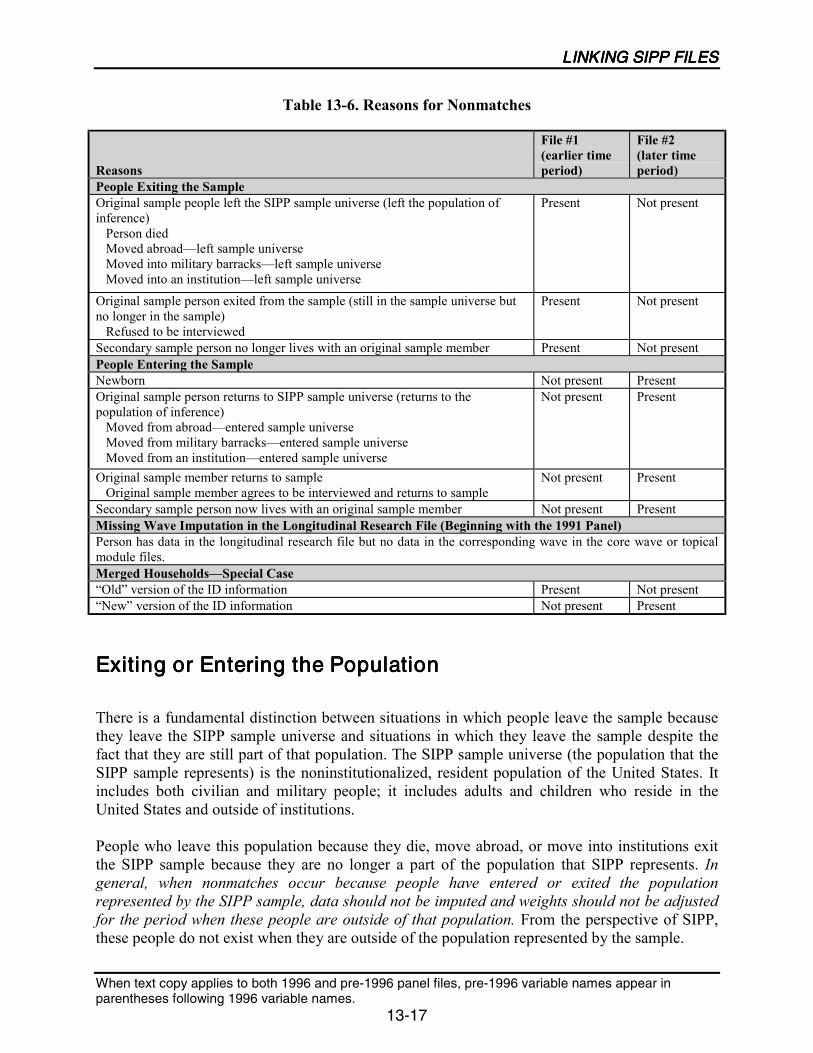
13-6 Reasons for Nonmatches......................................................................................13-17
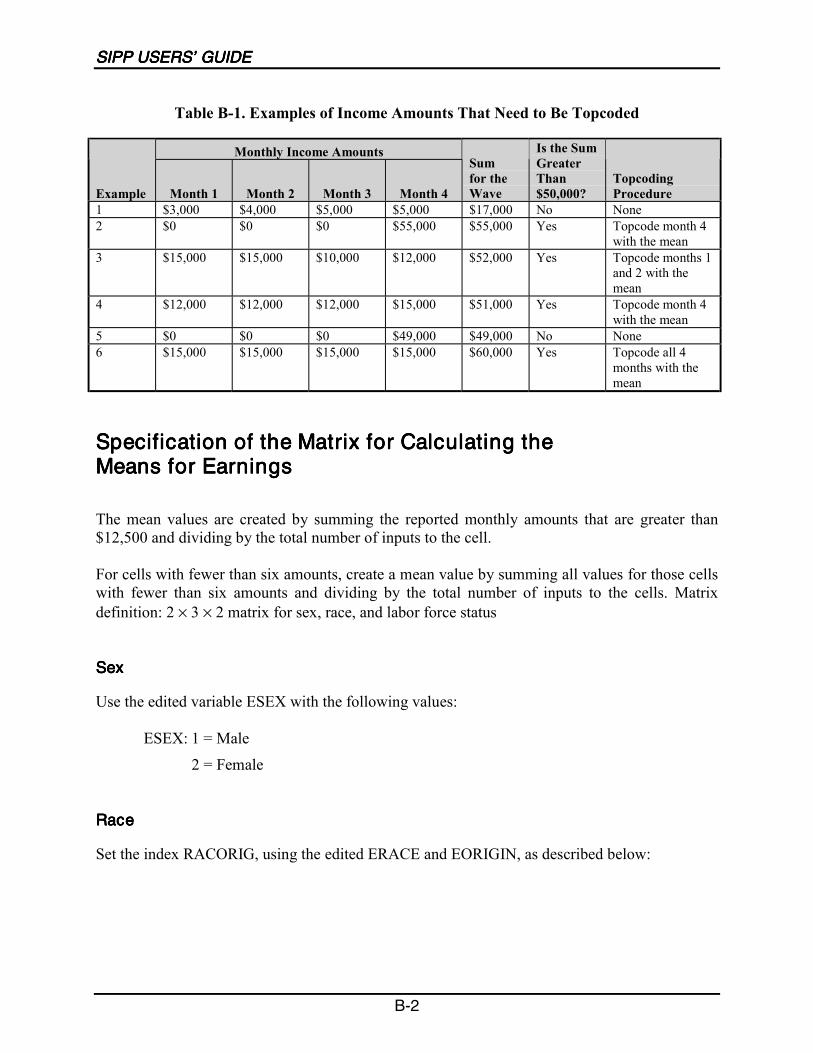
B-1 Examples of Income Amounts That Need to Be Topcoded ................................... B-2
4-1 Sequence of Cross-Sectional Imputation and Longitudinal Editing Procedures .....4-4
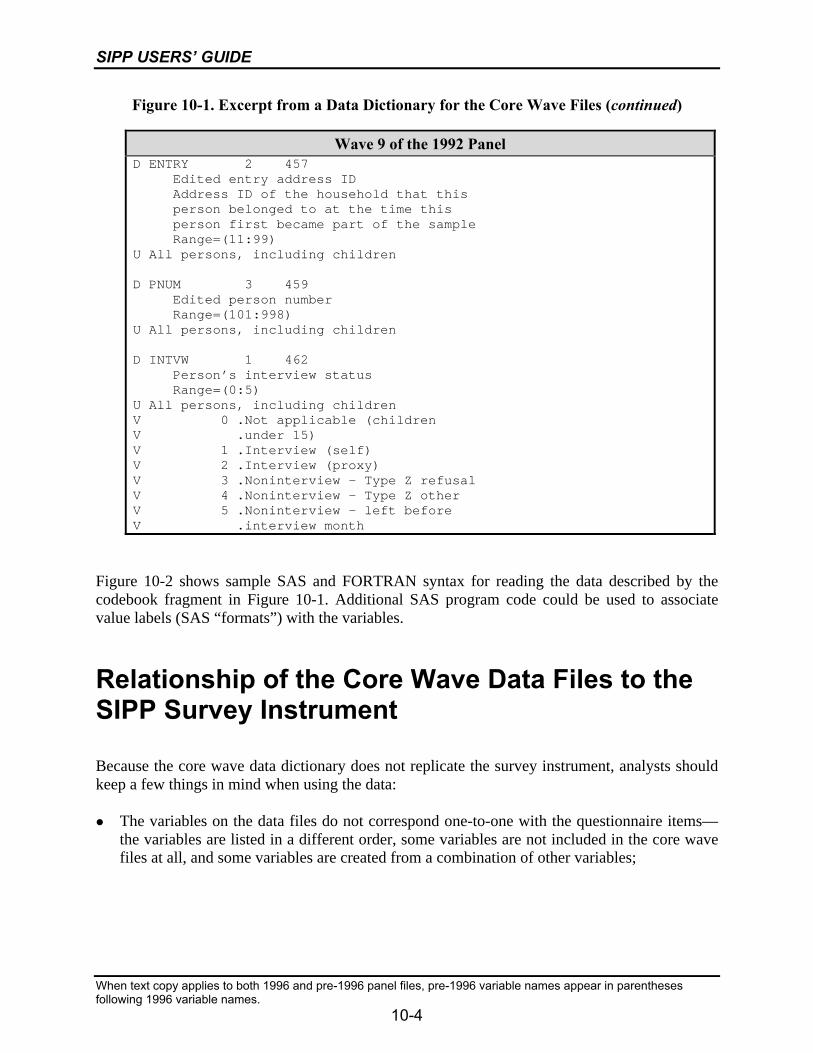
10-1 Excerpt from a Data Dictionary for the Core Wave Files .....................................10-3
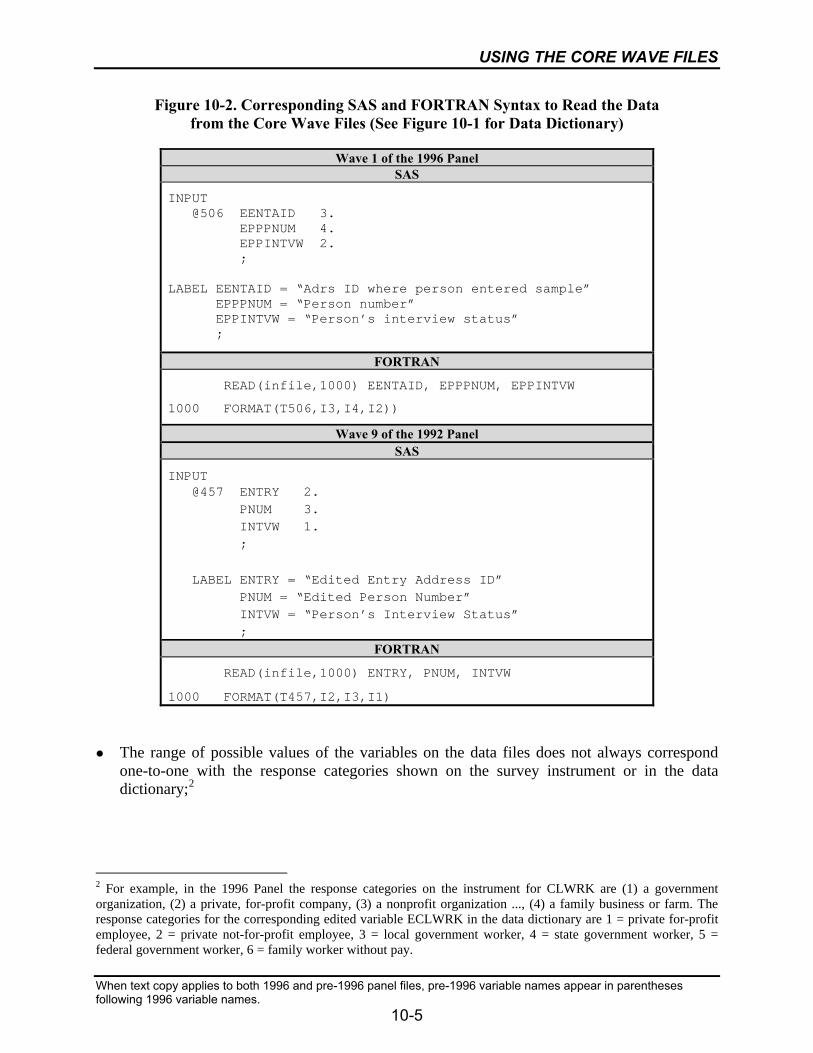
10-2 Corresponding SAS and FORTRAN Syntax to Read the Data from theCore Wave Files.....................................................................................................10-5
11-1 Excerpt from the Data Dictionary for the Topical Module Files...........................11-3
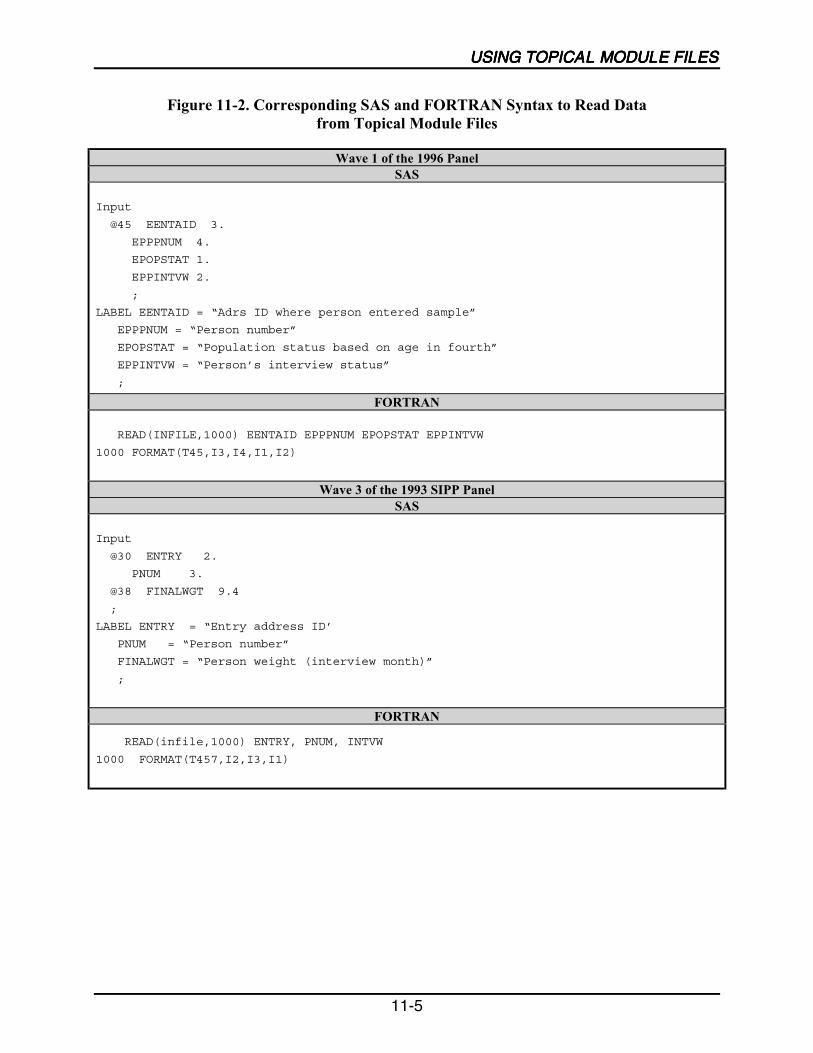
11-2 Corresponding SAS and FORTRAN Syntax to Read Data fromTopical Module Files .............................................................................................11-5
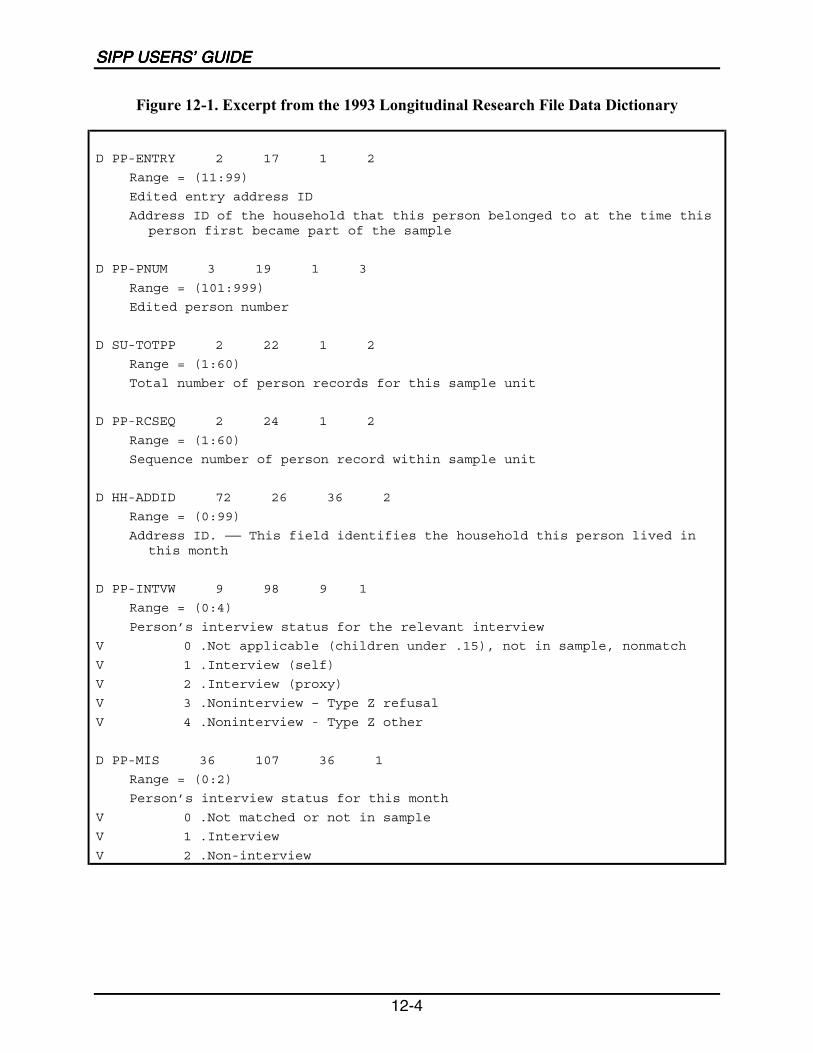
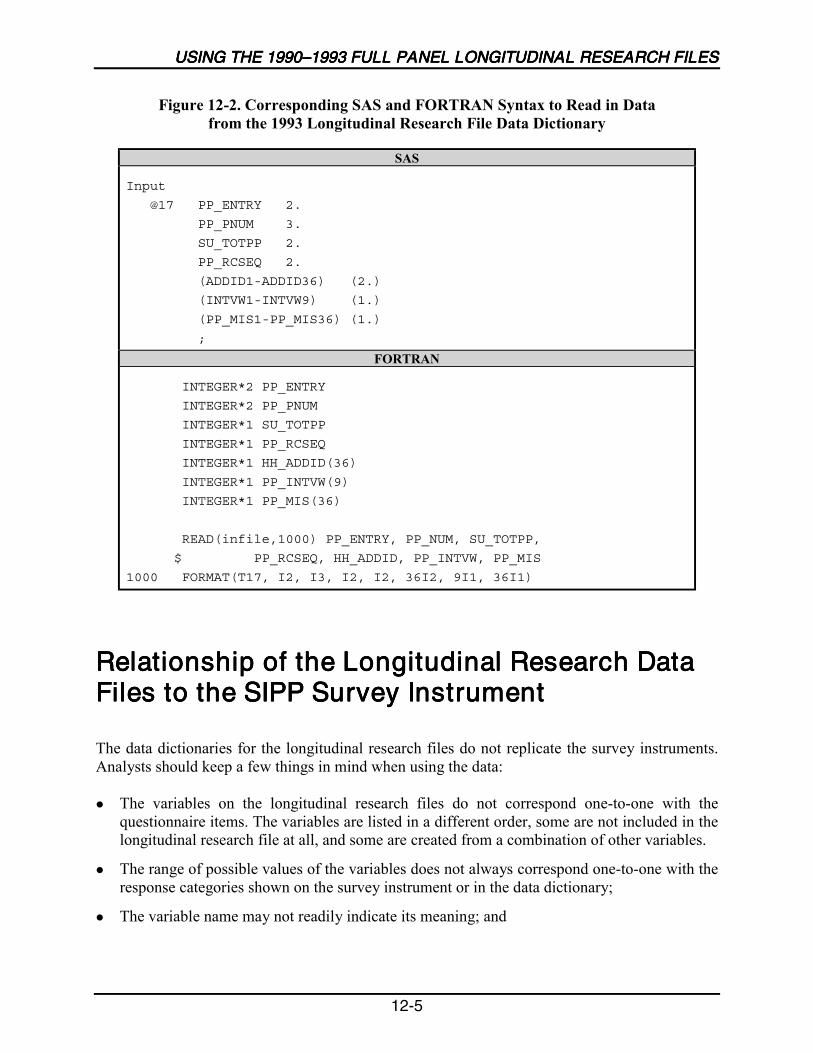
12-1 Excerpt from the 1993 Longitudinal Research File Data Dictionary ....................12-4
12-2 Corresponding SAS and FORTRAN Syntax to Read in Data from the 1993Longitudinal Research File Data Dictionary .........................................................12-5
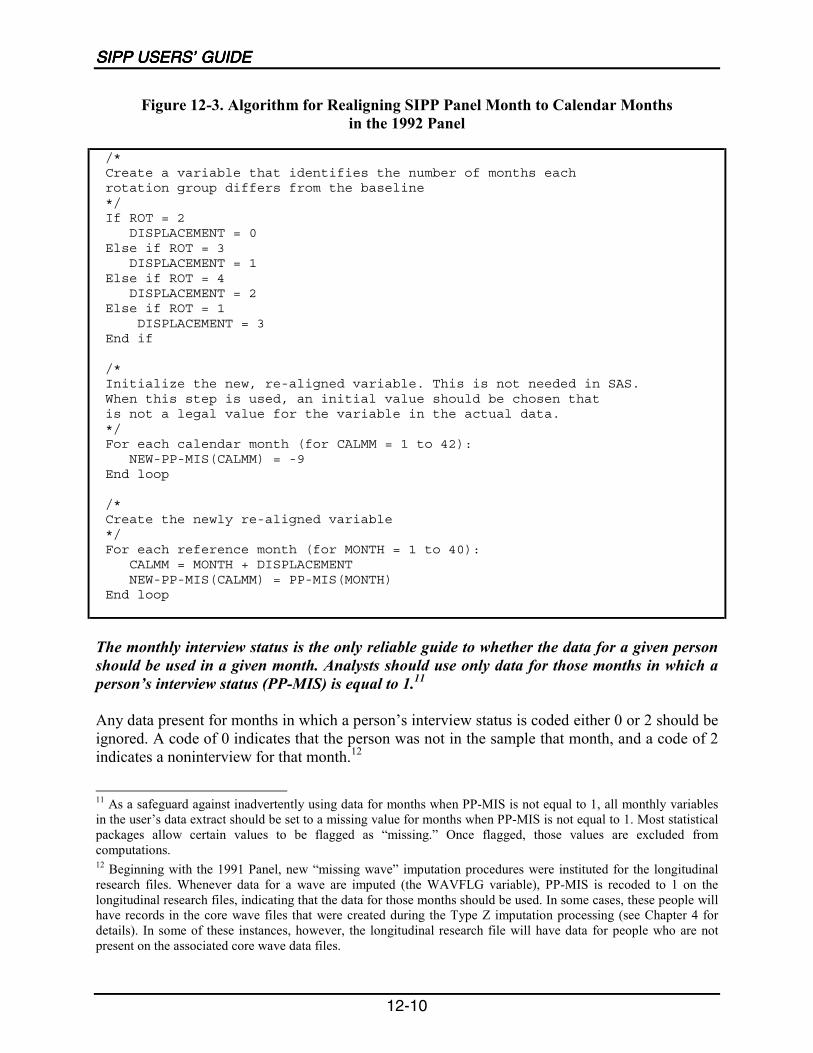
12-3 Algorithm for Realigning SIPP Panel Month to Calendar Monthsin the 1992 Panel..................................................................................................12-10
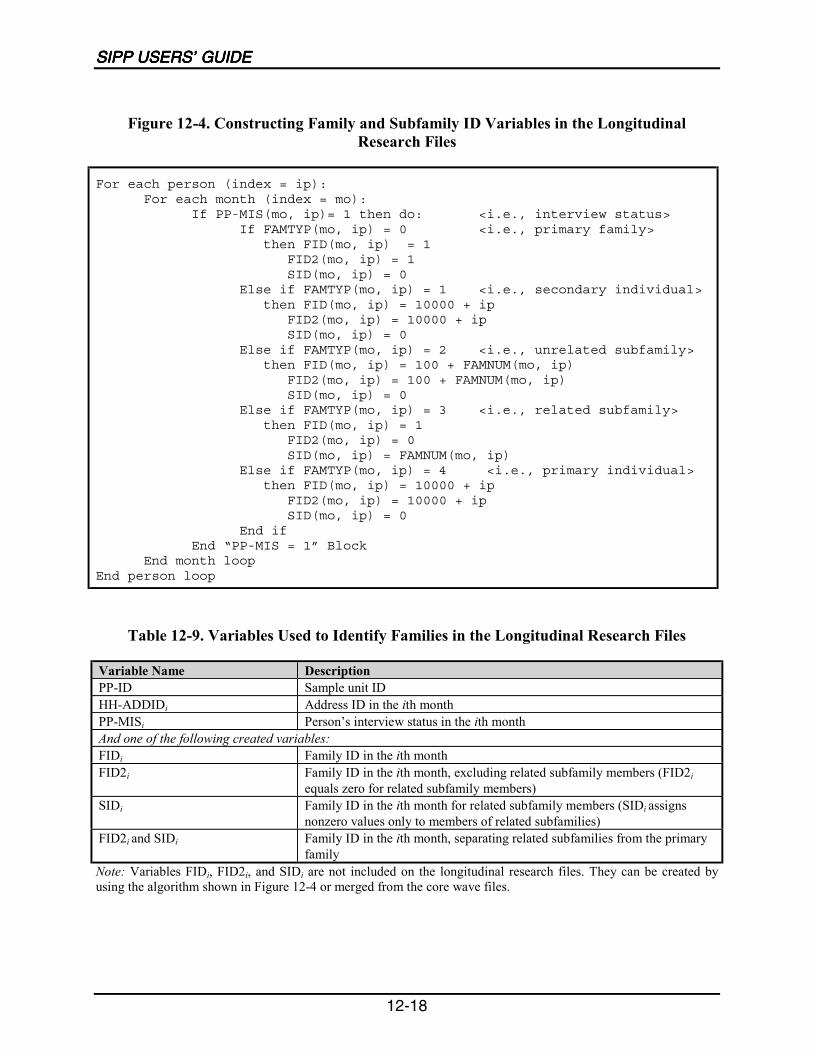
12-4 Constructing Family and Subfamily ID Variables in the LongitudinalResearch Files ......................................................................................................12-18
12-5 Creating Monthly Food Stamp and SSI Income Variables from theUnearned Income Variables in the Longitudinal Research Files.........................12-36
SIPP USERS’ GUIDE
x
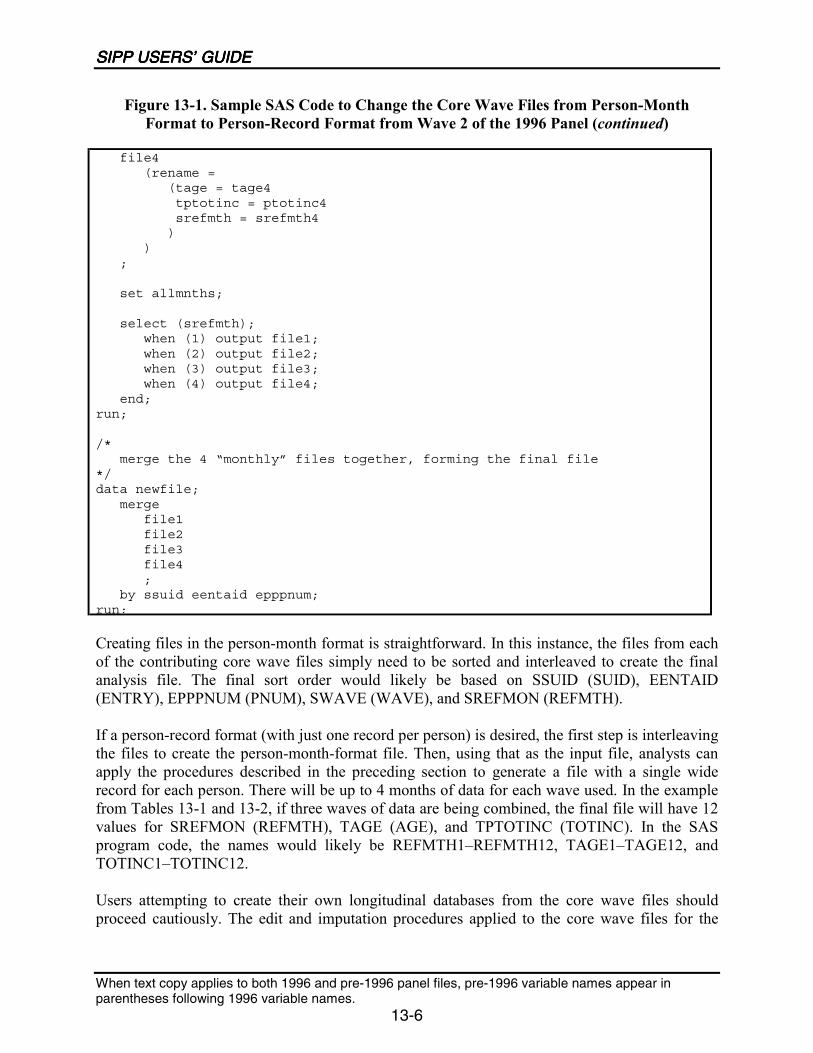
Figure Page
13-1 Sample SAS Code to Change the Core Wave Files from Person-Month Formatto Person-Record Format from Wave 2 of the 1996 Panel ....................................13-5
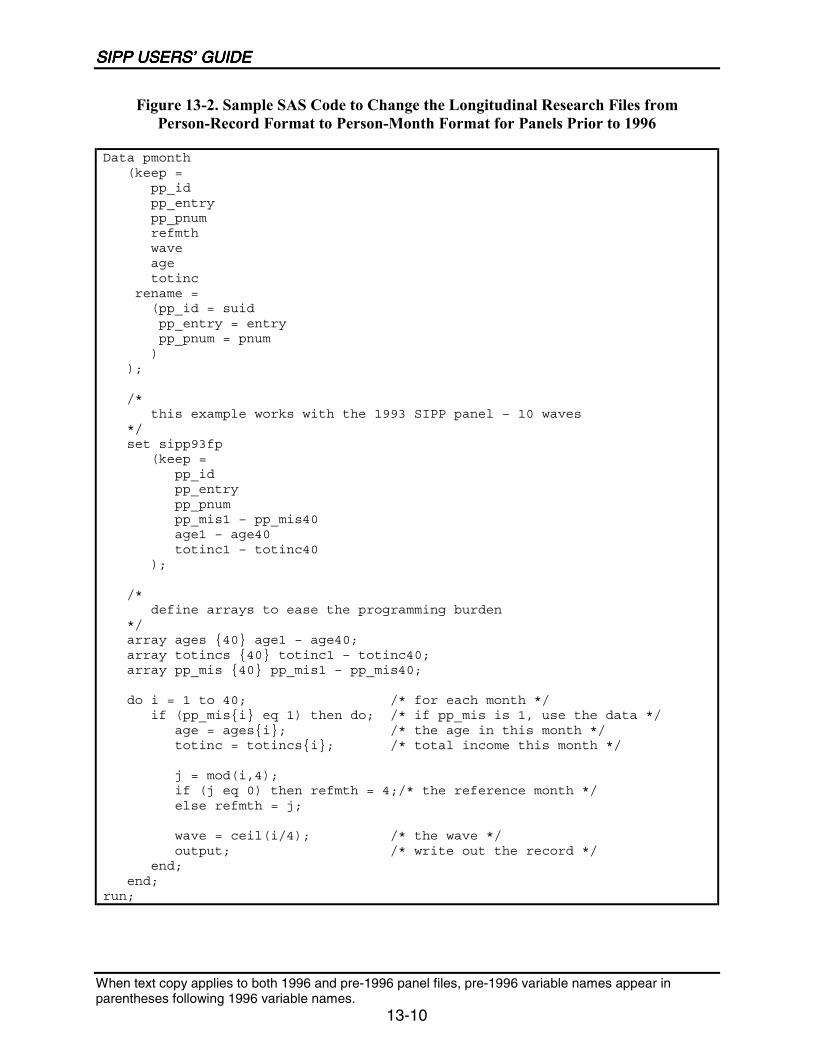
13-2 Sample SAS Code to Change the Longitudinal Research Files fromPerson-Record Format to Person-Month Format for Panels Prior to 1996 .........13-10
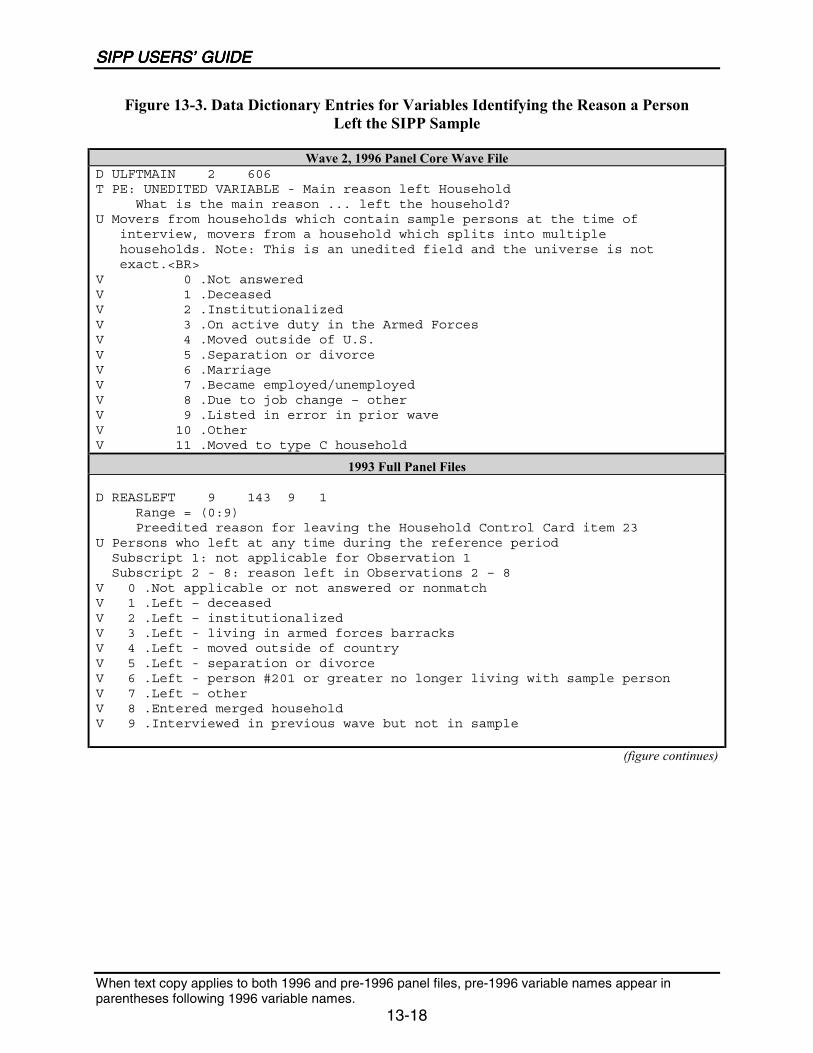
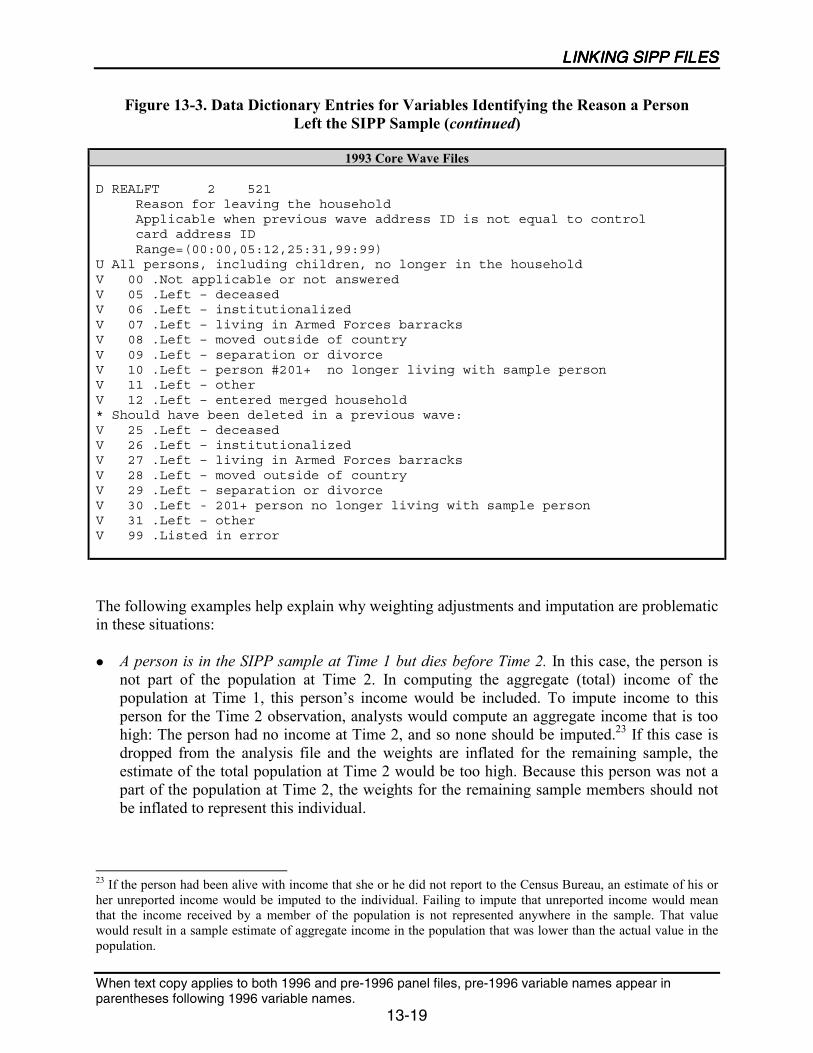
13-3 Data Dictionary Entries for Variables Identifying the Reason a PersonLeft the SIPP Sample ...........................................................................................13-19
C-1 Second-Stage Cells for Hispanics........................................................................... C-6
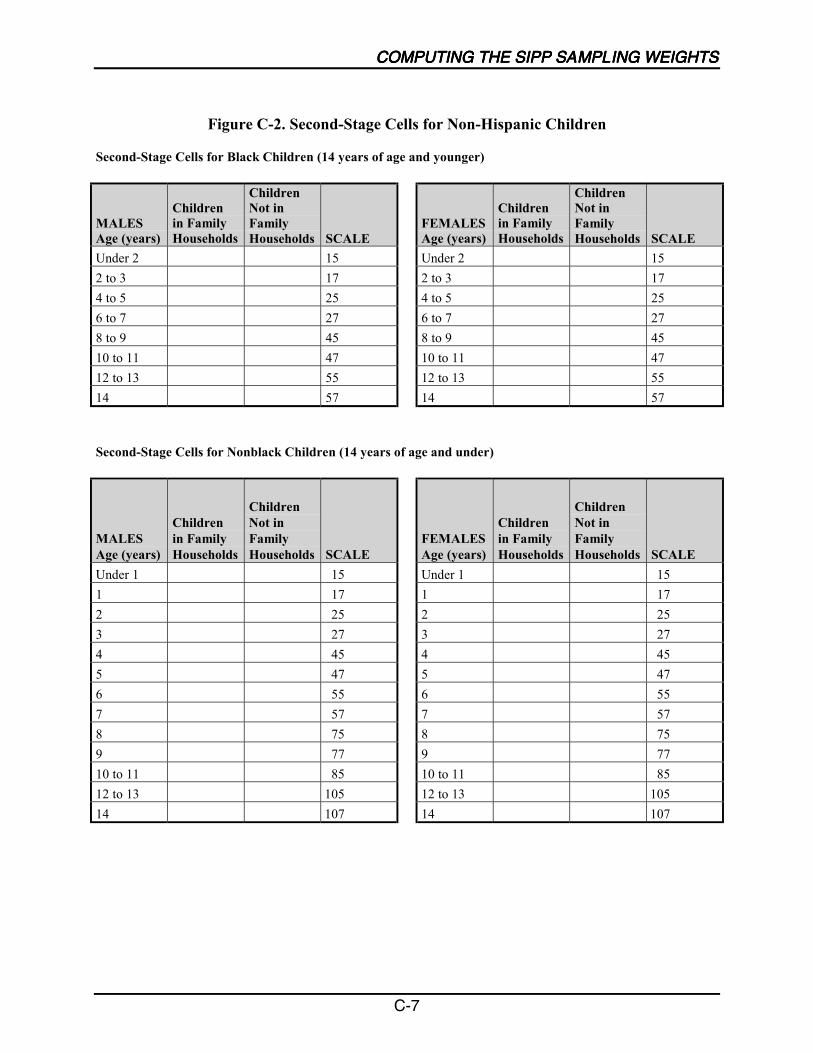
C-2 Second-Stage Cells for Non-Hispanic Children ..................................................... C-7
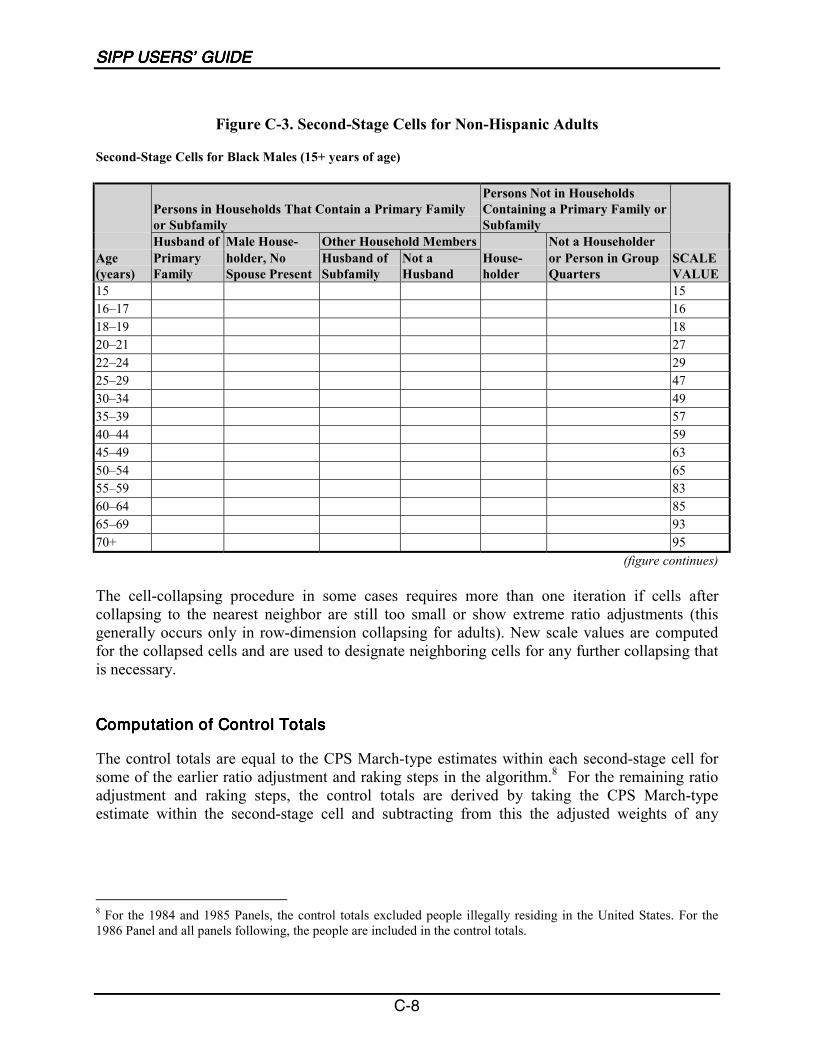
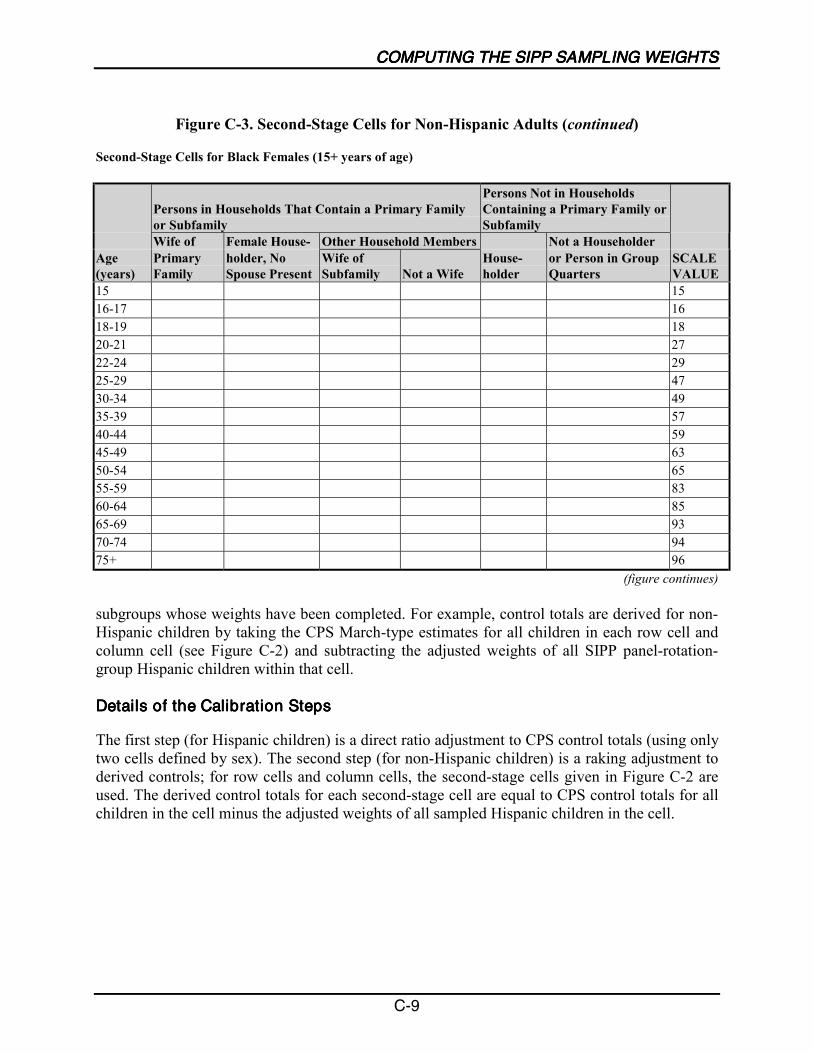
C-3 Second-Stage Cells for Non-Hispanic Adults......................................................... C-8
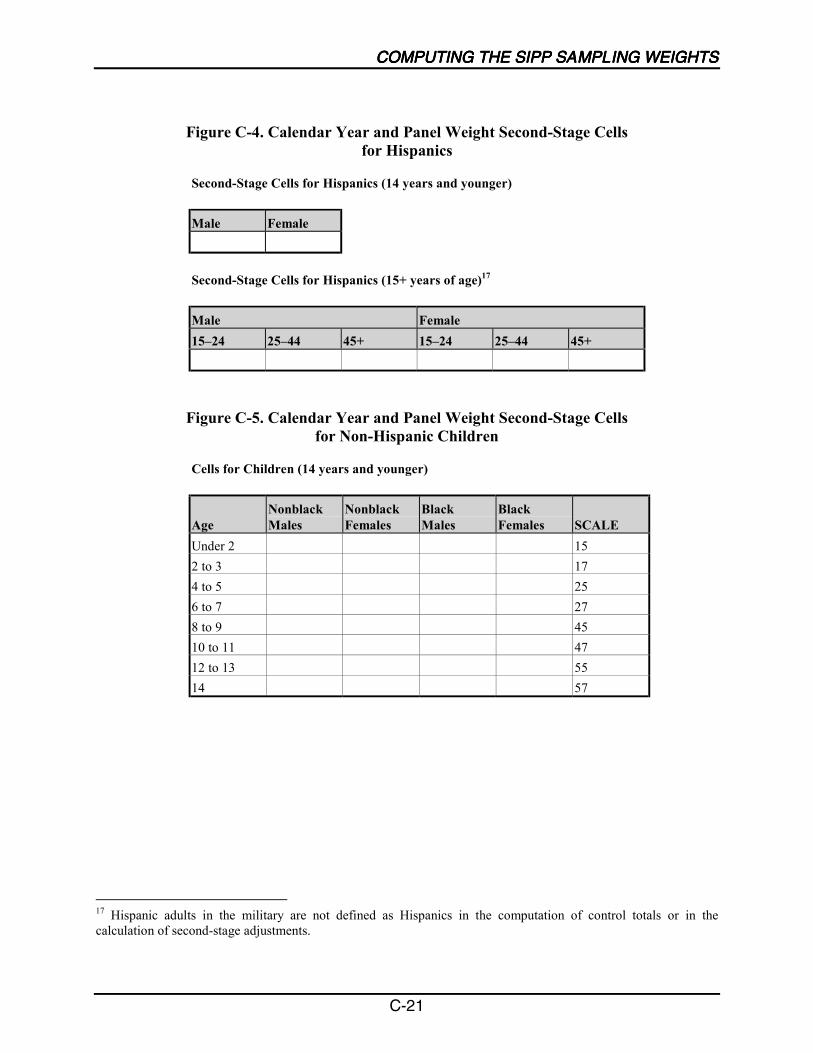
C-4 Calendar Year and Panel Weight Second-Stage Cells for Hispanics ................... C-23
C-5 Calendar Year and Panel Weight Second-Stage Cells forNon-Hispanic Children ......................................................................................... C-23
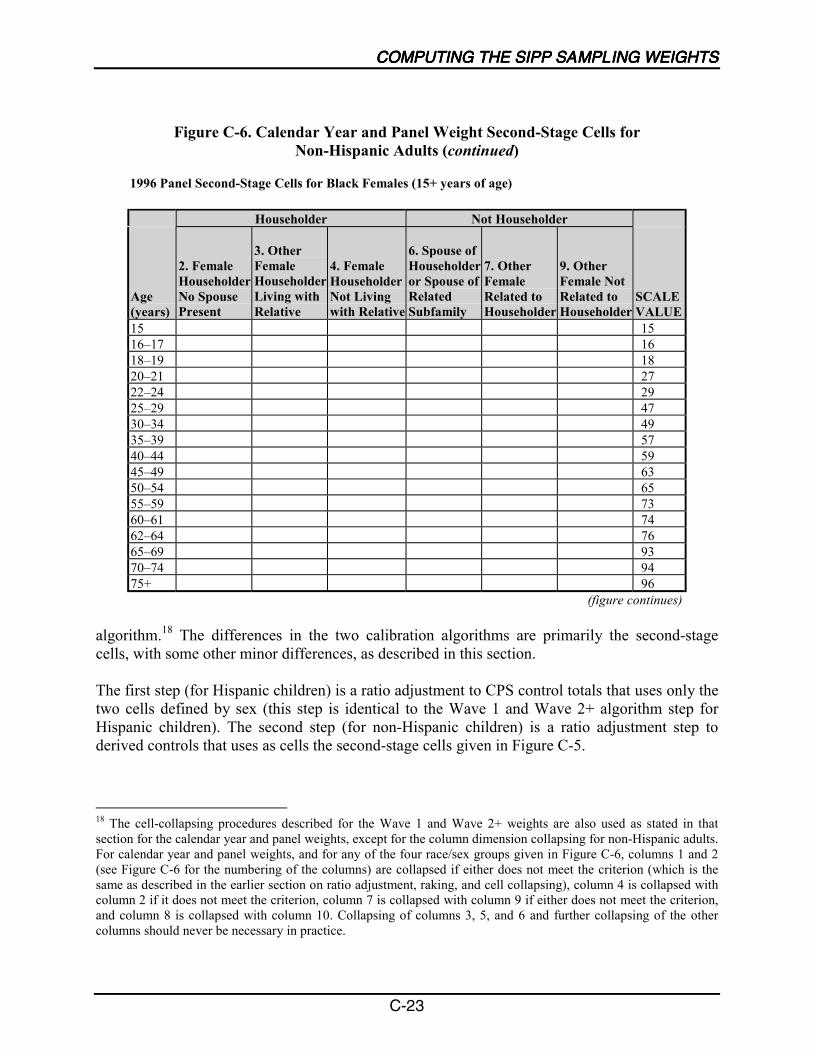
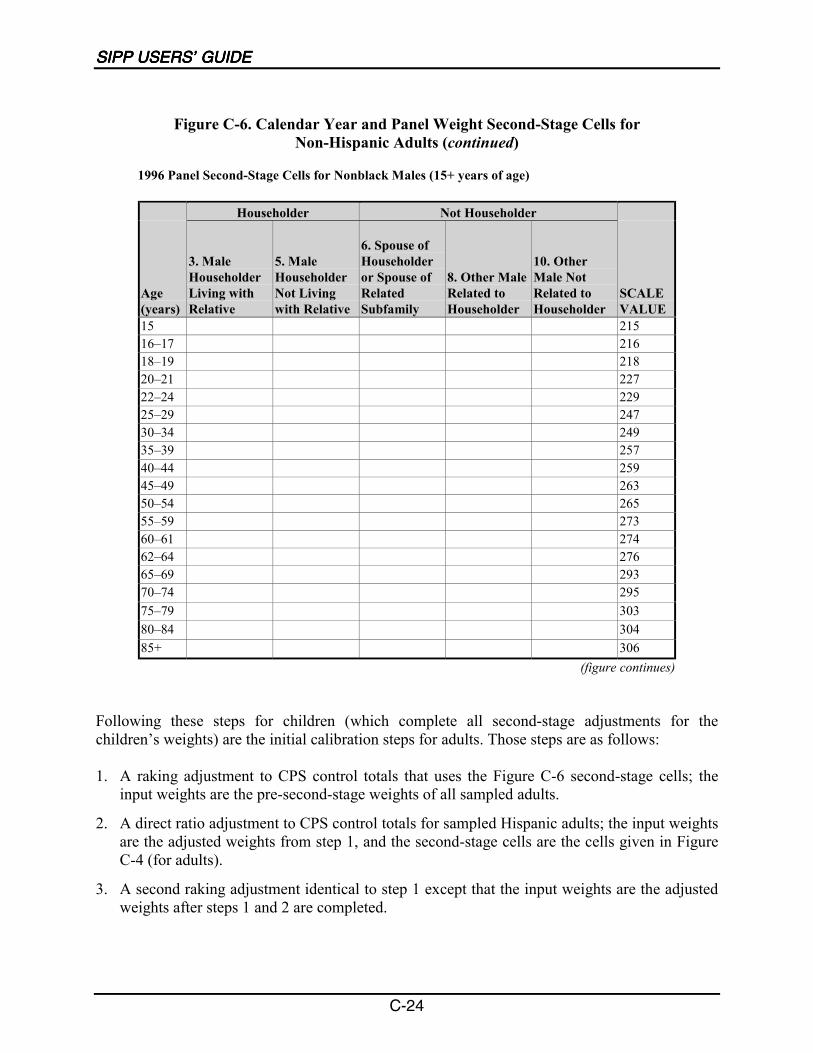
C-6 Calendar Year and Panel Weight Second-Stage Cells forNon-Hispanic Adults ............................................................................................ C-24
This guide is intended as a reference for analysts who need information about using the Surveyof Income and Program Participation (SIPP). The main objective of SIPP is to provide accurateand comprehensive information about the income and program participation of individuals andhouseholds in the United States, and about the principal determinants of income and programparticipation. SIPP offers detailed information on cash and noncash income on a subannual basis.The survey also collects data on taxes, assets, liabilities, and participation in government transferprograms. SIPP data allow the government to evaluate the effectiveness of federal, state, andlocal programs.
This chapter and the ones that follow come under two main sections. Section I encompassesdiscussions of survey design and content, data editing and imputation procedures, sampling andnonsampling error, and weighting. Section II provides information about working with each ofthe three types of SIPP microdata files (the core wave files, topical module files, and full panelfiles), as well as instructions for linking SIPP files. This introduction offers a brief overview ofeach of those topics.
Evolution and History of SIPPEvolution and History of SIPPEvolution and History of SIPPEvolution and History of SIPP
Until the advent of SIPP, the major source of data on income and program participation was theCurrent Population Survey (CPS) March Income Supplement. The CPS continues to be thesource of all official income and poverty statistics published by the Census Bureau. The CPS,however, is designed primarily to obtain information on employment. Because incomemeasurement was never the primary purpose of the CPS, it has certain gaps in this area. Forexample, CPS respondents are asked in March to recall their income during the precedingcalendar year. Many respondents have difficulty in remembering sources such as propertyincome or irregular income over the yearlong reference period. Also, the CPS does not capturethe impact of changes in household composition during the year, nor does the survey explicitlymeasure periods of program participation. Further, the CPS does not collect data on assets andliabilities, which are needed to measure more completely a household�s economic status andeligibility for program benefits. To add those items to the CPS questionnaire would dilute themain purpose of that survey and unduly increase respondent burden. Finally, the CPS is designedto be a cross-sectional survey. During the 1970s, the increasing size of government programs andtheir interactions with the labor market led to a need for longitudinal data.
To address those data issues, the Department of Health, Education, and Welfare (HEW) initiatedthe Income Survey Development Program (ISDP) in the late 1970s. In developing ISDP contentand procedures, HEW focused on questionnaire length, length of reference period, and linkage ofsurvey data to program records. The 1979 ISDP Panel was a longitudinal survey in whichrespondents were asked about their income, labor force participation, and other characteristics;
repondents were recontacted every 3 months to supply information on themselves and otherswith whom they resided; the 3-month span was the reference period for the interview.
The First SIPP PanelsThe First SIPP PanelsThe First SIPP PanelsThe First SIPP Panels
The lessons learned from ISDP were incorporated into the initial design of SIPP, which was usedfor the first 10 years of the survey. The original design of SIPP called for a nationallyrepresentative sample of individuals 15 years of age and older to be selected in households in thecivilian noninstitutionalized population. Those individuals, along with others who subsequentlylived with them, were to be interviewed once every 4 months over a 32-month period. To easefield procedures and spread the work evenly over the 4-month reference period for theinterviewers, the Census Bureau randomly divided each panel into four rotation groups. Eachrotation group was interviewed in a separate month. Four rotation groups thus constituted onecycle, called a wave, of interviewing for the entire panel (Chapter 2). At each interview,respondents were asked to provide information covering the 4 months since the previousinterview. The 4-month span was the reference period for the interview. The first sample, the1984 Panel, began interviews in October 1983 with sample members in 19,878 households. Thesecond sample, the 1985 Panel, began in February 1985. Subsequent panels began in February ofeach calendar year, resulting in concurrent administration of the survey in multiple panels.
The original goal was to have each panel cover eight waves. However, a number of panels wereterminated early (Chapter 2) because of insufficient funding. For example, the 1988 Panel hadsix waves; the 1989 Panel, part of which was folded into the 1990 Panel, was halted after threewaves. In addition, the intent was for each SIPP panel to have an initial sample size of 20,000households. That target was rarely achieved; again, budget issues were usually the reason.
The 1996 redesign (discussed below) entailed a number of important changes. First, the 1996Panel spans 4 years and encompasses 12 waves. The redesign has abandoned the overlappingpanel structure of the earlier SIPP, but sample size has been substantially increased: the 1996Panel had an initial sample size of 40,188 households (Chapter 2).
The 1996 RedesignThe 1996 RedesignThe 1996 RedesignThe 1996 Redesign
In 1990, the Census Bureau asked the Committee on National Statistics (CNSTAT) at theNational Research Council to undertake a comprehensive review of SIPP. The resulting report,The Future of the Survey of Income and Program Participation (Citro and Kalton, 1993),summarizes the first 9 years of SIPP and provides recommendations for the future of the survey.Some of those recommendations were implemented with the 1996 SIPP Panel in what is knownas the 1996 redesign.
One of the goals of the 1996 redesign was to improve the quality of longitudinal estimates inorder to provide better information for policy makers. Specific changes include the following:
INTRODUCTIONINTRODUCTIONINTRODUCTIONINTRODUCTION
1-3
! A larger initial sample than in previous panels, with a target of 37,000 households;
! A single 4-year panel instead of overlapping 32-month panels;
! Twelve or 13 waves instead of 8;
! The introduction of computer-assisted interviewing (CAI), which, among otherimprovements, permits automatic consistency checks of reported data during the interview;those checks can reduce the level of postcollection edits and imputation and thus help tomaintain longitudinal consistency; and
! Oversampling of households from areas with high poverty concentrations.
The first interviews of the redesigned SIPP began in April 1996 with the 1996 Panel. Later in1996, Congress passed the Personal Responsibility and Work Opportunity Reconciliation Act(PRWORA). That law significantly altered the nature of public transfer programs, shifting moreresponsibility to state governments, establishing new eligibility rules for a number of programs,and setting limits on recipiency. The existing welfare program, Aid to Families with DependentChildren (AFDC), was replaced with a new program, Temporary Assistance for Needy Families(TANF). Those changes came after interviewing for the 1996 Panel had already begun with aquestionnaire designed for the array of transfer programs that existed before PRWORA wasenacted. To accommodate program changes brought about by PRWORA, the Census Bureaubegan adapting transfer-program questions to reflect the current situation.
Uses of SIPPUses of SIPPUses of SIPPUses of SIPP
SIPP produces national-level estimates for the U.S. resident population and subgroups. Althoughthe SIPP design allows for both longitudinal and cross-sectional data analysis, SIPP is meantprimarily to support longitudinal studies. SIPP�s longitudinal features allow the analysis ofselected dynamic characteristics of the population, such as changes in income, eligibility for andparticipation in transfer programs, household and family composition, labor force behavior, andother associated events.
One of the most important reasons for conducting SIPP is to gather detailed information onparticipation in transfer programs. Data from SIPP allow analysts to examine concurrentparticipation in multiple programs. SIPP data can also be used to address the following types ofquestions:
! How have changes in eligibility rules or benefit levels affected recipients?
! How have changes in the eligibility rules affected the program target population, that is,those eligible to receive benefits?
! How does income from other household members affect labor force participation and reasonsfor not working?
! How do wealth and income patterns differ for various age, gender, and racial groups?
Because SIPP is a longitudinal survey, capturing changes in household and family compositionover a multiyear period, it can also be used to address the following questions:
! What factors affect change in household and family structure and living arrangements?
! What are the interactions between changes in the structure of households and families and thedistribution of income?
! What effects do changes in household composition have on economic status and programeligibility?
! What are the primary determinants of turnover in programs such as Food Stamps?
The SurveyThe SurveyThe SurveyThe Survey
SIPP data show sample members� lives at discrete points in time, as well as a history of changesin their economic circumstances and household relationships. Understanding survey design,content, and procedures is key for analysts wishing to use SIPP data.
Design of SIPPDesign of SIPPDesign of SIPPDesign of SIPP
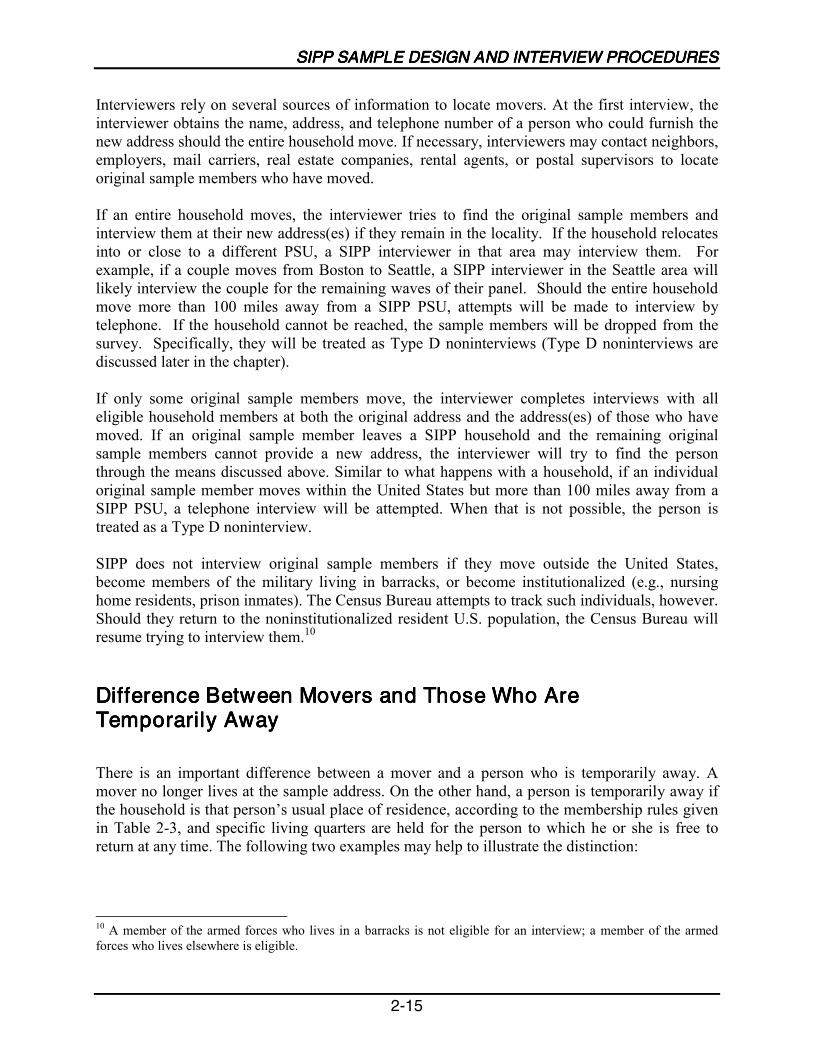
The adults followed in each SIPP panel come from a nationally representative sample ofhouseholds in the civilian noninstitutionalized U.S. population. People selected into the SIPPsample are interviewed once every 4 months over the life of the panel. If original samplemembers 15 years of age or older move from their original addresses to other addresses, they areinterviewed at the new addresses. The survey sample includes children residing with originalsample members. If, after the first interview, other people not previously in the survey becomepart of a respondent�s household, the new people are interviewed as long as they continue livingwith respondents from the first interview (Chapter 2).
Information collected in SIPP falls into two categories: core and topical. The core contentincludes questions asked at every interview and covers demographic characteristics; labor forceparticipation; program participation; amounts and types of earned and unearned income received,including transfer payments; noncash benefits from various programs; asset ownership; andprivate health insurance. Most core data are measured on a monthly basis, although a few coreitems are measured only as of the interview date, once every 4 months.
Other questions produce in-depth information on specific subjects and are asked less frequently.Those topical questions are often found in topical modules that usually follow the core content.Topical questions probe in greater detail about particular social and economic characteristics and
INTRODUCTIONINTRODUCTIONINTRODUCTIONINTRODUCTION
1-5
personal histories. Included are such topics as assets and liabilities, school enrollment, maritalhistory, fertility, migration, disability, and work history. Topical module questions typicallycollect information on events in the past or characteristics that tend to change slowly, if at all.
Data Editing and ImputationData Editing and ImputationData Editing and ImputationData Editing and Imputation
Computer-assisted interviewing (CAI) allows some data editing to occur while the interview is inprogress because the system detects inconsistencies and prompts the interviewer to ask therespondent for additional information. CAI also allows use of prior wave data for editing missingdata from later waves, thus lessening the need for subsequent longitudinal editing. However,editing and imputation still occur after SIPP interviews are completed (Chapter 4). The CensusBureau edits data for consistency, imputes missing data, and creates internal data files and publicuse files for each wave.
After each panel is concluded, the Census Bureau creates a full panel file by stripping all editedand imputed values from the core data, linking those data, and then applying a different set oflongitudinally consistent edit and imputation procedures to the resulting file. As part of thatprocess, some data are recoded to maintain respondent confidentiality.
The Census Bureau uses several imputation procedures. Most common is some version of asequential hot deck, in which SIPP statisticians impute missing data by searching for a �donor�respondent who is similar to the respondent with the missing data. The donor�s answers are usedin the assignment of missing data to the original respondent�s record. Specific imputationprocedures are discussed in Chapter 4. Data editing is still preferable to imputation and is usedwhenever a missing item can be logically inferred from other information that has been provided.
Accessing SIPP InformationAccessing SIPP InformationAccessing SIPP InformationAccessing SIPP Information
Most analysts will find the published estimates from SIPP data useful. Census Bureaupublications may provide required estimates, saving users the need to generate those estimatesthemselves. Published estimates can also provide a crosscheck for estimates prepared by analystsfrom the microdata files.1
The Census Bureau makes published estimates from SIPP data available from several sources(Chapter 5). All public use microdata files are available on magnetic media or CD-ROM, alongwith a full set of documentation, directly from the Census Bureau. The Inter-universityConsortium for Political and Social Research (ICPSR) also provides access to SIPP microdata
1 Prior to the 1996 Panel, the Census Bureau estimates were usually impossible to replicate exactly because theywere based on internal data files that had not yet been topcoded and otherwise edited to protect the confidentiality ofrespondents. Although new topcoding procedures are being implemented with the 1996 and subsequent panels, tofacilitate the production of comparable estimates, exact replication of some Census Bureau estimates will still beimpossible.
for member institutions. In addition, the SIPP data and documentation that the Census Bureaureleases are not copyrighted and thus can be shared, although users are cautioned that thisprovision applies only to materials written and distributed directly by federal agencies. Finally,analysts conducting exploratory work might wish to investigate the Census Bureau�s on-lineresources. SIPP microdata are available through two access tools�Surveys-on-Call andFERRET (Chapter 5). The home sites of both online tools can be accessed at the SIPP Web site(http://www.sipp.census.gov/sipp).
The SIPP Quality Profile, 3rd Ed. (U.S. Census Bureau, 1998a), offers an in-depth discussion ofthe sources and magnitude of errors in SIPP-based estimates. Although it addresses bothsampling and nonsampling errors, it emphasizes the latter. This Users� Guide provides asummary chapter addressing nonsampling errors (Chapter 6), a chapter on sampling errors(Chapter 7), and a chapter on the use of weights (Chapter 8). In addition, Appendix C addressesweighting in detail.
All surveys�including SIPP�are subject to nonsampling errors from various sources. SIPPcontains nonsampling errors common to most surveys, as well as errors that stem from SIPP�slongitudinal design. Undercoverage in household surveys is due primarily to within-householdomissions; the omission of entire households is less frequent. SIPP experiences some differentialundercoverage of demographic subgroups; for example, the coverage ratio of black males over15 years of age is much lower than that for white males in the same age group. To compensatefor this differential undercoverage, the Census Bureau adjusts SIPP sample weights to populationcontrol totals. Little is known, however, about how effective those adjustments are in reducingbiases.
Sample attrition is another major concern in SIPP because of the need to follow the same peopleover time. Attrition reduces the available sample size. To the extent that those leaving the sampleare systematically different from those who remain in the sample, survey estimates could bebiased.
Response errors in SIPP take on a number of forms. Recall errors are thought to be the source ofthe �seam phenomenon.� This effect results from the respondent�s tendency to project currentcircumstances back onto each of the 4 prior months that constitute the SIPP reference period.When that happens, any changes in respondent circumstances that occurred during that 4-monthperiod appear to have happened in the first month of the reference period. A disproportionate
INTRODUCTIONINTRODUCTIONINTRODUCTIONINTRODUCTION
1-7
number of changes appear to occur between the fourth month of one wave and the first month ofthe following wave, which is the �seam� between the two waves�hence the name.
Another potential source of response error is the time-in-sample effect. This effect refers to thetendency of sample members to �learn the survey� over time. The more times a sample memberis interviewed, the better he or she learns the questionnaire. The concern is that sample memberswill alter their responses to the survey questions in an effort to conceal sensitive information orto minimize the length of the interview.
A common mistake in the estimation of sampling errors for survey estimates is to ignore thecomplex survey design and treat the sample as a simple random sample (SRS) of the population.This mistake occurs because most standard software packages for data analyses assume simplerandom sampling for variance estimation. When applied to SIPP estimates, SRS formulas forvariances typically underestimate the true variances. Chapter 7 describes how to obtainappropriate variance estimates that take into account SIPP�s complex sample design.
WeightingWeightingWeightingWeighting
SIPP data analysts should understand the importance of using weights. The weight for aresponding unit in a survey data set is an estimate of the number of units in the target populationthat the responding unit represents. In general, because population units may be sampled withdifferent selection probabilities, and because response and coverage rates may vary acrosssubpopulations, different responding units represent different numbers of units in thepopulation.2
The combined effects of differential response, differential coverage, and differential attritionmean that unweighted analyses can produce biased results. Each SIPP file contains severalalternative sets of weights that address the variety of units of analysis (such as persons,households, families, and subfamilies) and time periods for which survey estimates may beneeded. It is important to understand the different weights on the files and to use those that areappropriate for a particular analysis.
The selection and use of weights in SIPP analyses are discussed in Chapter 8 and Appendix C.
2 Most SIPP panels have not sampled different subpopulations at different rates. There are two exceptions: the 1990and 1996 Panels. Chapter 2 discusses the oversamples included in each of those panels.
SIPP Public Use FilesSIPP Public Use FilesSIPP Public Use FilesSIPP Public Use Files
There are three types of SIPP microdata files available for public use: core wave files, topicalmodule files, and full panel files. Although content overlaps among these files, each is designedto facilitate a different kind of analysis.
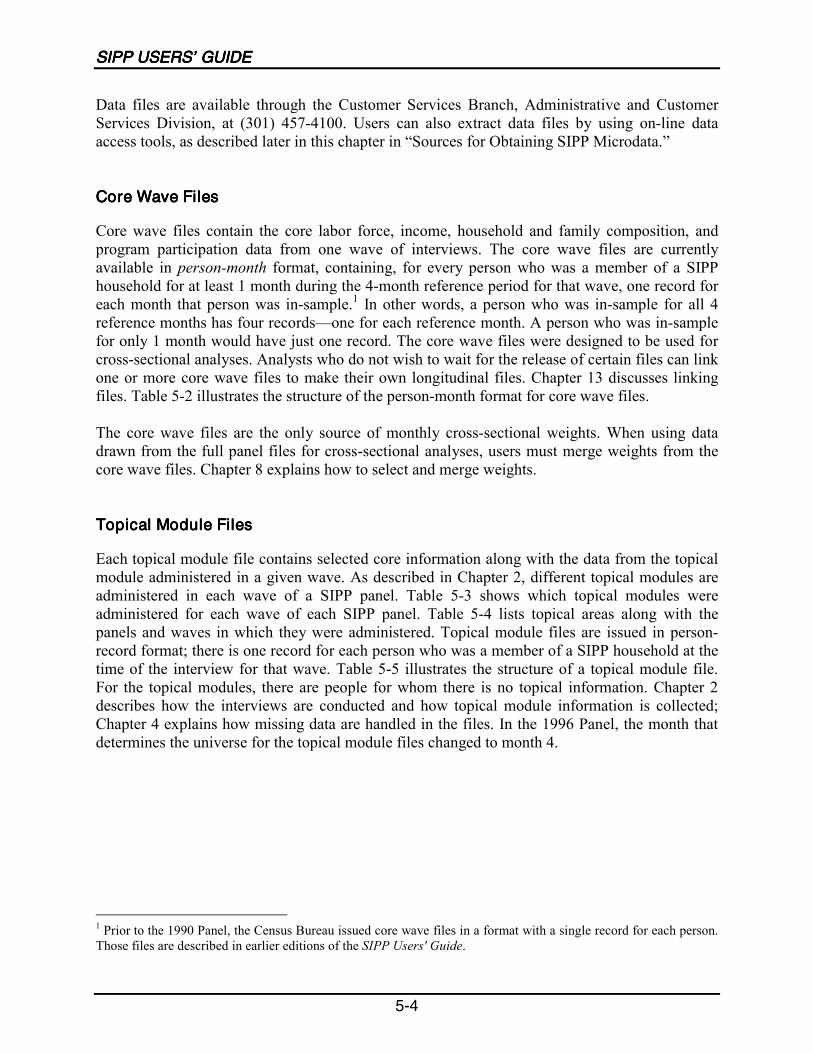
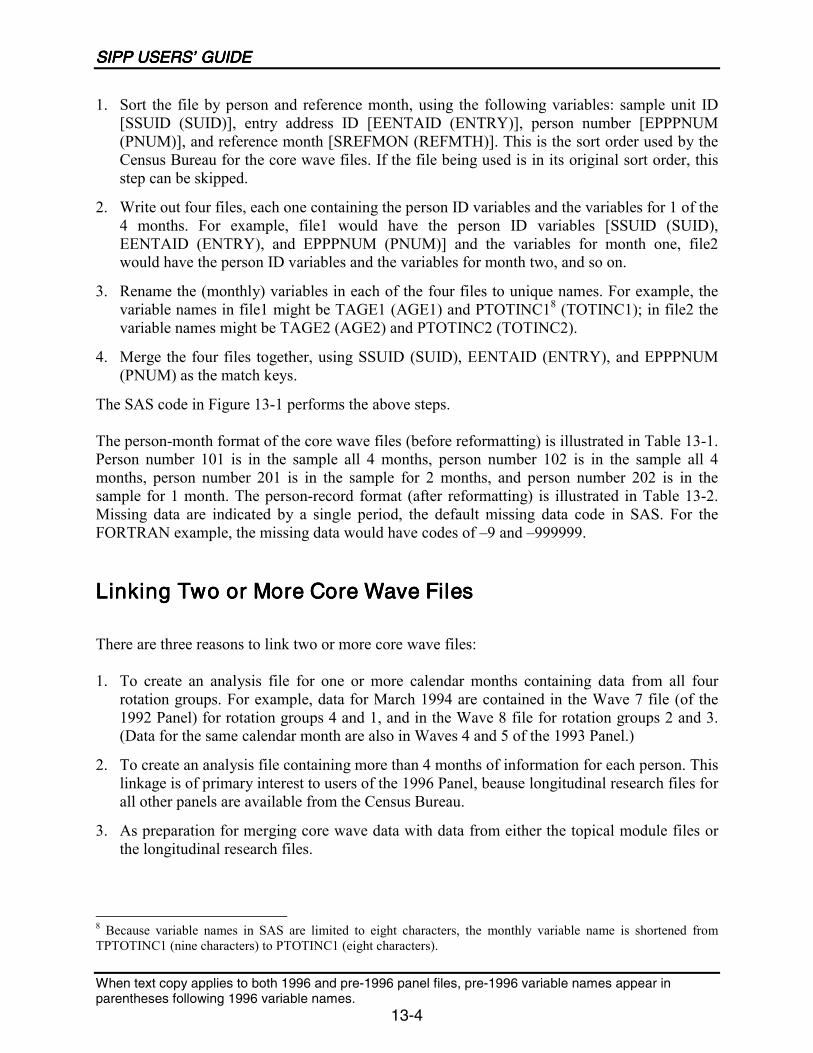
SIPP core wave files contain the core labor force, income, household and family composition,and program participation data from one wave of interviews. Since the 1990 Panel, these fileshave been issued in a person-month format, with up to four records for each sample member.Each record contains data from one of the four reference months covered by the wave.3
Each topical module file contains all of the topical module subject areas that were administeredduring the wave in question. The files contain one record for each person who was a samplemember at the time of the interview. When critical demographic and weight variables areincluded, the topical module files can be used independently from the core wave and full panelfiles. However, because topical module files contain only a small subset of the core items, usersoften need to merge data from either the core wave or the full panel files.
Full Panel FilesFull Panel FilesFull Panel FilesFull Panel Files
Full panel files are released after interviewing for a panel is completed. They contain one recordfor each original sample member, all children, and all adults who entered the sample after Wave1. People who were not interviewed for 1 or more months over the course of the panel eitherhave their data imputed or are identified as not in the sample, although their records remain inthe file. Variables within each record correspond to the information that was collected in the corecontent sections of the interviews. Different variables occur with different frequency, dependingupon how often certain questions were asked. For example, because a sample member�s sex, dateof birth, and race are unlikely to change, the variables corresponding to those attributes occuronly once in each record. On the other hand, some questions from the core content, such as thoseabout income and program participation, are asked for each month of the panel; the number ofcorresponding variables will reflect that fact. Similarly, SIPP-generated information can occuronce (e.g., person number) or many times (e.g., monthly interview status) on each record.
3 Prior to the 1990 Panel, core wave files were issued with a single record for each person. Each record containeddata for all 4 reference months covered by the wave.
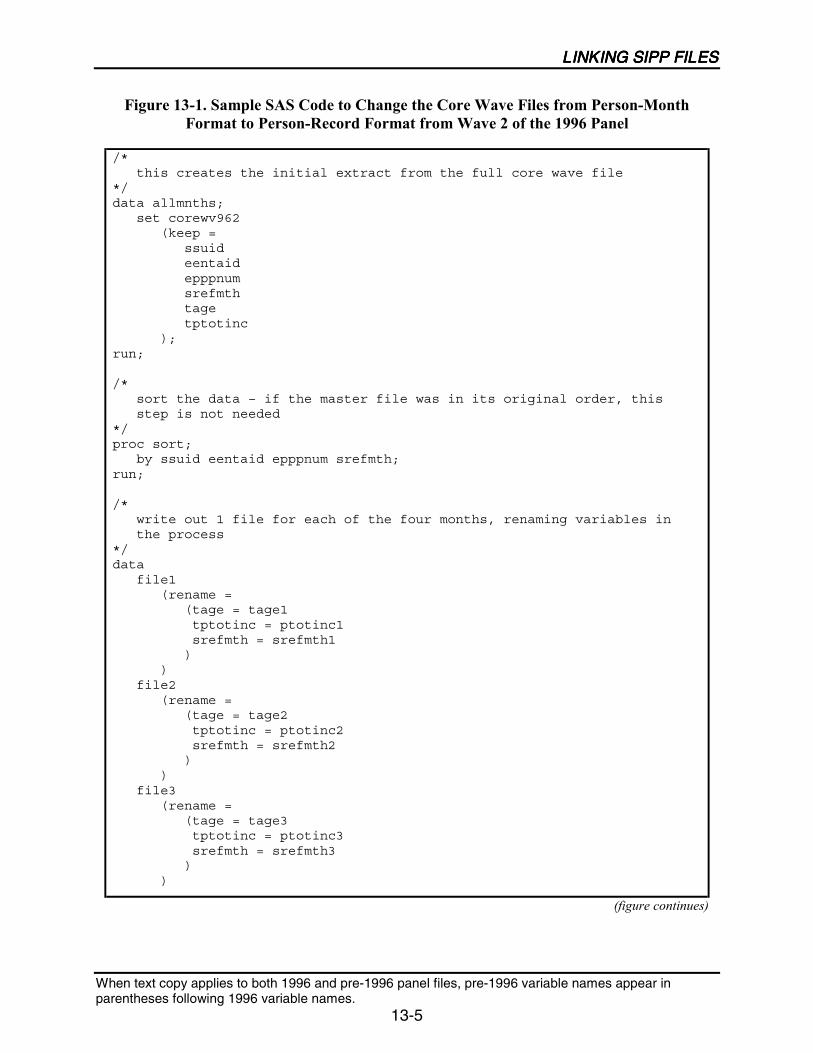
Before linking files, users must understand several conceptual issues: reasons for nonmatches,handling of nonmatches; data quality of matched records containing imputed data; and design ofthe linked file. There are five ways of linking SIPP data files: within a core wave file; core wavefile to core wave file; topical module file to core wave file; topical module file to full panel file;and core wave file to full panel file. The linking process is generally the same for each type oflink. However, because variable names and file structures are different, the process for each typeof linkage is described in Chapter 13.
Comparison of SIPP with Other SurveysComparison of SIPP with Other SurveysComparison of SIPP with Other SurveysComparison of SIPP with Other Surveys
Because there is some overlap in the content of SIPP and certain other surveys, the questionarises: When should an analyst use SIPP instead of the other surveys? A brief look at selectedsurveys might provide some guidance (Table 1-1 compares some key points as well).
Current Population SurveyCurrent Population SurveyCurrent Population SurveyCurrent Population Survey
The CPS, sponsored jointly by the Census Bureau and the Bureau of Labor Statistics (BLS), isprimarily a labor force survey. It is used to compute the federal government�s official monthlyunemployment statistics, along with other estimates of labor force characteristics. In addition toits core content, a different supplement is fielded each month. One of these, the March AnnualDemographic Supplement, is currently the official source of estimates of income and poverty inthe United States. Compared with SIPP, however, the CPS has gaps in the area of incomemeasurement. A yearlong reference period means that CPS respondents are more likely thanSIPP respondents to forget or misreport certain asset income or irregular income sources. TheCPS does not collect data on assets and liabilities to the same extent as SIPP. The CPS is alsoless comprehensive in the area of program participation, sometimes missing partial-year data.
The CPS reporting unit is the person, but the sample covers housing units; whoever happens tobe living at the address at the time of the interview is in the sample. When residents of a CPShousing unit move, they are not followed; instead, the new residents become sample members.Housing units spend 4 months in the sample, 8 months out, and 4 months in again. The targetsample size for the CPS is 50,000 housing units each month. Like SIPP, the CPS sample coversthe U.S.-resident noninstitutionalized population, although, unlike SIPP, the CPS includes peopleliving in military barracks.
Sample size and design 1996 Panel: 40,188households; new panelperiodically; each original-sample adult in panel forno. of months in survey;interviews every 4 months
50,000 households; eachhousehold in sample for 8months over 2-year period;rotation group design;monthly interviews(income supplement onceper year)
Income data Data for about 70 cash andin-kind Sources at each 4-month wave, with monthlyreporting for most Sources
Data for prior calendaryear for about 35 cash andin-kind Sources
Data for prior calendaryear for about 25 cash andin-kind Sources withspecific months received
Tax data Information to determinefederal, state, and localincome taxes; payrolltaxes; property taxes
None Information to determinefederal, state, and localincome taxes; payrolltaxes; property taxes
Asset-holdings data Detailed inventory of realand financial assets andliabilities once each yearfor panels from 1996forward and at least onceper panel in prior years;more frequent measuresfor assets relevant forassistance programs
None, except homeownership
Regularly, informationabout home value andmortgage debt;occasionally, informationabout saving behavior andwealth
Expenditure data Information at least onceeach panel before 1996and once a year 1996 andbeyond on previousmonth�s out-of-pocketmedical care costs, sheltercosts (mortgage or rentand utilities), dependentcare costs, and childsupport payments
None Monthly rent or mortgagecosts; annual utility costs;average weekly food costs;child support payments
Note: SIPP sample size and design information valid for the 1996 Panel. For information about pre-1996 SIPPpanels, see Chapter 2.Source: Citro, C.F., Michael, R.T., and Maritano, N. (eds.) (1995). Measuring Poverty: A New Approach.Washington, DC: National Academy Press, Appendix B.
The Panel Study of Income DynamicsThe Panel Study of Income DynamicsThe Panel Study of Income DynamicsThe Panel Study of Income Dynamics
The Panel Study of Income Dynamics (PSID) was begun in 1968 as a nationally representative,longitudinal survey of the U.S. population. It initially included about 5,000 households and nowhas about 8,700. The University of Michigan conducts PSID on an annual basis; the focus of the
INTRODUCTIONINTRODUCTIONINTRODUCTIONINTRODUCTION
1-11
survey is economics and demographics, especially income sources and amounts, employmentfamily composition changes, and residential location. The content is broad, however, andincludes sociological and psychological measures. As of 1995, PSID had collected informationfrom more than 50,000 individuals, spanning as much as 28 years of their lives. The sampleincludes individuals interviewed every year since 1968, a representative national sample of 2,000Hispanic households added in 1990, and families formed by members of the original samplefamilies.
Survey of Program DynamicsSurvey of Program DynamicsSurvey of Program DynamicsSurvey of Program Dynamics
The Survey of Program Dynamics (SPD) is a new longitudinal survey designed to be an annualfollow-up to the 1992 and 1993 SIPP Panels. Approximately 38,000 households were in theinitial sample; a second phase, initiated with the implementation of the core SPD questionnairein 1998, was projected to include approximately 18,500 households, including all samplehouseholds with children and an overrepresentation of households in and near the povertythreshold. SPD data for 1996�2002, along with information collected from 1992 through 1995for SIPP, will provide a combined 10 years of data measuring program eligibility, access, andparticipation. Analysts will be able to track welfare dependency, the beginning and end ofperiods of welfare, factors that may be causes of such periods, and the impacts that the changeswill have on families, adults, and children over time.
Guide to This DocumentGuide to This DocumentGuide to This DocumentGuide to This Document
The balance of this Users� Guide is organized as follows. Chapters 1 through 5 are introductorychapters, designed mainly for beginning SIPP users.
! Chapter 2 discusses how the SIPP survey is designed and implemented. The chapterdescribes the structure of the survey, sample selection, and field procedures.
! Chapter 3 examines the general nature of questions in SIPP. Discussion focuses on core andtopical content, including brief descriptions of individual topical modules.
! Chapter 4 describes what happens after data collection. This chapter covers all aspects ofpost-data-collection processing, including consistency checks, data editing, and proceduresfor imputing missing data.
! Chapter 5 describes SIPP data files and supporting documentation and tells analysts where tofind that information.
Chapters 6 through 8 provide more technical information on how to properly use the data andinterpret the results.
! Chapter 6 discusses the types and sources of nonsampling error in SIPP, including recallerror, the seam effect, time-in-sample effects, attrition bias, and sources of additionalinformation about these topics.
! Chapter 7 defines sampling error and discusses how to calculate sampling errors for SIPPestimates.
! Chapter 8 discusses the topic of weights in SIPP, with a focus on how to choose weights.
Chapters 9 through 13 provide specific instructions for the use of the SIPP public use microdatafiles.
! Chapter 9 introduces this section by giving an overview of issues common to all of the SIPPdata files.
! Chapter 10 describes how to use the core wave files. The chapter describes the structure ofthe files and how to use the accompanying technical documentation. It also discusses how thecore wave files relate to the core survey instrument. Finally, the chapter provides detaileddescriptions of how to use the core wave files when performing common tasks.
! Chapter 11 describes how to use the topical module files, the structure of the files, and use ofthe accompanying technical documentation. It also discusses how the topical module filesrelate to the corresponding topical module survey instruments. Finally, the chapter providesdetailed descriptions of how to use the topical module files when performing common tasks.
! Chapter 12 describes how to use the full panel files, the structure of the files, and use of theaccompanying technical documentation. It also discusses how the full panel files relate to thecore survey instruments. Finally, the chapter provides detailed descriptions of how to use thefull panel files when performing common tasks.
! Chapter 13 describes how to link core wave, topical module, and full panel files. The chaptercovers both important conceptual issues and the mechanics of linking the various files.
Finally, the Users� Guide includes the following additional information:
! Appendixes contain in-depth discussion of weighting; tables with information about the sizeand number of waves, missing waves, oversampling, and additional information for selectedSIPP panels; a crosswalk; and detailed information about topcoding.
! An acronym list provides a guide to the acronyms used in this manual.
! The glossary defines terms that may be unfamiliar to some users.
! The references section contains references and suggested reading for all chapters in thisguide.
! An index helps users locate information quickly and easily.
INTRODUCTIONINTRODUCTIONINTRODUCTIONINTRODUCTION
1-13
Where to Go for More InformationWhere to Go for More InformationWhere to Go for More InformationWhere to Go for More Information
The following sources provide expanded, specific information about various aspects of SIPP andrelated products.
SIPP Web SiteSIPP Web SiteSIPP Web SiteSIPP Web Site
The SIPP homepage (located at http://www.sipp.census.gov/sipp) includes, among other things,this Users� Guide and an online tutorial that provides a hands-on introduction to SIPP. As thesurvey and data files evolve, the online documentation will be kept current. Also, users maysubscribe at the SIPP Web site to sipp-users, a listserv for SIPP Users Group members. Listmembers share new reports and studies, programming help, and research ideas.
The SIPP Quality Profile, 3rd Ed. (U.S. Census Bureau, 1998a), summarizes what is knownabout the sources and magnitude of errors in estimates based on SIPP data. It presentsinformation on errors associated with each phase of survey operations: frame design andmaintenance, sample selection, data collection, data processing, estimation (weighting), and datadissemination. Some information, such as the outcome of macroevaluation studies, is addressedoutside of this framework in a separate chapter. The SIPP Quality Profile is available at the SIPPWeb site.
BibliographyBibliographyBibliographyBibliography
The SIPP bibliography, also available at the SIPP Web site under Publications and Analyses, isthe most comprehensive, currently available online resource of published and unpublisheddocuments related to SIPP. It includes substantive studies that use SIPP data, as well as citationsto methodological research about SIPP. Documents relating to the ISDP also are included. Thebibliography contains nearly 2,000 references to reports, conference papers, working papers,journal articles, dissertations, books, and book sections. Abstracts are available for selectedpublications.
Reports and Working PapersReports and Working PapersReports and Working PapersReports and Working Papers
The references cited in this report include several types of Census Bureau publications. The P-70series (Current Population Reports, Household Economic Studies) presents tabulations and
analyses of SIPP data. SIPP working papers provide information about methodological aspectsof the survey as well as analyses of SIPP data. The working papers are not cleared for formalpublication but are readily available at the SIPP Web site. Since 1984, papers on SIPP results andmethodology presented at the annual meeting of the American Statistical Association have beenpublished in the working-paper series. Several important papers on SIPP methodology andevaluation studies have been presented and published in the proceedings of the Census Bureau�sannual research conferences, which began in 1985. In addition to those sources, papers andreports with information about the quality of SIPP data have been published by numerous otheragencies, organizations, and professional associations.
Technical documentation accompanies the SIPP microdata files that users acquire from the U.S.Census Bureau. The technical documentation briefly describes the contents of the particular fileand includes the following items:
! A glossary of selected terms,
! Lists of codes and descriptions,
! A data dictionary and instructions on how to use it,
! A source and accuracy statement,
! A copy of the core questionnaire used for the panel in question,
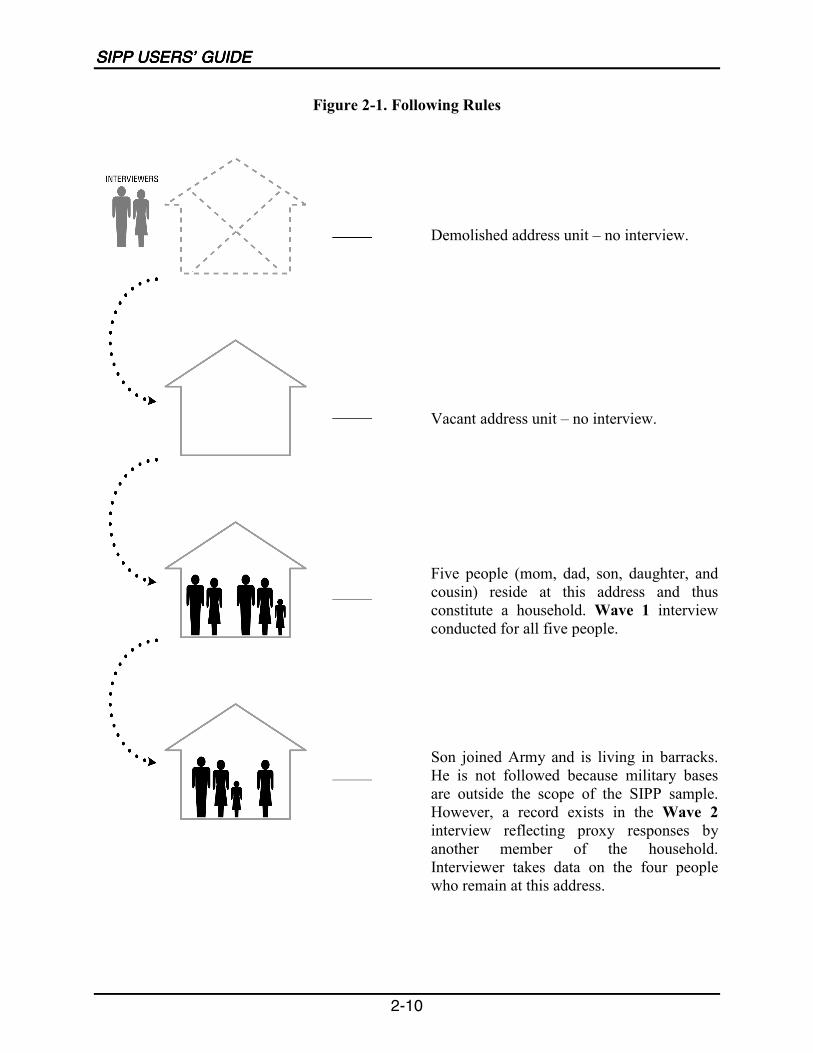
This chapter provides new users of the Survey of Income and Program Participation (SIPP) withbasic information about the organizing principles of SIPP, sample selection, and the datacollection process. The chapter also briefly reviews interview procedures.
SIPP is a longitudinal survey that collects information on topics such as income, participation ingovernment transfer programs, employment, and health insurance coverage. The initial surveydesign called for the introduction of a new sample, called a panel, every year; each panel wasplanned to cover 32 months. In practice, a number of panels have been shorter. A result of theinitial design was that multiple SIPP panels were in the field simultaneously. A redesignintroduced with the 1996 Panel abandoned the overlapping panel structure and extended thelength of the 1996 Panel to 4 years. Subsequent panels will be 3 years in length.
SIPP is administered in panels and conducted in waves and rotation groups. Within a SIPPpanel, the entire sample is interviewed at 4-month intervals. These groups of interviews arecalled waves. The first time an interviewer contacts a household, for example, is Wave 1; thesecond time is Wave 2, and so forth. As discussed in Chapter 3, each wave contains corequestions that are asked each time, along with topical questions that vary from one wave to thenext.
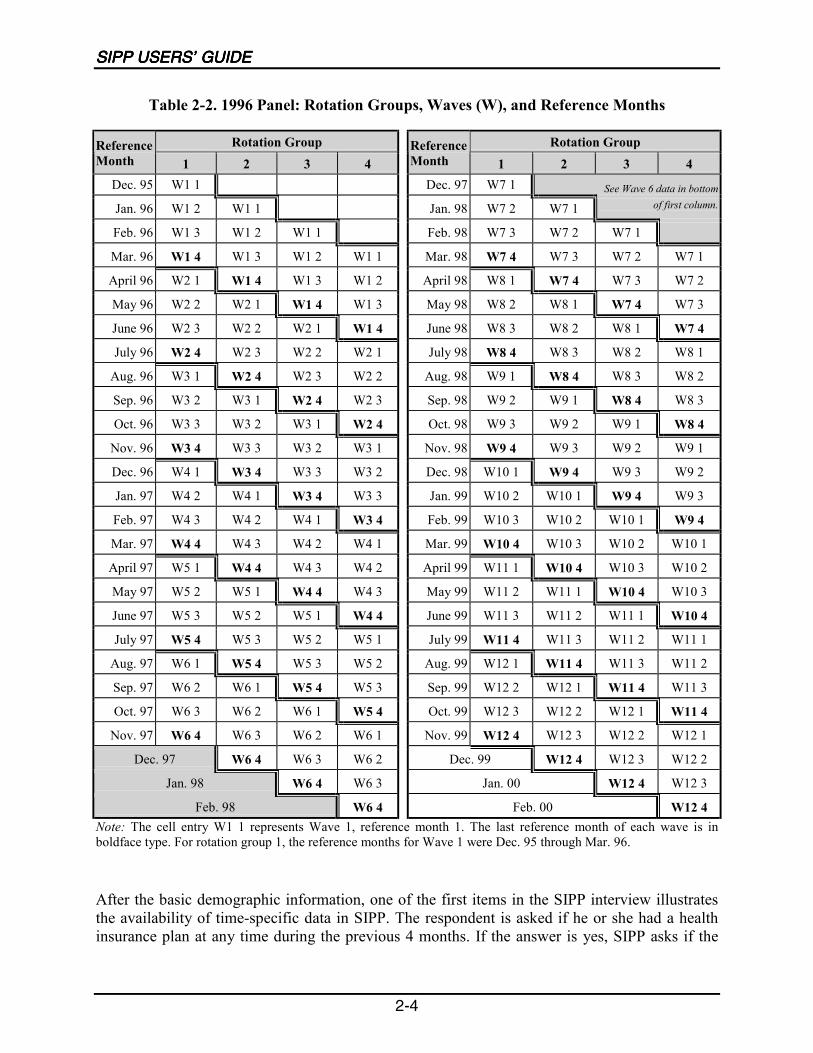
Sample members within each panel are divided into four subsamples of roughly equal size; eachsubsample is referred to as a rotation group. One rotation group is interviewed each month.1During the interview, information is collected about the previous 4 months, which are referred toas reference months. Thus, each sample member is interviewed every 4 months, with informationabout the previous 4-month period collected in each interview (see Table 2-2).
PanelsPanelsPanelsPanels
The original design of SIPP called for an initial selection of a nationally representative sample ofhouseholds, with all adults in those households being interviewed once every 4 months over a32-month period. In addition, interviews were to be conducted with any other adults living withoriginal sample members at subsequent waves. The first sample, the 1984 Panel, began 1 The month in which the interview takes place is called the interview month.
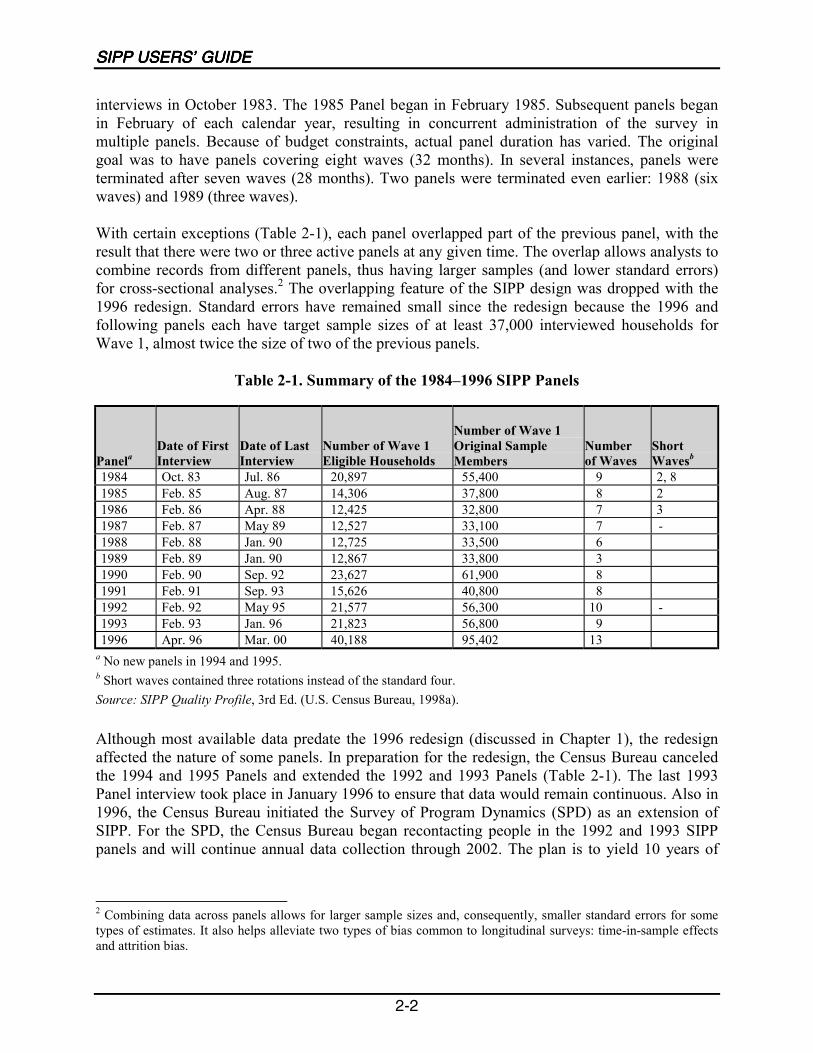
interviews in October 1983. The 1985 Panel began in February 1985. Subsequent panels beganin February of each calendar year, resulting in concurrent administration of the survey inmultiple panels. Because of budget constraints, actual panel duration has varied. The originalgoal was to have panels covering eight waves (32 months). In several instances, panels wereterminated after seven waves (28 months). Two panels were terminated even earlier: 1988 (sixwaves) and 1989 (three waves).
With certain exceptions (Table 2-1), each panel overlapped part of the previous panel, with theresult that there were two or three active panels at any given time. The overlap allows analysts tocombine records from different panels, thus having larger samples (and lower standard errors)for cross-sectional analyses.2 The overlapping feature of the SIPP design was dropped with the1996 redesign. Standard errors have remained small since the redesign because the 1996 andfollowing panels each have target sample sizes of at least 37,000 interviewed households forWave 1, almost twice the size of two of the previous panels.
a No new panels in 1994 and 1995.b Short waves contained three rotations instead of the standard four.Source: SIPP Quality Profile, 3rd Ed. (U.S. Census Bureau, 1998a).
Although most available data predate the 1996 redesign (discussed in Chapter 1), the redesignaffected the nature of some panels. In preparation for the redesign, the Census Bureau canceledthe 1994 and 1995 Panels and extended the 1992 and 1993 Panels (Table 2-1). The last 1993Panel interview took place in January 1996 to ensure that data would remain continuous. Also in1996, the Census Bureau initiated the Survey of Program Dynamics (SPD) as an extension ofSIPP. For the SPD, the Census Bureau began recontacting people in the 1992 and 1993 SIPPpanels and will continue annual data collection through 2002. The plan is to yield 10 years of
2 Combining data across panels allows for larger sample sizes and, consequently, smaller standard errors for sometypes of estimates. It also helps alleviate two types of bias common to longitudinal surveys: time-in-sample effectsand attrition bias.
SIPP SAMPLE DESIGN AND INTERVIEW PROCEDURESSIPP SAMPLE DESIGN AND INTERVIEW PROCEDURESSIPP SAMPLE DESIGN AND INTERVIEW PROCEDURESSIPP SAMPLE DESIGN AND INTERVIEW PROCEDURES
2-3
data (1992�2001) for those two panels to support analyses of changes during welfare reform andfor the pre- and postreform periods (Chapter 1).
Waves and Rotation GroupsWaves and Rotation GroupsWaves and Rotation GroupsWaves and Rotation Groups
One full 4-month cycle of administering the questionnaire to the entire panel is a wave. The 1984through 1993 Panels were designed to have eight waves each, although more often than not thenumber of waves actually administered was different (Table 2-1). The 1996 Panel has 12 waves.
Rotation groups are random subsamples of approximately equal size. Each month, the membersof one rotation group are interviewed; over the course of 4 months, all rotation groups areinterviewed, providing data for the full set of 4 months. For many survey items, SIPP collectsdata for each of the 4 calendar months preceding the interview month. Those 4 months togetherare called reference months, or the reference period. (Table 2-2 provides an illustration of thereference months for the various rotation groups in each wave of the 1996 Panel.)
The reference period length and the timing of the interviews address several concerns:respondent recall error, which increases as the recall period lengthens; respondent burden, whichincreases with the number of times they are interviewed; and the costs of frequent interviews. Byspreading the interviews for each wave evenly over 4 months, the rotation group structure allowsthe Census Bureau to keep a skilled and experienced team of interviewers in the field year round.This eases management burden and allows Census Bureau interviewers to master thecomplexities of the SIPP questionnaire and to maintain that mastery.
Each SIPP panel prior to 1990 had fewer than eight waves or contained one wave that consistedof fewer than four rotation groups (Table 2-1). As discussed in Chapter 3, the questionnaireadministered at each wave contains core questions, those asked at every interview, along withsections containing topical questions that vary from one wave to the next. Respondents in theskipped rotation groups have no gap in core data, but they do not provide core data for the fullduration of the panel, and they lack topical data for the wave in which they were skipped.Analysts should be alert to the consequences of the skipped rotations: some topical informationis not available for the full sample, and the length of time an analyst can follow adults from theoriginal sample is reduced for selected rotation groups.
Reference PeriodsReference PeriodsReference PeriodsReference Periods
The reference period for most core items is the 4-month period preceding the month of theinterview for the given wave. Data for most core items are collected for each of the preceding 4months. Some data on labor force characteristics are collected with weekly resolution.Subsequently, weekly labor force characteristics are recorded on a monthly basis.
Feb. 98 W6 4 Feb. 00 W12 4Note: The cell entry W1 1 represents Wave 1, reference month 1. The last reference month of each wave is inboldface type. For rotation group 1, the reference months for Wave 1 were Dec. 95 through Mar. 96.
After the basic demographic information, one of the first items in the SIPP interview illustratesthe availability of time-specific data in SIPP. The respondent is asked if he or she had a healthinsurance plan at any time during the previous 4 months. If the answer is yes, SIPP asks if the
SIPP SAMPLE DESIGN AND INTERVIEW PROCEDURESSIPP SAMPLE DESIGN AND INTERVIEW PROCEDURESSIPP SAMPLE DESIGN AND INTERVIEW PROCEDURESSIPP SAMPLE DESIGN AND INTERVIEW PROCEDURES
2-5
respondent had coverage in each of the individual 4 months. Thus data are collected for 4individual months at each wave. Over the course of a 13-wave panel, data are collected for 52consecutive months for each panel member. For the 1996 Panel, the rotation groups wereinterviewed in order. Specifically, for Wave 1, rotation group 1 was interviewed in April,rotation group 2 in May, rotation group 3 in June, and rotation group 4 in July. For previouspanels, however, the specific months varied slightly among rotation groups. With the 1990Panel, for instance, panel members in rotation group 2 were interviewed first; rotation group 1was actually the fourth rotation group surveyed in that panel.3
SIPP uses a complex sample design that has important implications for the estimation of standarderrors. Because the SIPP design is not a simple random sample, the standard errors reported bymost off-the-shelf statistical software will underestimate the true standard errors of estimatesfrom SIPP. (See Chapter 7 for details.) A detailed description of the SIPP sample design andstandard error calculations can be found in the third edition of the SIPP Quality Profile (U.S.Census Bureau, 1998a).
Selection of Sampling UnitsSelection of Sampling UnitsSelection of Sampling UnitsSelection of Sampling Units
The Census Bureau employs a two-stage sample design to select the SIPP sample. The twostages are (1) selection of primary sampling units (PSUs) and (2) selection of address unitswithin sample PSUs. Census Bureau interviewers follow an established procedure to identifysample members within the selected address units.
Primary Sampling UnitsPrimary Sampling UnitsPrimary Sampling UnitsPrimary Sampling Units
The frame for the selection of sample PSUs consists of a listing of U.S. counties and independentcities, along with population counts and other data for those units from the most recent census ofpopulation. Counties either are grouped with adjacent counties to form PSUs or constitute a PSUby themselves.
Following the formation of the PSUs, the smaller ones, called non-self-representing (NSR)PSUs, are then grouped with similar PSUs in the same region (South, Northeast, Midwest, West)to form strata; census data for a variety of demographic and socioeconomic variables are used todetermine the optimum groupings. A sample of NSR PSUs is selected in each stratum torepresent all PSUs in the stratum. All of the larger PSUs are included in the sample and arecalled self-representing (SR) PSUs.
3 An explanation for the relabeling of rotation groups in earlier panels is provided in Chapter 2 of the 2nd edition ofthe SIPP Users' Guide (U.S. Census Bureau, 1991).
Selection of Addresses in Sample PSUsSelection of Addresses in Sample PSUsSelection of Addresses in Sample PSUsSelection of Addresses in Sample PSUs
SIPP selects addresses from five separate, non-overlapping sampling frames maintained by theCensus Bureau. They are unit (formerly called the address enumeration districts [Eds] frame);area (area EDs frame); group quarters (special places frame); housing unit coverage; a coverageimprovement frame, and a new-construction (or permit) frame. The first three frames are basedon census counts from the most recent decennial census; unit and area frames are determined bya process called �address screening,� which has been done at the block level since 1990. The unitframe lists addresses of housing units located in census blocks in areas that issue buildingpermits and in which at least 96 percent of the addresses are complete (with street name andhouse number). The area frame contains addresses from the remaining census blocks that are notin permit-issuing areas, or where more than 4 percent of the addresses in the blocks are missing.Those addresses are mostly in rural areas. The group quarters frame includes boarding houses,hotel rooms, and institutions that are found in the decennial census but are not counted ashousing units. Together, the three frames provide almost 90 percent of the sample addresses foreach SIPP panel.
The coverage improvement frame is used to include addresses of housing units that were missed inthe census count but were found in postenumeration surveys. The percentage of sample addressesfrom this frame is typically small (0.1 percent of the sample addresses in the 1986 Panel).
The new-construction frame is used to provide coverage of new structures for which buildingpermits have been issued since the last decennial census in areas covered by the unit frame. Thisframe is updated continually, and the percentage of addresses sampled from it increases eachyear until data from another decennial census become available.
Within each sample PSU, the addresses in the sampling frames are grouped into clusters. Theclusters are then sampled, and the selected cluster of addresses is included for interviewing.4 Inthe unit frame, the 1996 Panel had clusters of one housing unit; for prior panels, clusters of twoneighboring addresses were used. In the area and group quarter frames, clusters are constructedwith the expectation of four housing units or housing unit equivalents. With the area frame, thesampled clusters are visited by SIPP interviewers prior to the scheduled interviewing. Theinterviewers list all residential addresses within the selected clusters. With the new-constructionframe, the 1996 Panel has a 50-50 mixture of four- and eight-unit clusters. Previously, clusters offour housing units were formed. No clustering is used with the coverage improvement frame.
Identifying Household Members Within Sampled AddressesIdentifying Household Members Within Sampled AddressesIdentifying Household Members Within Sampled AddressesIdentifying Household Members Within Sampled Addresses
At the time of the first interview, the Census Bureau interviewer visits sampled addresses,verifies the addresses, determines whether they contain occupied housing units, and identifies thehousing units located at each address. A housing unit is defined as a living quarters with its ownentrance and cooking facilities. The people living in a housing unit constitute a household (seebelow). Interviews are conducted at all households in sampled addresses. However, SIPP does 4 In a few cases, where the clusters contain many more housing units than expected, a subsample of addresses isselected.
SIPP SAMPLE DESIGN AND INTERVIEW PROCEDURESSIPP SAMPLE DESIGN AND INTERVIEW PROCEDURESSIPP SAMPLE DESIGN AND INTERVIEW PROCEDURESSIPP SAMPLE DESIGN AND INTERVIEW PROCEDURES
2-7
not treat the household as a continuous unit to be followed in the panel. SIPP is a person-basedsurvey; as discussed below, SIPP follows original sample members regardless of householdcomposition.
The interviewer compiles a roster for each sampled household, listing all people living or stayingat the address. Next, the interviewer identifies those who are household members by determiningif the address is their usual residence (Table 2-3).5 SIPP designates all people who are consideredmembers as original sample members. Over the course of the panel, original sample members arefollowed and interviewed every 4 months.6
Table 2-3. Household Membership
Question
YES(Is Member ofHousehold)
NO(Not Memberof Household)
Person staying at SIPP address at time of interviewMembers of family, visitors, etc.�ordinarily sleeps here Y� here temporarily, no living quarters held elsewhere Y� here temporarily, living quarters held elsewhere NIn Armed Forces, stationed locally and sleeps here YIn Armed Forces, stationed elsewhere and here on leave NStudent temporarily attending school here, living quarters held elsewhere N� married and accompanied by own family Y� student nurse attending school nearby YAbsent person who usually lives at SIPP addressInmate in an institutional special place regardless of whether living quarters arebeing held here
N
Temporarily on vacation, in hospital, and living quarters held YAbsent for work, living quarters held here YAbsent for work, living quarters held here and elsewhere but comes here infrequently NUnmarried college student working away from home during break, living quartersheld here
Y
In Armed Forces, stationed elsewhere YIn school elsewhere, living quarters held�not married or with own family Y� married and accompanied by own family N� attending school overseas N� student nurse living at school NExceptions and doubtful casesPerson with two residences, sleeps most often in other location NPerson with two concurrent residences, sleeps here most often YCitizen of foreign country temporarily in U.S., living on premises of an embassy,ministry, legation, chancellery, or consulate
N
Citizen of foreign country temporarily in U.S.�studying here and no other usualresidence in U.S.
Y
� living and working here and no other usual residence in U.S. Y� visiting or traveling in U.S. NSource: SIPP Information Booklet, 1990 Panel (Waves 1�8) and 1991 Panel (Waves 1�8), Form SIPP-7004A (1-9-89).
5 In most cases, a person is a member of a household if the sample unit is that person's usual place of residence at thetime of the interview. The person may be present or temporarily absent. A person staying in the sample unit who hasno usual place of residence elsewhere is a household member. A usual place of residence is the place where a personnormally lives and sleeps. This must be specific living quarters held for the person to which he or she is free toreturn at any time.6 In the 1993 Panel only, SIPP followed all original sample members regardless of age. Previous panels, as well asthe 1996 Panel, have followed only people 15 years of age or older who were original sample members.
Originally, SIPP did not oversample any groups within the population. Over the years, however,budget constraints dictated a reduction in the SIPP panel size. As a result, analysts found itdifficult to conduct meaningful analyses of government programs for the low-income populationbecause the sample sizes for the subpopulations were too small. In response to those concernsabout the diminished usefulness of SIPP data, the Census Bureau pursued budget initiatives toincrease the sample to its original size and to oversample the low-income population.
Oversampling occurs when certain groups or units are sampled with higher probabilities thanothers. Analysts then have enough cases to complete analysis of subpopulations or subgroups ofthe population. The share of an oversampled group in the resulting sample is greater than itsshare in the population from which it was drawn. Although this imbalance addresses the need forincreased sample sizes for certain subpopulations, analysts looking at the entire sample will needto use weights in their analyses to redress the imbalance (Chapter 8).7
Oversampling in the 1990 PanelOversampling in the 1990 PanelOversampling in the 1990 PanelOversampling in the 1990 Panel
As detailed in the SIPP Quality Profile and discussed in Allen et al. (1993), oversampling wasused with the 1990 Panel, which included about 3,900 predominantly low-income householdsfrom the truncated 1989 Panel (see Tables 2-1 and 2-4). In the 1990 Panel, the Census Bureauincluded all housing units from Wave 1 of the 1989 Panel in which the head of household wasblack, Hispanic, or female with no spouse present living with relatives (FHNSP). Suchhouseholds tend to have higher poverty rates than the general population. The 1990 Panel alsoincluded a small sample of other housing units for the 1989 Panel. Table 2-4 shows thecomponents of the 1990 Panel.
Table 2-4. Composition of the 1990 Panel
ComponentsNumber of EligibleHouseholds
Households in addresses originally to be interviewed first in the 1990 Panel 19,700Households associated with sample addresses first interviewed in February through May1989 (in the 1989 Panel ) and at the time headed by a black, Hispanic, or FHNSPa 2,700Households in one-ninth of all other 1989 Panel sample addresses 1,200a Female head of household with no spouse present living with relatives.Source: Allen, Petroni, Singh, 1993.
Oversampling in the 1996 PanelOversampling in the 1996 PanelOversampling in the 1996 PanelOversampling in the 1996 Panel
The Census Bureau also oversampled the low-income population for the 1996 Panel,8 using 1990decennial census information. Housing units within each PSU were split into high- and low- 7 Weights are needed even if there is no oversampling. See Chapter 8.8 For a more detailed discussion of the 1996 oversample design, see Huggins and King (1997).
SIPP SAMPLE DESIGN AND INTERVIEW PROCEDURESSIPP SAMPLE DESIGN AND INTERVIEW PROCEDURESSIPP SAMPLE DESIGN AND INTERVIEW PROCEDURESSIPP SAMPLE DESIGN AND INTERVIEW PROCEDURES
2-9
poverty strata. If the housing unit received the Census long form that included income questions,the unit�s poverty status was determined directly; for other housing units, poverty status wasassumed on the basis of responses to Census short-form items predictive of poverty rates. TheCensus Bureau then sampled the low-income stratum at 1.66 times the rate of the high-incomestratum in each PSU. Compared with the number of cases produced without oversampling, thisoversampling produced an 18 percent increase in the number of cases in and near poverty atWave 1.9 Even greater gains occurred in some subgroups, such as blacks and Hispanics inpoverty, with a gain in the number of sample cases as high as 24 percent. However, the increasesin effective sample sizes were somewhat smaller after allowance was made for the increasedvariance associated with differential weighting. Also, the sample sizes for the higher income andhigher age groups were reduced.
Following RulesFollowing RulesFollowing RulesFollowing Rules
SIPP is a true longitudinal survey that tracks people over time. With few exceptions, originalsample members are interviewed every 4 months over the duration of the panel. When originalsample members move to new addresses, interviewers attempt to locate them and continue tointerview them every 4 months.
The SIPP rules call for following original sample members who move, provided they are notinstitutionalized, do not live in military barracks, or do not move abroad. Prior to the 1993 Panel,and resuming with the 1996 Panel, original sample members under age 15 who moved were notfollowed. Thus, data were collected for them in subsequent waves only if they either continuedto live with an original sample member 15 years or older or were age 15 by the last day of thereference period in which they moved. With Wave 4 of the 1993 Panel, SIPP began following allchildren who were in original sampled households (SIPP Quality Profile, 1998, pp. 3�6),including babies born to sample members during the panel.
When original sample members move into households with other individuals not previously inthe survey, the new individuals become part of the SIPP sample for as long as they continue tolive with an original sample member. Similarly, when new individuals move in with originalsample members after the first interview, they too become part of the SIPP sample for as long asthey continue to live with an original sample member. If no original sample members live at anaddress where a previous interview was conducted, SIPP does not collect information from thenew occupants of that address.
Figure 2-1 illustrates the following rules in practice.
9 Low-income strata were sampled at a rate of 0.00062389. High-income strata were sampled at a rate of0.00037489. The oversampling rate therefore comes to 1.6642.
Five people (mom, dad, son, daughter, andcousin) reside at this address and thusconstitute a household. Wave 1 interviewconducted for all five people.
Son joined Army and is living in barracks.He is not followed because military basesare outside the scope of the SIPP sample.However, a record exists in the Wave 2interview reflecting proxy responses byanother member of the household.Interviewer takes data on the four peoplewho remain at this address.
SIPP SAMPLE DESIGN AND INTERVIEW PROCEDURESSIPP SAMPLE DESIGN AND INTERVIEW PROCEDURESSIPP SAMPLE DESIGN AND INTERVIEW PROCEDURESSIPP SAMPLE DESIGN AND INTERVIEW PROCEDURES
2-11
Figure 2-1. Following Rules (continued)
Daughter got married; she and husband livewith her parents and cousin at time of Wave3 interview. The husband is interviewed atthe same time that others in the house areinterviewed. There is no further informationtaken on the son (who joined the Army andis living in barracks, which is outside theSIPP universe).
Daughter and her husband moved to a newaddress and formed their own household atthe time of Wave 4. The interviewer takesdata on mom, dad, and cousin in the firsthousehold; and daughter and daughter�shusband in the second household.
The cousin, who is over 15a, moved andnow lives with her mother and father, whowere not in the sample originally. Therefore,for this Wave 5 interview, the interviewertakes data from seven people (mom and dadin the first household, daughter anddaughter�s husband in the second household,and cousin, cousin�s mother, and cousin�sfather) in the third household.
In Wave 6, there is no change from theprevious wave.
a For Waves 4+ of the 1993 Panel only, SIPPfollowed original sample persons under 15 years oldwho moved to other households with or withoutanother original SIPP panel member over 15. In allother panel years, SIPP did not follow originalsample persons under 15 years old who moved toother households with or without another originalSIPP panel member over 15. In this example,therefore, the cousin is followed because she is over15. In the 1993 Panel, the cousin would have beenfollowed without regard to age.
SIPP SAMPLE DESIGN AND INTERVIEW PROCEDURESSIPP SAMPLE DESIGN AND INTERVIEW PROCEDURESSIPP SAMPLE DESIGN AND INTERVIEW PROCEDURESSIPP SAMPLE DESIGN AND INTERVIEW PROCEDURES
2-13
Figure 2-1. Following Rules (continued)
At the time of Wave 7, the interviewerdiscovers that mom and dad have moved outof their old home.
The interviewer locates mom and dad andinterviews them at their new address. Thedaughter and her husband are interviewed attheir previous address, as are the cousin andthe cousin�s parents. Altogether, theinterviewer takes data from seven people(mom, dad, daughter, daughter�s husband,cousin, cousin�s mother, and cousin�s father)in three households.
Mom and dad have separated at the time ofWave 8. Mom is in the same address as inthe previous wave, but dad is in a newlocation; thus they form separatehouseholds. Meanwhile, the daughter andhusband now have a baby and the cousin�shousehold has remained the same. Theinterviewer takes data for eight people(mom, dad, daughter, daughter�s husband,daughter�s baby, cousin, cousin�s mother,and cousin�s father) in four households.
SIPP SAMPLE DESIGN AND INTERVIEW PROCEDURESSIPP SAMPLE DESIGN AND INTERVIEW PROCEDURESSIPP SAMPLE DESIGN AND INTERVIEW PROCEDURESSIPP SAMPLE DESIGN AND INTERVIEW PROCEDURES
2-15
Interviewers rely on several sources of information to locate movers. At the first interview, theinterviewer obtains the name, address, and telephone number of a person who could furnish thenew address should the entire household move. If necessary, interviewers may contact neighbors,employers, mail carriers, real estate companies, rental agents, or postal supervisors to locateoriginal sample members who have moved.
If an entire household moves, the interviewer tries to find the original sample members andinterview them at their new address(es) if they remain in the locality. If the household relocatesinto or close to a different PSU, a SIPP interviewer in that area may interview them. Forexample, if a couple moves from Boston to Seattle, a SIPP interviewer in the Seattle area willlikely interview the couple for the remaining waves of their panel. Should the entire householdmove more than 100 miles away from a SIPP PSU, attempts will be made to interview bytelephone. If the household cannot be reached, the sample members will be dropped from thesurvey. Specifically, they will be treated as Type D noninterviews (Type D noninterviews arediscussed later in the chapter).
If only some original sample members move, the interviewer completes interviews with alleligible household members at both the original address and the address(es) of those who havemoved. If an original sample member leaves a SIPP household and the remaining originalsample members cannot provide a new address, the interviewer will try to find the personthrough the means discussed above. Similar to what happens with a household, if an individualoriginal sample member moves within the United States but more than 100 miles away from aSIPP PSU, a telephone interview will be attempted. When that is not possible, the person istreated as a Type D noninterview.
SIPP does not interview original sample members if they move outside the United States,become members of the military living in barracks, or become institutionalized (e.g., nursinghome residents, prison inmates). The Census Bureau attempts to track such individuals, however.Should they return to the noninstitutionalized resident U.S. population, the Census Bureau willresume trying to interview them.10
Difference Between Movers and Those Who AreDifference Between Movers and Those Who AreDifference Between Movers and Those Who AreDifference Between Movers and Those Who AreTemporarily AwayTemporarily AwayTemporarily AwayTemporarily Away
There is an important difference between a mover and a person who is temporarily away. Amover no longer lives at the sample address. On the other hand, a person is temporarily away ifthe household is that person�s usual place of residence, according to the membership rules givenin Table 2-3, and specific living quarters are held for the person to which he or she is free toreturn at any time. The following two examples may help to illustrate the distinction:
10 A member of the armed forces who lives in a barracks is not eligible for an interview; a member of the armedforces who lives elsewhere is eligible.
! A college student living on campus with a room held at home is still a household member atthe sample address. In this case, the interviewer would try to interview that student or obtaina proxy interview with the household reference person. If the hypothetical college studentoriginally lived in New York and, upon graduation, moved to Los Angeles to live on his orher own, the student would be considered to have moved as of the graduation date. Thestudent�s new address in Los Angeles would become his or her new household, and, if thestudent was an original sample member, he or she would be treated in the same way as anyother original sample member who moved to the new address.
! If a household member is in the hospital following an operation but is expected to comehome, that person is still a household member at the original address. If an individualinterview is not feasible, the interviewer might do a proxy interview for that person. If,however, the person moved into a nursing home, he or she would not be eligible for a SIPPinterview, whether individual or proxy. At each interview, the interviewer asks the status ofany primary sample member who entered an institution between Wave 1 and the currentwave. If the interviewer learns that the person has returned to the noninstitutionalizedpopulation, an interview is attempted.
At Wave 1, interviews are attempted for all members of selected housing units who are 15 yearsof age or older.11 The Census Bureau prefers that all SIPP sample members 15 years of age orolder who are present at the time of the interview answer for themselves unless they arephysically or mentally unable to do so. For those who are absent or incapable of responding,SIPP will accept a proxy interview, usually with another household respondent.
After Wave 1, the interviewer compiles (or updates) a separate household roster for each housingunit, listing all people living or staying at the unit, including anyone who may have joined thehousehold, such as a new spouse or baby, and the dates they entered the household. Theinterviewer then decides whether each person is a household member by using rules thatdetermine whether the person is a usual resident of the unit (Table 2-3).
Key to SIPP data collection is identification of a reference person for the household, an owner orrenter of record. The interviewer lists other people in the household according to theirrelationship to the reference person.
Also noted are people who left the household and their dates of departure. If some�but not all�sample members have moved since the last interview, the interviewer completes interviews at theoriginal address and also obtains the new address(es) of the individuals who moved. For thoseremaining at the same address, the interviewer verifies that certain previously collectedinformation still applies, completes the questionnaire for each person 15 years of age or older,
11 Detailed information about interview procedures is available from the Census Bureau in the SIPP interviewer'sinstruction manual (U.S. Census Bureau, 1993).
SIPP SAMPLE DESIGN AND INTERVIEW PROCEDURESSIPP SAMPLE DESIGN AND INTERVIEW PROCEDURESSIPP SAMPLE DESIGN AND INTERVIEW PROCEDURESSIPP SAMPLE DESIGN AND INTERVIEW PROCEDURES
2-17
and collects certain information for children under age 15. Information is also collected for allnew household members. Movers are interviewed at their new addresses, along with otherhousehold members they are living or staying with at the time.
Most interviews conducted through 1991 were in the form of personal visits. In 1992, SIPPswitched to maximum telephone interviewing to reduce costs. Wave 1, 2, and 6 interviews werestill conducted in person, but other interviews were conducted by telephone to the extentpossible. SIPP telephone interviews and personal visits are carried out by the same interviewerinteracting with the same respondents. Interviewers typically make phone calls from their homes.For security and confidentiality reasons, they are not allowed to use cellular or cordlesstelephones in the interviews. If a standard telephone is not available, the interviews must beconducted face-to-face. Repeated failure to reach a respondent by telephone may also require anin-person visit to the listed address.
When respondents are not able to furnish all requested information at the interview, interviewersarrange to get the answers by telephone if the respondents are willing. Callbacks can also helpcorrect inconsistencies found during questionnaire editing. With the 1996 redesign, computer-assisted interviewing (CAI) was begun. Thus, automatic consistency checks for selected dataoccur during the interview. (For more on editing and imputation, see Chapter 4.)
The 1996 redesign included a change in the method of data collection. Prior to 1996,interviewers used a paper questionnaire. Starting in 1996, however, interviewers beganconducting interviews with a laptop computer. Both the paper survey and the CAI instrumenthave skip patterns that help the interviewer avoid asking irrelevant questions (see Chapter 3 formore on skip patterns). In the paper survey, interviewers would encounter points at which theyhad to look at previously given answers before deciding whether or not to ask certain questions.With CAI, the instrument skips directly to the next applicable question.
NonresponseNonresponseNonresponseNonresponse
All surveys experience some degree of nonresponse. As discussed in Chapter 6, in a longitudinalsurvey such as SIPP, as the number of waves increases, nonresponse may result in acorresponding increase in bias. Since nonrespondents may differ from respondents in terms ofthe variables collected in the survey, the occurrence of nonresponse gives rise to concerns aboutbias in the survey results. Weighting adjustments are made in an attempt to reduce or eliminatebias (Chapter 8), but concerns about nonresponse bias remain.
The rate of sample loss12 in SIPP generally declines from one wave to the next. The total numberof sample members lost, also known as total sample attrition, always increases over time.Wave 1 nonresponse rates for SIPP have been about 7.7 percent.13 There is usually a sizable 12 The accumulation of cases that are no longer being interviewed because of as yet unrecovered refusals or as yetunfound movers.13 Nonresponse rates have not been stable, ranging from 6.70 percent for the 1984 through 1990 Panels to 8.48percent for the 1991 through 1996 Panels.
sample loss at Wave 2, with a lower rate of additional attrition occurring at each subsequentwave. Prior to the 1992 Panel, SIPP lost roughly 20 percent of the original sample by the panel�scompletion. The sample loss rate for the 1996 Panel was 35.5 percent by the end of the 12th, orfinal, wave. Chapter 6 in this volume and the SIPP Quality Profile provide more detaileddiscussions of the implications of nonresponse for data quality. SIPP deals with the various typesof nonresponse by weighting adjustments or imputation (Chapters 8 and 4). Table 2-5 showscumulative loss rates for two types of nonresponse, discussed below.
The Census Bureau distinguishes between household and person nonresponse. Householdnonresponse occurs either when the interviewer cannot locate the household or the wheninterviewer locates the household but cannot interview any adult household members. Person-level nonresponse occurs when at least one person in the household is interviewed and at leastone other person is not�usually because that person refuses to answer the questions, or isunavailable and no proxy is taken. The Census Bureau categorizes household nonresponse asTypes A and D (detailed definitions and discussion of rates follow),14 and person-levelnonresponse as Type Z.
Type A household nonresponse occurs when the interviewer finds the household�s address, butobtains no interviews. Those households contain people eligible for SIPP interviews, but everyeligible member of the household is a noninterview. Examples of Type A nonresponse includethe following:
! The interviewer finds no one at home despite repeated visits.
! All eligible household members are away during the entire interview period (e.g., anextended vacation).
! Household members refuse to participate in the survey.
! The interviewer cannot reach the housing unit because of impassable roads, such as from anatural disaster.
! Interviews cannot be taken because of serious illness or death in the household.
When this type of household nonresponse occurs in Wave 1, SIPP makes no attempt to interviewthe household members at subsequent waves. For Type A nonresponse that occurs in subsequentwaves, however, interviewers try to obtain interviews on the following wave. New Type Anoninterviews represent the first time a Type A household nonresponse occurred. Old Type A
14 The Census Bureau recognizes two other types of household noninterviews. Type B occurs in Wave 1 when theaddress unit is vacant or in some way unfit for residence; in subsequent waves, Type B occurs when people enterinstitutions. Type C occurs in Wave 1 when the housing unit has been demolished or converted to some other use; insubsequent waves, Type C occurs when all sample members in a household are outside the scope of the survey, e.g.,deceased, living abroad, or living in armed forces barracks.
Table 2-5. Household Noninterview and Sample Loss Rates: 1990�1996 Panels
12 � � � � � � � � � � � � � 6.2 35.5Note: The sample loss rate is the cumulative noninterview rate adjusted for unobserved growth in the Type A noninterview units (created by splits).Source: SIPP Quality Profile, 3rd Ed. (U.S. Census Bureau, 1998a).
nonresponse represents unsuccessful attempts to convert a Type A noninterview from theprevious wave. Two consecutive Type A noninterviews render the case ineligible for interviewsat the following wave.15
Type D household nonresponse concerns original sample members who move to an unknown oruninterviewable address; it applies only to Wave 2 and beyond. Those noninterviews occur whena household or some members of a household are living at an unknown new address or at anaddress located more than 100 miles from a SIPP sample area and cannot be contacted bytelephone.16 For the 1996 Panel, Type D noninterviews are attempted three times before they aredropped.
Person NonresponsePerson NonresponsePerson NonresponsePerson Nonresponse
There are two forms of person-level, or Type Z, nonresponse. The first applies to those instancesin which a sample person was in the household during part (or all) of the reference period andwas part of the household on the date of the interview but refused to answer, or was not availablefor the interview and a proxy interview was not obtained. The second form of Type Znoninterview occurs when a person was part of the household during part of the 4-monthreference period but then moved and was no longer a household member on the date of theinterview.17 While household nonresponse is usually handled by weighting adjustments, Type Zcases are handled by imputation (i.e., they are matched to donors, and data from the donor caseare substituted for the missing interview�see discussion of imputation and weighting inChapters 4 and 8). Nearly half of SIPP Type Z nonrespondents are not interviewed at any of thewaves.
Item nonresponse is an additional source of missing data; it occurs when a respondent does notanswer one or more questions, even though most of the questionnaire is completed. Respondentsmight refuse to answer a particular question or set of questions. Sometimes, item nonresponse
15 For each wave, the rate of Type A nonresponse is calculated by adding the number of Type A noninterviews forthe wave to the number of Type A noninterviews dropped from the sample in prior waves and dividing that sum bythe total of the number of interviewed households plus all Type A and Type D noninterviews.16 For each wave, the rate of Type D nonresponse is calculated by adding the number of Type D noninterviews forthe wave to the number of Type D noninterviews dropped from the sample in prior waves, and dividing that sum bythe total of the number of interviewed households plus all Type A and Type D noninterviews.17 If the person was an original sample member, information will be taken for the portion of the reference period inwhich he or she was still at the address, and an effort will be made to locate the person. If the person was not anoriginal sample member, information will be taken for the portion of the reference period in which he or she wasstill at the address, after which the person will not be pursued.
SIPP SAMPLE DESIGN AND INTERVIEW PROCEDURESSIPP SAMPLE DESIGN AND INTERVIEW PROCEDURESSIPP SAMPLE DESIGN AND INTERVIEW PROCEDURESSIPP SAMPLE DESIGN AND INTERVIEW PROCEDURES
2-21
occurs when respondents do not have the information requested.18 Although interviewers aretrained to attempt to persuade respondents to answer all applicable questions, and will call backif a respondent can provide data at a later time, those efforts are not always successful. Itemnonresponse can also result from the postinterview data editing process when respondentsprovide inconsistent information or when an interviewer incorrectly records a response. In manycases, the Census Bureau handles item nonresponse by imputation, that is, by assigning valuesfor the missing items (Chapter 4).
18 The information provided may also be inconsistent with edit specifications, and the response is thus deletedduring the processing stage. Or, interviewers may forget to ask for the information or record it incorrectly, resultingin an edit failure. See Chapter 4 on editing and imputation.
This chapter provides analysts using the Survey of Income and Program Participation (SIPP)with an overview of the survey content. SIPP is a longitudinal survey that collects information ontopics such as poverty, income, employment, and health insurance coverage. SIPP core contentcovers demographic characteristics, work experience, earnings, program participation, transferincome, and asset income. Each interview wave contains additional topical content, includingone or more topical modules, allowing the Census Bureau to address a range of subjects.1
The SIPP InterviewThe SIPP InterviewThe SIPP InterviewThe SIPP Interview
With the 1996 Panel, computer-assisted interviewing (CAI) was introduced. SIPP interviewersbegan using a laptop computer to collect survey data.2 CAI presents a number of advantages overinterviewing with a paper instrument, the method used in previous panels (Chapter 2). Surveyelements appear seamless to both the interviewer and the respondent. In addition, the CAIinstrument makes certain decisions about which questions to ask, whom to ask, and so forth, thatwere once left to the discretion of the interviewer. CAI also allows much of the core contentfrom prior waves to be referenced in each interview. The CAI instrument uses responses andcomplicated logic from one part of the interview in subsequent parts of the interview, whichpermits checking for consistency and accuracy in the data while the interviewer is still in contactwith the household.
This chapter will associate the word core with items in the survey that remain constant from onewave to the next, and the word topical with items that do not appear in every wave. For both theCAI instrument and the pre-1996 paper survey, data gathered every time the survey is conductedare referred to as core content. The core questionnaire collects critical labor force, income, andprogram participation data and is repeated at each interview. Questions asked periodically andtargeted to specific topics outside the range of the core content provide topical content and arereferred to as topical modules.
Cooperative, available respondents 15 years of age and older answer questions for themselves, tothe extent possible. While questionnaires are not completed for household members under age15, information is collected about them so that household members under age 15 are fullyrepresented in the SIPP sample. When necessary, information in the CAI instrument is used todetermine the next best person in the household with whom a dependent or proxy interviewshould be conducted; that is often, but not always, the reference person (Chapter 2). 1 Analysts should consult the actual survey instrument for answers to specific questions about the ordering andwording of survey items. The technical documentation can be ordered separately (Chapter 5). The SIPP InterviewerProcedures Manual also can be ordered from the Census Bureau.2 Although all interviews were conducted using an automated survey instrument residing on a laptop, not allinterviews were done in person. In some cases, interviews were conducted by phone from the interviewer�s home.
Skip patterns within SIPP control which questions are asked of each respondent. Skip patternstailor the questions to the circumstances of the respondent and bypass irrelevant questions. Forexample, if a respondent has already said that he or she did not work during the reference period,the skip pattern will prevent the interviewer from asking the person what kind of job was heldduring that time. The CAI instrument automatically calls up the next relevant question, makingthe skip patterns transparent to both interviewers and respondents. Before the introduction ofCAI, interviewers followed instructions on the paper survey in order to skip inappropriatequestions. Figure 3-1 illustrates the way in which skip patterns worked in the paper survey. SinceCAI handles skip patterns from �behind the scenes,� Figure 3-1 might also be viewed as showingwhat is invisible in CAI.
Figure 3-1. Skip Pattern Example
7c. Could . . . have taken a job during those weeks if Could . . . have taken a job during those weeks if Could . . . have taken a job during those weeks if Could . . . have taken a job during those weeks ifone had been offered?one had been offered?one had been offered?one had been offered?
__ Yes – Skip to 7e
__ No
7d. What was the main reason . . . could not take aWhat was the main reason . . . could not take aWhat was the main reason . . . could not take aWhat was the main reason . . . could not take ajob during those weeks?job during those weeks?job during those weeks?job during those weeks?
Mark (x) only one.
__ Already had a job
__ Temporary illness
__ School
__ Other (Specify) _____
[Notes to interviewers are italicized; respondent�s name is filled in; and statements read to respondents are in bold.]
Core ContentCore ContentCore ContentCore Content
Core questions are typically asked at the start of the interview. At the beginning of eachhousehold visit, the Census Bureau interviewer completes or updates a roster listing allhousehold members, verifies basic demographic information about each person, and checkscertain facts about the household. The CAI instrument performs �behind the scenes� casemanagement functions at the same time. Prior to the advent of CAI, that information wascontained on the control card, which provided a mechanism for carrying information forwardfrom one wave to the next for each sample member. Core questions covering key areas of SIPPfollow the initial questions. For the most part, the 1996 Panel and prior panels cover the samecontent; however, the organization of the content within the 1996 CAI instrument is somewhatdifferent.
Core Content for 1996 and Subsequent PanelsCore Content for 1996 and Subsequent PanelsCore Content for 1996 and Subsequent PanelsCore Content for 1996 and Subsequent Panels
SIPP core content covers a variety of topics, including labor force status and employment,earnings, business ownership, assets, income, program participation, child support collection,health insurance, and education, among others. While CAI allows the SIPP interview to proceedseamlessly, analysts will perceive distinct sections within the core data.
Employment and EarningsEmployment and EarningsEmployment and EarningsEmployment and Earnings
The first group of survey questions addresses employment and earnings. This section collectsinformation about the respondent�s labor force status for each week of the reference period;identifies characteristics of employers, self-employment, and businesses the respondent mightown; and gathers data about earnings, whether from a job or from self-employment. Respondentsare asked about their labor force status and any unemployment compensation for a time periodcovering the beginning of the 4-month reference period up through the date of the interview. Thetype of work performed and dates of employment are also noted. The interviewer asksrespondents who own businesses whether they are active in its management, own it as aninvestment, or are involved in some combination thereof. The survey also collects data on timespent looking for work, moonlighting, and the current employment situation for up to two jobsand two businesses. Employment status is derived from information about specific jobs.
The flow of the survey is such that questions about employment and job characteristics are askedfirst, with amounts collected separately. Probes ensure that amounts are reasonable and that grossamounts are obtained. Respondents are asked to refer to records whenever possible.
Program, General, and Asset IncomeProgram, General, and Asset IncomeProgram, General, and Asset IncomeProgram, General, and Asset Income
These questions focus on income from a source other than the respondent�s work situation. Manyof the questions address income or benefits from programs such as Social Security or FoodStamps (and in 1996 have been adapted to capture postreform welfare benefits); the survey alsocollects information about retirement, disability and survivors� income, unemployment insuranceand workers� compensation as well as severance pay, lump-sum payments from pension orretirement plans, child support, and alimony payments. A set of general income questions takesinformation collected previously and obtains more details about who is covered, how paymentsare received, reasons for receiving government transfer income, and other data having to do withprogram participation. SIPP also collects information on amounts of �roll over� retirementaccounts.
To obtain information on asset income, interviewers ask respondents which assets they own,prompting the respondent from a list including U.S. savings bonds, 401(k) plans, stocks, rentalproperty, and the like. Respondents are also asked if they have received any lump-sum or regularpayments from an IRA, Keogh, 401(k), or thrift plan. Other questions address income receivedfrom assets owned, other than retirement accounts. Income for some assets is collected and
recorded within preset ranges. Most asset income is recorded in exact amounts wheneverpossible, however. The issue of joint ownership of assets is also addressed.
SIPP core content also includes small sections that deal with health insurance ownership andcoverage (Medicare coverage, Medicaid, private and employer-provided health insurance, andreasons for noncoverage), education (educational attainment, adult school enrollment, andeducational assistance), and energy assistance and school lunch program participation.
Table 3-1 lists possible income and benefit sources, along with some special indicators.
Core Content for Pre-1996 PanelsCore Content for Pre-1996 PanelsCore Content for Pre-1996 PanelsCore Content for Pre-1996 Panels
Core content in the paper surveys used before the 1996 Panel was structured differently, in fourvery distinct sections that are described below.
Labor Force and RecipiencyLabor Force and RecipiencyLabor Force and RecipiencyLabor Force and Recipiency
The first set of survey questions addressed the respondent�s labor force status, sources of anyincome received, participation in government transfer programs, and health insurance coverageduring the 4-month reference period. Respondents were asked about any employment duringeach of the 4 months prior to the interview month, although detailed information about theirspecific jobs was not collected here. Respondents who were employed were asked about thenumber of hours they worked during a typical week and the number of weeks they worked. Forthose who did not work, SIPP interviewers asked if they were on layoff or had looked for a job.These survey questions also elicited whether any income had been received from a list ofpotential sources, including government programs. Respondents were asked about theirownership of assets, although this section of the interview did not include questions aboutamounts earned in those assets.
Earnings and EmploymentEarnings and EmploymentEarnings and EmploymentEarnings and Employment
This section of the SIPP core asked respondents who reported any employment during the 4-month reference period covered by the interview a more detailed series of questions about thejobs they held. Interviewers collected information for up to two different �wage and salary� jobsin each wave. For each job, data were collected on occupation, industry, and work activities andduties. Several questions aimed to determine the total pay from each job for each month of thereference period. Similar information was collected for up to two different �self-employment�jobs in each wave.
Wage or Salary IncomeIncome from job 1Income from job 2Income from business 1Income from business 2
Program and Miscellaneous Income (GeneralAmounts Type 1)
Social SecurityU.S. Government Railroad Retirement paymentsFederal Supplemental Security IncomeState Supplemental Security IncomeState unemployment compensationSupplemental Unemployment BenefitsOther unemployment compensationVeterans compensation or pensionsBlack Lung paymentsWorker�s CompensationState temporary sickness or disability benefitsEmployer or union temporary sickness benefitsEmployer disability paymentsSeverance payPayments from a sickness, accident, or disability
insurance policy purchased on your ownAid to Families with Dependent Children/Temporary
Assistance for Needy FamiliesGeneral Assistance or General ReliefFoster child care paymentsOther welfareWomen, Infants and Children nutrition programsPass through child support paymentsFood StampsChild support paymentsAlimony paymentsPension from company or unionFederal Civil Service or other federal civilian employee
pensionsU.S. military retirement payNational Guard or Reserve Forces retirementState government pensionsLocal government pensionsIncome�paid-up life insurance policies or annuitiesEstates and trustsOther payments for retirement, disability, or survivorGI Bill/VEAP education benefitsOther VA educational assistanceDraw from IRA/Keogh 401(k) or thrift planIncome assistance from a charitable groupMoney from relatives or friendsLump-sum paymentsIncome from roomers or boardersNational Guard or Reserve payIncidental or casual earningsOther cash income not included elsewhere
Asset Income (General Amounts Type 2)Regular/passbook savings accounts in a bank, savings
and loan, or credit unionMoney market deposit accountsCertificates of Deposit or other savings certificatesNOW, Super NOW, or other interest-earning checking
accountsMoney market fundsU.S. government securitiesU.S. Government Savings Bonds (E, EE)Municipal or corporate bondsIRA or Keogh accountOther interest-earning assetsStocks or mutual fund sharesRental propertyMortgages from which payments are receivedRoyaltiesOther financial investments not already mentioned
Noncash Income (other than WIC and Food Stamps)Public housing occupancyRent subsidiesEnergy assistanceSubsidized school lunches or breakfasts
Special IndicatorsWorkedDisabledVA disability rating of 100%VA disability of less than 100%MedicareMedicaid
Educational AssistanceCollege work studyHealth or Nursing Grant, ROTC, NSF GrantStafford GrantPerkins GrantSLS GrantGrant, scholarship, tuition reimbursement from school
attendedTeaching or research assistantship from school attendedGrant or scholarship from the state, such as SSIGP,
Douglas scholarshipsGrant or scholarship from some other Source, such as
foundation, corporation, community group, NationalMerit scholarships
PELL GrantSupplemental Educational Opportunity GrantsNational Direct Student LoanGuaranteed Student LoanJTPA trainingEmployer assistanceFellowship/scholarshipOther financial aid
Amounts of Income ReceivedAmounts of Income ReceivedAmounts of Income ReceivedAmounts of Income Received
The third group of core questions addressed the amounts of income or benefits received fromsources other than earnings.3 Detailed information was also collected about participation ingovernment transfer programs. For each nongovernment, nonasset source reported (e.g., alimonypayments), respondents were asked the amount of income received during each of the prior 4months. If benefits were received from government programs, respondents were asked the reasonfor program participation and who within the household was covered. Questions about assetincome, from sources such as interest, dividends, rents, and royalties, sought only the totalamount for the 4-month reference period. Examples of assets include money market funds,stocks, rental property, and other financial investments. An example of income earned from anasset would be the interest from a savings account.
Program QuestionsProgram QuestionsProgram QuestionsProgram Questions
The final section of the SIPP core included questions about participation in programs thatprovide subsidized housing, energy assistance, and school meal programs.
Topical questions are those that are not repeated in each wave. These questions usually appear inseparate topical modules that follow the core questions. Topical modules are designed to gatherspecific information on a wide variety of subjects. They provide a broader picture of the types ofindividuals who are responding to the survey and give SIPP some flexibility in collecting data onemerging issues. Some topical modules are included in each panel but, unlike the core content,are not in each wave. The frequency and timing of these modules may vary. For example, thepersonal history topical modules are always administered once, in Waves 1 and 2. Other topicalmodules are asked multiple times within the same panel; the Assets and Liabilities module, forexample, is included four times within the 1996 Panel.
In some instances, the interview flows more smoothly if topical questions are placed with corequestions that relate to the same topic. For example, topical questions on asset balances aredivided between items included in the core questionnaire and items included in a separate topicalmodule. SIPP asks questions about ownership and an income amount in the core. Questionsrelating to asset balances appear in the asset topical module. Similarly, home-based-employmentand size-of-firm data collected in the 1992 and 1993 Panels (Waves 6 and 3, respectively) areincorporated into the core questionnaire. The term topical module, therefore, actually refers to alltopical items of the same theme, instead of those that are grouped together into a distinct module,because the frequency with which the item appears is more important than its location.
3 As with all of SIPP, respondents include all people 15 years old and over. When children under 15 have their ownincome, it is recorded as having been received by an adult on their behalf.
Reference periods for items in topical modules vary widely, ranging from the respondent�s statusat the time of the interview to the respondent�s experience over his or her entire life. Whenworking with data from the SIPP topical modules, analysts should check question wordingconcepts carefully to ascertain the reference period. They should also check the universe for eachquestion, because topical modules are not uniformly asked of all respondents. For example, onlypeople 25 years of age or older are asked topical module questions about their retirement andpension accounts. Questions on shelter costs and energy usage are asked only of the referenceperson. In other modules, a screening question will determine who is and is not asked theremainder of the module�in the case of the Work Schedule module, for example, only thosewho worked during the previous month answer the entire set of questions.
The relationship between topical module titles and content is not perfectly consistent. Over thehistory of SIPP, there have been situations in which either the topical module content changedwith no change in title or the topical module title changed with little change in content. In a fewsituations, content has �floated� from one topical module to another. And sometimes there hasbeen significant overlap in content between two topical modules with different titles.
The actual questions are provided with the microdata technical documentation. Specific topicalmodules are discussed below, with the panels and waves listed in brackets (e.g., [93-3, 96-6] fora module asked in the third wave of the 1993 Panel and the sixth wave of the 1996 Panel).Chapter 5 lists topical modules and the panels and waves in which they were included in thesurvey. Table 3-2 groups topical modules thematically (modules may appear in more than onecategory).
Adult Well-Being; Children�s Well-Being; Functional Limitations and Disability; Healthand Disability; Health Status and Utilization of Health Care Services; Long-Term Care;Medical Expenses and Work Disability; Work Disability History
Financial Annual Income and Retirement Accounts; Assets and Liabilities; Real Estate Property andVehicles; Recipiency History; Retirement Expectations and Pension Plan Coverage;School Enrollment and Financing; Selected Financial Assets; Shelter Costs and EnergyUsage; Support for Nonhousehold Members; Taxes
Child Care &Financial Support
Child Care; Child Support Agreements; Child Support Paid; Support for NonhouseholdMembers
Education &Employment
Education and Training History; Employment History; Job Offers; School Enrollment andFinancing; Work-Related Expenses; Work Schedule
Family & HouseholdCharacteristics &Living Conditions
Extended Measures of Well-Being; Family Background; Fertility History; HouseholdRelationships; Marital History
Personal History Education and Training History; Employment History; Fertility History; Marital History;Migration History; Recipiency History; Work Disability History
Welfare Reform Eligibility for and Recipiency of Public Assistance; Benefits; Job Search and TrainingAssistance; Job Subsidies; Transportation Assistance; Health Care; Food Assistance;Electronic Transfer of Benefits; Denial of Benefits
Specific Topical ModulesSpecific Topical ModulesSpecific Topical ModulesSpecific Topical Modules
Adult Well-Being. Adult Well-Being. Adult Well-Being. Adult Well-Being. Asks the reference person about consumer durables, living conditions,crime, neighborhood conditions, community services, basic needs, and food adequacy. Thistopical module assesses the standard of living of SIPP respondents. It is similar to ExtendedMeasures of Well-Being and incorporates Basic Needs information that was asked as a separatemodule in 93-9. [93-9, 96-8]
Annual Earnings and Benefits. Annual Earnings and Benefits. Annual Earnings and Benefits. Annual Earnings and Benefits. Includes questions that ask people about their calendar-yearwages and salaries and income from their own businesses, as well as the receipt of certainemployer-provided benefits not covered elsewhere in SIPP, such as the use of a company car ortruck, an expense account, or the provision of free meals and lodging. In addition, a series ofquestions is administered about reasons for leaving for those persons who left a job during thecalendar year. Questions about calendar-year earnings, taxes, health and life insurancedeductions, and retirement contributions are designed to obtain the most accurate data available,and respondents are encouraged to refer to W-2 forms and other records. This module isadministered twice per panel. [84-6]
Annual Income and Retirement Accounts. Annual Income and Retirement Accounts. Annual Income and Retirement Accounts. Annual Income and Retirement Accounts. Obtains respondent estimates of calendar-yearbusiness income and respondents� personal retirement plans. The module asks about businessesowned by respondents, gross income and expenses to such businesses, net income to suchbusinesses, retirement accounts, including IRA, Keogh, and 401(k), and respondent participationin those retirement plans. [84-9, 85-5, 85-8, 86-5, 87-5, 88-5, 90-5, 90-8, 91-5, 91-8, 92-5, 92-893-5, 93-8, 96-4, 96-7, 96-10]
Assets, Liabilities, and Eligibility. Assets, Liabilities, and Eligibility. Assets, Liabilities, and Eligibility. Assets, Liabilities, and Eligibility. Collects information about the value of assets and debton assets and expands on data gathered in the core questions. The intent of this topical module isto derive a comprehensive measure of household net worth and to collect information used todetermine eligibility for federal assistance programs. To that end, the topical module includesselected additional questions needed to determine program eligibility. Some of the assetsincluded are savings accounts, stocks, mutual funds, and bonds. Data on unsecured liabilitiessuch as loans, credit cards, and medical bills are also gathered. Assets and liabilities that are heldjointly are identified to prevent double-counting. The 1996 version of this module has sevensections: value of business; interest earning accounts; stocks and mutual funds; mortgages; otherassets; assets and liabilities; and real estate, shelter costs, dependent care, and vehicle ownership.(Also asked as Assets and Liabilities.) [84-4, 84-7, 85-3, 85-7, 86-4, 86-7, 87-4, 90-4, 91-7, 92-4,93-7, 96-3, 96-6, 96-9, 96-12]
Child Care. Child Care. Child Care. Child Care. Collects information about all child care arrangements, for all children under 15,from mothers, single fathers, or guardians, regardless of labor force status. Those with childrenunder age 15 are asked about the type of child care arrangements, who provides the care, thenumber of hours of care per week, where the care is provided, and the cost of the care. Themodule asks whether a relative or nonrelative cared for the child, and if the child was in school.Before the 1993 Panel, the module collected information about only one to two child carearrangements from mothers, single fathers, or guardians who were either working, in school, or
looking for a job during the 4-month reference period. [84-5, 85-6, 86-3, 86-6, 87-3, 87-6, 88-3,88-6, 89-3, 90-3, 91-3, 92-6, 92-9, 93-3, 93-6, 96-4, 96-10]
Child Support Agreements. Child Support Agreements. Child Support Agreements. Child Support Agreements. Helps determine whether money received as child supportaffects participation in government programs and whether lack of support from one parent causesthe other parent to need government assistance. The module collects information aboutcharacteristics of child support agreements, the annual amount and frequency of payments, andprovisions for health care costs. Additional questions cover custodial arrangements, contact withpublic agencies for assistance in collection of child support, frequency of contact with the absentparent, current place of residence of the absent parent, and reasons for nonaward of childsupport. Questions about paternity establishment status are also asked about children of womenwith nonwritten agreements and all never married women. [85-6, 86-3, 86-6, 87-3, 87-6, 88-3,88-6, 89-3, 90-3, 90-6, 91-3, 92-6, 92-9, 93-3, 93-6, 93-9, 96-5, 96-11]
Child Support Paid. Child Support Paid. Child Support Paid. Child Support Paid. Serves as a counterpart to the Child Support Agreements module. Itseeks information about support for children of the respondent who are under 21 years old andwho live with another parent or guardian at any time during the module�s reference period of 4months. [96-3, 96-6, 96-9, 96-12]
Children’s Well-Being. Children’s Well-Being. Children’s Well-Being. Children’s Well-Being. Asks the designated parent or guardian about the health of children inthe household, care of the child by nonfamily members, activities the family does with thechildren (such as reading and outings), lessons and activities outside of school, rules forchildren�s TV viewing, and the respondent�s opinion about the quality of the neighborhood. Themodule obtains information about children in three age groups�under 6 years old, ages 6�11,and ages 12�17�for as many as seven children in each category. Certain questions target fathersor stepfathers who are not designated parents; other questions address whether the child attends apublic or private school. Content of this module varies across different panels and waves;analysts should check the documentation for exact content. [92-9, 93-6, 93-9, 96-6, 96-11]
Education and Training History. Education and Training History. Education and Training History. Education and Training History. Collects information about respondent�s highest level ofschool completed or degree received, courses or programs studied, and dates of receipt of highschool and postsecondary degrees or diplomas. The module determines if the respondentattended a public or a private high school. Job-related-training questions address trainingdesigned to help find or develop skills for a new job as well as to improve skills at the current ormost recent job. People 15 years of age and older are asked whether they have received jobtraining; if they have, they are asked about the duration of the training, how it was used, how itwas paid for, and if it was federally sponsored.4 (Variations are also asked as Education andWork History [84-3] and Education and Training [84-6].) [86-2, 87-2, 88-2, 89-2, 90-2, 91-2, 92-2, 93-2, 96-2]
Employer-Provided Health Benefits. Employer-Provided Health Benefits. Employer-Provided Health Benefits. Employer-Provided Health Benefits. Collects data on the availability of health carebenefits from employers and the demographics of workers with and without employer-providedhealth coverage. The module asks whether the plan restricts the respondent to specified doctors, 4 All of the �History� topical modules are designed to collect information about the respondent�s experiences priorto the beginning of the SIPP panel. This information is most useful in combination with the more currentlongitudinal information collected during the panel.
if family members are covered, and whether any family members have pre-existing conditionsnot covered by the plan. The module also asks about long-term health care options. [96-5]
Employment History. Employment History. Employment History. Employment History. Identifies patterns of employment, length of employment at certainjobs, and reasons for any periods of unemployment subsequent to the respondent�s first job.Beginning with the 1996 Panel, specific questions that address type of work done, job duties, andthe industry in which the respondent works were moved into the core content; previously, suchquestions had been part of this module. [86-2, 87-2, 88-2, 89-2, 90-2, 91-2, 92-1, 93-1, 96-1]
Extended Measures of Well-Being. Extended Measures of Well-Being. Extended Measures of Well-Being. Extended Measures of Well-Being. Assesses the standard of living of SIPP respondents.Three types of questions address the objective physical conditions in which the respondents live,respondents� ability to meet specified basic needs during the reference period, and respondents�subjective assessments of the quality of their living situations. Included under the first categoryare questions about the presence and condition of specified consumer durable goods in the home(e.g., clothes washers, refrigerators, air conditioners) and the physical condition of the homeitself (e.g., condition of the roof and walls, state of the home�s electrical wiring and plumbing).Another series of questions concerns conditions in the respondent�s neighborhood, such assafety, cleanliness, and traffic. The second group of questions concerns whether members of therespondent�s household had sufficient food to eat during the 4-month reference period andwhether they were able to pay rent and other bills or to obtain medical care when needed.Respondents are also asked about the sources of help available when the respondent is in need(e.g., family, friends, or community). Finally, respondents rate their satisfaction with the qualityof different aspects of their living conditions. Included are items such as the quality of thefurnishings, convenience of the home to shopping, and the general state of repair of their home.(Some of those questions have been asked as a Basic Needs module [93-9].) [91-6, 92-3]
Family Background. Family Background. Family Background. Family Background. Asked of people between ages 25 and 64. Obtains family characteristicsat the time of the respondent�s 16th birthday, including how many brothers and sisters the personhad, with whom the person lived, the highest grade of school completed by the parents, and theoccupations of the parents. [86-2, 87-2, 88-2]
Fertility History. Fertility History. Fertility History. Fertility History. Asked only of females 15 years of age and older and males 18 and older.Men are asked about the number of children they have fathered, and women are asked abouttheir birth histories. Interviewers ask women who have had children when their first and lastchildren were born, along with questions about their employment status during pregnancy andprior to the birth of their first child, circumstances of any absence from work before and after thefirst birth, and the maternity leave policies of their employers. Postbirth employment is alsocovered. [84-8, 85-4, 86-2, 87-2, 88-2, 89-2, 90-2, 91-2, 92-2, 93-2, 96-2]
Functional Limitations and Disability. Functional Limitations and Disability. Functional Limitations and Disability. Functional Limitations and Disability. Provides data that can be used to evaluate linksbetween types of disability, the family financial situation, and program participation. Thismodule is asked in three variations: overall, adult, and children. Adults are asked the standardActivities of Daily Living (ADL) and Instrumental Activities of Daily Living (IADL) battery ofquestions. Questions address physical and mental conditions affecting the respondent, the use ofmobility aids, vision and hearing impairments, speech difficulties, lifting and aerobic difficulties,and the ability to function independently within the home. For those under age 22, the questions
are modified, referring to age-appropriate activities (e.g., questions about work activities arerecast to ask about analogous school activities). Questions about children also address the use ofspecial education services. For those under age 15, the interviewer asks the questions of thedesignated parent or guardian. [90-3, 90-6, 91-3, 92-6, 93-3 for overall module; 92-9, 93-6, 96-5,96-11 for separate children and adults modules]
Health and Disability. Health and Disability. Health and Disability. Health and Disability. Gathers data for all sample members about their general health,functional limitations (using the standard ADL battery of questions), work disability, and theneed for personal assistance. Respondents are asked about any hospital stays during the referenceperiod, other periods of illness, other health facilities used, and their health insurance coverage.Information on children is collected from a designated parent or guardian. (Variations are alsoasked as Functional Activities, Disability Status of Children, and Disability Questions.) [84-3 forHealth and Disability; 88-6, 89-3 for Functional Activities; 85-6, 86-3, 87-6, 88-3, 88-6, 89-3 forDisability Status of Children; 96-4 for Disability Questions]
Health Status and Utilization of Health Care Services. Health Status and Utilization of Health Care Services. Health Status and Utilization of Health Care Services. Health Status and Utilization of Health Care Services. Asks about hospital stays,including any in psychiatric institutions; other illnesses or injuries that left the respondentbedridden for at least most of 1 day; doctor visits and frequency of visits, dental visits andfrequency of visits; where the respondent seeks health advice (doctor�s office, clinic, hospital);and health insurance coverage. (Also asked as Utilization of Health Care Services.) [85-6, 86-3,87-6, 88-3, 88-6, 89-3, 90-3, 90-6, 91-3, 92-6, 92-9, 93-3, 93-6, 96-3, 96-6, 96-9, 96-12]
Home Health Care. Home Health Care. Home Health Care. Home Health Care. Asks about the type and sources of help given to respondents who neededhelp with their personal care, household activities, and basic errands because of a healthcondition. Respondents are asked if caregivers were relatives or nonrelatives, and whether or notthe caregivers were household members. This module also asks about members of the householdwho might have given such care, on a nonprofessional level, to a person outside the household.Questions determine the relationship of the caregiver and recipient(s) and the kind of care given.[88-6, 89-3]
Household Relationships. Household Relationships. Household Relationships. Household Relationships. Collects information about relationships among householdmembers. The SIPP core questions gather extensive information about household compositionfor each month of the panel. This information allows for the identification of families andsubfamilies and details each household member�s relationship to the household referenceperson.5 As extensive as this information is, it does not cover the interrelationships of allhousehold members. For example, the SIPP core provides no information about the relationshipsbetween members of two different unrelated (to the household reference person) subfamiliesresiding in the same household. This topical module fills that gap by collecting completeinformation about how each member of the household is related to every other member of thehousehold. Relationships are specified in detail; for example, a brother is a full brother, half 5 The family is defined by the Census Bureau as two or more people who are living together and are related byblood, marriage, or adoption. A primary family is the family containing the household reference person; an unrelatedsubfamily is a family that does not contain the reference person or anyone related to the reference person. Relatedsubfamilies are families within the primary family. A daughter and husband living with the daughter�s parents wouldconstitute a related subfamily. The reference person is the person in whose name the home is owned or rented. If thehouse is owned jointly by a married couple, either the husband or the wife may be listed as the reference person.
brother, stepbrother, or adoptive brother. In-law relationships are also identified. [84-8, 85-4, 86-2, 87-2, 88-2, 89-2, 90-2, 91-2, 92-2, 93-2, 96-2]
Housing Costs, Conditions, and Energy Usage. Housing Costs, Conditions, and Energy Usage. Housing Costs, Conditions, and Energy Usage. Housing Costs, Conditions, and Energy Usage. Collects information on mortgagepayments, real estate taxes, fire insurance, principal owned, when the mortgage was obtained,and interest rates; rent; type of fuel used and heating facilities; appliances; and vehicles.6Questions on value of home and automobile are used in conjunction with assets and liabilitiesreported in the Assets and Liabilities Topical Module to calculate each individual�s net worth.This topical module also helps to fulfill a need for information concerning energy usage that hasresulted from increased interest in recent years over the rising costs of energy and concerns aboutconservation. The information can be used in analysis of the requirements of individuals andhouseholds who participate in energy assistance programs. [84-4]
Job Offers. Job Offers. Job Offers. Job Offers. Asks about any job offers received by respondents who were looking for work orwho were on layoff during the reference period. If the respondent was offered a job and did notaccept it, questions probe the reason for rejecting the job and the amount of money that wasoffered. [85-6, 86-3]
Long-Term Care. Long-Term Care. Long-Term Care. Long-Term Care. Focuses on health-related conditions that might cause a person to need helparound the home. Specific questions address the ability of people in the household to managetheir personal care, housework, meal preparation, and basic errands outside the home. Themodule ascertains whether or not individuals providing such assistance are household members.Additional questions ask about community services and the financial burden of acquiringassistance. The module also asks about the activities of respondents who themselves providedsuch assistance on a nonprofessional basis to individuals outside the household. (Also asked asHome Health Care.) [85-6, 86-3, 87-6, 88-3, 88-6, 89-3]
Marital History. Marital History. Marital History. Marital History. Asks questions of all respondents aged 15 and older who have ever beenmarried. The date of the present marriage is determined; for those married more than once, SIPPrecords the dates of their first two marriages and their last marriage, if married more than twice.If appropriate, respondents are asked when their previous marriages ended and whether theywere widowed or divorced at the end of their marriages. [84-8, 85-4, 86-2, 87-2, 88-2, 89-2, 90-2, 91-2, 92-2, 93-2, 96-2]
Medical Expenses and Work Disability. Medical Expenses and Work Disability. Medical Expenses and Work Disability. Medical Expenses and Work Disability. Gathers data about out-of-pocket medicalexpenses, health services, doctor visits, prescription drugs, insurance reimbursement, and healthand physical conditions that might affect the respondent�s ability to work. The reasons for andlength of any hospitalizations are determined, and respondents are asked about the types ofmedical professionals who delivered care. Most questions apply to both children and adults.(Also asked as Medical Expenses.) [87-7, 88-4, 89-4, 90-7, 91-4, 92-7, 93-4, 93-7, 96-3, 96-6,96-9, 96-12]
Migration History. Migration History. Migration History. Migration History. Asks respondents aged 15 and older where they were born, where theyhave lived, and how long they have lived in those places. Respondents born in a foreign country 6 Subsequent to the 1984 Panel, questions on energy usage were combined into a separate module. Vehicles andhousing values are retained together in a module entitled �Real Estate and Vehicles.�
are asked about their citizenship status and when they came to the United States to stay. [84-8,85-4, 86-2, 87-2, 88-2, 89-2, 90-2, 91-2, 92-2, 93-2, 96-2]
Property Income and Taxes. Property Income and Taxes. Property Income and Taxes. Property Income and Taxes. Collects information on rental income received during thecalendar year and on interest earned and/or dividends from assets such as savings accounts,money market deposit accounts, interest-earning checking accounts, bonds, or stocks. They arealso asked about federal and state income tax liabilities and certain other tax information such astype of return, use of selected schedules (for example, Schedula A, Itemized Deductions;Schedule B, Interest or Dividends; or Form 4835, Farm Rental Income), and number ofexemptions. The tax questions are asked in order to develop better estimates of the distribution ofafter-tax income and to help build better microsimulation models of the tax and transfer system.This module is administered twice per panel. [84-6]
Real Estate Property and Vehicles. Real Estate Property and Vehicles. Real Estate Property and Vehicles. Real Estate Property and Vehicles. Gathers information about housing tenure andfinancing, other real estate ownership, and automobile ownership. Home owners are asked aseries of questions that allow the estimation of net real estate equity. Questions about vehiclesaddress ownership, type of vehicle (i.e., car, truck, motorcycle), value, and amount owed. Thosequestions are also used in program eligibility simulations. (A variation of this module is asked asReal Estate, Shelter Costs, Dependent Care, and Vehicles.) [84-7, 85-3, 85-7, 86-4, 86-7, 87-4,87-7, 88-4, 90-4, 90-7, 91-4, 91-7, 92-4, 92-7, 93-4, 93-7]
Reasons for Not Working/Reservation Wage. Reasons for Not Working/Reservation Wage. Reasons for Not Working/Reservation Wage. Reasons for Not Working/Reservation Wage. Ascertains the reasons that persons are notin the labor force and the conditions under which persons might want to join the labor force. Thereservation wage questions ask about the pay rate that a person would require in order to beginworking (Ryscabage, 1987). Questions are also asked about job search and, if people have beenoffered but did not accept a job, the reason they refused it. This module was discontinued afterthe 1985 Panel. [84-5]
Recipiency History. Recipiency History. Recipiency History. Recipiency History. Obtains a profile of a respondent�s pattern of participation in certaingovernment programs prior to the beginning of the SIPP panel. Specific questions address thefirst time a respondent participated in a particular program, the length of participation, and thenumber of times the respondent has been in the program. [86-2, 87-2, 88-2, 89-2, 90-2, 91-2, 92-1, 93-1, 96-1]
Retirement Expectations and Pension Plan Coverage. Retirement Expectations and Pension Plan Coverage. Retirement Expectations and Pension Plan Coverage. Retirement Expectations and Pension Plan Coverage. Obtains information about therespondent�s pension plan coverage for the most important current job or business, andinformation from persons currently receiving retirement benefits from a former job or business.Respondents are asked about their coverage and vesting in pension plans, types of plans, thereasons they are not included by or do not participate in plans, current contributions and amountsof money in their accounts if applicable, and how the money in their own plans is invested. Otherquestions concern loans from pension accounts and treatment of lump sums received from priorjob pension plans.
Respondents currently receiving pension income are asked about the types of pension theyreceive, provisions for cost-of-living adjustments, and health benefits. Respondents are alsoasked Industry and Occupation data about the job or business from which their pensions are
received. (Also asked as Pension Plan Coverage [84-7].) [84-4, 85-7, 86-4, 86-7, 87-4, 90-4, 91-7, 92-4, 93-9, 96-7]
School Enrollment and Financing. School Enrollment and Financing. School Enrollment and Financing. School Enrollment and Financing. Seeks information about basic educational attainment,enrollment in public and private schools, and whether those in government programs differ fromothers in terms of financing their education and their sources of educational assistance. Asked ofpeople aged 15 and older, the module includes questions to pinpoint the grade level of peopleenrolled in a general, technical, or business school; their pattern of full- or part-time enrollment;amount of tuition and fees; costs of room and board; and books and supplies. Specific sources ofeducational assistance, such as the GI Bill or employer assistance, are also determined. (Alsoasked as Education Financing and Enrollment.) [84-9, 85-5, 85-8, 86-5, 87-5, 88-5, 90-5, 90-8,91-5, 91-8, 92-5, 92-8, 93-5, 93-8, 96-5]
Selected Financial Assets. Selected Financial Assets. Selected Financial Assets. Selected Financial Assets. Focuses on the value of such assets as savings bonds, checkingaccounts, retirement accounts, life insurance, and the number of years respondents have heldcertain assets. [87-7, 88-4, 90-7, 91-4, 92-7, 93-4]
Shelter Costs and Energy Usage. Shelter Costs and Energy Usage. Shelter Costs and Energy Usage. Shelter Costs and Energy Usage. Collects information on rent or mortgages, real estatetaxes, and insurance; energy costs; and motor vehicles. The information is pertinent to thedetermination of eligibility for a number of federal assistance programs. (Also asked as HousingCosts, Conditions, and Energy Usage.) [84-4, 86-6, 87-3]
Support for Nonhousehold Members. Support for Nonhousehold Members. Support for Nonhousehold Members. Support for Nonhousehold Members. Provides information about respondents� routinepayments supporting people who are not current household members. Includes both childsupport payments for own children under 21 years of age and payments made to (or for) peoplewho are not children of the respondents�for example, an elderly parent in a nursing home or anadult child living away from home and in an entry-level job. Questions about child supportinclude number of children supported, type and year of agreement, annual amount and method ofpayment, health care provisions and custodial arrangements, and amount of contact with theabsent children. Questions about support for other persons outside the household include theirrelationship to the respondent, living arrangement, and annual amount of support paid. [84-5, 84-8, 85-4, 85-6, 86-3, 86-6, 87-3, 87-6, 88-3, 88-6, 89-3, 90-3, 90-6, 91-3, 92-6, 92-9, 93-3, 93-6,93-9, 96-5]
Taxes. Taxes. Taxes. Taxes. Includes questions about exemptions, calendar-year wages and salaries, income frombusinesses, itemized deductions, and earned income credits. Respondents are asked about federaland state income tax liabilities, exemptions, amounts owed for federal and property taxes, andamounts from a variety of tax schedules. To help ensure accuracy, interviewers encouragerespondents to refer to income tax returns and other records. Historically, this module has beenadministered at least twice per panel, generally in the spring when respondents were likely to bepreparing their tax returns for the prior year. (Also asked as Earnings and Benefits, and PropertyIncome and Taxes.) [84-6, 84-9, 85-5, 85-8, 86-5, 87-5, 88-5, 90-5, 90-8, 91-5, 91-8, 92-5, 92-8,93-5, 93-8, 96-4, 96-7, 96-10]
Time Spent Outside Work Force. Time Spent Outside Work Force. Time Spent Outside Work Force. Time Spent Outside Work Force. Collects information about work history and reasons fornot working. Asked of people 21 or older, this short module addresses up to four periods of 6months or longer in which the respondent did not work at a paid job or business. [90-6]
Welfare History and Child Support. Welfare History and Child Support. Welfare History and Child Support. Welfare History and Child Support. Collects information on how long individuals mayhave received aid from specific welfare programs and on child support agreements and theirfulfillment. The data from the welfare history questions will be used to measure the extent towhich persons and households have been dependent upon government transfer programs in theirgeneral finances and will be helpful in evaluating the effectiveness of the programs.
One series of questions in the module concerns the Food Stamp, AFDC/Temporary Assistancefor Needy Families (TANF), and SSI programs. Current recipients are asked how long they havebeen receiving, or have been authorized to receive, these benefits. Recipients and nonrecipientsare asked whether they had at any previous time applied for benefits, whether they receivedthem, and, if so, when and for how long. This module was incorporated into a series of historymodules, collectively called the Personal History Topical Module, beginning with the 1986Panel.
The Child Support Topical Module attempts to determine whether those entitled to receive childsupport payments have in fact received them. The module asks whether the child supportagreement was court ordered or arranged otherwise and how the payments were to be made. Italso asks for the amount and regularity of payment and whether a child support enforcementoffice has provided any help. [84-5]
Welfare Reform. Welfare Reform. Welfare Reform. Welfare Reform. Seeks information about eligibility for and recipiency of public assistance.Specific questions address benefits, assistance that supports a respondent seeking work oracquiring training, requirements for receiving benefits (such as job hunting, drug testing, etc.),job subsidies, transportation assistance, health care, and food assistance. This module alsogathers information about electronic transfer of benefits and denial of benefits to the respondent.[96-8]
Work Disability History. Work Disability History. Work Disability History. Work Disability History. Asks a series of questions about chronic health conditions that mayaffect the amount or type of work a respondent can do. Included are any such physical, mental,or other health conditions that interfere with the respondent�s ability to work for at least 3months. Questions are asked about when the limiting condition first became an issue, whetherthe person was working at the time, whether the condition resulted from an accident or injury,and if so, where the accident or injury occurred. Shorter-term conditions (including pregnancy)are not included as limiting conditions. [86-2, 87-2, 88-2, 89-2, 90-2, 91-2, 92-2, 93-2, 96-2]
Work-Related Expenses. Work-Related Expenses. Work-Related Expenses. Work-Related Expenses. Asks about work-related expenses for each employer the respondenthad during the reference period. Questions address various costs of working, such as union dues,licenses, special tools, and uniforms. Mode of transportation and mileage driven to and from workare determined, along with any parking or mass transit fees. (Also asked as Work-RelatedExpenses and Child Support Paid.) [84-5, 84-8, 85-4, 86-6, 87-3, 96-3, 96-6, 96-9, 96-12]
Work Schedule. Work Schedule. Work Schedule. Work Schedule. Collects information about the number of hours and days worked during atypical week in the fourth reference month. Questions about whether or not the respondentworked only at home on any days are included. [87-6, 88-3, 88-6, 89-3, 90-3, 91-3, 92-6, 92-9,93-3, 93-6, 93-9, 96-4, 96-10]
4-1
4.4.4.4. Data Editing and ImputationData Editing and ImputationData Editing and ImputationData Editing and Imputation
This chapter describes the data editing and imputation procedures applied to data from theSurvey of Income and Program Participation (SIPP) after completion of the interviews. Threedifferent approaches are used for dealing with missing data in SIPP:
! Weighting adjustments are used for some types of noninterviews;
! Data editing (also referred to as logical imputation) is used for some types of itemnonresponse; and
! Statistical (or stochastic) imputation is used for some types of unit nonresponse and sometypes of item nonresponse.
Weighting is discussed in Chapter 8.
The chapter begins with a brief discussion of the types of missing data and the goals ofimputation in SIPP. It then presents an overview of the editing and imputation procedures used todeal with missing and inconsistent data. Next, the chapter provides a detailed description of eachof the major steps used by the Census Bureau when creating its internal files and the files that arereleased for public use. Prior to 1996 the development of cross-sectional wave files involvedmainly cross-sectional editing and imputation. The longitudinal files involved longitudinalediting. Beginning with the 1996 Panel, the processing procedures for the wave files werereplaced with methods that use prior wave information to inform the editing and imputation of acurrent wave (after wave 1). The generic imputation technique, that is, the hot-deck method, isstill used in the 1996+ Panels, but the donors are now chosen on the basis of similarities inreported prior wave information when that reported information exists.
The SIPP Web site (http://www.sipp.census.gov/sipp/) supplements the information in thischapter with detailed information about all variables on the public use files.
Types of Missing DataTypes of Missing DataTypes of Missing DataTypes of Missing Data
As in all surveys, there are two general types of missing data in SIPP: unit nonresponse and itemnonresponse. Unit nonresponse occurs in SIPP when one or more of the people residing at asample address are not interviewed and no proxy interview is obtained. This can happen for anumber of reasons, described in Chapter 2. Most types of unit nonresponse are dealt withthrough weighting adjustments (see Chapters 2 and 8). However, the data editing and statisticalimputation procedures described in this chapter are used with one type of unit nonresponse: TypeZ noninterviews, which occur when an interview is obtained from at least one householdmember but interviews are not obtained from one or more other sample persons in that
household.1 Prior to the 1996 Panel and in some instances in the 1996 Panel, the method used toadjust for person-level noninterviews in the core wave files is known as Type Z imputation,which is discussed below.
Item nonresponse occurs when a respondent completes most of the questionnaire but does notanswer one or more individual questions. Item nonresponse data in SIPP occur under thefollowing circumstances:
! Responding sample persons refuse or are unable to provide requested information;
! Interviewers fail to ask a question or incorrectly record a response;
! A response is inconsistent with related responses or is incompatible with response categories;and
! Interviewers make an error when recording or keying in the data.2
Item nonresponse data are generally imputed for core items, as well as for many topical moduleitems.
Goals of ImputationGoals of ImputationGoals of ImputationGoals of Imputation
Missing data cause a number of problems: analyses of data sets with missing data are moreproblematic than analyses of complete data sets; there is a lack of consistency among analysesbecause analysts compensate for missing data in different ways and their analyses may be basedon different subsets of data; and, in the presence of nonresponse that is unlikely to be completelyrandom, estimates of population parameters are biased.
Because missing data are always present to some degree, analyses of survey data must be basedon assumptions about patterns of missing data. When missing data are not imputed or otherwiseaccounted for in the model being estimated, the implicit assumption is that data are missing atrandom after controlling for other variables in the model. The imputation procedures used forSIPP are based on the assumption that data are missing at random within subgroups of thepopulation (as defined by the cells of the imputation matrices described later in this chapter).
The statistical goal of imputation is to reduce the bias of survey estimates. This goal is achievedto the extent that systematic patterns of item nonresponse are correctly identified and modeled.In SIPP, the statistical goals of imputation are general, rather than specific. Instead of addressingthe estimation of specific parameters, SIPP procedures are designed to provide reasonableestimates for a variety of analytical purposes.
1 That can happen either because people refuse to be interviewed or because they are unavailable for the interviewand a proxy interview is not obtained.2 Prior to the 1996 Panel, errors could also occur when data-entry workers were keying in results from the papersurvey.
DATA EDITING AND IMPUTATIONDATA EDITING AND IMPUTATIONDATA EDITING AND IMPUTATIONDATA EDITING AND IMPUTATION
4-3
Data editing is generally preferred over statistical imputation, and it is used whenever a missingitem can be logically inferred from other data that have been provided. When information existson the same record from which missing information can logically be inferred, that information isused to replace the missing information. The advantage of data editing is that it avoids theincrease in variance that occurs when missing items on one record are imputed with nonmissingresponses from other records.
Assessing the Influence of Imputed Data onAssessing the Influence of Imputed Data onAssessing the Influence of Imputed Data onAssessing the Influence of Imputed Data onAnalysisAnalysisAnalysisAnalysis
Users of SIPP data interested in assessing the influence of imputed data on their analyses shouldconsider whether SIPP imputation procedures have properties that affect their specific analyticalrequirements. A general discussion of the treatment of missing data in sample surveys is given inKalton and Kaspyrzyk (1986). Sedransk (1985), Little (1986), and Jinn and Sedransk (1987)discuss properties of commonly used imputation processes. An example of the impact ofimputation procedures on the distributional characteristics of a low-income population isdiscussed in Doyle and Dalrymple (1987).
An evaluation of the effects of imputed data should include a review of rates of unit nonresponseand an assessment of the extent of item nonresponse. Unit nonresponse tends to increase over thelife of a panel, as does the likelihood that nonresponse is not a random effect. And as thepercentage of eligible sample members re-interviewed decreases, the pool from which donors3
are selected shrinks accordingly. This smaller pool of donors leads to an increased likelihood thatindividual donors will be used more than once, which in turn increases the variance of anestimate.
The effects of imputation will likely be small for items with low rates of missing data as long asrates of item nonresponse are not high among important subclasses. Lepkowski et al. (1987),using data from a large federal survey, provide a framework for evaluating the effect of imputedvalues on analyses. This framework can be readily adapted to SIPP analyses.
An Overview of the ProcessAn Overview of the ProcessAn Overview of the ProcessAn Overview of the Process
There are two phases to the processing of SIPP data. At the conclusion of each wave ofinterviewing, the data collected during that wave are processed, creating the core wave andtopical module files. That is the first phase of processing. Then, at the conclusion of the finalwave of interviews, core data from all waves are linked and a new set of edit and imputationprocedures is applied to the resulting full panel file. That is the second phase of processing.
3 Cases with complete data that are the source of the imputed values placed on the records with missing data.
There are six steps in the first phase of SIPP data processing:
1. As each wave of interviewing is completed, core data collected during the wave are editedfor internal consistency.
2. Following data editing, the statistical matching and hot-deck procedures described later inthis chapter are used to impute missing data from the core wave file.
3. A public use version of the core wave file is then created from the resulting internal corewave file. The public use file is the same as the Census Bureau�s internal file except that ithas certain information suppressed or topcoded to protect the confidentiality of surveyrespondents (see sections on Topcoding and Suppression of Geographic Information, at theend of this chapter).
4. On a separate production track from the core data, data from the topical module fileadministered with the wave are edited for internal consistency. The extent of data editingvaries across the topical modules, and some topical modules receive almost no editing.
DATA EDITING AND IMPUTATIONDATA EDITING AND IMPUTATIONDATA EDITING AND IMPUTATIONDATA EDITING AND IMPUTATION
4-5
5. Next, hot-deck procedures are used to impute missing data in the topical module. The extentof imputation varies across the topical modules; some topical modules have no missing dataimputed.
6. A public use version of the topical module file is created from the resulting internal file. Aswith the public use core wave files, the public use topical module files have certaininformation suppressed to protect the confidentiality of survey respondents.
These steps are repeated at the conclusion of each wave of interviews. Prior to the 1996 Panel,each wave was processed independently of other waves of data. Thus, when multiple core wavefiles are linked, apparent changes in a respondent�s status could be due to different applicationsof data edits and imputations to the files being combined (file linkage is the subject of Chapter13). With the 1996 data, the hot-deck procedure was redesigned to rely on historical informationreported in prior waves. In addition, other forms of longitudinal imputation, such as carryovermethods, were adapted.
At the conclusion of the panel, the Census Bureau creates a full panel file containing core datafrom all waves. There are four steps to this process.
1. Core data from all waves are linked. Those data have already been subjected to the Phase 1edit and imputation procedures.
2. A series of longitudinal edits are applied to the full panel file. Unlike the core wave editprocedures, these edits are designed to create longitudinally consistent records for eachperson. Both reported values and values that were imputed during the first phase ofprocessing are subject to change. Thus, the data in a full panel file may differ from the data inthe core wave files from which the full panel file was constructed.
3. A missing wave imputation procedure is then applied. Data are imputed when a samplemember was absent for one or two consecutive waves but was present for the two adjacentwaves. Data for the missing wave(s) are interpolated on the basis of information from thefourth month of the prior wave and the first month of the subsequent wave. The missingwave imputation procedure was introduced with the 1991 Panel. Earlier panels were notsubjected to this procedure.
4. A public use version of the full panel file is created from the resulting internal file. Thepublic use file has certain information suppressed to protect the confidentiality of surveyrespondents.
The balance of this chapter describes in greater detail the full sequence of data edit andimputation procedures applied to SIPP data files. Most of the material contained in this chapter istaken from Pennell (1993).
Phase 1: Data Editing and ImputationPhase 1: Data Editing and ImputationPhase 1: Data Editing and ImputationPhase 1: Data Editing and ImputationProcedures for the Core Wave FilesProcedures for the Core Wave FilesProcedures for the Core Wave FilesProcedures for the Core Wave Files
The data processing sequence for each wave is detailed below.
Data Entry and Initial EditingData Entry and Initial EditingData Entry and Initial EditingData Entry and Initial Editing
Beginning with the 1996 Panel (Chapter 2), all of the data entry and some of the initial dataediting are performed by computer-assisted interviewing while the interview is in progress.Before the 1996 Panel, the first stages of data processing involved editing the paperquestionnaires for completeness, reasonableness, and consistency. Those data checks wereconducted first by field representatives before they submitted their questionnaires to the regionaloffices and then by the regional and central offices of the Census Bureau. The next step was dataentry, in which clerks keyed in the information from control cards and questionnaires. Edits werebuilt into the data-entry program to ensure that the data were keyed in the proper sequence andthat certain key identifiers, such as control number, name, and relationship to householder, werepresent. Following this step, the data files were transmitted electronically to Census Bureauheadquarters.
Imputation for Sample Unit Characteristics andImputation for Sample Unit Characteristics andImputation for Sample Unit Characteristics andImputation for Sample Unit Characteristics andPersonal Demographic CharacteristicsPersonal Demographic CharacteristicsPersonal Demographic CharacteristicsPersonal Demographic Characteristics
Items in this category, including housing tenure (owned or rented), age, race, marital status, andso forth, must be present for any further data processing to take place. If these values cannot belogically derived, they are imputed. The imputation procedure is a modified version of thesequential hot-deck procedure described below.
Type Z Imputation for Core Items in the Core Wave FilesType Z Imputation for Core Items in the Core Wave FilesType Z Imputation for Core Items in the Core Wave FilesType Z Imputation for Core Items in the Core Wave Files
Pre-1996 Panels. Type Z imputation was the method used in the pre-1996 panels to impute coreitems for person-level noninterviews. There are two categories of person-level noninterviewssubject to imputation for the core questions. The first category includes individuals 15 years ofage and older who were members of interviewed households at the beginning of the 4-monthreference period but were not original sample members or members of any SIPP-interviewedhousehold on the date of the interview�that is, people not interviewed because they moved outof the sample household between the beginning of the reference period and the interview date.Had these people been original sample members, they would be interviewed at their new address.
DATA EDITING AND IMPUTATIONDATA EDITING AND IMPUTATIONDATA EDITING AND IMPUTATIONDATA EDITING AND IMPUTATION
4-7
Rather, these are all people who entered the SIPP sample after the first wave and were in thesample because at some point they were living with an original sample member.
The second category of imputed noninterview includes people 15 years of age or older who weremembers of SIPP-interviewed households on the date of the interview and during all or a portionof the 4-month reference period but who were not interviewed because they refused to cooperateor were unavailable for the interview and a proxy interview was not obtained.
The Type Z imputation procedure is based on a hierarchical sorting and merging operation thatmatches noninterviews with respondents on socioeconomic characteristics available for both.The variables used to match noninterviews with respondents are age, race, gender, marital status,household relationship, education, veteran status, parent/guardian status, and income and assetsources. Pennell (1993, Figure C-1) provides a table of variables used to match recipients withdonors. The Type Z imputation procedure is designed to always find a match. Type Znoninterviews are imputed by assigning values from the matching donor to the noninterviewrecord. The donor values are assigned in full, except for identification variables or othervariables not relevant for the household in which the noninterview occurred. Pennell (1993)gives a complete account of Type Z imputation, including detailed descriptions of matchingoperations.
1996 Panel. In Waves 2�12 of the 1996 Panel, the general imputation procedure (the sequentialhot-deck procedure described in the following pages) is being used to impute core items for mostperson-level noninterviews. That is, these types of noninterviews are no longer set aside�in the1996 and later panels�for the specialized Type Z imputation procedure. However, the Type Zimputation procedure is still used in Wave 1 of the 1996 Panel (because there is no prior waveinformation to inform the imputation process) and for noninterviews for persons in Waves 2�12for whom there is no prior wave information (because they are new to the sample).
Imputation of Item Nonresponse in Core QuestionsImputation of Item Nonresponse in Core QuestionsImputation of Item Nonresponse in Core QuestionsImputation of Item Nonresponse in Core Questions
SIPP core items are imputed in the following order:
1. Labor force participation, recipiency of income, and asset holdings;
2. Other cash income;
3. Wage, salary, and self-employment income amounts;
The statistical imputation method used to impute missing items from the core questions andtopical modules is known as a sequential hot-deck procedure.4 In a general sense, the sequentialhot-deck procedure, like the Type Z imputation procedure, matches a record with missing data tothat of a donor with similar background characteristics and uses the donor�s values. Thisprocedure differs from data editing, which replaces missing data with inferred values based onnonmissing data from the same case.
The sequential hot-deck procedure used in SIPP involves five key steps:
1. Specifying cold-deck or initial donor values;
2. Sorting the sample cases;
3. Identifying records with no item nonresponse and updating hot-deck values;
4. Classifying cases into subclasses of the population, referred to as imputation classes oradjustment cells, according to values on a set of classification or auxiliary variables that arenonmissing for all cases (this step is omitted in the initial processing of the key demographicitems�race, gender, etc.); and
5. Selecting replacement values from donor cases to impute item-missing data on recipientrecords.
Two types of sequential hot-deck imputation are used to provide values for missing items. InWave 1 and for each sample member who is new to a subsequent wave, the hot deck is cross-sectional; only values from current wave responses are used in the definition of the hot-deckcells. Beginning with Wave 2, previous wave values are included in the definition of the hot-deck cells. In both instances, however, only current wave values from selected donors are used toreplace missing items (with several exceptions, described below). Longitudinal (or �previouswave�) hot-deck imputation was not performed prior to the 1996 Panel. Each wave received onlythe cross-sectional hot-deck imputation.
For example, the item indicating whether a person worked part-time in the reference period forthe wave (a dichotomous item) uses the longitudinal hot deck for �old� sample members and thecross-sectional hot deck for new sample members. The 1996 Panel cross-sectional hot-deckimputation is based on a cell structure with 288 cells that are based on cross-classifications of sex(two categories), race (two categories), age (six categories), marital status (three categories),disability status (two categories), and presence of own children (two categories). On the basis ofhis or her current wave values for those categories, each new sample member in any later wave isassigned to a cell; then the donor�s value in that cell is used to impute a value to the new samplemember.
4 The hot-deck procedure used in SIPP for the core questions and topical module items is sequential because theselection of replacement values is implemented one record at a time from an ordered file.
DATA EDITING AND IMPUTATIONDATA EDITING AND IMPUTATIONDATA EDITING AND IMPUTATIONDATA EDITING AND IMPUTATION
4-9
The longitudinal hot-deck imputation for the part-time work item for old sample members inWaves 2+ is based on a cell structure with 576 cells that are based on the same categoriesdescribed above with one extra category: whether or not the person worked part-time in theprevious wave. A donor is selected from that cell, and that value is imputed. The actual item isimputed from a donor�s value of the item in the current wave; the previous wave value is usedonly in the assignment of the cell. That procedure guarantees that the sample member is matchedto the donor who had the same value for the item in the previous wave. Therefore, samplemembers who worked part-time in the previous wave will be matched only to donors who alsoworked part-time in the previous wave. However, the actual hot-deck imputation comes from thedonor�s value in the current wave, which may or may not include part-time work.
Imputed values for the sample member are allowed in assigning the cell for some items. If asample member had an imputation for part-time work in the previous wave, that imputation isused to define the cell for the longitudinal hot-deck imputation, even though it is an imputationitself. That is not done for other items, such as asset items. Only a nonimputed or logicallyimputed value �counts� toward the longitudinal hot deck for those items.
The part-time item is dichotomous; the previous wave imputation matrix was essentially thecurrent wave imputation matrix with the previous wave�s value of the item added to the matrix.In many cases, the differences between the two imputation matrices will be more pronounced,especially for items with several categories of answers. An example of this is the item �reasonswhy person worked less than 35 hours in the reference period.� There are 12 categories for thatitem. The previous wave hot-deck imputation matrix uses the following characteristics to definecells:
Previous wave value for item (12 categories);
! Sex (two categories);
! Race (two categories);
! Age (six categories).
The current wave imputation matrix uses the following characteristics to define cells:
! Sex (two categories);
! Race (two categories);
! Age (six categories);
! Marital status (three categories);
! Disability status (two categories);
! Presence of own children (two categories).
A different type of example is the item gross pay in the first month of the reference period. Fornew SIPP sample members, a cross-sectional hot-deck imputation is carried out by using thefollowing characteristics to generate cells:
! Industry and occupation category (16 categories);
! Sex (two categories);
! Hours worked (three categories);
! Education level (three categories).
For old sample members, a longitudinal hot-deck imputation is carried out by using the previouswave value for the item gross pay in the fourth month of the preceding wave�s reference period.5This continuous value is divided into 138 categories, starting from $1 to $100, to over $50,000.Sample members are matched to donors by using the previous wave values of those categories.
For labor force items, the Census Bureau uses the following special imputation procedures whena person has no current wave information indicating whether or not he or she worked during thereference period. If the Census Bureau can infer from what it knows about the previous referenceperiod whether the person had a job or business at the start of the current period, the CensusBureau carries out the following procedure:
1. If the person was working at the end of the prior wave, then labor force participation isimputed from a single donor for the complete current wave.
2. The Census Bureau then projects job characteristics for the person from the person�s priorwave through the current wave.
3. Finally, the Census Bureau edits the job characteristics for consistency with the imputedlabor force participation variables.
This procedure is known as an EPPFLAG imputation, after the name of the variable thatindicates its use.
If a person was a nonworker in the prior wave or the Census Bureau cannot infer work status onthe basis of prior wave data, then the person�s work status is imputed. If the person is imputed asa worker in the reference period, the Census Bureau imputes the complete set of job/businesscharacteristics variables and labor force participation variables to the person from one donor, inorder to maintain consistency among the fields. That procedure is called a �little Type Z�imputation.
For some items in some cases, a direct logical or carryover imputation is made. The carryoverimputation takes the previous wave�s value for the item for the sample member and imputes it tothe current wave. That imputation is done particularly for items that rarely (or never) change fora sample member across waves (such as sex and race) or for items that change in predictableways (such as age).
5 The second month of the reference period actually uses as the �previous wave value� the first month value, withthe third month using the second month, and so forth, so that these imputations are really previous month rather thanprevious wave.
DATA EDITING AND IMPUTATIONDATA EDITING AND IMPUTATIONDATA EDITING AND IMPUTATIONDATA EDITING AND IMPUTATION
4-11
SIPP hot-deck procedures are designed to preserve the univariate distribution of each variablesubjected to imputation. These procedures do not, in general, preserve the covariances amongvariables. Although some of those interrelationships might be preserved to a certain extent, thatis not the primary intent of the hot-deck imputation procedures used by the Census Bureau. Oneconsequence is that imputation can introduce inconsistencies into the data. For example, if arespondent has reported program participation, but his or her income is too high for thatprogram, it is possible that the income data have been imputed. Whenever users detectinconsistencies, it is wise to check the allocation (imputation) flag to see if the inconsistent datamight have been imputed. The discussion of allocation (imputation) flags later in this chapterprovides more information.
Starting or Cold-Deck ValuesStarting or Cold-Deck ValuesStarting or Cold-Deck ValuesStarting or Cold-Deck Values
In other surveys, cold-deck values in a sequential hot-deck procedure historically served as theinitial set of replacement values for missing items in the first record processed; missing items insubsequent records typically received replacement (hot-deck) values from the current data set. InSIPP, however, cold-deck values are seldom used as replacement values for either the first orsubsequent records processed. During later stages of processing, as the cold-deck values arereplaced with information from the current wave, the array of cells is referred to as the hot-deckmatrix. The cells in the matrix are defined by the cross-classification of auxiliary variables(Pennell, 1993, Figure 3.3). Each cell in the matrix corresponds to respondent cases with thesame set of values on the classification variables. Many different matrices are defined in SIPP,and each matrix corresponds to one or more variables subject to imputation.
Sorting the Sample CasesSorting the Sample CasesSorting the Sample CasesSorting the Sample Cases
The records in the sample file are sorted by three geographic variables prior to imputing item-missing data. The three geographic sort variables are primary sampling unit, segment number,and serial number. The cases are sorted prior to processing and are not re-sorted at any other timeduring the imputation process. The sorting operation creates a file in which neighboring recordsrepresent geographically proximate households.
Preprocessing the Sample File: Initial Updating of Cold-Deck ValuesPreprocessing the Sample File: Initial Updating of Cold-Deck ValuesPreprocessing the Sample File: Initial Updating of Cold-Deck ValuesPreprocessing the Sample File: Initial Updating of Cold-Deck Values
Once the cases have been sorted, they are processed through a series of programs. During thefirst pass against the programs, the cold-deck values are updated with information from thecurrent wave; missing data are not imputed. The initial processing is done separately for each ofthe five groups of related core variables listed above. During the first pass, the first record in thesorted file with consistent and nonmissing data for a particular group of variables is identifiedand the values from that case replace the cold-deck values for that section in the matrix. Thevalues for each subsequent record with consistent and nonmissing information update theprevious set of consistent and nonmissing values written to the matrix. The checking andupdating operation continues until all records in the data file have been processed. The lastvalues written to the matrix serve as the starting values in the subsequent sequential hot-deck
procedure. In this way, cold-deck values are rarely used as replacement values in SIPP becausethe initial processing usually replaces all starting values with values from the current wave ofdata.
Allocating Cases into Imputation ClassesAllocating Cases into Imputation ClassesAllocating Cases into Imputation ClassesAllocating Cases into Imputation Classes
In the next step of the imputation procedure, each respondent record or noninterview record inthe sorted file is allocated to one of the imputation classes or adjustment cells according to itsvalues on the set of classification, or auxiliary, variables.6
1. The auxiliary variables are chosen for each item or set of related items on the basis of theirlevel of correlation with the item receiving the imputation (i.e., classification variables arechosen on the basis of their ability to explain the variability of the item or set of relateditems); Census Bureau researchers assign different sets of classification variables to differentsets of items.
2. The auxiliary variables are either dichotomous or polychotomous categorical variables (e.g.,sex, race); if they are continuous, they are categorized into a parsimonious number of levels(e.g., income, asset levels).
3. The level of the auxiliary variables then define a matrix, with the number of cells in thismatrix being the product of the number of levels for each auxiliary variable. For example, animputation defined by five variables, each with three levels, has a total of 243 cells. Anygiven item or set of related items may have imputation matrices with the numbers of cellsranging from under 100 to well over 1,000, depending on the matrix.
Auxiliary variables such as sex, race, and categorizations of age (with different categorizationsfor different items) are used frequently in the matrices, as are more specialized auxiliaryvariables that are relevant for particular items (such as industry and occupation category for themonthly gross pay item). Pennell (1993) gives examples of the different sets of classificationvariables for previous panel years.
The allocation of sample cases into imputation classes (also known as subclasses or strata)according to a set of classification variables serves several purposes. Ideally, the set ofclassification variables should account for a large proportion of the variance in the variable beingimputed and should be associated with variations in response rates. To the extent that this isaccomplished, the classification procedure creates homogeneous adjustment cells containingsimilar cases. In this way, donors and recipients are similar under the assumption that thenonresponse mechanism within the imputation class is not related to the item being imputed; thatis, an underlying assumption is made that item nonresponse data are distributed randomly withinthe subclass defined by the cross-classification of the auxiliary variables. The selection ofclassification variables may also place bounds on the range of values that can be imputed andimplicitly satisfy edit constraints. The implicit stratification created by the sort order of the file
6 This step is omitted for the imputation of the primary demographic values that are imputed before the person-levelnoninterviews.
DATA EDITING AND IMPUTATIONDATA EDITING AND IMPUTATIONDATA EDITING AND IMPUTATIONDATA EDITING AND IMPUTATION
4-13
further improves the opportunity for better imputation to the extent that nearby cases are moresimilar to each other than cases that are farther apart in the file.
Imputing for Missing Data and Updating of Hot-Deck ValuesImputing for Missing Data and Updating of Hot-Deck ValuesImputing for Missing Data and Updating of Hot-Deck ValuesImputing for Missing Data and Updating of Hot-Deck Values
The selection of replacement values for missing items is restricted to donor and recipient recordswithin each particular cell; that is, records allocated to one cell never donate information torecords in another cell with missing items. As the file is processed through the set of programsthe second time, the imputations are performed and the set of hot-deck values is updated onceagain.
The records are processed sequentially, according to the sort order of the file. A missing item isgiven the value of the last corresponding item that is nonmissing from a record in that imputationclass. If the value of an item in the current record is nonmissing, it replaces the previous hot-deckvalue for that imputation class. In this way, the hot-deck value for each imputation class isconstantly being updated with the value of the last nonmissing case.
The updating is done item by item. Missing items in one record receive the current set ofreplacement values. Then the nonmissing values in that record are used to update the hot deck inpreparation for the next record. At any point during the process, the donated values in the hotdeck likely come from many different respondents, even within imputation classes. That is whythis imputation procedure does not preserve covariances among the variables being imputed.
An allocation (imputation) flag is associated with each core item subject to imputation. When anitem has been imputed, an allocation (imputation) flag for that item is set. Beginning with the1996 Panel, allocation flags denoting either data edits or statistical imputations for all variablesare included on the core wave files. For core wave files from earlier panels, imputation flags areincluded for most items subject to imputation.
An allocation (imputation) flag with the value 0 indicates no imputation, a value of 1 or 2indicates a hot-deck imputation that uses only current quarter values, a value of 3 indicates alogical imputation, and a value of 4 indicates a dependent imputation. This last category includesimputations in which data have been carried over from the sample unit�s previous wave data andimputations in which previous wave data are used as control variables. For detaileddocumentation about the coding of allocation (imputation) flags for specific variables, analystscan refer to the data dictionary for the data file with which they are working.
For items that receive Type Z imputations (in both the pre-1996 panels and the 1996 Panel) anditems receiving EPPFLAG and little Type Z imputations in the 1996 Panel, the allocation(imputation) flag for a particular imputed item will not indicate by itself the imputation status ofthe item. For Type Z imputations, the EPPINTVW field in the 1996 Panel and the person-levelINTVW field in the pre-1996 panels will indicate whether the Type Z procedure was used toimpute all items for the sample person (in these cases, EPPINTVW = 3 or 4 or INTVW = 3 or
4).7,8 The individual imputation flag for each item indicates whether or not that item was imputedduring the processing of the donor�s fields.
For EPPFLAG imputations, the EPPFLAG field will equal 1. When this is true, all labor forceparticipation and job/business characteristics fields are imputed via the EPPFLAG procedure,whether or not the individual items indicate an imputation. As with the Type Z procedure, anallocation (imputation) flag with a value greater than zero for any of the labor force participationitems means that the values of these items are not the original values from the donor but areprocessed values that are consistent with the sample person�s demographics and householdcomposition; for the job/business characteristics fields, an allocation flag with a value of �4�indicates that the sample person�s values in these fields have been projected forward from theperson�s values for these fields in the previous wave.
To find little Type Z imputations, check the allocation (imputation) flag of the variableEPDJBTHN. If (a) EPDJBTHN = 1 (indicating that the person was a worker), (b) this item�sallocation (imputation) flag is 1 or 4, and (c) EPPFLAG is not 1, then a little Type Z imputationhas taken place for all of the labor force participation and job/business characteristics fields. Aswith the Type Z procedures, the allocation (imputation) flag for an individual item only indicateswhether the item was imputed when the donor�s fields were processed.
The full panel files carry only a subset of the allocation (imputation) flags carried on the corewave files. The value of an allocation (imputation) flag is set during wave processing, and,usually, it is not modified to reflect any changes in value resulting from the longitudinal editingdiscussed below. The Census Bureau does reset the values of some allocation flags to indicatethat a longitudinal imputation has occurred.
When item-missing data in topical modules are imputed, the same sequential hot-deck procedureused to impute item-missing data in the SIPP core is used. Topical module data for Type Znoninterviews are also imputed item by item with the sequential hot deck. Those cases are notsubjected to the Type Z imputation procedure that was used for core items in the pre-1996panels.
7 The codes for EPPINTVW and INTVW differ. In the 1996 Panel, EPPINTVW is coded as follows: 1 = Interview(self), 2 = Interview (proxy), 3 = Noninterview�Type Z, 4 = Noninterview�pseudo Type Z (left sample during thereference period), and 5 = Children under 15 during the reference period. In the pre-1996 panels, INTVW for personis coded as follows: 0 = Not applicable (children under 15), 1 = Interview (self), 2 = Interview (proxy), 3 =Noninterview�Type Z refusal, and 4 = Noninterview�Type Z other.8 Note that for the 1990�1993 Panels, INTVW can equal 5 on the core wave files (this value is not documented inthe codebook). A value of 5 denotes persons in the sample early in the wave who were not in the sample at the timeof interview. Such persons are processed as if they are a Type Z nonrespondent. Prior to the 1990 Panel, suchpersons are identified as those with PP-MIS5 ( 1 but PP-MISj ≠ 1 for j = 1, 2, 3, or 4.
DATA EDITING AND IMPUTATIONDATA EDITING AND IMPUTATIONDATA EDITING AND IMPUTATIONDATA EDITING AND IMPUTATION
4-15
Phase 2: Data Editing Procedures for the FullPhase 2: Data Editing Procedures for the FullPhase 2: Data Editing Procedures for the FullPhase 2: Data Editing Procedures for the FullPanel FilesPanel FilesPanel FilesPanel Files
At the conclusion of each SIPP panel, core data from all waves are assembled into the full panelfile. That assembly is done after all waves have been processed separately, producing the corewave files. Once all waves are linked, longitudinal edits are applied to the SIPP full panel files toensure that the data for each respondent are consistent over time. Although the core wave filesare edited for consistency, some types of inconsistencies become apparent only when looking atthe data over multiple waves. Starting with the 1996 Panel, some longitudinal editing has beenbuilt into the CAI instrument. The ability to carry data across waves in the CAI environment isexpected to result in better cross-wave consistency in the core wave files and in less need forsubsequent longitudinal editing.9
Pre-1996 Full Panel FilesPre-1996 Full Panel FilesPre-1996 Full Panel FilesPre-1996 Full Panel Files
Because the specifications for editing the 1996 full panel files differ from those for the pre-1996files, the following discussion refers only to pre-1996 procedures. Longitudinal edits in the pre-1996 panels were applied for selected variables. The edits were designed (1) to correct cross-wave inconsistencies, which become apparent only when multiple waves are examined together,and (2) to honor the preference to replace imputed values from one wave with reported valuesfrom another wave.
Unlike the hot-deck imputation procedures used with the core wave files, the longitudinal editsin the pre-1996 files did not replace missing data for one person with reported data from anotherperson. When a data value was modified during longitudinal editing, the replacement value wasobtained from the same record either directly (by copying a reported value from a differentmonth) or indirectly (using some form of interpolation or extrapolation from reported values inother months). Those procedures could cause modifications both in reported and imputed values.When a data value was modified during longitudinal editing, the associated imputation flag wasnot changed. In addition, the core wave files were not revised to reflect changes made duringlongitudinal editing. Thus, the data for any given respondent may differ between the core wavefiles and the full panel file, and estimates based on the full panel file may differ from those basedon the core wave files.
9 Prior to CAI, a control file was developed at Wave 1 that contained a unique identifier for each sample person, aswell as that person's age, sex, and race. In subsequent waves, the control file provided a means of detectinginconsistencies in age, sex, and race across waves. As each wave of data was received, the reported age, sex, andrace of the sample person were checked against the control file and corrections were made. Also prior to CAI,income recipiency was brought forward to the subsequent wave.
The longitudinal edits in the pre-1996 files were performed independently on four groups ofvariables:
1. Demographic and household composition variables;
2. Earned income variables;
3. Other income variables, Food Stamp variables, WIC variables, and program coveragevariables; and
4. Medical insurance variables.
In most cases, the values reported during Wave 1 were used as the standard against whichinconsistencies were judged. Pennell (1993) provides detailed information about longitudinalconsistency edits for specific variables.
1996 Full Panel File1996 Full Panel File1996 Full Panel File1996 Full Panel File
The specifications for editing the 1996 full panel file are not yet complete. The basic differencebetween the pre-1996 and the 1996 full panel files is that the editing procedures for the 1996panel incorporate longitudinal imputation based on prior wave information.
There are many instances in which data are missing for a person in one or two consecutive wavesbut are present for that same person in the two adjacent waves. For example, a person may bemissing in Wave 5 but have complete data for Waves 4 and 6. Beginning with the 1991 Panel,the Census Bureau began imputing those missing waves in the full panel files. Missing waveimputation is performed only when one or two consecutive missing waves are bounded on bothsides by waves in which the sample member was present. If a respondent has missing data formore than two consecutive waves, the imputation is not performed.
For missing waves that are bounded on each side by interviewed waves, data are interpolatedusing a random carryover procedure. A value r is randomly assigned to each nonrespondent�shousehold for each missing wave, where r = 0, 1, 2, 3, or 4. The first r reference months withinthe missing wave receive their imputed values from the fourth month of the preceding wave, andthe remaining 4 � r reference months receive their imputed amounts from the first month of thesubsequent wave.
Although this procedure results in data conducive to many analytic purposes, the randomcarryover forces stability in responses for wave nonrespondents. That stability could result inunderestimation of between-wave changes. The procedure also results in imputed waves that donot exhibit the seam effect common to waves of reported data (Chapter 6). Williams and Bailey(1996) provide a complete account of the handling of missing wave data in SIPP.
DATA EDITING AND IMPUTATIONDATA EDITING AND IMPUTATIONDATA EDITING AND IMPUTATIONDATA EDITING AND IMPUTATION
4-17
Confidentiality Procedures for theConfidentiality Procedures for theConfidentiality Procedures for theConfidentiality Procedures for thePublic Use FilesPublic Use FilesPublic Use FilesPublic Use Files
All of the editing and imputation procedures described in the preceding sections are part of theprocess of preparing the data for internal Census Bureau use. Before the files are released forpublic use, they undergo additional editing to protect the confidentiality of respondents. Twoprocedures are used: topcoding of selected variables (income, assets, and age) and suppression ofgeographic information. As a result of these procedures, estimates based on data from the publicuse files will differ slightly from the Census Bureau�s published estimates.
TopcodingTopcodingTopcodingTopcoding
One piece of information that might reveal a respondent�s identity is a very high income. For thatreason, the Census Bureau topcodes income before making that information publicly available,recoding any income amounts over a certain maximum value to that maximum. In other words,income on the public use data files has a ceiling value. Although income is the primary variablethat is topcoded, other variables that may disclose a respondent�s identity, such as age, are alsotopcoded. A few variables, such as starting dates for employment, may be bottomcoded if theypose a disclosure risk. Chapter 10 and Appendix B provide a thorough discussion of topcodingmethods and procedures in SIPP.
Suppression of Geographic InformationSuppression of Geographic InformationSuppression of Geographic InformationSuppression of Geographic Information
Geographic information that can be used to directly identify survey respondents, such as anaddress, is removed from the public use files. In addition, states and metropolitan areas withpopulations less than 250,000 are not identified. Specific nonmetropolitan areas (such as countiesoutside of metropolitan areas) are never identified. In certain states, when the nonmetropolitanpopulation is small enough to present a disclosure risk, a fraction of that state�s metropolitansample is recoded to nonmetropolitan status. For that reason, the SIPP data cannot be used toestimate characteristics of the population residing outside metropolitan areas. Chapter 10provides details.
For the 1996 Panel, state-level geography is shown for 45 states and the District of Columbia.The remaining five states are combined as follows:
For the 1984 through 1993 Panels, state-level geography is shown for 41 individual states andthe District of Columbia; the nine other states are combined into three groups:
1. Maine, Vermont;
2. Iowa, North Dakota, South Dakota; and
3. Alaska, Idaho, Montana, Wyoming.
5-1
5.5.5.5. Finding SIPP InformationFinding SIPP InformationFinding SIPP InformationFinding SIPP Information
Both the data collected in SIPP and supporting documentation are available in various forms.They include published estimates based on those data, microdata in several formats,documentation for each of the microdata files, and more general documentation aboutmethodological issues in SIPP. The latter includes the SIPP Quality Profile, a series of workingpapers distributed by the Census Bureau, articles published in academic journals, and conferenceproceedings. This chapter discusses SIPP published estimates, briefly describes the data files andsupporting documentation, and provides information on how to obtain them.
Published Estimates from SIPPPublished Estimates from SIPPPublished Estimates from SIPPPublished Estimates from SIPP
Published estimates from SIPP data are useful to data analysts in a number of ways. First, CensusBureau publications may already contain the estimates needed for the research project at hand,thus saving users the need to generate those estimates themselves. Second, published estimatescan often provide a useful cross-check for closely related estimates prepared by analysts.
Published estimates are based on the Census Bureau�s internal data files, and it is oftenimpossible to replicate published estimates exactly. That is because the internal files have notbeen subjected to topcoding and other data-suppression techniques that are necessary to protectconfidentiality on the public use microdata files. Chapter 4 provides information on data editingand imputation.
The Census Bureau�s P-70 series of publications is the primary source for published estimatesfrom SIPP. Table 5-1 displays the titles and publication numbers of reports in the series that arecurrently available from the Census Bureau. Copies of those reports can be obtained from theU.S. Government Printing Office, Washington, DC 20402. For telephone orders, users can call(202) 783-3238, or they can fax orders to (202) 783-3236. An updated list of P-70 series reportscan be obtained from the SIPP Web site (http://www.bls.census.gov/sipp/); each of the reportscontains a phone number the reader can call for further information or clarification. Users canreach the population division staff for demographics questions at (301) 457-2422, or they cancall the SIPP information phone number: (301) 457-3242.
SIPP Public Use Microdata FilesSIPP Public Use Microdata FilesSIPP Public Use Microdata FilesSIPP Public Use Microdata Files
Following data collection as described in Chapter 2 and postcollection processing as described inChapter 4, the Census Bureau prepares data files in formats compatible with the most commonmethods of analysis. Those microdata are available in several file formats and can be obtained on
PublicationNumber TitleP-70-1 Economic Characteristics of Households in the U.S. Third Quarter 1983P-70-2 Economic Characteristics of Households in the U.S. Fourth Quarter, 1983P-70-3 Economic Characteristics of Households in the U.S. First Quarter,1984P-70-4 Economic Characteristics of Households in the U.S. Second Quarter, 1984P-70-5 Economic Characteristics of Households in the U.S. Third Quarter, 1984P-70-6 Economic Characteristics of Households in the U.S. Fourth Quarter, 1984P-70-7 Household Wealth and Asset Ownership, 1984P-70-8 Disability, Functional Limitations, and Health Insurance Coverage: 1984-1985P-70-9 Who�s Minding the Kids? Child Care Arrangements: Winter 1984-1985P-70-10 Male-Female Differences in Work Experience, Occupation, and Earnings: 1984P-70-11 What�s It Worth? Educational Background and Economic Status: Spring 1984P-70-12 Pensions: Workers Coverage and Retirement Income, 1984P-70-13 Who�s Helping Out? Support Network Among American FamiliesP-70-14 Characteristics of Persons Receiving Benefits from Major Assistance ProgramsP-70-15-RD-1 Transitions in Income and Poverty Status: 1984-1985P-70-16-RD-2 Spells of Job Search and Layoff...and Their OutcomesP-70-17 Health Insurance Coverage, 1986-1988P-70-18 Transitions in Income and Poverty Status: 1985-1986P-70-19 The Need for Personal Assistance with Everyday Activities: Recipients and CaregiversP-70-20 Who�s Minding the Kids? Child Care Arrangements: Winter 1986-1987P-70-21 What�s It Worth? Educational Background and Economic Status: Spring 1987P-70-22 Household Wealth and Asset Ownership: 1988P-70-23 Family Disruption and Economic Hardship: The Short-Run Picture for ChildrenP-70-24 Transitions in Income and Poverty Status: 1987-1988P-70-25 Pensions: Worker Coverage and Retirement Benefits, 1987P-70-26 Extended Measures of Well-Being: 1984P-70-27 Job Creation During Late 1980�s: Dynamic Aspects of Employment GrowthP-70-28 Who�s Helping Out? Support Network Among American FamiliesP-70-29 Health Insurance Coverage: 1987 to 1990P-70-30 Who�s Minding the Kids? Child Care Arrangements: Fall 1988P-70-31 Characteristics of Recipients and the Dynamics of Program Participation: 1987-1988P-70-32 What�s It Worth? Educational Background and Economic Status: Spring 1990P-70-33 Americans with Disabilities: 1991-1992P-70-34 Household Wealth and Asset Ownership: 1991P-70-35 Monitoring the Economic Health of American Households: Average Monthly Estimates of
Income, Labor Force Activity, Program Participation and Health Insurance, First Quarter 1984to Third Quarter 1991
P-70-36 Who�s Minding the Kids? Child Care Arrangements: Fall 1991P-70-37 Dynamics of Economic Well-Being: Health Insurance, 1990-1992P-70-38 The Diverse Living Arrangements of Children: Summer 1991P-70-39 Dollars for Scholars: Postsecondary Costs and Financing, 1990-1991P-70-40 Dynamics of Economic Well-Being: Labor Force and Income: 1990-1992P-70-41 Dynamics of Economic Well-Being: Program Participation: 1990-1992
(table continues)
FINDING SIPP INFORMATIONFINDING SIPP INFORMATIONFINDING SIPP INFORMATIONFINDING SIPP INFORMATION
5-3
Table 5-1. Publications in the P-70 Series (continued)
PublicationNumber TitleP-70-42 Dynamics of Economic Well-Being: Poverty: 1990P-70-43 Dynamics of Economic Well-Being: Health Insurance: 1991-1993P-70-44 The Effect of Health Insurance Coverage on Doctor and Hospital Visits: 1990-1992P-70-45 Dynamics of Economic Well-Being: Poverty: 1991-1993P-70-46 Dynamics of Economic Well-Being: Program Participation: 1991-1993P-70-47 Asset Ownership of Households: 1993P-70-48 Dynamics of Economic Well-Being: Labor Force: 1991-1993P-70-49 Dynamics of Economic Well-Being: Income: 1991-1992P-70-50 Beyond Poverty, Extended Measures of Well-Being: 1992P-70-51 What�s It Worth? Field of Training and Economic Status: 1993P-70-52 What Does it Cost to Mind Our Preschoolers?P-70-53 Who�s Minding Our Preschoolers?P-70-54 Who Loses Coverage and for How Long?P-70-55 Dynamics of Economic Well-Being: Poverty: 1992-1993, Who Stays Poor? Who Doesn�t?P-70-56 Dynamics of Economic Well-Being: Income, 1992-1993, Moving Up and Down the Income
LadderP-70-57 Dynamics of Economic Well-Being: Labor Force, 1992-1993�A Perspective on Low-Wage
WorkersP-70-58 Dynamics of Economic Well-Being: Program Participation, 1992-1993�Who Gets Assistance?P-70-59 My Daddy Takes Care of Me! Fathers as Care ProvidersP-70-60 Financing the Future: Postsecondary Students, Costs, and Financial AidP-70-61 Americans with Disabilities: 1994-95P-70-62 Who�s Minding Our Preschoolers � Fall 1994 UpdateP-70-63 Dynamics of Economic Well Being: Poverty, 1993-94P-70-64 Who Loses Coverage, and For How Long?P-70-65 Moving Up and Down the Income LadderP-70-66 Seasonality of Moves and Duration of ResidenceP-70-67 Extended Measures of Well-Being: Meeting Basic NeedsP-70-69 Dynamics of Economic Well-Being: Program Participation, Who Gets Assistance?P-70-70 Who�s Minding the Kids? Child Care ArrangementsP-70-71 Household Net Worth and Asset Ownership, 1995P-70-73 Americans With Disabilities: 1997
a variety of media. The following sections describe the file formats currently in use, each ofwhich is used for somewhat different SIPP data. Information is also provided about how toobtain those data and supporting documentation.
Formats and Contents of SIPP Microdata FilesFormats and Contents of SIPP Microdata FilesFormats and Contents of SIPP Microdata FilesFormats and Contents of SIPP Microdata Files
SIPP public use microdata are available in four types of files: core wave files, topical modulefiles, and full and partial panel files. The files vary in content and structure. Analysts should beaware that their need for files depends on their particular application.
Data files are available through the Customer Services Branch, Administrative and CustomerServices Division, at (301) 457-4100. Users can also extract data files by using on-line dataaccess tools, as described later in this chapter in �Sources for Obtaining SIPP Microdata.�
Core wave files contain the core labor force, income, household and family composition, andprogram participation data from one wave of interviews. The core wave files are currentlyavailable in person-month format, containing, for every person who was a member of a SIPPhousehold for at least 1 month during the 4-month reference period for that wave, one record foreach month that person was in-sample.1 In other words, a person who was in-sample for all 4reference months has four records�one for each reference month. A person who was in-samplefor only 1 month would have just one record. The core wave files were designed to be used forcross-sectional analyses. Analysts who do not wish to wait for the release of certain files can linkone or more core wave files to make their own longitudinal files. Chapter 13 discusses linkingfiles. Table 5-2 illustrates the structure of the person-month format for core wave files.
The core wave files are the only source of monthly cross-sectional weights. When using datadrawn from the full panel files for cross-sectional analyses, users must merge weights from thecore wave files. Chapter 8 explains how to select and merge weights.
Each topical module file contains selected core information along with the data from the topicalmodule administered in a given wave. As described in Chapter 2, different topical modules areadministered in each wave of a SIPP panel. Table 5-3 shows which topical modules wereadministered for each wave of each SIPP panel. Table 5-4 lists topical areas along with thepanels and waves in which they were administered. Topical module files are issued in person-record format; there is one record for each person who was a member of a SIPP household at thetime of the interview for that wave. Table 5-5 illustrates the structure of a topical module file.For the topical modules, there are people for whom there is no topical information. Chapter 2describes how the interviews are conducted and how topical module information is collected;Chapter 4 explains how missing data are handled in the files. In the 1996 Panel, the month thatdetermines the universe for the topical module files changed to month 4.
1 Prior to the 1990 Panel, the Census Bureau issued core wave files in a format with a single record for each person.Those files are described in earlier editions of the SIPP Users' Guide.
FINDING SIPP INFORMATIONFINDING SIPP INFORMATIONFINDING SIPP INFORMATIONFINDING SIPP INFORMATION
5-5
Table 5-2. Structure of the Person-Month Format Core Wave Files
SUIDa Person MonthHouseholdVars
FamilyVars
SubfamilyVars
SampleStatus
Other PersonVars
1 1 1 Yes2 Yes3 Yes4 Yes
2 1 Yes2 Yes3 Missing Missing Missing No Missing4 Missing Missing Missing No Missing
3 1 Yes2 Yes3 Missing Missing Missing No Missing4 Yes
2 1 1 Yes2 Yes3 Yes4 Yes
2 1 Missing Missing Missing No Missing2 Yes3 Yes4 Yes
3 1 1 Yes2 Yes3 Yes4 Yes
2 1 Yes2 Yes3 Missing Missing Missing No Missing4 Missing Missing Missing No Missing
4 1 1 Yes2 Yes3 Yes4 Yes
a Sample unit ID number. Chapter 4 provides more information about identification numbers in SIPP.
1 Recipiency History, Employment History2 Work Disability History, Education and Training History, Marital History, Migration History, Fertility
History, Household Relationships3 Assets, Liabilities, and Eligibility; Medical Expenses/Utilization of Health CareAdults; Medical
Expenses/Utilization of Health CareChildren; Work-Related Expenses; Child Support Paid4 Annual Income and Retirement Accounts, Taxes, Work Schedule, Child Care, Disability Questions5 School Enrollment and Financing, Child Support Agreements, Support for Nonhousehold Members,
Functional Limitations and DisabilityAdults, Functional Limitations and DisabilityChildren,Employer-Provided Health Benefits
6 Children�s Well-Being, Assets, Liabilities, and Eligibility, Medical Expenses/Utilization of Health CareAdults, Medical Expenses/Utilization of Health CareChildren, Work-Related Expenses, Child SupportPaid
7 Annual Income and Retirement Account, Taxes, Retirement and Pension Plan Coverage; Home HealthCare
8 Adult Well-Being, Welfare Reform9 Assets, Liabilities, and Eligibility; Medical Expenses/Utilization of Health CareAdults; Medical
Expenses/Utilization of Health CareChildren; Work-Related Expenses; Child Support Paid10 Annual Income and Retirement Accounts, Taxes, Work Schedule, Child Care11 Child Support Agreements, Support for Nonhousehold Members, Functional Limitations and
DisabilityAdults, Functional Limitations and DisabilityChildren12 Assets, Liabilities, and Eligibility; Medical Expenses/Utilization of Health CareAdults; Medical
Expenses/Utilization of Health CareChildren; Work-Related Expenses; Child Support Paid;Children�s Well-Being
1993 Panel 1 Recipiency History, Employment History 2 Work Disability History, Education and Training History, Marital History, Migration History, Fertility
History, Household Relationships 3 Work Schedule, Child Care, Child Support Agreements, Support for Nonhousehold Members, Functional
Limitations and Disability, Utilization of Health Care Services 4 Selected Financial Assets; Medical Expenses and Work Disability; Real Estate, Shelter Costs, Dependent
Care, and Vehicles 5 Annual Income and Retirement Accounts, Taxes, School Enrollment and Financing 6 Work Schedule, Child Care, Child Support Agreements, Support for Nonhousehold Members, Functional
Limitations and DisabilityAdults, Utilization of Health Care ServicesAdults, Functional Limitationsand DisabilityChildren, Utilization of Health Care Services�Children, Children�s Well-Being
7 Assets and Liabilities; Real Estate, Shelter Costs, Dependent Care, and Vehicles; Medical Expenses andWork Disability
8 Annual Income and Retirement Accounts, Taxes, School Enrollment and Financing 9 Retirement Expectations and Pension Plan Coverage, Child Support Agreements, Child Care, Support for
Nonhousehold Members, Work Schedule, Children�s Well-Being, Basic Needs(table continues)
FINDING SIPP INFORMATIONFINDING SIPP INFORMATIONFINDING SIPP INFORMATIONFINDING SIPP INFORMATION
5-7
Table 5-3. Topical Modules, by Panel and Wave (continued)
Wave Subject Areas1992 Panel
1 Recipiency History, Employment History 2 Work Disability History, Education and Training History, Marital History, Migration History, Fertility
History, Household Relationships 3 Extended Measures of Well-Being (Consumer Durables, Living Conditions, Basic Needs) 4 Assets and Liabilities, Retirement Expectations and Pension Plan Coverage, Real Estate Property and
Vehicles 5 Annual Income and Retirement Accounts, Taxes, School Enrollment and Financing 6 Work Schedule, Child Care, Child Support Agreements, Support for Nonhousehold Members, Functional
Limitations and Disability, Utilization of Health Care Services 7 Selected Financial Assets; Medical Expenses and Work Disability; Real Estate, Shelter Costs, Dependent
Care, and Vehicles 8 Annual Income and Retirement Accounts, Taxes, School Enrollment and Financing 9 Work Schedule, Child Care, Child Support Agreements, Support for Nonhousehold Members, Functional
Limitations and DisabilityAdults, Utilization of Health Care ServicesAdults, Functional Limitationsand DisabilityChildren, Utilization of Health Care ServicesChildren, Children�s Well-Being
10 No Topical Modules1991 Panel
1 No Topical Modules 2 Recipiency History, Employment History, Work Disability History, Education and Training History,
Marital History, Migration History, Fertility History, Household Relationships 3 Work Schedule, Child Care, Child Support Agreements, Support for Nonhousehold Members, Functional
Limitations and Disability, Utilization of Health Care Services 4 Selected Financial Assets; Medical Expenses and Work Disability; Real Estate, Shelter Costs, Dependent
Care, and Vehicles 5 Annual Income and Retirement Accounts, Taxes, School Enrollment and Financing 6 Extended Measures of Well-Being (Consumer Durables, Living Conditions, Basic Needs) 7 Assets and Liabilities, Retirement Expectations and Pension Plan Coverage, Real Estate Property and
Vehicles 8 Annual Income and Retirement Accounts, Taxes, School Enrollment and Financing
1990 Panel 1 No Topical Modules 2 Recipiency History, Employment History, Work Disability History, Education and Training History,
Marital History, Migration History, Fertility History, Household Relationships 3 Work Schedule, Child Care, Child Support Agreements, Support for Nonhousehold Members, Functional
Limitations and Disability, Utilization of Health Care Services 4 Assets and Liabilities, Retirement Expectations and Pension Plan Coverage, Real Estate Property and
Vehicles 5 Annual Income and Retirement Accounts, Taxes, School Enrollment and Financing 6 Time Spent Outside Work Force, Child Support Agreements, Support for Nonhousehold Members,
Functional Limitations and Disability, Utilization of Health Care Services 7 Selected Financial Assets; Medical Expenses and Work Disability; Real Estate, Shelter Costs, Dependent
Care, and Vehicles 8 Annual Income and Retirement Accounts, Taxes, School Enrollment and Financing
Table 5-3. Topical Modules, by Panel and Wave (continued)
Wave Subject Areas1989 Panel
1 No Topical Modules 2 Recipiency History, Employment History, Work Disability History, Education and Training History,
Marital History, Migration History, Fertility History, Household Relationships 3 Work Schedule, Child Care, Child Support Agreements, Support for Nonhousehold Members, Home
Health Care, Disability Status and Utilization of Health Care Services, Functional Activities 4 The 1989 Panel was terminated following Wave 3.
1988 Panel 1 No Topical Modules 2 Recipiency History, Employment History, Work Disability History, Education and Training History,
Family Background, Marital History, Migration History, Fertility History, Household Relationships 3 Work Schedule, Child Care, Child Support Agreements, Support for Nonhousehold Members, Long-Term
Care, Disability Status of Children, Health Status and Utilization of Health Care Services 4 Selected Financial Assets; Medical Expenses and Work Disability; Real Estate, Shelter Costs, Dependent
Care, and Vehicles 5 Annual Income and Retirement Accounts, Taxes, School Enrollment and Financing 6 Work Schedule, Child Care, Child Support Agreements, Support for Nonhousehold Members, Home
Health Care, Disability Status of Children, Health Status and Utilization of Health Care Services,Functional Activities
7 No Wave 7 8 No Wave 8
1987 Panel 1 No Topical Modules 2 Recipiency History, Employment History, Work Disability History, Education and Training History,
Family Background, Marital History, Migration History, Fertility History, Household Relationships 3 Child Care Arrangements/Child Support Agreements, Support for Nonhousehold Members, Work-Related
Expenses, Shelter Costs/Energy Usage 4 Assets and Liabilities, Real Estate Properties and Vehicles 5 Annual Income and Retirement Accounts, Taxes, School Enrollment and Financing 6 Work Schedule, Child Care, Child Support Agreements, Support for Nonhousehold Members, Long-Term
Care, Disability Status of Children, Health Status and Utilization of Health Care Services 7 Selected Financial Assets; Medical Expenses and Work Disability; Real Estate, Shelter Costs, Dependent
Care, and Vehicles 8 No Wave 8
(table continues)
FINDING SIPP INFORMATIONFINDING SIPP INFORMATIONFINDING SIPP INFORMATIONFINDING SIPP INFORMATION
5-9
Table 5-3. Topical Modules, by Panel and Wave (continued)
Wave Subject Areas1986 Panel
1 No Topical Modules 2 Recipiency History, Employment History, Work Disability History, Education and Training History,
Family Background, Marital History, Migration History, Fertility History, Household Relationships 3 Child Care Arrangements/Child Support Agreements, Support for Nonhousehold Members, Job Offers,
Health Status and Utilization of Health Care Services, Long-Term Care, Disability Status of Children 4 Assets and Liabilities, Retirement Expectations and Pension Plan Coverage, Real Estate Property and
Vehicles 5 Annual Income and Retirement Accounts, Taxes, School Enrollment and Financing 6 Child Care Arrangements/Child Support Agreements, Support for Nonhousehold Members, Work-Related
Expenses, Shelter Costs/Energy Usage 7 Assets and Liabilities, Pension Plan Coverage, Real Estate Property and Vehicles 8 No Wave 8
1985 Panel 1 No Topical Modules 2 No Topical Modules 3 Assets and Liabilities, Real Estate Property and Vehicles 4 Support for Nonhousehold Members/Work-Related Expenses, Marital History, Migration History, Fertility
History, Household Relationships 5 Annual Income and Retirement Accounts, Taxes, School Enrollment and Financing 6 Child Care Arrangements/Child Support Agreements, Support for Nonhousehold Members, Job Offers,
Health Status and Utilization of Health Care Services, Long-Term Care, Disability Status of Children 7 Assets and Liabilities, Retirement Expectations and Pension Plan Coverage, Real Estate Property and
Vehicles 8 Annual Income and Retirement Accounts, Taxes, School Enrollment and Financing
1984 Panel 1 No Topical Modules 2 No Topical Modules 3 Education and Work History, Health and Disability 4 Assets and Liabilities; Retirement and Pension Coverage; Housing Costs, Conditions, and Energy Usage 5 Child Care, Welfare History and Child Support, Reasons for Not Working/Reservation Wage, Support for
Nonhousehold Members/Work-Related Expenses 6 Earnings and Benefits, Property Income and Taxes, Education and Training 7 Assets and Liabilities, Pension Plan Coverage, Real Estate Property and Vehicles 8 Support for Nonhousehold Members/Work-Related Expenses, Marital History, Migration History, Fertility
History, Household Relationships 9 Annual Income and Retirement Accounts, Taxes, School Enrollment and Financing
90-3, 90-6, 91-3, 92-6, 92-9, 93-3, 93-6, 93-9, 96-5Welfare History and Child Support 84-5Real Estate Property and Vehicles 84-7, 85-3, 85-7, 86-4, 86-7, 87-4, 90-4, 91-7, 92-4, 93-7Real Estate, Shelter Costs, Dependent Care, andVehicles
87-7, 88-4, 90-7, 91-4, 92-7, 93-4, 93-7
Shelter Costs/Energy Usage 86-6, 87-3Property Income and Taxes 84-6Housing Costs, Conditions, and Energy Usage 84-4Employment History 86-2, 87-2, 88-2, 89-2, 90-2, 91-2, 92-1, 93-1, 96-1WorkDisability History 86-2, 87-2, 88-2, 89-2, 90-2, 91-2, 92-2, 93-2, 96-2Work Schedule 87-6, 88-3, 88-6, 89-3, 90-3, 91-3, 92-6, 92-9, 93-3, 93-6, 93-9,
96-4, 96-10Work-Related Expenses 84-5, 84-8, 85-4, 86-6, 87-3, 96-3, 96-6, 96-9, 96-12Reasons for not Working/Reservation Wage 84-5Time Spent Outside Work Force 90-6Job Offers 85-6, 86-3Home-Based Self-Employment/Size of Firm 92-6, 93-3Education and Training History 86-2, 87-2, 88-2, 89-2, 90-2, 91-2, 92-2, 93-2, 96-2Education and Work History 84-3School Enrollment and Financing 84-9, 85-5, 85-8, 86-5, 87-5, 88-5, 90-5, 90-8, 91-5, 91-8, 92-5,
92-8, 93-5, 93-8, 96-5Education and Training 84-6Functional Limitations and Disability 90-3, 90-6, 91-3, 92-6, 93-3
(table continues)
FINDING SIPP INFORMATIONFINDING SIPP INFORMATIONFINDING SIPP INFORMATIONFINDING SIPP INFORMATION
5-11
Table 5-4. Topical Modules, by Subject (continued)
Subject Areas Panel and Wavea
Functional Limitations and DisabilityAdults 92-9, 93-6, 96-5, 96-11Functional Limitations and DisabilityChildren
92-9, 93-6, 96-5, 96-11
Disability Status of Children 85-6, 86-3, 87-6, 88-3, 88-6, 89-3Functional Activities 88-6, 89-3Medical Expenses and Work Disability 87-7, 88-4, 90-7, 91-4, 92-7, 93-4, 93-7Utilization of Health Care Services 90-3, 90-6, 91-3, 92-6, 93-3Utilization of Health Care ServicesAdults 92-9, 93-6, 96-5, 96-12Utilization of Health Care ServicesChildren 92-9, 93-6, 96-5, 96-12Health Status and Utilization of Health CareServices
85-6, 86-3, 87-6, 88-3, 88-6, 89-3
Long-Term Care 85-6, 86-3, 87-6, 88-3Home Health Care 88-6, 89-3Health and Disability 84-3Employer-Provided Health Benefits 96-5Disability Questions 96-4Extended Measure of Well-Being (ConsumerDurables, Living Conditions, Basic Needs)
91-6, 92-3
Adult Well-Being 96-8Basic Needs 93-9Welfare Reform 96-8Children�s Well-Being 92-9, 93-6, 93-9, 96-6, 96-11a The number preceding the hyphen indicates the year of the panel, and the number following the hyphen indicatesthe wave number. Thus, 84-8 denotes that the information was collected in the 1984 Panel, during Wave 8.
Table 5-5. Structure of Topical Module Microdata File
SUIDa PersonInterview Statusin Interview Month Core Vars
Topical ModuleVars
1 1 Yes2 Yes3 No Missing Missing4 Yes5 No Missing Missing
2 1 Yes2 Yes
3 1 Yes4 1 Yes
2 No Missing Missing3 Yes
5 1 Yes2 Yes3 Yes
a Sample unit ID number. Chapter 4 provides more information about identification numbers in SIPP.
Full and Partial Panel FilesFull and Partial Panel FilesFull and Partial Panel FilesFull and Partial Panel Files
At the conclusion of each panel, the Census Bureau creates a single full panel file containing alldata from the core wave files for every person who was a member of the SIPP sample at anytime during the life of that panel.2 To date, the full panel files have been issued in a format thatcontains one record for each person. That record contains either data or missing value codes formost core questionnaire items for every month of the panel.3 Chapter 3 discusses survey content,including information about the content of the core questionnaire. At the time that this Guide waswritten, full panel files had been issued for all SIPP panels prior to the 1996 Panel. Because ofthe extended (4-year) duration of the 1996 Panel, the Census Bureau is modifying its proceduresfor releasing information for the full panel.
Sources for Obtaining SIPP MicrodataSources for Obtaining SIPP MicrodataSources for Obtaining SIPP MicrodataSources for Obtaining SIPP Microdata
SIPP microdata files can be obtained from several sources. All public use microdata files can beobtained on magnetic media or CD-ROM directly from the Census Bureau. When microdata filesare obtained directly from the Census Bureau, users are provided with a full set of documentationfor those files, including all currently available applicable User Notes (discussed later in thischapter). Users can also be placed on a distribution list to receive information from the CensusBureau regarding any errors found in, or revisions made to, those files, by contacting theCustomer Services Branch, Administrative and Customer Services Division, at (301) 457-4100.
In addition, analysts affiliated with institutions that are members of the Inter-universityConsortium for Political and Social Research (ICPSR) can obtain all SIPP microdata from thatsource. Users should contact the ICPSR representative at their institutions for more information.Finally, SIPP data and documentation, as released by the Census Bureau, are not copyrighted.The data files and supporting documentation can therefore be freely copied and distributed toother users.4
There is another source of SIPP data that can be quite useful for simple exploratory work. SIPPmicrodata are available on-line at the Census Bureau�s Web site (http://www.census.gov/) andfrom the SIPP Web site (http://www.sipp.census.gov/sipp/). Those Internet sites offer two dataaccess tools�Surveys-on-Call, which is part of the Data Extraction System (DES), and FERRET,which is part of the new Census Bureau Data Access and Dissemination System (DADS).
Surveys-on-Call provides access to SIPP longitudinal files for the 1988 through 1993 Panels andfor wave and topical module files for the 1990 through 1993 Panels. Surveys-on-Call allowsusers to define microdata extracts from the SIPP public use microdata files. Users can choose 2 Because of the volume of data collected in the 1996 Panel, that procedure may not occur for the 1996 full panelfile.3 In the case of items that are asked only once per interview rather than for each month of the 4-month referenceperiod, there is a field for each interview rather than for each month.4 This provision pertains only to materials authored and distributed by the Census Bureau or other federal agencies.It does not imply any rights to copy and distribute material published by any other party.
FINDING SIPP INFORMATIONFINDING SIPP INFORMATIONFINDING SIPP INFORMATIONFINDING SIPP INFORMATION
5-13
data for selected years, wave files, core files, topical module files, or longitudinal files. They canalso select variables of interest and use variables as selection criteria. For example, an analystmight want to extract recipiency information for females between the ages of 18 and 25 fromWave 5 of the 1993 Panel. Once defined, analysts can download those extracts to their owncomputers for analysis. Surveys-on-Call creates microdata extracts from the SIPP public use filesonly. It does not include any options for performing analyses on-line. On-line help is available ateach step of the data-extraction process. Users are encouraged to explore the capabilities of thissystem by creating several small extracts.
SIPP data available on the Federal Electronic Research Review and Extraction Tool (FERRET)include files from the 1996 Panel and the longitudinal files from the 1992 and 1993 Panels.FERRET is the product of a joint project of the U.S. Census Bureau and the Bureau of LaborStatistics. It is a system enabling users to access and manipulate large demographic andeconomic data sets on-line. FERRET is designed to aid not only sophisticated researchers, butalso reporters, students, government policy makers, and amateur statisticians. SIPP is one ofseveral surveys available through FERRET.5
Other Sources of Information About SIPPOther Sources of Information About SIPPOther Sources of Information About SIPPOther Sources of Information About SIPP
Other sources of information about SIPP include the SIPP Quality Profile, User Notes, and SIPPworking papers. The SIPP Web site includes an extensive bibliography that provides referencesto SIPP-related research and documentation, data dictionaries, variable metadata documenting allinformation relevant to variables that appear on the public use microdata files, and a computer-based tutorial that introduces users to methods and concepts needed to use SIPP data.
The SIPP Quality Profile documents data quality issues related to SIPP. It summarizes what isknown about the sources and magnitude of errors in estimates based on SIPP. The SIPP QualityProfile covers both sampling and nonsampling error, with an emphasis on nonsampling error.There have been three editions of the SIPP Quality Profile. The third edition, by Kalton,Winglee, & Jabine (U.S. Census Bureau, 1998a), updates the two previous editions, by King,Petroni, & Singh (U.S. Census Bureau, 1987) and Jabine, King, & Petroni (U.S. Census Bureau,1990). The third edition of the SIPP Quality Profile is available on-line at the SIPP Web site.
5 Among the current and future topics accessible through FERRET are employment, health care, education, race andethnicity, health insurance, housing, income and poverty, aging, marriage, and the family. FERRET allows users toquickly locate current and historical information from survey sources, get tabulations for specific information theyneed, make comparisons between different data sets, create simple tables, and download large amounts of data todesktop and larger computers for custom reports.
SIPP User NotesSIPP User NotesSIPP User NotesSIPP User Notes
The SIPP User Notes, issued periodically by the Census Bureau, contain updated information forspecific microdata files. The User Notes include corrections to the data dictionaries,announcements of errors found in the public use data files after their release, and recommendedcorrections for those data errors. Analysts obtaining SIPP microdata files directly from theCensus Bureau will receive all User Notes that have been issued for those files at the time ofpurchase. Users who obtained files from other sources should contact the Customer ServicesBranch, Administrative and Customer Services Division, at (301) 457-4100, to request the UserNotes that have been issued for the data they plan to use. User Notes are also available at theSIPP Web site (http://www.sipp.census.gov/sipp/).
Users purchasing SIPP microdata files directly from the Census Bureau receive, along with thedata files, a package of technical documentation. The technical documentation includes:
! A data dictionary, containing information about the file structure and the names, locations,and contents of all variables. The printed version of the data dictionary also includesinformation about the structure of the machine-readable data dictionary supplied with eachfile.
! A source and accuracy statement, containing detailed information about sample weights andcomputation of standard errors using Census Bureau generalized variance procedures. Thisinformation is specific to the panel, wave, and content of the data file. For example, thetopical module file and the core wave file for Wave 7 of the 1990 Panel have different sourceand accuracy statements.
! A copy of the questionnaire screens and program code used to collect the informationcontained in the microdata file for the computer-assisted interviews for the 1996 Panel,which is available from the SIPP Web site (Chapter 2).
SIPP Working PapersSIPP Working PapersSIPP Working PapersSIPP Working Papers
The Census Bureau publishes a series of SIPP working papers. Those papers are written byauthors inside the Census Bureau and by outside analysts. The series includes research papersbased on SIPP data or related to the SIPP program. SIPP working papers can be obtained fromthe SIPP Web site (http://www.sipp.census.gov/sipp/) or ordered from the Customer ServicesBranch, Administrative and Customer Services Division, at (301) 457-4100.
FINDING SIPP INFORMATIONFINDING SIPP INFORMATIONFINDING SIPP INFORMATIONFINDING SIPP INFORMATION
5-15
BibliographyBibliographyBibliographyBibliography
A bibliography of works related to SIPP is available on-line from the SIPP Web site. Thisrelatively comprehensive bibliography contains references for journal articles, research papers,and working papers that use SIPP data or that discuss the SIPP survey.
Variable metadata, available in the data dictionary, provide a complete characterization of avariable�s content. Variable metadata include all information relevant to variables that appear inthe SIPP public use microdata files, including the variable name, a description of the variable,the concept label, data type (binary or character), suggested weight variable when applicable,descriptions of all possible values, and other data when applicable. A variable summary will beincluded for each public use variable. The summary identifies all edits, recodes, and imputationsthat affect the final edited output variable.
What’s Available from the Survey of Income and ProgramWhat’s Available from the Survey of Income and ProgramWhat’s Available from the Survey of Income and ProgramWhat’s Available from the Survey of Income and ProgramParticipation?Participation?Participation?Participation?
What�s Available from the Survey of Income and Program Participation?, published by theCensus Bureau, provides a complete directory of available SIPP data and publications. Thedirectory lists materials available in both print and electronic formats. What�s Available includesa listing of SIPP working papers, User Notes, public use microdata files, P-70 series populationreports, and compilations of relevant papers published in the proceedings from the annualmeetings of the American Statistical Association (ASA). What�s Available from the Survey ofIncome and Program Participation? is updated periodically. Users can review the most recentedition at the Census Bureau Web site.
Table 5-6 lists telephone numbers to call for obtaining additional information about specificaspects of SIPP.
SIPP USERS’ GUIDE
5-16
Table 5-6. Telephone Numbers for Information About Specific Aspects of SIPP
Subject Fields Telephone Number
Adult well-being (301) 763-2464
Child care (301) 763-2416
Child well-being (301) 763-2416
Education (301) 763-2464
Fertility (301) 763-2416
Health insurance (301) 763-3213
Income (301) 763-3243
Labor force, employment, and earnings (301) 763-3230
This chapter summarizes information about nonsampling errors in the Survey of Income andProgram Participation (SIPP) that may affect the results of certain types of analyses. All surveysare subject to various sources of nonsampling errors, and SIPP is no exception. Nonsamplingerrors in SIPP include those that are found in most surveys as well as errors that arise because ofSIPP�s panel nature. The chapter focuses on the extent of nonsampling errors in SIPP and theimpact of those errors on some survey estimates. The following topics are discussed:
! Undercoverage;
! Nonresponse;
! Measurement errors; and
! Effects of nonsampling errors on some survey estimates.
One source of error in SIPP, as in other household surveys, is differential undercoverage ofdemographic subgroups. Black males over 15 years of age are most affected by undercoverage.The coverage ratio for this subgroup was about 0.82 in the 1990 and 1991 SIPP Panels.(Coverage ratio is computed as the survey estimate of the number in the subgroup before post-stratification, divided by a population estimate for the subgroup from population projectionsbased on the most recent census.) For black males in their mid to late 20s, the coverage ratio waslower, about 0.65 in the same panels (SIPP Quality Profile, 3rd Ed. [U.S. Census Bureau, 1998a,Chapter 3]; hereinafter in this chapter, SIPP Quality Profile, 3rd Ed). These coverage ratios mayunderstate the magnitude of the coverage problems because census undercounts are not reflectedin the coverage ratios before 1992. Undercoverage in household surveys is attributed mainly towithin-household omissions; the omission of entire households is less frequent. Shapiro et al.(1993) estimated that about 70 percent of the undercoverage for young black males consists ofwithin-household omissions; the corresponding percentage for the white population is about 60percent. To compensate for undercoverage, the Census Bureau uses population controls to adjustSIPP weights. Little is known about the effectiveness of the adjustments in reducing biases.
NonresponseNonresponseNonresponseNonresponse
Nonresponse is a major concern in SIPP because of the need to follow the same people overtime. In SIPP, nonresponse can occur at several levels: household nonresponse at the first waveand thereafter; person nonresponse in interviewed households; and item nonresponse, including
complete nonresponse to topical modules. At the household level, the rate of sample loss for the1991 Panel rose from about 8 percent at Wave 1 to more than 21 percent by Wave 8. For thesame panel, 23 percent of the original sample persons who participated in Wave 1 missed one ormore interviews for which they were eligible in later waves. At the item level, the nonresponserate is typically around 10 percent or less for items on income amounts but somewhat higher foritems on asset amounts. Nonresponse reduces the effective sample size (and, therefore, increasessampling error) and introduces bias in the survey estimates. The Census Bureau uses acombination of weighting and imputation methods to reduce the biasing effects of nonresponseat all three levels in SIPP. The effectiveness of those procedures remains a matter of ongoingreview and research (SIPP Quality Profile, 3rd Ed., Chapters 4, 5, and 8).
Measurement errors are associated with the data collection phase of the survey. They may varyacross SIPP panels because of changes in data collection procedures over the years. Most coresurvey items in SIPP are used consistently at every panel, although there have been occasionalchanges to improve the clarity of some items. The data collection method, which was face-to-face interviewing for the early panels, was changed to a maximum use of telephone interviewingin February 1992. Telephone interviewing was used as the primary mode of data collectionbetween February 1992 and January 1996 for all waves except Waves 1, 2, and 6, for whichface-to-face interviewing was used. The switch to telephone interviewing has had no knownadverse effects on data quality.
Computer-assisted interviewing (CAI) was introduced with the 1996 SIPP Panel. The effects ofCAI on survey responses have yet to be determined (SIPP Quality Profile, 3rd Ed., Section11.3). For the 1996 Panel, computer-assisted personal interviewing (CAPI) was used for Waves1 and 2. After Wave 2, the field representatives used the CAI instrument in face-to-faceinterviews with approximately one-third of the respondents; for the remaining interviews, thefield representatives used the CAI instrument but conducted telephone interviews from theirhomes.
The combination of face-to-face interviews and telephone interviews used across waves isprespecified and varies for different subgroups of the sample according to the following scheme(Waite, 1996). Sample members are assigned to one of three interviewing mode subgroups. Foreach subgroup, a pattern of interviewing modes is designated and repeated every three waves.Thus, for Waves 3, 4, and 5, subgroup 1 is assigned the sequence face-to-face, telephone,telephone; subgroup 2, the sequence telephone, face-to-face, telephone; and subgroup 3, thesequence telephone, telephone, face-to-face. Under this scheme, which is applied with eachrotation group, one-third of the sample is interviewed in person each wave and each month, andevery household is interviewed in person once a year. The same sequence is repeated for Waves6 and beyond, with a cycle of three waves (SIPP Quality Profile, 3rd Ed.).
Response errors in SIPP include errors of recall, errors in proxy respondents� reports, and othererrors associated with the panel nature of SIPP. SIPP uses a 4-month recall period to reduce
memory error, and respondents are encouraged to use financial records and an event calendar tofacilitate recall. Although the level of accuracy for self-response is generally believed to behigher than for proxy response (see Moore, 1988, for a contrary view), achieving a higherproportion of self-response would increase data collection costs and might lead to some increasein person nonresponse rates (SIPP Quality Profile, 3rd Ed., Section 4.5.3).
A potential source of response error that arises from the panel nature of SIPP is the time-in-sample effect (or panel conditioning). This effect occurs when the responses given at later wavesare affected by the respondents� experiences of being interviewed in previous waves. The extentof this error is difficult to evaluate because it is often confounded with other sources of error,particularly attrition. Thus far, studies have found little evidence of systematic biases resultingfrom time-in-sample effects (Pennell and Lepkowski, 1992; McCormick et al., 1992).
Measurement errors can also occur when respondents misinterpret questions. For example, whenasked about earnings, some respondents may have reported take-home pay instead of grossearnings. There is also some evidence of confusion in regard to welfare programs, such as the oldAid to Families with Dependent Children and general assistance programs.
Another response error identified through the panel nature of SIPP is the seam phenomenon.Research has consistently indicated that respondents tend to report the same status (e.g.,employment or program participation) and the same amounts (e.g., Social Security income) forall 4 months within a wave, with most reported changes occurring between the last month of onewave and the first month of the subsequent wave. This phenomenon results in an overstatementof changes at the on-seam months (the boundary between interviews in successive waves of apanel) and an understatement of changes at the off-seam months. The seam phenomenon affectsmost variables for which monthly data are collected. As a result of the rotation group pattern, thephenomenon has relatively small effects on cross-sectional estimates based on all four rotationgroups. That is because there is only one rotation group (or one-fourth of the sample) that is onseam and three rotation groups off seam for any given pair of calendar months. The effects of theseam phenomenon on longitudinal estimates are not well known (SIPP Quality Profile, 3rd Ed.,Chapter 6).
Effects of Nonsampling Error on SurveyEffects of Nonsampling Error on SurveyEffects of Nonsampling Error on SurveyEffects of Nonsampling Error on SurveyEstimatesEstimatesEstimatesEstimates
A considerable amount of research has been conducted to investigate the various sources ofnonsampling error in SIPP. The results of the research are summarized in the SIPP QualityProfile, 3rd Ed.). The research includes, for example, the SIPP Record Check Studies (Marquisand Moore, 1989a,b, 1990; Marquis et al., 1990) that compared SIPP responses on programparticipation with administrative records. Despite the volume of this methodological research, itremains difficult to quantify the combined effects of nonsampling errors on SIPP estimates. Theproblem is made more complex because the effects of nonsampling error of different types onsurvey estimates vary, depending on the estimate under consideration. There are, however, some
findings about nonsampling error that SIPP users should bear in mind when conducting theiranalyses and examining their results. Those findings include the following:
! Some demographic subgroups are underrepresented in SIPP because of undercoverage andnonresponse. They include young black males, metropolitan residents, renters, people whochanged addresses during a panel (movers), and people who were divorced, separated, orwidowed. The Census Bureau uses weighting adjustments and imputation to correct theunderrepresentation. Those procedures, however, may not fully correct for all potential biases(SIPP Quality Profile, 3rd Ed., Chapter 8).
! The SIPP estimates of income from Social Security, Railroad Retirement, and SupplementalSecurity programs represent more than 95 percent of the amounts reported by administrativesources. The SIPP estimates of unemployment income, workers� compensation income,veteran�s income, and public assistance income, however, are low relative to the amountsreported by administrative sources (Coder and Scoon-Rogers, 1996).
! Evaluation studies typically find that SIPP estimates (as well as other survey estimates) ofproperty income are generally poor. Among the different types of property income, reports ofinterest and dividend income are most prone to error. Respondents are often confused aboutthose two sources of income, and both sources tend to be underreported (Coder and Scoon-Rogers, 1996).
! SIPP estimates of assets, liabilities, and wealth are low relative to estimates from the FederalReserve Board (Eargle, 1990).
! For SIPP panels before 1996, the estimates of the percentages of people in poverty werelower than those found in the Current Population Survey (CPS) (Shea, 1995a).
! SIPP estimates of the working population differ from those produced from CPS. Thedifferences may be explained largely by substantial conceptual and operational differences inthe collection of labor force data in the two surveys (SIPP Quality Profile, 3rd Ed., Chapter10).
! The SIPP estimates of people without any health insurance coverage are much lower than theCPS estimates. There are reasons to believe that the SIPP estimates are more accurate(McNeil, 1988).
! The SIPP estimates of the number of births compare favorably with the CPS estimates. Bothsurveys, however, provide estimates that are low relative to the records from the NationalCenter for Health Statistics (NCHS). The SIPP estimates of the number of marriages arefairly comparable with the NCHS counts, but the SIPP estimates of the number of divorcesare consistently lower than the NCHS estimates (SIPP Quality Profile, 3rd Ed., Chapter 10).
In spell analyses, Kalton et al. (1992) found that spell durations of multiples of 4 months (e.g., 4months, 8 months, 12 months) were particularly common, a feature that can be explained by theseam phenomenon.
This chapter discusses methods for obtaining the sampling error estimates derived from theSurvey of Income and Program Participation (SIPP) panels. The sample selected for each SIPPpanel is a stratified multistage probability sample. This complex sample design needs to be takeninto account when estimating the variances of SIPP estimates. The SIPP data files containvariables, related to the sample design, that are created for the purpose of variance estimation.Several software packages are now available for computing variance estimates for a wide rangeof statistics based on complex sample designs. Using the variables that specify the design, theseprograms can calculate appropriate variances of survey estimates. The Census Bureau alsoprovides generalized variance functions (GVFs) that can be used to obtain approximate estimatesof sampling variance for SIPP estimates.
A common mistake in the estimation of sampling error for survey estimates is to ignore thecomplex survey design and treat the sample as a simple random sample (SRS) of the population.That mistake occurs because most standard software packages for data analyses assume simplerandom sampling for variance estimation. When applied to SIPP estimates, SRS formulas forvariances typically underestimate the true variances. This chapter describes how appropriatevariance estimates, which take into account the complex sample design, can be obtained for SIPPestimates.
The topics discussed in this chapter are:
! Direct variance estimation;
! Approximate variance estimates obtained from GVFs; and
! Variance estimation when some data are imputed.
Direct Variance EstimationDirect Variance EstimationDirect Variance EstimationDirect Variance Estimation
The primary sampling unit (PSU) plays a key role in variance estimation with a multistagesample design. SIPP PSUs are mostly counties, groups of counties, or independent cities (SIPPQuality Profile, 3rd Ed. [U.S. Census Bureau, 1998a, Chapter 3]), which are sampled withprobability proportional to size within strata. The PSUs are sampled without replacement so thatno PSU is selected more than once for the sample. Some PSUs are so large that they are includedin the sample with certainty. Because no sampling is involved, those PSUs are, in fact, not PSUsbut strata. The actual PSUs for those certainty selections are the enumeration districts and otherunits selected within them.
Although the SIPP PSUs are selected without replacement (as is the case with most multistagedesigns), for the purpose of variance estimation they are treated as if they were sampled withreplacement. The with-replacement assumption greatly facilitates variance estimation since itmeans that variance estimates can be computed by taking into account only the PSUs and strata,without the need to consider the complexities of the subsequent stages of sample selection. Thiswidely used simplifying assumption leads to an overestimation of variances, but theoverestimation is not great.
Several software packages are available for computing variances of a wide range of surveyestimates (e.g., means and proportions for the total sample and for subclasses, for differences inmeans and proportions between subclasses, and for regression and logistic regressioncoefficients) from complex sample designs. Many of these packages are listed on the Web:http://www.fas.harvard.edu/~stats/survey-soft/survey-soft.html. Lepkowski and Bowles (1996)examined eight of the packages.
These packages use a variety of methods for variance estimation. Some use an approach basedon a Taylor-series approximation, or linearization, method. Others use a replication method, suchas jackknife repeated replications or balanced repeated replications. Although some methodshave advantages in some situations, there is generally little to recommend one method overanother. The variance estimates they produce are not identical, but the differences are usuallysmall. See Wolter (1985) and Rust (1985) for discussions of these methods.
Variance Units and Variance Strata, 1990–1993 PanelsVariance Units and Variance Strata, 1990–1993 PanelsVariance Units and Variance Strata, 1990–1993 PanelsVariance Units and Variance Strata, 1990–1993 Panels
For the 1990�1993 SIPP Panels, the sample member record contains information concerning thePSU and stratum within which the member was sampled. This information is needed as input forall of the specialized software packages. The original PSU and strata codes are not included inthe SIPP public use data files, however, to avoid potential identification of small geographicareas and sampled individuals. Instead, sets of PSUs are combined across strata to producevariance units and variance strata, with two variance units in each variance stratum. Varianceunits and variance strata may be treated as PSUs and strata for variance estimation purposes.Their use does not give rise to any bias in the variance estimates. The variance estimates aresomewhat less precise, however, than those obtained from the use of the PSUs and strata thathave not been combined.
Under the complex sample design, the number of degrees of freedom for variance estimationdepends on the number of variance strata. The 1984 SIPP Panel consists of 142 variance units in71 variance strata; the panels between 1985 and 1991 have 144 variance units and 72 variancestrata; and the 1992�1993 Panels have 198 variance units and 99 variance strata. As a roughapproximation, the number of degrees of freedom for a variance estimate is the number ofvariance strata. Thus, for national estimates, the variance estimates have about 71 degrees offreedom for the 1984 Panel, 72 degrees of freedom for the 1985�1991 Panels, and 99 degrees offreedom for the 1992�1993 Panels. Regional estimates will have fewer degrees of freedombecause such estimates include only some of the variance strata.
Table 7-1 displays the variable names for the variance stratum and variance unit codes in theSIPP core wave files and the SIPP full panel files. These codes can be employed as stratum andPSU codes in any of the software packages for variance estimation with complex sampledesigns.
Table 7-1. Variance Stratum Code and Variance Unit Code in SIPP Files, 1990�1993
Variable for Variance Estimation: SIPP Core Wave File SIPP Full Panel FileVariance stratum code HSTRAT VARSTRATVariance unit (or half-sample) code HHSC HALFSAMP
Replication Weights for the 1996 PanelReplication Weights for the 1996 PanelReplication Weights for the 1996 PanelReplication Weights for the 1996 Panel
Analysts should use Fay�s method for estimating variances for the 1996 SIPP Panel. Fay�smethod is a modified balanced repeated replication (BRR) method of variance estimation. Thedifference between the basic BRR method and Fay�s method is that the BRR method usesreplicate factors of 0 and 2, whereas Fay�s method uses one factor, k, which is in the range (0, 1),with the other factor equal to 2 � k. In Fay�s method, the introduction of the perturbation factor(1 � k) allows the use of both halves of the sample. Thus, Fay�s method has the advantage that nosubset of the sample units in a particular classification will be totally excluded. The varianceformula for Fay�s method is
θi = ith estimate of the parameter θ based on the observations included in the ithreplicate;
θ0 = survey estimate of the parameter θ based on the full sample.
The 1996 SIPP Panel uses 108 replicate weights, which are calculated on the basis of aperturbation factor of 0.5 (k = 0.5). Inserting those values into Equation (7-1) results in the 1996SIPP Panel variance formula of
108Var(θ0) = [1/(108 * 0.52)] ∑ (θi � θ0)2.
i = 1
The Census Bureau used VPLX software to compute the replicate weights that are availablethrough FERRET.
Using GVFs to Approximate Variance EstimatesUsing GVFs to Approximate Variance EstimatesUsing GVFs to Approximate Variance EstimatesUsing GVFs to Approximate Variance Estimates
The Census Bureau provides two forms for approximate variance estimation: GVFs and tables ofstandard errors (the square root of the variance) for different estimated numbers and percentages.The generalized estimates provide indications of the magnitude of the sampling error in thesurvey estimates. They serve as convenient ways to summarize the sampling errors for a broadvariety of estimates.
The GVFs for SIPP were derived by modeling the standard error behavior of groups of estimateswith similar standard errors. The mathematical form of the function adopted is
s = (ax2 + bx)1/2, (7-2)
where s represents the standard error and x the value of an estimate. The parameters a and b arederived on the basis of a selected group of estimates. They are updated annually and are includedin the source and accuracy statement that accompanies each SIPP data file for a panel. It isessential to use the parameter estimates for a specific panel and to follow the instructions toapply necessary adjustments to obtain the correct estimates for subgroups. Besides GVFs, theCensus Bureau provides summary tables of general standard errors. Those estimates are alsoavailable in the source and accuracy statements. The following examples show how to use GVFsto estimate the standard errors of estimated numbers and of sample means. The use of GVFs andtables of standard errors is described in the source and accuracy statements for each panel.
Before looking at the examples, the user should note that the generalized variance estimates forestimating the standard errors of other statistics may not be accurate for small subgroups. Usingthe 1984 SIPP Panel, Bye and Gallicchio (1989) developed variance functions for participants ofOld-Age, Survivors, and Disability Insurance (OASDI) and Supplemental Security Income (SSI)programs. They found that for estimates of less than 10 million, the generalized standard errorestimates provided by the Census Bureau were 1.20 to 1.75 times larger than those obtained fromthe variance functions developed specifically for that subgroup.
Using GVFs for Standard Errors of Estimated NumbersUsing GVFs for Standard Errors of Estimated NumbersUsing GVFs for Standard Errors of Estimated NumbersUsing GVFs for Standard Errors of Estimated Numbers
The approximate standard error, s, of an estimated number of persons (or households, andfamilies) can be obtained by the formula
s = (ax2 + bx)1/2, (7-3)
where a and b are the parameters associated with the estimate for the particular reference period,and x is the weighted estimate. This equation is appropriate for the standard errors of estimatednumbers and should not be applied to estimates of dollar values.
Suppose that the number of households with monthly household income above $6,000 isestimated from Wave 1 of the 1991 Panel to be 472,000. The approximate values of a and b fromTable 6 of the source and accuracy statement of the 1991 Panel are a = -0.0001005 and b =9,286. Then, the standard error, s, of this estimated number is given by
The approximate 90 percent confidence interval for the estimated number can be computed as x± 1.64 s, which ranges from 364,000 to 580,000. Therefore, a conclusion that the averageestimate derived from all possible samples lies within an interval computed in this way would becorrect for roughly 90 percent of all samples.
Using GVFs for the Standard Error of a MeanUsing GVFs for the Standard Error of a MeanUsing GVFs for the Standard Error of a MeanUsing GVFs for the Standard Error of a Mean
A mean is defined here to be the average quantity of some characteristic (other than the numberof persons or households) per person or household. For example, a mean could be the averagemonthly household income of females 25 to 54 years of age. The formula used to estimate thestandard error of a mean, x , is
2sybsx = , (7-4)
where y is the size on which the estimate is based, s2 is the estimated population variance of thecharacteristic, and b is the parameter associated with the particular type of characteristic.Because of the approximations used in developing this formula, an estimate of the standard errorof the mean obtained from this formula will generally underestimate the true standard error.
The estimated population mean is computed with the formula
,
1
1
∑
∑
=
== n
ii
in
ii
w
xwx (7-5)
and the estimated population variance can be computed as
( )∑
∑ −=i
iiw
xxws2
2 or ( )1
2
−−
∑∑
i
iiw
xxw (7-6)
with the use of standard software for weighted data. Suppose that, based on Wave 1 data of the1991 Panel, the mean monthly cash household income for females aged 25 to 54 is $2,530, theweighted number of females in this age range is y = 39,851,000, and the population variance isestimated to be s2 = 3,159,887. When the appropriate b parameter of 7,514 from Table 6 of the
source and accuracy statement for Panel 1991 is used, the estimated standard error of this meanis
xs = [(7,514 * 3,159,887)/39,851,000]1/2 = $24.
Thus, the 90 percent confidence interval, computed as
x ± xs64.1 ,
ranges from $2,491 to $2,569. Therefore, a conclusion that the average estimate derived from allpossible samples lies within an interval computed in this way would be correct for roughly 90percent of all samples.
Variance Estimation with Imputed DataVariance Estimation with Imputed DataVariance Estimation with Imputed DataVariance Estimation with Imputed Data
Imputation methods are used to fill in several types of missing data in SIPP. They are used tocomplete some item nonresponse, person-level nonresponse within households (Type Znonresponse), and some wave nonresponse (intermittent responses bounded by two respondingwaves). Imputation fills in gaps in the data set and makes data analyses easier. It also allowsmore people to be retained as panel members for longitudinal analyses. The concern, however, isthat imputation fabricates data to some degree. Treating the imputed values as actual values inestimating the variance of survey estimates leads to an overstatement of the precision of theestimates (Brick and Kalton, 1996). It is important to recognize this fact when sizableproportions of values are imputed.
Throughout this chapter, pre-1996 variable names appear in parentheses following 1996 variable names. 8-1
8. Using Sampling Weights on SIPP Files
This chapter describes the use of sampling weights in analyzing data from the Survey of Income and Program Participation (SIPP). Each SIPP file contains a number of alternative sets of weights for use in data analysis. The several different sets of weights are needed to cater to the different possible units of analysis (persons, households, families, and subfamilies) and different time periods for which survey estimates may be required. A common mistake in the analysis of a survey like SIPP is to ignore the weights entirely, that is, to perform an unweighted analysis. This chapter explains why an unweighted analysis is likely to produce biased estimates. It is important to understand the different sets of weights on the files and to use the set that is appropriate for a particular analysis. Topics covered in this chapter include: l What weights are and why they should be used;
l What weights are available in SIPP files;
l Which weights to use for a particular analysis;
l How weights are constructed;
l Using weights in the core wave files;
l Using weights in the topical module files;
l Using weights in the full panel files; and
l Using weights in combined panel files.
For the 1996 Panel, most variable names changed from those used in previous panels. To aid users working with files from panels prior to 1996, this chapter presents both the old and the new variable names whenever a variable is mentioned. In both the main body of the text and in tables, the old names are presented in parentheses following the new names. For example, the sample unit ID variable name, which is SSUID in the 1996 Panel, was SUID in previous panels; it is written in this chapter as SSUID (SUID).
What Weights Are and Why They Should Be Used
The weight for a responding unit in a survey data set is an estimate of the number of units in the target population that the responding unit represents. In general, since population units may be sampled with different selection probabilities and since response rates and coverage rates may
SIPP USERS’ GUIDE
Throughout this chapter, pre-1996 variable names appear in parentheses following 1996 variable names. 8-2
vary across subpopulations, different responding units represent different numbers of units in the population. The use of weights in survey analysis compensates for this differential representation, thus producing estimates that relate to the target population. Most SIPP panels have not sampled different subpopulations at different rates (the exceptions are the 1990 and 1996 Panels). However, there are some minor variations in sampling rates in all SIPP panels and, more important, there are appreciable variations in response and coverage rates across subpopulations. As a result, there is nontrivial variation in SIPP weights (see SIPP Quality Profile, 3rd Ed. [U.S. Census Bureau, 1998a, Table 8.1]). For example, in Wave 1 of the 1993 Panel, the final person lower quartile weight is 4,400 and the upper quartile weight is 5,245 (the maximum weight is 28,695). A respondent with a final person weight of 4,400 represents 4,400 people in the U.S. population for the reference month, whereas a respondent with a weight of 5,245 represents 5,245 people. Because weights in SIPP vary over a sufficiently large range of values, performing unweighted analyses may produce appreciably biased estimates for the U.S. population. Table 8-1 illustrates the effects of weighting on a selection of estimates obtained from Wave 1 of the 1990 Panel. The 1990 Panel included an oversample of households headed by blacks, Hispanics, and females with no spouse present and living with relatives. Since those groups are overrepresented in this sample, failure to use the weights would lead to overrepresentation of the groups in the population estimates based on that sample. At the household level, the unweighted percentage of households headed by females with no spouse present is 14.3 percent, whereas the weighted estimate is 11.7 percent. At the person level, the magnitude of the differences between weighted and unweighted estimates is less, but still appreciable.
Table 8-1. Weighted and Unweighted Point -in-Time Estimates of Percentages Based on Core Wave 1 of the 1990 SIPP Panel for January 1990
Percentage Characteristics Weighteda Unweighted Household-Level Female -headed households with no spouse present, living with relatives 11.7 14.3 Person-Level Female 51.3 52.2 Race/Ethnicity White 84.2 82.1 Black 12.4 14.4 American Indian, Eskimo, or Aleut 0.6 0.6 Asian or Pacific Islanders 2.9 2.9 Age over 65 years 10.4 10.6 Receiving Food Stamps [RCUTYP27 (FOODSTMP)] 6.7 7.7 RCUTYP20 (AFDC) 3.8 4.6 a Weighted by WPFINWGT (FNLWGT)—final weight for person—and WHFNWGT (HWGT)—final weight for households.
USING SAMPLING WEIGHTS ON SIPP FILES
Throughout this chapter, pre-1996 variable names appear in parentheses following 1996 variable names. 8-3
Weights Available in SIPP Files
Table 8-2 lists the weight variables in SIPP data files for the 1996 and 1990–1993 Panels. For earlier panels, the user should refer to the data dictionary for the particular file.
Table 8-2. Weight Variables in SIPP Files for the 1996 and 1990-1993 Panels
Variable Name Description Core Wave Files
WPFINWGT (FNLWGT) Reference month, final weight of person WHFNWGT (HWGT) Reference month, final weight of household WFFINWGT (FWGT) Reference month, final weight of family WSFINWGT (SWGT) Reference month, final weight of related subfamily WPFINWGT (P5WGT)a Interview (5th) month, final weight of person WHFNWGT (H5WGT) a Interview (5th) month, final weight of household
Topical Module Files WPFINWGT (FINALWGT) Prior to 1996: interview month, final weight of person. 1996+: 4th
reference month, final weight of person Full Panel Filesb
WPFINWGT (FNLWGT)_x Calendar year x, final weight of people in the calendar year cohort PNLWGT (Not kept for 1996 panel) Final weight for people in full panel cohort a Beginning with the 1996 Panel, SIPP files no longer include the interview month weights. b The number of calendar year weights in the full panel file depends on the panel’s duration. The 1990 full panel file contains two calendar year weights: WPFINWGT90 (FNLWGT90) and WPFINWGT91 (FNLWGT91). The 1992 full panel file has three calendar year weights: WPFINWGT92 (FNLWGT92), WPFINWGT93 (FNLWGT93), and WPFINWGT94 (FNLWGT94). The 1996 full panel file will have four calendar year weights when it is complete.
Choosing a Weight
The decision of which weight to use for a given analysis depends on the population of interest for that analysis. Useful guidance for choosing the correct set of weights is to consider to what population the results are intended to apply. The weights in the SIPP files are constructed for sample cohorts defined by: l Month (e.g., the reference month weights in the core wave files and interview month weights
in the topical module files);
l Year (e.g., the calendar year weights in the full panel file); and
l Panel (e.g., the full panel weight in the full panel file).
Users can choose to base their analyses on: l A cross-sectional sample at a given month;
l A longitudinal sample that provides continuous monthly data over a year;
SIPP USERS’ GUIDE
Throughout this chapter, pre-1996 variable names appear in parentheses following 1996 variable names. 8-4
l A longitudinal sample that provides monthly data over the life of a panel (about 32 months, or 48 months with the 1996 Panel); or
l A subset of the sample and/or the period in any of the above.
Monthly (cross-sectional) weights allow the use of all available data for a given month. For this type of analysis, users can choose among the following units of analysis: l Person (e.g., WPFINWGT (FNLWGT));
l Household (e.g., WHFNWGT (HWGT));
l Family (e.g., WFFINWGT (FWGT)); and
l Related subfamily (e.g., WSFINWGT (SWGT)).
Analysts can use longitudinal samples to follow the same people over time and hence study such issues as the dynamics of program participation, lengths of poverty spells, and changes in other circumstances (e.g., household composition). The longitudinal weights allow the inclusion of all people for whom data were collected for every month of the period involved (calendar year or full panel period), including those who left the target population through death or because they moved to an ineligible address (institution, foreign living quarters, military barracks), as well as those for whom data were imputed for missing months. The Census Bureau makes nonresponse adjustments to the longitudinal weights to compensate for panel attrition and poststratification adjustments to make the weighted sample totals conform to population totals for key variables.
How Weights Are Constructed
This section describes how the weights are constructed. The basic components for all the different sets of weights are the same, namely: l A base weight that reflects the probability of selection for a sample unit;
l An adjustment for subsampling within clusters;
l An adjustment for movers (in Waves 2 and beyond);
l A nonresponse adjustment to compensate for sample nonresponse; and
l A poststratification (second-stage calibration) adjustment to correct for departures from known population totals.
Weights
Reference month final weights are provided on the SIPP core wave files for persons, households, families, and subfamilies; interview month final weights are provided for persons and households. The special weights for persons are constructed first. The household, family, and
USING SAMPLING WEIGHTS ON SIPP FILES
Throughout this chapter, pre-1996 variable names appear in parentheses following 1996 variable names. 8-5
related subfamily final weights are derived from the final person weights. This section summarizes the steps involved in constructing the various sets of weights, starting with the final person weights for a reference or interview month. Appendix C provides the technical details and reasons for some of the adjustments. The reference and interview month weights1 for people on the core wave files are computed (i.e., are nonzero) for all responding sample members who are “in scope” (i.e., a part of the survey’s universe—the resident, noninstitutional population of the United States) in the specified month.2 A number of factors lead to fluctuations in sample size from month to month. They include births, deaths, immigration, and emigration from the population (and therefore from the sample). In addition to those population dynamics, people move into and out of the sample as a result of the changing household composition of sample members. (Chapter 2 describes the SIPP “following rules.”) In Wave 1, the weight for each sample person per month is a product of four components: 1. Wave 1 base weight. This weight is the inverse of the probability of a sample person’s
address being selected.
2. Duplication-control factor. This factor adjusts for the occasional subsampling of clusters. Clusters are occasionally subsampled in the field when they turn out to be much larger than expected.3
3. Wave 1 nonresponse adjustment. This adjustment compensates for different rates of household noninterview within adjustment classes. More than 500 nonresponse adjustment classes are defined based on a cross-classification of characteristics. Those characteristics include Census Region; MSA/Place Status (MSA-central city, MSA-non-central city, other place); race of reference person (black, nonblack); household tenure (owner, renter); household size (1, 2, 3, 4+ people). In addition, the within-primary-sampling-unit poverty stratum (high poverty, low poverty) was added for the 1996 Panel.
4. Wave 1 second-stage calibration. This adjustment brings the sample estimates into agreement with independent monthly estimates of population totals. The characteristics used for calibration include age, race, sex, Hispanic origin, family relationship, and household type. A raking procedure is used to ensure that the weights agree with all the control totals included for calibration. The adjustment is done by rotation group, with each group assigned one-fourth of the population total for the month.
In subsequent waves, each person receives an initial weight that is carried over from the preceding wave. This weight is adjusted to compensate for changes in the sample between waves resulting from movers and nonresponse, and then it is realigned to match the population totals for the reference or interview month:
1 Interview month weights were not computed for the 1996 Panel. 2 Persons subjected to Type Z imputation receive weights, although they are not respondents. 3 This adjustment has been used since Wave 5 of the 1984 Panel.
SIPP USERS’ GUIDE
Throughout this chapter, pre-1996 variable names appear in parentheses following 1996 variable names. 8-6
l Wave 2+ initial weight. This is the weight from the previous wave before the second-stage calibration for each original sample person who is a reference person or is in group quarters for the current wave.
l Wave 2+ mover’s adjustment. This adjustment is made to compensate for including people who were not in the original sample but were in the SIPP universe in Wave 1 and who moved into a sample household after Wave 1. For people in housing units that contain adult members who were not part of the original sample but were in the SIPP universe at Wave 1, the weights are decreased. For example, if a third adult moves into a household occupied by two original sample persons, all three adults would receive the initial weight of the original sample persons multiplied by a factor of two-thirds.
l Wave 2+ nonresponse adjustment. The nonresponse adjustment for Waves 2 and beyond is used to compensate for household nonresponse after the first interview. The nonresponse adjustment classes are defined on the basis of sample unit characteristics and personal demographic characteristics4 from the most recent wave. The information used consists of household characteristics. Reference person characteristics are used to define some of the household characteristics. Tenure (owner/renter occupied), househo ld type (female householder, no spouse present; 65+; other), race and Hispanic origin, and education level are defined at the household level by using reference person data. Other household characteristics include size, poverty status, type of income, type of financial assets, census division, and number of imputed items. Poverty threshold, census division, and number of imputed items are new to the 1996 Panel. Some adjustment classes are combined to ensure that the adjustment for each class does not exceed a factor of 2, and each class contains at least 30 unweighted sample households.
l Wave 2+ second-stage calibration. To derive this adjustment, use the same procedure as in Wave 1; that is, use the appropriate population control totals by reference month.
The reference month final weights for households, families, and subfamilies are derived from the person weights: l The household weight is the person weight of the household reference person (renter/owner
of housing unit).
l The family weight is the person weight of the family reference person.
l The subfamily weight for a related subfamily is the person weight of the related subfamily reference person (Chapter 10 explains how to identify households, families, and subfamilies).
l The interview month final household weight is the person weight of the household reference person in the interview month. (This weight does not apply to the 1996 Panel.)
4 Known as the control card information before the 1996 Panel, when computer-assisted interviewing (CAI) began.
USING SAMPLING WEIGHTS ON SIPP FILES
Throughout this chapter, pre-1996 variable names appear in parentheses following 1996 variable names. 8-7
Final Full Panel and Calendar Year Weights
Final full panel and final calendar year weights are provided on the full panel files for eligible sample members. There is one set of final panel weights and generally more than one set of calendar year weights, one for each calendar year covered by the panel. The 1992 Panel file has three sets of calendar year weights because that panel covered 3 calendar years. The 1996 Panel file will have four sets of calendar year weights. Final panel weights are computed only for people who are in the sample at Wave 1 of the panel and for whom data are obtained (either reported or imputed) for every month of the panel for which they were in scope for the survey. Other people in the panel file are assigned weights of zero. Most people with nonzero final panel weights have provided data for all months of the panel. However, people who missed a wave and whose missing wave data were imputed and people who provided data up to the point that they left the survey (through death or because they moved to an ineligible address) are also assigned nonzero final panel weights. (In core panels, it also includes those missing up to two consecutive waves, if the waves are bounded.) Final calendar year weights are computed only for people who had an interview covering the control date5 and for whom data are obtained (either reported or imputed) for every month of the calendar year for which they were in scope for the survey. Other people are assigned final calendar year weights of zero. Some people who joined the household of an original sample person after the start of the panel are assigned nonzero calendar year weights for the second calendar year, if data are obtained for that period. The full panel weighting scheme does not assign weights to people who enter the sample universe after Wave 1. Similarly, the calendar year weighting scheme does not assign weights to people who do not have an interview covering the control date. This group consists of (a) people who enter the sample universe after the first wave of interviewing for the calendar year and (b) people who were in the sample universe in the first wave of interviewing in the calendar year but did not have an interview covering the control date. For example, newborn infants and people leaving institutions who are entering the sample universe after Wave 1 are assigned full panel and calendar year 1 weights of zero. Note that the same people will receive positive calendar year 2 (CY2) weights if they are in the sample universe in the first wave of interviewing for CY2 and have an interview covering the control date for CY2. The final panel and calendar year weights are constructed from the following three components: 1. Initial weight. This weight is constructed from the components of the cross-sectional
weights at the start of the panel and calendar year weighting periods before the second-stage calibration adjustment.
5 The calendar year control dates are January 1 for the given calendar year. The exception is calendar year 1996 for the 1996 Panel. Its control date is currently March 1, 1996. This would change to January 1 should there be imputation for January and February data.
SIPP USERS’ GUIDE
Throughout this chapter, pre-1996 variable names appear in parentheses following 1996 variable names. 8-8
2. Nonresponse adjustment factors. These factors account for noninterviewed eligible sample persons not already accounted for in the noninterview adjustment component of the initial weight. The adjustment classes are similar to those used in the Wave 2+ nonresponse adjustment factors.
3. Second-stage calibration factors. These factors are determined by a process similar to that used for reference and interview month weighting. The control totals used for the calendar year weights are the population estimates for the control date of the relevant year. Those for the full panel weight are the population estimates for a designated date in the first wave of the panel (March 1 for most recent panels).
Using Weights in the Core Wave Files
Each core wave file contains reference month weights for persons, households, families, and subfamilies and, prior to the 1996 Panel, interview month weights for persons and households (interview month weights are not computed for families and related subfamilies). In the 1989 and earlier panels, each person’s record in a core wave file contained 18 weight variables, comprising weights for the four analysis units (persons, households, families, and subfamilies) for each of the four reference months and the person or household weights for the interview month. For the 1990 and later panels, the file structure was changed to a person-month format, as described in Chapter 10. With that format, each person-month record has only six weights, four for the four analysis units for that month and two for the two analysis units (household and family/related subfamily) for the interview month. This section describes those weights and indicates how they should be used for different types of analysis.
Reference Month and Interview Month Weights
To understand the format of the reference month and interview month weights, analysts may find it useful to recall the SIPP survey design and the file structure for the core wave file. The full SIPP sample consists of four rotation groups; for each wave, interviewing is spread over 4 months. One rotation group is interviewed per month, with the reference months for each rotation group being the 4 months preceding the interview month. As successive rotation groups are interviewed, the 4-month reference periods advance by 1 month. Therefore, there are 4 interview months and 4 reference months per rotation group for each wave. There are four final person reference month weights per sample person, one for each month in the reference period. Beginning with the 1990 Panel, the reference month weights are provided as one variable—that is, WPFINWGT (FNLWGT) for persons—in four separate person-month records per person. The reference month weight on each record refers to the specific month to
USING SAMPLING WEIGHTS ON SIPP FILES
Throughout this chapter, pre-1996 variable names appear in parentheses following 1996 variable names. 8-9
which the data relate. The core wave files for earlier panels used one record per person. On those files, the four reference month weights were shown as four separate variables. The interview month weight for a particular rotation group represents one-quarter of the U.S. population at the month of interview. The sum of the interview month weights for the four rotation groups is an estimate of the total U.S. population across the 4 months of interviewing per wave. The interview month weight can be used to form person or household estimates that specifically refer to characteristics as of the interview month. For example, an analyst might want to estimate the number of unmarried adults living with an aged parent as of the latest observation. The interview month weight can also be used for estimating a few of the demographic characteristics, such as race and sex, and other information that appears on the file for the 4-month reference period as a whole, but not for each month. Analysts should not use interview month weights to form estimates referring to the reference period plus the interview month. That is because characteristics at the time of the interview date are not necessarily representative of the rest of the reference period (i.e., people could move, marry, or leave the country). Beginning with the 1996 Panel, the core wave file no longer provides the interview month weight, since the focus of the data is the 4 calendar months prior to that month.
Person Reference Month and Interview Month Weights
For person-level analyses, the weights available in the core wave file are WPFINWGT (FNLWGT) (the reference month weight) and WPFINWGT (P5WGT) (the interview month weight—not applicable to the 1996 Panel). WPFINWGT (FNLWGT) is the estimated number of people in the population that the sample person represents in a specific reference month. The reference month is given by the variables RHCALMN (MONTH) and RHCALYR (YEAR), which are derived based on SROTATON (ROT) (rotation group) and SREFMON (REFMTH) (reference month). The interview month weight WPFINWGT (P5WGT) is also called the fifth-month weight. This weight shows the number of people in the population that the sample person represents at the interview month. Table 8-3 shows the reference months and interview month weights for two hypothetical sample persons in Wave 1 of the 1991 Panel, based on the person-month format. The persons can be identified by the variables SSUID (SUID), EENTAID (ENTRY), and EPPPNUM (PNUM) (Chapter 10 describes how to identify a person). There are four records per person, one for each reference month. The first four records are for the first person, who is from rotation group 2: SROTATON = 2 (ROT = 2). Reference month 1, SREFMON = 1 (REFMTH = 1), corresponds to October 1990 (MONTH and YEAR). WPFINWGT (FNLWGT) for SREFMON (REFMTH) = 1 is 5,000, meaning that this person represents 5,000 people in the population in October 1990. The values of WPFINWGT (FNLWGT) in subsequent months are slightly different because of adjustments to the weight resulting from fluctuations in the population and in the sample. The second person is from rotation group 3. Since the month of interview for this person is different
SIPP USERS’ GUIDE
Throughout this chapter, pre-1996 variable names appear in parentheses following 1996 variable names. 8-10
Table 8-3. Final Person Weights for Four Reference Months and One Interview Month in Wave 1 of the 1991 Panel
from that of the first person, the reference months for this person are also different. The variables RHCALMN (MONTH) and RHCALYR (YEAR) can be used to select records with data for a particular month.
Household Reference Month and Interview Month Weights
Households in the core wave file refer to a group of people who occupy a housing unit in a specific calendar month. For each household, the household weight WHFNWGT (HWGT) is the weight of the reference person (the renter/owner of a housing unit) of the household. WHFNWGT (HWGT) shows the number of households in the population that the sample household represents in that reference month. The household interview month weight WHFNWGT (H5WGT) is the number of households in the population that the sample household represents at the month of interview (which varies within a wave over a 4-month period). Note that the household reference person can change from one month to the next, resulting in a change of WHFNWGT (HWGT). WHFNWGT (HWGT) is assigned to all household members. Table 8-4 shows WHFNWGT (HWGT) and WHFNWGT (H5WGT) for five members of a household and their person weights. The variables SSUID (SUID) and SHHADID (ADDID) identify the household (Chapter 10 describes how to identify households). The WHFNWGTs (HWGTs) and WHFNWGTs (H5WGTs) for all members of a household are equal to the WPFINWGTs (FNLWGTs) and WPFINWGTs (P5WGTs) of the reference person in the household, respectively. In this case, the household reference person is the father. The user should note that weights for husbands and wives are equalized in the weight process. Therefore, couples (e.g., father and mother, daughter and son- in- law) have the same person weights.
USING SAMPLING WEIGHTS ON SIPP FILES
Throughout this chapter, pre-1996 variable names appear in parentheses following 1996 variable names. 8-11
Table 8-4. Household, Reference Month, and Interview Month Weights for Members of a Household for a Given Month in Wave 1 of the 1990 Panel
Family and Related Subfamily Reference Month Weights
All sample persons in a core wave file are assigned a family type, EFTYPE (FTYP), consisting of the following categories: primary families, unrelated subfamilies, primary individuals, and secondary individuals. A family is defined as a group of two or more persons related by birth, marriage, or adoption who reside together. A primary family is a family containing the household reference person and all of his or her relatives. An unrelated subfamily is a family in a household that is not related to the household reference person. A primary individual is a household reference person who lives alone or lives with only nonrelatives. A secondary individual is not a household reference person and is not related to any other people in the household. Related subfamily units within primary families are identified by ESFTYPE (STYPE) (0 = not in a subfamily; 1 = in a related subfamily; 2 = in an unrelated subfamily). Related subfamilies are families that are related to, but do not include, the household reference person. For example, the daughter, son- in- law, and grandchild in Table 8-4 constitute a related subfamily within a primary family. They are members of the father and mother’s primary family unit, as well as members of their own subfamily. The SIPP core wave files provide reference month weights for families and related subfamilies. The family reference month weight WFFINWGT (FWGT) is equal to the person weight of the family reference person in that month; it is assigned to all family members. The subfamily reference month weight WSFINWGT (SWGT) is equal to the person weight of the related subfamily reference person; it is assigned to all subfamily members and is set equal to zero for people not in related subfamilies. Primary individuals are the household reference persons and the family reference persons. For a primary individual, WFFINWGT (FWGT) = WPFINWGT (FNLWGT) = WHFNWGT (HWGT). Secondary individuals are classified as family reference persons who are not household reference persons. Therefore, for secondary individuals, WFFINWGT (FWGT) = WPFINWGT (FNLWGT) ? WHFNWGT (HWGT). The only exception is for people
SIPP USERS’ GUIDE
Throughout this chapter, pre-1996 variable names appear in parentheses following 1996 variable names. 8-12
in group quarters, RHTYPE = 6 (HTYPE = 6). The first secondary person in group quarters is labeled the household reference person; for that person, WFFINWGT (FWGT) = WPFINWGT (FNLWGT) = WHFNWGT (HWGT). Table 8-5 shows the weights for the different analysis units by type of household, RHTYPE (HTYPE), and by type of family, EFTYPE (FTYPE). Three households are shown. The first household is a married couple family household, RHTYPE = 1 (HTYPE = 1), consisting of a primary family and a related subfamily, ESFTYPE = 1 (STYPE = 1). The WHFNWGT (HWGT) for each member of this household is equal to the person weight of the household reference person (i.e., the father in this case). Members of this household belong to one primary family. Therefore, the WFFINWGT (FWGT) for each member is equal to the person weight of the family reference person (who is also the father). Some members of this primary family belong to a related subfamily unit (i.e., daughter, son- in-law, and grandchild). The subfamily weight WSFINWGT (SWGT) for each member of the subfamily is equal to the person weight of the subfamily reference person (e.g., the daughter). WSFINWGT (SWGT) is zero for the father and mother who are not part of the subfamily. The second household is a male-householder nonfamily household, RHTYPE = 4 (HTYPE = 4), with three unrelated individuals. The household reference person is the primary individual, EFTYPE = 34 (FTYPE = 4), and the others are secondary individuals, EFTYPE = 45 (FTYPE = 5). The WHFNWGT (HWGT) for this household is the person weight of the household reference person, and the weight is the same for all individuals. The WFFINWGT (FWGT) is different for each individual because each one is treated as his or her own family reference person. The third household is a group-quarters household, RHTYPE = 6 (HTYPE = 6). Because there is no household reference person based on the typical definition of renter or owner, both individuals are classified as secondary individuals, EFTYPE = 45 (FTYPE = 5). The first secondary individual in a group quarters is labeled as the household reference person, and the WHFNWGT (HWGT) for each person in group quarters is the weight of that individual. The WFFINWGT (FWGT) for each individual is different because each forms an individual family.
Calendar Month Estimation: Using a Single Core Wave File
Each core wave file consists of data from 7 calendar months covered by the reference month periods for the four rotation groups. There is only 1 calendar month with complete data from all four rotation groups. As an illustration, Table 8-6 shows the calendar months within the reference periods for Wave 1 of the 1991 Panel and the number of rotation groups available per month. The table shows that data from all four rotation groups are available for January 1991 only. Data are available from three rotation groups for December 1990 and February 1991, for two rotation groups for November 1990 and March 1991, and for one rotation group for October 1990 and April 1991.
Table 8-5. Family and Subfamily Reference Months Weights, by RHTYPE (HTYPE), EFTYPE (FTYPE), and ESFTYPE (STYPE) in Wave 1 of the 1990 Panel
Reference Months—Wave 1, 1996 Panel Rotation Group
Interview Month
1995 Dec.
1996 Jan.
1996 Feb.
1996 Mar.
1996 Apr.
1996 May
1996 June
1 Apr. 1996 1 2 3 4 2 May 1996 1 2 3 4 3 June 1996 1 2 3 4 4 July 1996 1 2 3 4 Rotation Group Adjustment 4 2 4/3 1 4/3 2 4
The reference month and interview month weights for each rotation group are designed to represent a quarter of the population at the month of reference or interview, respectively. The weights for each rotation group can be inflated to represent the full population. For every month, the inflation adjustment equals four divided by the number of rotation groups available. For example, the adjustment for October 1990 is 4/1 because there is only one rotation group in this month. For January 1991, the adjustment factor is 1 because all four rotation groups are available for this month. Users are strongly encouraged to use the full sample of all four rotation groups whenever possible. The core wave files are designed to support analysis using the full sample of all four rotation groups (discussed below). While the weights can be modified to compensate for a smaller sample, estimates based on a subset of rotation groups will be less reliable than those based on the full sample.
Calendar Month and Quarterly Estimation: Using Two or More Core Wave Files
Combining data from two or more core wave files can increase the data available for making estimates for calendar months or continuations of calendar months such as quarters of the year. As an example, Table 8-7 shows the effects of cumulating calendar month data across two waves: Waves 1 and 2 of the 1991 Panel. By combining Waves 1 and 2, there are now four rotation groups for calendar month estimations from January through April 1991. To calculate
USING SAMPLING WEIGHTS ON SIPP FILES
Throughout this chapter, pre-1996 variable names appear in parentheses following 1996 variable names. 8-15
Table 8-7. Calendar Month Estimation: Using Two Core Wave Files from Waves 1 and 2 of the 1991 and 1996 Panels
Reference Months Rotation Group
Interview Month
1990 Oct.
1990 Nov.
1990 Dec.
1991 Jan.
1991 Feb.
1991 Mar.
1991 Apr.
Wave 1, 1991 Panel 2 February 1 2 3 4 3 March 1 2 3 4 4 April 1 2 3 4 1 May 1 2 3 4
Wave 2, 1991 Panela 2 June 1 2 3 3 July 1 2 4 August 1 1 September Rotation Group Adjustment 4 2 4/3 1 1 1 1
Reference Months Rotation Group
Interview
Month 1995 Dec.
1996 Jan.
1996 Feb.
1996 Mar.
1996 Apr.
1996 May
1996 June
Wave 1, 1996 Panel 1 Apr. 1996 1 2 3 4 2 May 1 2 3 4 3 June 1 2 3 4 4 July 1 2 3 4
Wave 2, 1996 Panela 1 August 1 2 3 2 September 1 2 3 October 1 3 November Rotation Group Adjustment 4 2 4/3 1 1 1 1 a Not all data from Wave 2 are shown in the table.
calendar month estimates for each of those months, the user can simply select the person-month records for the month of interest from a file that pools records from Waves 1 and 2 and apply the WPFINWGT (FNLWGT) associated with each record to obtain the full sample estimate. Quarterly estimates in the form of average month estimates also can be computed based on a combined file. For example, to calculate the percentage of people receiving food stamps in the first quarter of 1991, users can obtain the weighted number of people receiving food stamps and the weighted number of the total population in each month of the quarter. Then the percentage of people receiving food stamps is the sum across months of the weighted number of people receiving food stamps divided by the sum of the weighted number of total population in the quarter. In deriving quarterly estimates, or estimates for any time interval, from data in the core wave files, users need to include all four rotation groups in each month of the estimation.
SIPP USERS’ GUIDE
Throughout this chapter, pre-1996 variable names appear in parentheses following 1996 variable names. 8-16
The quarterly estimates derived by this method are cross-sectional estimates, based on the samples in each month of the quarter. When working with panels prior to 1996, users interested in extracting longitudinal characteristics (e.g., the percentage of people receiving food stamps for all 3 months, or in any of the 3 months, of the quarter) are encouraged to use the full panel file. Prior to the 1996 Panel, the editing and imputation procedures used for the core wave files could introduce artificially high rates of month-to-month transitions. With the introduction of CAI in the 1996 Panel, the use of core wave files for that kind of estimation problem is expected to be much less problematic because CAI should provide more complete and accurate data.
Using Weights in the Topical Module Files
The topical module files contain one weight variable—WPFINWGT (FINALWGT). For the 1996 Panel, this weight is the person cross-sectional weight for the fourth reference month. Prior to 1996, this weight was the person interview month weight for people who provided data for a topical module. It shows the number of people in the population represented by the sample person in the interview month. The sample weights on the topical module files are defined in the same manner as the sample weights on the core wave files. The WPFINWGT (FINALWGT) for each rotation group is defined to represent a quarter of the population at the interview month. When all four rotation groups are used, the interview month weight for the full sample represents the population estimate averaged over the 4 months of interviewing per wave.
Using Weights in the Full Panel File
The weight variables in the full panel file are the calendar year weights, WPFINWGT (FNLWGT), and the full panel weight (PNLWGT). The number of calendar year weights on the file depends on the duration of the panel. Most panels before the 1996 Panel have two calendar year weights. The exceptions are the 1989 Panel, which has one calendar year weight—WPFINWGT89 (FNLWGT89)—and the 1992 Panel, which has three calendar year weights—WPFINWGT92 (FNLWGT92), WPFINWGT93 (FNLWGT93), and WPFINWGT94 (FNLWGT94). When the 1996 full panel file is complete, it will have four calendar year weights. The weight variables are defined for sample persons who are in the sample for different periods of time. The calendar year weights apply to sample persons who had interviews covering the control date of the corresponding calendar year and who have complete data (either reported or imputed) for every month of the year (excluding months of ineligibility). The panel weight applies to sample persons who are in the sample in Wave 1 of the panel and who have complete data (either reported or imputed) for every month of a panel (excluding months of ineligibility). People are assigned calendar year weights equal to zero when they do not have interviews covering the control date, have missing data for one or more months of the year, or both.
USING SAMPLING WEIGHTS ON SIPP FILES
Throughout this chapter, pre-1996 variable names appear in parentheses following 1996 variable names. 8-17
Similarly, people are assigned panel weights equal to zero if they were not in sample in Wave 1, have missing data for one or more months of the panel, or both. The population of inference for each of these weights is the population of survivors of the January (or Wave 1, depending on the weight) population. Infants born after the beginning of the panel are assigned a PNLWGT of zero. Similarly, infants born after the control date are assigned a calendar year weight of zero for that year. This weighting can have important implications for those studying young children when infants are a sizable fraction of the population. For example, the WIC program serves children under 5 years of age. Infants in their first year constitute 20 percent of that population. The SIPP full panel file contains records for every person who was ever part of a responding SIPP household. There is one record for each such person, excluding people who may have been in the sample for only 1 month. The first number in PP-EENTAID (PP-ENTRY) and in PP-EPPPNUM (PP-NUM) indicate the wave in which the person entered the sample. Each record contains month-by-month data collected at every wave. However, records with incomplete data for a given period (year or full period of the panel) are assigned weights of zero. As discussed in Chapter 4, beginning with the 1991 Panel, a new imputation procedure was put into place to allow more people to have positive weights in the full panel files. All people with one or more missing waves, each of which was bounded on both sides by interviewed waves, have their data imputed for the bounded missing waves. With this procedure, a significant portion of the panel nonrespondent records became usable records for longitudinal analysis. Beginning with the 1996 Panel, people with two consecutive missing waves can have their data imputed for those waves if they are bounded by interviewed waves. The variables PPID (PP-ID), PP-EENTAID (PP-ENTRY), and PP-EPPPNUM (PP-PNUM) identify people in the full panel files (Chapter 12). Table 8-8 provides examples of the weights in the 1990 full panel file. The 1990 Panel provides three weights: WPFINWGT (FNLWGT90), WPFINWGT91 (FNLWGT91), and PNLWGT. The person on the first row is a complete panel member, with all three weights greater than zero. The second person has positive calendar year weights but zero PNLWGT, which probably indicates that this person provided data for the first 2 calendar years but left before Wave 8. The third person had complete (reported or imputed) data for the first calendar year, but probably left before the end of the second calendar year. The fourth person entered the panel at Wave 4 and probably remained in sample until the end of the panel. He was eligible for only a calendar year 2 weight. The last person entered at Wave 7 and was assigned a weight of zero for all three weights on the panel file (however, this person would have had reference month and interview month weights on the Wave 7 and 8 core files).
Table 8-8. Calendar Year and Panel Weights, 1990-1993
Throughout this chapter, pre-1996 variable names appear in parentheses following 1996 variable names. 8-18
Calendar Year Estimation: Using the Full Panel File
Although the SIPP collects most core content with monthly resolution, users may need to construct calendar year estimates of quantities such as total annual income. One way to construct such estimates is to work with the full panel files, extracting those records with positive calendar year weights. For example, to estimate average annual wages in 1991 for people over age 25 on January 1, 1991, one could identify records from the 1990 Panel with positive values on the calendar year weight FNLWGT91. The annual income amount for each sample person is the sum of the amounts received during each month of the calendar year. The aggregate income estimates for the population can be derived by multiplying each person’s annual income by FNLWGT91 and summing the products across all people. An estimate of average income is this weighted total income divided by the sum of the weights (summed across the same subsample of the population).6 Annual estimates computed with this method are based on monthly data from the same person collected at three or four points in time (depending on the rotation group of the respondent). The shorter recall period used by SIPP is generally believed to provide estimates of annual measures with less nonsampling error than other surveys that collect annual income measured only once during a year. Chapter 6 and the SIPP Quality Profile, 3rd Ed. (U.S. Census Bureau, 1998a), provide a more detailed discussion of nonsampling error in SIPP.
Spell Estimation: Using the Full Panel File
Analysis of SIPP data that takes full advantage of the longitudinal nature of the survey can take a number of forms. In studies of the dynamics of household composition, labor force activity, and welfare recipiency, analysts have applied a set of methods that fall under the general headings of survival analysis (see Kalbfleisch and Prentice, 1980) and event-history analysis (see Tuma and Hannan, 1984). Among many other topics, researchers have studied the length of time that a woman remains single, a person remains unemployed, or a person receives food stamps before marrying, getting a job, or moving off the Food Stamp program. A spell of being single, unemployed, or receiving food stamps is a period of time during which a person’s status did not change, and it is the duration of those spells that is often of interest. In these studies, the unit of analysis is the spell. A file of spells is built from the person records in the full panel file, scanning across months to find a transition into and out of the state of interest. An example of the approach is provided by Shea (1995b). She constructed spells from the records of people with positive full panel weights (PNLWGT greater than zero), restricting her
6 For purposes of exposition, this discussion has neglected the complication that not all persons with positive calendar year weights will have 12 months of data. For example, any person who was in the population January 1 but who spent at least 1 month during that year in an institution would have fewer than 12 months of data. If that person had complete data for the months when he or she was not in the institution, the person would have a positive value for FNLWGT91. This issue is particularly pertinent for studies of the elderly, since a noneligible portion of that population spend some time in a nursing home or some other type of extended care facility.
USING SAMPLING WEIGHTS ON SIPP FILES
Throughout this chapter, pre-1996 variable names appear in parentheses following 1996 variable names. 8-19
analysis to spells starting after the beginning of the panel, as is commonly done. Methods have been proposed that allow for the use of spells in progress at the start of the panel when the beginning dates of those spells are known (see Guo, 1993). An alternative approach is to use all people in the full panel file. Spells can be constructed whenever a transition into the state of interest is observed (e.g., the birth of a child to a single woman). There are three possible outcomes that might be of interest: (1) a transition out of “single parenthood” is observed when the woman marries; (2) the spell is right-censored because the woman is lost through attrition from the sample before the end of the panel and before she marries; and (3) the spell is right-censored because the panel ends before she marries. If modeled in that way, the appropriate weight would be the woman’s calendar month weight associated with the month that the spell of single parenthood began. Calendar month weights are not on the full panel file, but can be merged into that file from the appropriate core wave files. During the course of a SIPP panel, some panel members can experience multiple spells (e.g., of participation in a given program). There are two approaches to handling this situation: (1) select only the first spells that started during the life of the panel (Ruggles and Williams, 1989), or (2) use all spells starting during the life of the panel (Kalton et al., 1992). The length of spells that can be fully observed depends on the duration of a panel. SIPP panels before 1991 were designed to last 32 months. However, several panels were shorter because of budget constraints. The 1992 Panel lasted 36 months. The 1996 Panel has 48 months of data. A note for users of spell analysis is that, in SIPP, as in other panel surveys, people tend to report a change in recipiency more often between waves than within waves (the seam effect). This suggests that it may not be possible to pinpoint changes to a specific month. More detailed discussions of the seam effect are provided in Chapter 6 and in the SIPP Quality Profile, 3rd Ed. (U.S. Census Bureau, 1998a).
Pooling Data from Two or Three Panels
Prior to the 1996 Panel, the SIPP design employed overlapping panels so that two or three panels could be in progress at a given time. Thus, users can pool data from two or three panels in order to produce larger samples, and hence more precise estimates, for a given time. Table 8-9 illustrates the wave overlap for the 1984 through 1993 Panels. One can see that Wave 7 of the 1984 Panel and Wave 3 of the 1985 Panel both cover the same period. Some overlapping waves do not cover exactly the same period. For example, Wave 6 of the 1984 Panel covers one more month than does Wave 2 of the 1985 Panel, a short wave. Users are not encouraged to pool data from Wave 1 with data from any other wave. Differences in interviewing procedures, question wording, and interviewer experience between Wave 1 and other waves call into question the comparability of Wave 1 responses relative to responses at other waves. In general, when pooling data from multiple panels, users should be sensitive to the
SIPP USERS’ GUIDE
Throughout this chapter, pre-1996 variable names appear in parentheses following 1996 variable names. 8-20
potential impact of differences in questionnaire items, time- in-sample effects, and other nonsampling errors. Analysts can obtain combined panel estimates using one of two methods: • Combine data from two or more panels and then produce estimates. • Combine estimates derived separately from each panel. When combining data from successive panels, users need to adjust the weights; otherwise, the weights may sum to twice the U.S. population total. One simple procedure is to reduce the weights in each sample in proportion to the number of interviews. To combine data from two successive panels, i and i+1, multiply the weights in panel i by the factor
1=+=
ii
ii II
IW
(8-1)
where I = interviews. Likewise, multiply the weights in panel i+1 by
)1(1 ii WW −=+ (8-2) If either panel contributes data from less than four rotations, the analyst must multiply the weights in the short panel by a factor equal to four divided by the number of rotations contributing data. Use formulas 8-1 and 8-2 for any two overlapping panels, including the scenario in which three panels overlap but the interest is in only two panels. For three overlapping pane ls, Wi, Wi+1, and Wi+2 can be computed in much the same way:
)( 21 ++ ++=
iii
ii III
IW
(8-3)
)( 21
11
++
++ ++
=iii
ii III
IW
(8-4) and
Wi+2 = 1 – Wi – Wi+1 (8-5) Use weighting factors also to combine separate estimates from overlapping panels,
11 +++= iiii XWXWX (8-6)
USING SAMPLING WEIGHTS ON SIPP FILES
Throughout this chapter, pre-1996 variable names appear in parentheses following 1996 variable names. 8-21
where X = joint estimate (total, mean, proportion, etc.), Xi = estimate from earlier panel, and Xi+1 = estimate from later panel. For example, there were 15,061 interviews in Wave 6 of the 1984 Panel and 9,928 interviews in Wave 2 of the 1985 Panel. Thus, the weighting factor for records in Wave 6 of the 1984 Panel is
Wi = 0.6027 and the weighting factor for Wave 2 of the 1985 Panel is
Wi+1 = 0.3973 Wave 6 of the 1984 Panel contributes 4 rotations to the pooled data, so the weight adjustment for records in Wave 6 is Wi. Wave 2 of the 1985 Panel, however, contributes only three rotations to the pooled data. Thus, the weight adjustment for records in Wave 2 is
5297.03
41 =+iW
Analysts interested in monthly estimates can pool data from multiple waves in each panel to avoid missing rotations. We computed the weighting factors in Table 8-9 using the formulas given in (8-1), (8-3), and (8-4). These weighting factors are most appropriate for combining topical module data from successive panels. Weighting factors for combined panel monthly and quarterly estimates may differ, particularly when short waves are involved.
SIPP USERS’ GUIDE
Throughout this chapter, pre-1996 variable names appear in parentheses following 1996 variable names. 8-22
Table 8-9. Weighting Parameter Adjustment Factors for Both the Two-Panel and Three-Panel Combinations * Panel Weighting factors
for combining waves from two panels. Wi
Weighting factors for combining waves from three panels. Wi, Wi+1
Throughout this chapter, pre-1996 variable names appear in parentheses following 1996 variable names. 8-23
9 a Short wave. Approximately 3/4 of sample households interviewed over 3 months.. b Wave does not cover exactly same period as wave from later panel. c Weighting factor involves short wave. * Weighting factors for combining Wave 1 with other waves are not provided.
Section II
When text copy applies to both 1996 and pre-1996 panel files, pre-1996 variable names appear in parenthesesfollowing 1996 variable names.
9-1
9.9.9.9. The SIPP Public Use FilesThe SIPP Public Use FilesThe SIPP Public Use FilesThe SIPP Public Use Files
Section I of the Users� Guide is written primarily for researchers who need information to guidetheir use of data from the Survey of Income and Program Participation (SIPP). It describes thedesign and content of SIPP and the processing of SIPP data by the Census Bureau. It alsodiscusses weighting, sampling error, and nonsampling error.
Section II addresses the mechanics of using the SIPP public use files. The chapters in this sectionare written for the analyst needing guidance on how to accomplish a variety of common tasks.This section contains minimal discussion of underlying concepts (such as the relationshipbetween waves, rotation groups, and reference months), which are examined in Section I.
There are five chapters in Section II: this chapter provides a general introduction to the publicuse files; one chapter is devoted to each of the three types of SIPP data files, and a final chapterdiscusses merging multiple SIPP data files. After reading the current chapter, the user workingwith just one type of SIPP data file may wish to turn to the chapter on that type of file. For the1996 Panel, most variable names changed from those of previous panels. To aid users workingwith files from panels prior to 1996, the chapters in Section II present both the pre- and post-1996 Panel variable names when the text applies to both 1996 and pre-1996 panel files (when the1996 Panel names are available). In the main body of the text, the pre-1996 Panel names arepresented in parentheses following those from the 1996 Panel. For example, the sample unit IDvariable name in the core wave files, which is �SSUID� in the 1996 Panel, was SUID in previouspanels. The variable name is written in this chapter as SSUID (SUID). In tables, a variety ofmethods are used to present both sets of names.
The balance of this chapter provides an overview of the chapters that follow. Those chaptersoffer more detailed discussions, complete with specific examples and samples of programmingcode. This introduction highlights points that are common to all SIPP data files. It also highlightsimportant differences.
Types of SIPP Data FilesTypes of SIPP Data FilesTypes of SIPP Data FilesTypes of SIPP Data Files
There are three types of public use files containing SIPP data: core wave files, topical modulefiles, and full panel longitudinal research files (referred to as either longitudinal files or full panelfiles):
! Core wave files are currently issued in person-month format. These files contain up to fourrecords for each primary sample member and each person who lived with a primary sample
When text copy applies to both 1996 and pre-1996 panel files, pre-1996 variable names appear in parenthesesfollowing 1996 variable names.
9-2
member at any time during the 4-month reference period covered by the wave. Each of therecords contains data from one of the four reference months covered by the wave.1
! Topical module files for the 1996 Panel contain one record for each person who was asample responding (or Type Z nonresponding) member of a SIPP household during thefourth month of the reference period for the wave. Topical module files from earlier panelscontain one record for each primary sample member and each person who lived with aprimary sample member at the time of the interview for the wave in which the topical modulewas administered.
! Full panel longitudinal research files contain one record for each primary sample memberand for each person who ever lived with a primary sample member at any time during theSIPP panel�a period of up to 4 years.
Understanding the ID Variables in SIPPUnderstanding the ID Variables in SIPPUnderstanding the ID Variables in SIPPUnderstanding the ID Variables in SIPP
Because different files contain different information, the capacity to identify people across thosefiles is important. SIPP is a longitudinal survey designed to allow researchers to track peopleover time; other critical functions include identifying individuals over time and identifying whena person is present in the sample. Finally, because the relationships among people change overtime, identification of those relationships at any specific time is important. The key to these taskslies in understanding how SIPP ID variables are used to identify persons, families, andhouseholds.2
The most basic ID variables in SIPP have different variable names in the different types of publicuse files issued by the Census Bureau. Table 9-1 displays those variables and shows the namesthey are given in the different files.
Sample Unit IDsSample Unit IDsSample Unit IDsSample Unit IDs
When initial Wave 1 interviews are conducted, each physical dwelling unit is assigned a unique(random) sample unit ID.3 The sample unit ID assigned to a person never changes: in all
1 Prior to the 1990 Panel, core wave files were issued with a single record for each person. Each record containeddata for all four of the reference months covered by the wave. The structure of the file was similar to thelongitudinal files issued by the Census Bureau. Earlier editions of this Users� Guide provide details.2 Other variables are used to identify people who are members of related subfamilies, unrelated subfamilies (alsoknown as secondary families), and transfer program units such as food stamp units.3 The sample unit ID is a random recode of three other variables in the Census Bureau internal files: therespondent�s sampling area, the cluster of housing units within that area (called a segment), and a sequentiallyassigned serial number. Because the variables in the Census Bureau�s internal files contain detailed informationabout the location of the dwelling unit, those variables are suppressed in the public use files to protect theconfidentiality of survey respondents.
THE SIPP PUBLIC USE FILESTHE SIPP PUBLIC USE FILESTHE SIPP PUBLIC USE FILESTHE SIPP PUBLIC USE FILES
When text copy applies to both 1996 and pre-1996 panel files, pre-1996 variable names appear in parenthesesfollowing 1996 variable names.
9-3
Table 9-1. SIPP Variable Names, by File Type
File Type Sample Unit ID Current Address ID Entry Address ID Person NumberPanels Prior to the 1996 Panel
Full Panel (and Partial-Panel) LongitudinalResearch Files
File not yet available. Current plans call for using the same ID variable names in all filesfrom the 1996 Panel.
subsequent interviews, the Wave 1 primary sample persons carry their sample unit IDs withthem. This means that if they move to different addresses, they keep the same sample unit IDs. Ifnew people join those original sample members at their original addresses, they becomesecondary sample members by virtue of their association with the primary sample person withwhom they are living. Secondary sample persons are all assigned the sample unit ID of theprimary sample member with whom they are living. At the conclusion of the panel, all peoplewho have ever lived with a member of a given original sample unit share the same sample unitID. That sample unit ID is their common link to the original sample unit.
Current Address IDsCurrent Address IDsCurrent Address IDsCurrent Address IDs
The current address ID identifies each housing unit occupied by one or more original samplemembers in any given month.4 Current address IDs are assigned within sample units (they areunique only when combined with the sample unit ID variable), and they have two parts. The firstpart (one digit for all but the 1992 and 1996 Panels, two digits for the 1992 and 1996 Panels)identifies the wave in which one or more original sample members were first scheduled to beinterviewed at the address. The second part of the ID is one digit, and it is used to sequentiallynumber addresses for households that split into two or more households as a result of a move to adifferent location by original sample persons. All Wave 1 households have a current address IDof 11. Any new addresses that are occupied in Wave 2 are numbered 21, 22, and so on; newaddresses occupied during the Wave 3 reference period are numbered 31, 32, 33, and so on. The
4 A house, an apartment or other group of rooms, or a single room is regarded as a housing unit if it is occupied orintended for occupancy as separate living quarters.
The entry address ID is the current address ID that a sample member occupied when he or shefirst entered the SIPP sample. It is used in conjunction with the person number to uniquelyidentify persons within the sample unit and does not change even if the person moves.
Person NumbersPerson NumbersPerson NumbersPerson Numbers
All primary and secondary sample members are assigned a person number when they first enterthe SIPP panel. Those numbers are assigned sequentially, within each wave and within eachhousehold (current address). The first part of the person number (two digits for the 1992 and1996 Panels, one digit for all others) indicates the wave in which the person originally enteredthe sample. Thus, primary sample persons have person numbers in the 100 series, beginning with101; secondary sample members have person numbers beginning with 201 if they enter thesample in Wave 2, 301 if they enter the sample in Wave 3, 401 if they enter the sample in Wave4, and so on.
Identifying Persons and Their RelationshipsIdentifying Persons and Their RelationshipsIdentifying Persons and Their RelationshipsIdentifying Persons and Their Relationships
Each person in SIPP can be uniquely identified by the combination of a sample unit ID, an entryaddress ID,5 and a person number. These ID variables are useful when linking the records for asingle person across multiple SIPP data files. They also contain substantive information that maybe useful in some situations.
Using the Monthly Interview Status VariableUsing the Monthly Interview Status VariableUsing the Monthly Interview Status VariableUsing the Monthly Interview Status Variable
The monthly interview status variable helps determine whether the data for a person in a givenmonth should be used. This variable is labeled PP-MIS in the pre-1996 longitudinal files, in the(older) person-record-format core wave files, and in older topical module files. It is labeled
5 For the 1996 Panel, the entry address is not necessary to uniquely identify individuals in SIPP. Its continued usewill not create any problems; it just provides additional information.
THE SIPP PUBLIC USE FILESTHE SIPP PUBLIC USE FILESTHE SIPP PUBLIC USE FILESTHE SIPP PUBLIC USE FILES
When text copy applies to both 1996 and pre-1996 panel files, pre-1996 variable names appear in parenthesesfollowing 1996 variable names.
9-5
PPMIS in newer pre-1996 topical module files.6 This variable has three possible values: 0, 1,and 2. When using the older person-record-format core wave files, the topical module files forpanels prior to 1996, and the longitudinal files, analysts need to understand that the monthlyinterview status is the only reliable guide as to whether the data for a given person should beused in a given month. Analysts should use data for only those months in which a person�sinterview status is equal to 1. Any data present for months when a person�s interview status iscoded either 0 or 2 should be ignored. A code of 0 indicates that the person was not in the samplefor that month, and a code of 2 indicates a noninterview for that month.7
When working with other data sources, analysts often identify which cases will be used in ananalysis by examining either the weight variable or the variables used in the analysis itself. In thefirst case, the rule is generally to use all cases with positive weights and ignore the rest. In thesecond case, the rule is generally to use all cases with nonmissing data. Each of those rules canlead the SIPP user astray, as illustrated below.
The presence of a zero weight is not a reliable guide to whether a person should be excludedfrom the planned analysis. Although those people will not enter into any weighted tabulations,they may provide important contextual information about people who do enter into those(weighted) tabulations. For example, a person with a calendar year weight of zero who is amember of the same household as a positive-weight person for only 3 months providesinformation about the positive-weighted person�s household (including, for example, householdsize, composition, income, and program participation) for the 3-month period that he or she wasa household member. It is for this reason that records for zero-weighted persons are retained inthe SIPP data files.8
The presence of data in analysis fields for any given month is also not a reliable guide to whetherthe person should be included in the planned analyses. Data are collected for all months of thereference period for a given wave, even if the interviewed person was in the sample for only partof the reference period. For example, on the topical module and longitudinal files for panels priorto 1996, 4 months� worth of data will generally be present for a person who was a member of aSIPP household for only the last 2 months of the wave. However, only those last 2 months ofdata should be used.9
6 The person-month-format core wave files contain records only for those months that a person has an interviewstatus code of 1. The monthly interview status variable is not included in those files because it is not needed. Thetopical module files for the 1996 Panel contain records only for those with an interview status code of 1 in the fourthmonth of the wave�s core reference period. Although the interview status variable is included on the topical modulefiles from the 1996 Panel, it need not be used with them.7 For those months when a noninterviewed person was both in scope for the survey and had data imputed (thisincludes the Type Z imputations and the missing wave imputations), the variable is set to 1. In those cases, the datacan be used in the same manner as any of the other imputed data in the SIPP public use files.8 Other important situations also arise. For example, infants are assigned a calendar year weight of zero for the yearof their birth even though they have an interview status of 1 from their birth month forward. Also, a person who diesduring the year will have a positive calendar year weight even though, past the month of death, he or she will havean interview status of 0 or 2. In neither case does the weight variable reflect the presence or absence of the person,or data associated with the person.9 The person-month-format core wave files will have only two records for that person. The topical module files forthe 1996 Panel will have information only about month 4 of the wave�s core reference period.
A household, as the term is used in Census Bureau publications, consists of all people whooccupy a housing unit, regardless of their relationships to each other.10 For many purposes, ahousehold can be thought of as people living at a common address. A person�s current addressID in any given month, together with his or her sample unit ID, identifies the household in whichthat person is a member for that month. Members of the same household in a given monthalways have an interview status of 1 and share the same sample unit ID and current address ID.Figure 2-1 (pp. 2-10�2-14) provides an illustration of changes in houshold composition.
Determining Monthly Family CompositionDetermining Monthly Family CompositionDetermining Monthly Family CompositionDetermining Monthly Family Composition
The term family, as used in Census Bureau publications, refers to a group of two or more peoplerelated by birth, marriage, or adoption who reside together; all such people are consideredmembers of one family. For example, if the son of the person who maintains the household andthe son�s wife are members of the household, they are treated as members of the parent�s family.Every family must include a reference person. Two or more people living in the same householdwho are related to each other but not to the household reference person form an unrelatedsubfamily (also referred to as secondary families).
The labels primary individual and secondary individual as used by the Census Bureau refer topeople in households who are not related to any other household members. For many purposes,they can be thought of as one-person families, and the Census Bureau sometimes refers to themas pseudo-families.
Methods for identifying the interrelationships among the household members that define thesegroups vary, depending on the data file being used. The topical module files do not contain anyof the information needed to directly identify the different types of families.11 When it isnecessary to identify family membership in an analysis that uses information from a topicalmodule, it is also necessary to merge data from the topical module file with either a core wavefile or a longitudinal file. Procedures for merging files are discussed in Chapter 13.
Identifying family membership is easiest when working with the person-month-format core wavefiles. The Census Bureau has two principal methods for distinguishing families.
! The first method defines a family as all persons who are related and living together. Thefamily ID variable RFID is used with this definition. RFID groups the household referenceperson with all related household members by assigning them the same ID number. Thisfamily group corresponds to the Census Bureau�s definition of a primary family. RFID
10 The one exception to this definition is people living in group quarters.11 The one exception is the Wave 2 topical module, which collects detailed information about all of the relationshipsamong all of the people who are household members at the time of the Wave 2 interview.
THE SIPP PUBLIC USE FILESTHE SIPP PUBLIC USE FILESTHE SIPP PUBLIC USE FILESTHE SIPP PUBLIC USE FILES
When text copy applies to both 1996 and pre-1996 panel files, pre-1996 variable names appear in parenthesesfollowing 1996 variable names.
9-7
groups members of each unrelated subfamily (and primary and secondary individuals)separately.
! The second method is similar to the first in defining a family, but the family excludesmembers of related subfamilies. The family ID variable RFID2 is used with this definition.RFID2 equals zero for members of related subfamilies. RFID2 groups members of eachunrelated subfamily (and primary and secondary individuals) in the same way as RFID�each group has a unique number.
Analysts who want to analyze multigenerational families would use RFID2 (FID2) and thevariable RSID (SID). RSID (SID) treats related subfamilies as distinct family units by assigningmembers of related subfamilies nonzero values. Analysts can easily distinguish unrelatedsubfamilies from other family units when they use these variables and numbering schemes.
Chapter 10 discusses the use of these variables in greater detail. More work is involved whenusing the longitudinal files or the (older) person-record-format core wave files. When workingwith those files, analysts must create a unique family ID from several components. A number ofdifferent strategies can be used, one of which is described in Chapter 12. Other approaches aredescribed in earlier editions of this Guide.
Determining Monthly Transfer Program Unit CompositionDetermining Monthly Transfer Program Unit CompositionDetermining Monthly Transfer Program Unit CompositionDetermining Monthly Transfer Program Unit Composition
Some analyses involve summarizing data for units other than households or families. The SIPPcore data contain sufficient information to identify program units for participants in a range oftransfer programs, including Medicare; Medicaid; Aid to Families with Dependent Children(AFDC); Temporary Assistance for Needy Families (TANF);12 General Assistance (GA);Railroad Retirement; Social Security; Veterans Compensation and Pensions; Food Stamps; andthe Women, Infants, and Children nutrition program (WIC).
The SIPP data contain fields for each adult and child, indicating whether the individual receivedbenefits (either directly or by virtue of his or her relationship to another person designated as theprincipal recipient) from each of these programs in each month. The SIPP data also containinformation that permits identification of program units within households. One person in eachprogram unit is identified as a principal recipient, and variables identifying that principalrecipient are included on the records of the people who are part of the program unit. People whoare members of a common program unit in a given month can then be identified as those who are
12 In August 1996, the Personal Responsibility and Work Opportunity Reconciliation Act was signed into law. Thislegislation replaced the old welfare system, Aid to Families with Dependent Children (AFDC), with a new program,Temporary Assistance for Needy Families (TANF). In the 1996 Panel, the questions for income type 20 referred tothe AFDC program prior to Wave 4 and to the TANF program beginning in Wave 4. In Wave 9, the questions wereexpanded somewhat to capture the larger array of program types that could exist under TANF.
When text copy applies to both 1996 and pre-1996 panel files, pre-1996 variable names appear in parenthesesfollowing 1996 variable names.
9-8
in the sample in that month (interview status = 1) with common values of:
! The sample unit ID,
! The current address ID, and
! The primary recipient ID.
Constructing Household, Family, and Program Unit LevelConstructing Household, Family, and Program Unit LevelConstructing Household, Family, and Program Unit LevelConstructing Household, Family, and Program Unit LevelVariablesVariablesVariablesVariables
The public use files contain selected characteristics of monthly households and families that canbe used directly in planned analyses. Data needs may require analysts to construct characteristicsof households, families, or program units that do not already exist on the public use files createdby the Census Bureau. Analysts can use the monthly ID variables described in the precedingsection to construct monthly characteristics from the public use files.
Because SIPP uses a sample design in which different households (and people) are sampled atdifferent rates, weights generally must be used when the user desires (approximately) unbiasedestimates of population characteristics. In general, the appropriate weight to use for an analysiscan be identified by answering two questions:
1. Which (sub)sample of SIPP is the estimate based on?
2. What population does the sample represent?
Weights for each of the calendar months covered by a panel can be found on the core wave files.A single weight appears on the topical module files. Before 1996, the interview month was afrequent reference period for topical module questions, and the weight on the pre-1996 topicalmodule files is the person interview month weight for people who provided data for a topicalmodule. But, as noted earlier, starting with the 1996 Panel the interview month is no longer usedas a reference month; the weight on the topical module file for the 1996 Panel is the personcross-sectional weight for the fourth reference month. Weights for estimates that refer to acalendar year�or, more accurately, the January population as it appears through the balance ofthe calendar year�are on the longitudinal files.13
Chapter 8 provides detailed information about SIPP weights and how to use them. 13 The calendar year weights are based on all sample members who are present in January and interviewed (orimputed) for every month of the year that they were �in scope� for the survey. In other words, the weights includepeople who died during the year if they were interviewed until they died, but they do not include people who left thesample during the year. Because they are not members of the population on January 1, infants receive a calendarweight of zero for the year in which they are born.
THE SIPP PUBLIC USE FILESTHE SIPP PUBLIC USE FILESTHE SIPP PUBLIC USE FILESTHE SIPP PUBLIC USE FILES
When text copy applies to both 1996 and pre-1996 panel files, pre-1996 variable names appear in parenthesesfollowing 1996 variable names.
9-9
Working with Multiple FilesWorking with Multiple FilesWorking with Multiple FilesWorking with Multiple Files
There are a number of reasons that SIPP users commonly use data from more than one file:
1. The overlapping-wave/rotation-group structure of the survey creates many situations inwhich data for a single calendar reference month are contained on two different core wavefiles.
2. The overlapping-panel structure of the pre-1996 SIPP created many situations in which datacovering a single calendar year could be found on data files from two or sometimes threedifferent panels.14
3. There are many research problems in which reference to a specific calendar date is notcrucial and a desire for increased sample size can lead to the use of data from multiple panels(or waves) that do not overlap.
4. Many analyses of data collected in the SIPP topical modules entail merging topical moduledata with files containing core data (the core wave files or the longitudinal research files).
5. Since the release of a longitudinal file cannot occur until after the final interview of the finalwave of a panel, researchers requiring longitudinal data from more than one wave prior to therelease of the longitudinal file must create their own linked data files from the available corewave files. As of this writing, longitudinal files are available for all but the 1996 SIPP Panel,so this procedure pertains primarily to users of data from the 1996 Panel.
Chapter 13 discusses each of these situations and describes procedures for using data frommultiple files to construct estimates.
The Balance of Section IIThe Balance of Section IIThe Balance of Section IIThe Balance of Section II
The balance of Section II is organized as follows:
! Chapter 10 describes how to use the core wave files.
! Chapter 11 describes how to use the topical module files.
! Chapter 12 describes how to use the full panel longitudinal research files.
! Chapter 13 describes how to link the different file types.
Because many users work with only a single type of file, Chapters 10, 11, and 12 are written sothat they stand alone: each chapter can be used independently, without reference to the other twochapters. Differences across the three file types in their structure and in names for common
14 Chapter 2 discusses the overlapping wave and panel structure of SIPP.
When text copy applies to both 1996 and pre-1996 panel files, pre-1996 variable names appear in parenthesesfollowing 1996 variable names.
9-10
variables make this a natural way to organize the material presented here. The advantage of thisorganization is that an analyst working with only a single type of file will find a completediscussion of that file type in a single chapter.
However, there is substantial overlap in the types of things that analysts will be called upon to dowith each of the file types. Thus, many ideas are repeated across the three chapters. Crucialdifferences do exist among the chapters, however. Those differences are found in the variablenames used to accomplish certain common tasks and in the ways of working with data files builtaround different organizational principles. While the text of a chapter may seem familiar, thereare often important differences in the details.
Table 9-2 summarizes some of the more important differences among the three file types. Table9-2 is intended primarily for users who have already worked with at least one type of SIPP datafile. Analysts new to SIPP should skip the table and proceed to the chapter that discusses the typeof data file with which they are working. When working with a different type of SIPP file,experienced analysts can use Table 9-2 in conjunction with the chapter that discusses that newfile type; the table will help to highlight differences that might otherwise be overlooked in thegeneral discussion.
Table 9-2. Differences Among Core Wave, Topical Module, and Longitudinal Files (1990�1996 Panels)
Topic1996 PanelCore Wave Files
Pre-1996Core Wave Files
1996 Panel TopicalModule Files
Pre-1996 TopicalModule Files
Pre-1996 LongitudinalFiles
File Structure Person-month recordsTable 10-1
Person-month recordsTable 10-1
Person recordsTable 11-1
Person recordsTable 11-1
Person recordsTable 12-2
Data Dictionary Size and begin positionFigure 10-1
Size and begin positionFigure 10-1
Size and beginposition Figure 11-1
Size and begin positionFigure 11-1
1992�1993 Panels Size,begin, field length, andnumber of fields1990�1991 Panels Size,begin, index, and lengthFigure 12-1
Importance ofMonthly InterviewStatus Variables
Not needed on theperson-month files�they contain recordsonly for months inwhich the respondent ispresent and in scope.
On the person-monthfiles: not needed.Person-month filescontain records only formonths in which therespondent�s interviewstatus equals 1.On the older person-record format files: veryimportant. See earliereditions of this Users�Guide for details.
Not needed.Topical module filescontain records onlyfor people for whomEPPMIS4 = 1.
PP-MISVery importantTable 11-2
PP-MISVery importantTable 12-2
How to Identify aPerson
SSUID, EPPPNUM SUID, ENTRY, PNUMTable 10-3
SSUID, EPPPNUMTable 11-6
ID, ENTRY, PNUMTable 11-7
PP-ID, PP-ENTRY, PP-PNUMTable 12-6
How to Identify aHousehold
SSUID, SHHADID SUID, ADDIDTable 10-5
SSUID, SHHADIDTable 11-8
ID, ADDIDTable 11-9
PP-ID, HH-ADDIDTable 12-8
Identification of�Merged Households�
Merged householdscannot be identified infiles from the 1996Panel.
PWSUID, PWENTRY,or PWPNUM > 0
Merged householdscannot be identified infiles from the 1996Panel
PNUM is between ×80and ×99, inclusively, andx varies from 1 to 10.Can identify the persononly after the move;need to go to the corewave file to identify theperson before the move.
PP-PNUM is between ×80and ×99, inclusively, and xvaries from 1 to 10.Can identify the persononly after the move; needto go to the core wave fileto identify the personbefore the move.
(table continues)
When text copy applies to both 1996 and pre-1996 panel files, pre-1996 variable nam
es appear in parenthesesfollow
ing 1996 variable names.
9-11
TH
E S
IPP
PU
BL
IC U
SE
FIL
ES
TH
E S
IPP
PU
BL
IC U
SE
FIL
ES
TH
E S
IPP
PU
BL
IC U
SE
FIL
ES
TH
E S
IPP
PU
BL
IC U
SE
FIL
ES
Table 9-2. Differences Among Core Wave, Topical Module, and Longitudinal Files (1990�1996 Panels) (continued)
Topic1996 PanelCore Wave Files
Pre-1996Core Wave Files
1996 Panel TopicalModule Files
Pre-1996 TopicalModule Files
Pre-1996 LongitudinalFiles
Handling of �MergedHouseholds�
Not Applicable If the move took place afterthe first reference month,there will be two recordsfor each person whose IDinformation changed. Onerecord reflects whathappened before the moveand contains the originalID information. The otherrecord reflects whathappened after the moveand contains the new IDinformation.If the move took place in thefirst reference month, therewill be only one record foreach person whose IDinformation changed. Thatrecord reflects whathappened after the moveand contains the new IDinformation.
Not applicable No matter when themove takes place, therewill be one record foreach person whose IDinformation changed.That record reflects whathappened after the moveand contains the new IDinformation.
No matter when the movetakes place, there will betwo records for each personwhose ID informationchanged. One record reflectswhat happened before themove and contains theoriginal ID information. Theother record reflects whathappened after the moveand contains the new IDinformation.
How to Identify aFamily
SSUID, SHHADID andRFID or RFID2 or RSIDor [RFID2 and RSID)]
(SUID and ADDID) and[FID or FID2 or SID or(FID2 and SID)]Table 10-7
Not in the file Not in the file Create the family IDvariables using PP-ID,HH-ADDID, and FAMTYPTable 12-10
Working with Family-Level IncomeVariables
Variables for the primaryfamily include the relatedsubfamily in them.Separate variables forthe related subfamily.Table 10-9
Variables for the primaryfamily include the relatedsubfamily in them.Separate variables for therelated subfamily.Table 10-10
Not applicable Not applicable Variables for the primaryfamily include the relatedsubfamily in them.No separate variables forthe related subfamily.Table 12-12
When text copy applies to both 1996 and pre-1996 panel files, pre-1996 variable nam
es appear in parenthesesfollow
ing 1996 variable names.
9-12
SIP
P U
SE
RS
’ GU
IDE
SIP
P U
SE
RS
’ GU
IDE
SIP
P U
SE
RS
’ GU
IDE
SIP
P U
SE
RS
’ GU
IDE
Table 9-2. Differences Among Core Wave, Topical Module, and Longitudinal Files (1990�1996 Panels) (continued)
Amounts arelocated in themonthlyarraysG1AMT1 �G1AMT10
When text copy applies to both 1996 and pre-1996 panel files, pre-1996 variable nam
es appear in parentheses
following 1996 variable nam
es9-14
SIP
P U
SE
RS
’ GU
IDE
SIP
P U
SE
RS
’ GU
IDE
SIP
P U
SE
RS
’ GU
IDE
SIP
P U
SE
RS
’ GU
IDE
Table 9-2. Differences Among Core Wave, Topical Module, and Longitudinal Files (1990�1996 Panels) (continued)
Topic1996 Panel CoreWave Files
Pre-1996 Core WaveFiles
1996 Panel TopicalModule Files
Pre-1996 TopicalModule Files
Pre-1996 LongitudinalFiles
Imputed Data:
The whole record isimputed
The corresponding waveof information is imputed
The variable�s value isimputed
If no prior wave data andEPPINTVW = 3, 4
If the correspondingimputation flag indicatesimputation.
Almost all person-levelvariables have imputationflags. There are noimputation flags onhousehold and familyaggregates. Use theperson-level imputationflags of household andfamily members toidentify aggregateamounts that includeimputed values.
If MIS5 = 2 and MISj = 1for j = 1, 2, 3, 4 orINTVW = 3, 4
If the correspondingimputation flag indicatesimputation.
Almost all person-levelvariables have imputationflags. There are noimputation flags onhousehold and familyaggregates. Use theperson-level imputationflags of household andfamily members toidentify aggregateamounts that includeimputed values.
If EPPMISA = 2 orEPPINTVW = 3, 4
If the correspondingimputation flag andcalculation flags indicateimputation.
Most person-levelvariables have imputationflags. There are noimputation flags onhousehold and familyaggregates. Use theperson-level imputationflags of household andfamily members toidentify aggregateamounts that includeimputed values.
If WAVFLG > 0 orINTVW = 3, 4
If the correspondingimputation flag indicatesimputation.
Limited set of imputationflags. There are noimputation flags onhousehold and familyaggregates. Use theperson-level imputationflags of household andfamily members toidentify aggregateamounts that includeimputed values.
Topcoding Yes Yes Yes Yes Yes
How to Identify States TFIPSST HSTATE TFIPSST STATE GEO-STEWeight Variables
Household
FamilySubfamily
Person
WHFNWGT
WFFINWGTWSFINWGT
WPFINWGT
HWGTH5WGT
FWGTSWGT
FNLWGTP5WGT
WPFINWGT FINALWGT FNLWGTyy, where yy isthe calendar yearPNLWGT
Metropolitan Areas TMETROTMSA
HMETRO Not on the file Not on the file Not on the file
When text copy applies to both 1996 and pre-1996 panel files, pre-1996 variable nam
es appear in parenthesesfollow
ing 1996 variable names.
9-15
TH
E S
IPP
PU
BL
IC U
SE
FIL
ES
TH
E S
IPP
PU
BL
IC U
SE
FIL
ES
TH
E S
IPP
PU
BL
IC U
SE
FIL
ES
TH
E S
IPP
PU
BL
IC U
SE
FIL
ES
When text copy applies to both 1996 and pre-1996 panel files, pre-1996 variable names appear in parenthesesfollowing 1996 variable names.
10-1
10. Using the Core Wave Files
This chapter discusses procedures for working with data from the core wave public use data filesof the Survey of Income and Program Participation (SIPP). It describes the documentation thataccompanies the core wave public use files obtained from the Census Bureau. Discussion thenturns to the data files themselves. The data file structure is described, and detailed explanationsare provided about how to use the core wave files when performing common tasks, including(among others):
l Identifying persons, households, families, and program units;
l Understanding the effects of topcoding;
l Using imputation flags; and
l Identifying states and metropolitan areas.
Before reading this chapter, users should read Chapter 9 for an introduction to Section II.Analysts using only one core wave file should also read about the use of sample weights(Chapter 8) and the computation of standard errors (Chapter 7). Those planning on merging datafrom multiple core wave files, from full panel files, or from topical module files should readChapter 11 for information about the topical module files, Chapter 12 for information about thefull panel files, and Chapter 13 for information about linking SIPP public use files.
This chapter focuses on the core wave files. It is written so that it can be used independentlyfrom the chapters describing the topical module files and the full panel files. Although there aremany similarities across the three types of files, important differences do exist. Because thosedifferences are sometimes subtle, users familiar with the topical module and full panel filesshould read this chapter carefully, paying close attention to information about variable namesand file structures. Table 9-2 summarizes the differences among the core wave, topical module,and full panel longitudinal research files.
For the 1996 Panel, most variable names changed from those used in previous panels. To aidusers working with files from panels prior to 1996, this chapter presents both the old and the newvariable names when the text applies to both 1996 and pre-1996 panel files. In the main body ofthe text, the old names are presented in parentheses following the new names. For example, thesample unit ID variable name, which is SSUID in the 1996 Panel, was SUID in previous panels;it is written in this chapter as SSUID (SUID). In tables, a variety of methods are used to presentboth the old and the new names.
SIPP USERS’ GUIDE
When text copy applies to both 1996 and pre-1996 panel files, pre-1996 variable names appear in parenthesesfollowing 1996 variable names.
10-2
Using the Technical Documentation of theCore Wave Files
Each data file received from the Census Bureau has an accompanying set of technicaldocumentation and a data dictionary. The technical documentation includes:
l The item booklet (for the 1996 Panel);
l The paper survey instrument (for panels prior to the 1996 Panel);
l A glossary of selected terms;
l A cross-walk, mapping reference months into calendar months for each rotation group;
l A source and accuracy statement describing the sample weights and the computation ofstandard errors; and
l User Notes.
The survey instrument is vital to understanding what questions were asked, how they were asked,the order in which they were asked, to whom they were asked, and the way in which the answerswere recorded. Some questions employ skip patterns (Chapter 3), so users should pay particularattention to which questions were skipped for which respondents. The skip patterns are bestunderstood by consulting the survey instruments. With the introduction of computer-assistedinterviewing (CAI) in the 1996 Panel, documentation of instrument screens and program code isnow available from the SIPP Web site (http://www.sipp.census.gov/sipp/).
The source and accuracy statements provide information about the weights on the files, whenand how to make adjustments to the weights, and one approach to computing standard errors forsome common types of estimates. More extensive discussions of those topics are provided inChapters 7 and 8 of this Guide.
The data dictionary provides a detailed description of each variable on the file. It describes fouraspects of each variable:
1. The definition;
2. The sample universe of the corresponding survey question;
3. The ranges for all legal values; and
4. The location (and size) in the file.
A machine-readable version of the data dictionary accompanies each data file. It can also bedownloaded from the Internet (http://www.sipp.census.gov/sipp/).
The data dictionary is formatted to facilitate processing by user-written computer programs. Asshown in Figure 10-1, a “D” in the first column signifies that the next few lines define thevariable: (1) the variable name; (2) the size (i.e., how many digits it contains); and (3) the
USING THE CORE WAVE FILES
When text copy applies to both 1996 and pre-1996 panel files, pre-1996 variable names appear in parenthesesfollowing 1996 variable names.
10-3
starting position. A “U” in the first column signifies that the next words describe the universe.1 A“V” in the first column indicates that the next number and phrase describe one of the values ofthe variable. An asterisk in the first column denotes a comment. A period (.) before a worddenotes the start of the value label. In the dictionaries for files from the 1996 Panel, linesbeginning with a “T” contain short variable descriptions that can be used by many softwarepackages as variable labels.
Figure 10-1. Excerpt from a Data Dictionary for the Core Wave Files
Wave 1 of the 1996 PanelD EENTAID 3 506T PE: Address ID of hhld where person entered Sample Address ID of the household that this person belonged to at the time this person first became part of the sampleU All personsV 11:129 .Entry address ID
D EPPPNUM 4 509T PE: Person number Person number. This field differentiates persons within the sample unit. Person number is unique within the sample.U All personsV 101:1299 .Person number
D EPPINTVW 2 513T PE: Person’s interview statusU All personsV 1 .Interview (self)V 2 .Interview (proxy)V 3 .Noninterview – Type ZV 4 .Nonintrvw = pseudo Type Z.V .Left sample during theV .reference periodV 5 .Children under 15 duringV .reference period
(figure continues)
1 The universe definitions included in the data dictionaries prior to the 1996 Panel were not always accurate. Usersof pre-1996 SIPP Panels should check the skip patterns in the actual survey questionnaire to determine which subsetof respondents was asked each question.
SIPP USERS’ GUIDE
When text copy applies to both 1996 and pre-1996 panel files, pre-1996 variable names appear in parenthesesfollowing 1996 variable names.
10-4
Figure 10-1. Excerpt from a Data Dictionary for the Core Wave Files (continued)
Wave 9 of the 1992 PanelD ENTRY 2 457 Edited entry address ID Address ID of the household that this person belonged to at the time this person first became part of the sample Range=(11:99)U All persons, including children
D PNUM 3 459 Edited person number Range=(101:998)U All persons, including children
D INTVW 1 462 Person’s interview status Range=(0:5)U All persons, including childrenV 0 .Not applicable (childrenV .under 15)V 1 .Interview (self)V 2 .Interview (proxy)V 3 .Noninterview – Type Z refusalV 4 .Noninterview – Type Z otherV 5 .Noninterview – left beforeV .interview month
Figure 10-2 shows sample SAS and FORTRAN syntax for reading the data described by thecodebook fragment in Figure 10-1. Additional SAS program code could be used to associatevalue labels (SAS “formats”) with the variables.
Relationship of the Core Wave Data Files to theSIPP Survey Instrument
Because the core wave data dictionary does not replicate the survey instrument, analysts shouldkeep a few things in mind when using the data:
l The variables on the data files do not correspond one-to-one with the questionnaire items—the variables are listed in a different order, some variables are not included in the core wavefiles at all, and some variables are created from a combination of other variables;
USING THE CORE WAVE FILES
When text copy applies to both 1996 and pre-1996 panel files, pre-1996 variable names appear in parenthesesfollowing 1996 variable names.
10-5
Figure 10-2. Corresponding SAS and FORTRAN Syntax to Read the Datafrom the Core Wave Files (See Figure 10-1 for Data Dictionary)
Wave 1 of the 1996 PanelSAS
INPUT @506 EENTAID 3. EPPPNUM 4. EPPINTVW 2. ;
LABEL EENTAID = “Adrs ID where person entered sample” EPPPNUM = “Person number” EPPINTVW = “Person’s interview status” ;
l The range of possible values of the variables on the data files does not always correspondone-to-one with the response categories shown on the survey instrument or in the datadictionary;2
2 For example, in the 1996 Panel the response categories on the instrument for CLWRK are (1) a governmentorganization, (2) a private, for-profit company, (3) a nonprofit organization ..., (4) a family business or farm. Theresponse categories for the corresponding edited variable ECLWRK in the data dictionary are 1 = private for-profitemployee, 2 = private not-for-profit employee, 3 = local government worker, 4 = state government worker, 5 =federal government worker, 6 = family worker without pay.
SIPP USERS’ GUIDE
When text copy applies to both 1996 and pre-1996 panel files, pre-1996 variable names appear in parenthesesfollowing 1996 variable names.
10-6
l The variable name in the data dictionary may not readily indicate the variable’s content;3 and
l The complexity of the skip patterns will not be apparent by simply looking at the datadictionary.4
To avoid potential problems and confusion, analysts should become familiar with the surveyinstrument before using the data. When working with the data, analysts should refer to both thesurvey instrument and the data dictionary.
Structure of the Core Wave Files
Beginning with the 1990 Panel, the core wave files have been issued in person-month format,with one record per person for each month of the 4-month reference period the person is in thesample.5 A person who was in the sample for all 4 months of the wave has four records. Aperson who was in the sample for 1 month has only one record. Records for persons interviewedby proxy are included in the files, as are records for persons for whom the data are imputed. Thefiles also contain records for all children residing with original panel members.
As Table 10-1 illustrates, person number 0101 (101) was in the sample all 4 months, personnumber 0102 (102) was also in the sample all 4 months, person number 0201 (201) was in thesample for 2 months, and person number 0202 (202) was in the sample for 1 month. Users mayfind it helpful to review Figure 2-1 (pp. 2-10-2-14), which illustrates movement into and out ofthe sample.
Identifying Persons
There are many occasions when a user may need to identify which records belong to whichindividual in the SIPP data files. This need arises, for example, when:
l Merging data from topical module or full panel files to core wave files;
l Combining data from two or more core wave files;
3 Although an attempt was made in the 1996 Panel to give all variables meaningful names, the eight-characterlimitation imposed by many software packages places severe constraints on the degree to which this can be done.Prior to the 1996 Panel, the situation was more pronounced since numeric sequencing was used to name variables(e.g., in the paper survey, SE22318 is the variable that indicates the total number of employees working for thesecond business; in CAI, that variable is TEMPB2). In the 1996 Panel, variable names beginning with a “T” havebeen topcoded to protect respondent confidentiality.4 The universe definitions included in the data dictionaries prior to the 1996 Panel were not always accurate. Usersof pre-1996 SIPP Panels should check the skip patterns in the actual survey questionnaire to determine which subsetof respondents was asked each question.5 Prior to the 1990 Panel, core wave files had one record per person. Each record contained four occurrences of eachmonthly variable. For more information, see earlier editions of the SIPP Users’ Guide.
USING THE CORE WAVE FILES
When text copy applies to both 1996 and pre-1996 panel files, pre-1996 variable names appear in parenthesesfollowing 1996 variable names.
10-7
Table 10-1. Person-Month File Structure for the Core Wave Files
l Identifying which person received government transfer income on behalf of the family.
To uniquely identify a person in the core wave files, analysts should employ the three variablesshown in Table 10-2. Users should note that in the 1996 Panel, the entry address ID is no longerneeded for unique identification. Its continued use will not create any problems; it is simplyredundant information. That is a change from earlier panels in which the entry address ID waskey to uniquely identifying persons.
SIPP USERS’ GUIDE
When text copy applies to both 1996 and pre-1996 panel files, pre-1996 variable names appear in parenthesesfollowing 1996 variable names.
10-8
Table 10-2. Variables Used to Uniquely Identify a Person in the Core Wave Files
Variable Name DescriptionSSUID (SUID) Sample unit IDEENTAID (ENTRY) Entry address ID (Not required for identification in the 1996 Panel)EPPPNUM (PNUM) Person number
The variables in Table 10-2 have the following characteristics:
l SSUID (SUID) uniquely identifies each initially sampled dwelling unit.6 Every person in acore wave file was either a member of one of those units (an original sample member) orlives with someone who was a member of an initially sampled dwelling unit. A person’sconnection to that unit is an attribute of that person and does not change over time.7 Thismeans that as people move from address to address, their SSUID (SUID) stays the same. Asnew people join the homes of original sample members, they receive the SSUID (SUID) ofthe original sample members.
l EENTAID (ENTRY) identifies the address where the person lived at the time she or he wasfirst interviewed. It does not change even if the person moves.8 Prior to the 1996 Panel, itwas used in conjunction with the person number and sample unit ID to uniquely identifypersons within the sampling unit. It is not needed to uniquely identify persons in the 1996panel. Values for this variable are unique only within sample units. The entry address ID hastwo components. The first part of the ID number (two digits in the 1992 and 1996 Panels,and one digit in all others) identifies the wave in which SIPP interviews were first conductedat the address. The second part of the number (one digit in all panels) sequentially numbersaddresses within a sample unit [SSUID (SUID)] that enter the sample in the same wave. SeeChapter 9 for a more complete discussion.
l Prior to the 1996 Panel, PNUM uniquely identified a person within the sample unit and entryaddress ID. In the 1996 Panel, EPPPNUM uniquely identifies a person within the sampleunit. EPPPNUM (PNUM) does not change even if the person moves.9 The first part ofEPPPNUM (PNUM) (two digits in the 1992 and 1996 Panels, one digit in all others)indicates the wave in which the person was first interviewed.10 The remaining two digits aresequentially assigned within the household. Thus, original sample members are assignedperson numbers ranging from 100 to 199. Individuals who enter the SIPP sample in Wave 2
6 The SSUID (SUID) is a random recode of three other variables in the Census Bureau’s internal (not public use)files: the respondent’s sampling area (PSU), the cluster of housing units within that area (called the “segment”), anda sequentially assigned serial number. Those variables are omitted from the public use files to protect theconfidentiality of the respondents.7 There is one rare exception to this rule for Panels prior to 1996, which is described in the section entitled“Identifying Movers” later in this chapter.8 See footnote 6.9 See footnote 6.10 For Wave 10 of the 1992 Panel and for the 1996 Panel, the first two digits of PNUM instead of the first digitidentify the wave in which the person entered sample.
USING THE CORE WAVE FILES
When text copy applies to both 1996 and pre-1996 panel files, pre-1996 variable names appear in parenthesesfollowing 1996 variable names.
10-9
are assigned a person number ranging from 200 to 299. Those who enter in Wave 10 areassigned person numbers ranging from 1001 to 1099.
Table 10-3 illustrates how the combination of SSUID (SUID), EENTAID (ENTRY), andEPPPNUM (PNUM) uniquely identifies people and provides information about when they firstentered the SIPP sample. In this example, there are eight individuals: five are original samplemembers, one person joined the SIPP sample in Wave 3, one joined in Wave 4, and anotherjoined in Wave 7. Note that the person who joined the sample in Wave 3 (pre-1996 Panel) wasassigned a person number of 301, but an entry address ID of 21 (not 31). That is because the firstpart of the entry address ID indicates the wave in which that address was first occupied by anySIPP sample member, which is not necessarily the wave in which a given member entered thesample.
Table 10-3. How to Uniquely Identify a Person in the Core Wave Files
1996 Panel
SampleUnit ID (SSUID)
EntryAddress ID(EENTAID)
Person Number(EPPPNUM) Notes
123456789123 011 0101 Original sample member123456789123 011 0102 Original sample member123456789123 022 0301 Enters SIPP sample in Wave 3123456789123 011 0401 Enters SIPP sample in Wave 4123456789123 071 0701 Enters SIPP sample in Wave 7321456789123 011 0101 Original sample member321456789123 011 0102 Original sample member321456789123 011 0103 Original sample member
Prior to the 1996 Panel
SampleUnit ID (SUID)
EntryAddress ID(ENTRY)
Person Number(PNUM) Notes
123456789 11 101 Original sample member123456789 11 102 Original sample member123456789 21 301 Enters SIPP sample in Wave 3123456789 11 401 Enters SIPP sample in Wave 4123456789 71 701 Enters SIPP sample in Wave 7321456789 11 101 Original sample member321456789 11 102 Original sample member321456789 11 103 Original sample member
Identifying Households
The term household, as used in Census Bureau publications, refers to a group of persons whooccupy a housing unit. A house, an apartment or other group of rooms, or a single room isregarded as a housing unit if it is occupied or intended for occupancy as separate living quarters.That is, the occupants do not live and eat with any other persons in the structure and there is
SIPP USERS’ GUIDE
When text copy applies to both 1996 and pre-1996 panel files, pre-1996 variable names appear in parenthesesfollowing 1996 variable names.
10-10
direct access from the outside or through a common hall. A group of friends sharing anapartment constitutes a household. Noninstitutional group quarters, such as rooming andboarding houses, college dormitories, convents, and monasteries, are classified as group quartersrather than households.
To uniquely identify a household or group quarters in the core wave files, analysts should use thetwo variables shown in Table 10-4.
Table 10-4. Variables Used to Uniquely Identify a Household orGroup Quarters in the Core Wave Files
Variable Name DescriptionSSUID (SUID) Sample unit IDSHHADID (ADDID) Current address ID
People with the same SSUID (SUID) and SHHADID (ADDID) values live in the samehousehold (or group quarters). The six individuals in Table 10-5 make up three households. Thefirst household contains the first four individuals. The second household contains one person.The third household contains one person.
Table 10-5. How to Uniquely Identify a Household in the Core Wave Files
321456789123 031 0101 One person in this household321456789123 032 0102 One person in this household
Prior to the 1996 Panel
Sample Unit ID(SUID)
CurrentAddress ID(ADDID)
PersonNumber(PNUM) Notes
123456789 71 101123456789 71 102
Four persons in this household
123456789 71 401123456789 71 701321456789 31 101 One person in this household321456789 32 102 One person in this household
USING THE CORE WAVE FILES
When text copy applies to both 1996 and pre-1996 panel files, pre-1996 variable names appear in parenthesesfollowing 1996 variable names.
10-11
Each household contains one reference person. The household reference person is the person inwhose name the home is owned or rented. If the house is owned or rented jointly by more thanone person (such as a married couple or some roommate situations), any of those people may belisted as the “reference person.” Users may find it helpful to refer to Figure 2-1 (pp. 2-10-2-14),which illustrates the concepts of household and changes in household composition.
Identifying Families
The term family, as used in Census Bureau publications, refers to a group of two or more peoplerelated by birth, marriage, or adoption who reside together; all such individuals are consideredmembers of one family.
There are several types of families that the Census Bureau distinguishes:
l A primary family is a family containing the household reference person and all of his or herrelatives. This means that a household composed of a husband and wife, their son, and theirson’s wife (i.e., the daughter-in-law) is classified as a primary family containing four people.
l A related subfamily is a nuclear family that is related to but does not include the householdreference person. For example, the son and his wife (i.e., the daughter-in-law) in thepreceding example are a related subfamily.
l An unrelated subfamily (sometimes called a secondary family) is a nuclear family that is notrelated to the household reference person. Thus, a husband and wife who live in a friend’shouse are classified as an unrelated subfamily. A mother and daughter who live in themother’s boyfriend’s apartment are classified as an unrelated subfamily.
l A primary individual is a household reference person who lives alone or lives with onlynonrelatives. Primary individuals are sometimes treated by the Census Bureau as familieswith only one person and are referred to as pseudo-families.
l A secondary individual is not a household reference person and is not related to any otherpeople in the household. Secondary individuals are sometimes treated by the Census Bureauas families with only one person and are referred to as pseudo-families.
To uniquely identify a family, analysts should use the variables shown in Table 10-6.
Table 10-6. Variables Used to Uniquely Identify a Family in the Core Wave Files
Variable Name DescriptionSSUID (SUID) Sample unit IDSHHADID (ADDID) Current Address IDand one of the following:RFID (FID) Family IDRFID2 (FID2) Family ID, excluding related subfamily membersRSID (SID) Family ID, for both related and unrelated subfamilies
SIPP USERS’ GUIDE
When text copy applies to both 1996 and pre-1996 panel files, pre-1996 variable names appear in parenthesesfollowing 1996 variable names.
10-12
The Census Bureau has two principal methods for distinguishing families.
l The first method defines a family as all persons who are related and living together. Thefamily ID variable RFID is used with this definition. RFID groups the household referenceperson with all related household members by assigning them the same ID number. Thisfamily group corresponds to the Census Bureau’s definition of a primary family. RFIDgroups members of each unrelated subfamily (and primary and secondary individuals)separately.
l The second method is similar to the first in defining a family, but the family excludesmembers of related subfamilies. The family ID variable RFID2 is used with this definition.RFID2 equals zero for members of related subfamilies. RFID2 groups members of eachunrelated subfamily (and primary and secondary individuals) in the same way as RFID—each group has a unique number.
Analysts who want to analyze multigenerational families would use RFID2 (FID2) and thevariable RSID (SID). RSID (SID) treats related subfamilies as distinct family units by assigningmembers of related subfamilies nonzero values. Analysts can easily distinguish unrelatedsubfamilies from other family units when they use these variables and numbering schemes.
Table 10-7 illustrates the difference between the RFID (FID), RFID2 (FID2), and RSID (SID)variables. Those variables are set to new numbers in each month. For example, a mother, afather, and a child would be family 1 with RFID (FID) = 1 in month 1, RFID (FID) = 2 in month2, RFID (FID) = 3 in month 3, and RFID (FID) = 4 in month 4, even though family compositionremains the same. The first household in the table contains a primary family of five people. Theprimary family contains two related subfamilies. RFID (FID) and RFID2 (FID2) mask the factthat there are two related subfamilies; only RSID (SID) provides that information: RSID (SID)has nonzero values for those related subfamilies.
The second “household” is actually a group of three households, each containing a primaryfamily, that originally formed one household. The third household contains a primary family andtwo unrelated subfamilies. The fourth household contains a primary individual and an unrelatedsubfamily. The fifth household contains only a primary individual. The sixth household is agroup quarters containing two people.
The needs of the analysis will help to determine which family classification to use. Thefollowing guide may prove helpful:
l To group people into families in the same way that the Census Bureau does, use SSUID(SUID), SHHADID (ADDID), and RFID (FID).
l To analyze people in related subfamilies, include only those records with RSID (SID) greaterthan zero and ESFTYPE (FTYPE) equal to 2.
l To analyze all families and to keep subfamilies separate from primary families, use SSUID(SUID), SHHADID (ADDID), RFID2 (FID2), and RSID (SID) to uniquely identify eachfamily.
Table 10-7. Uniquely Identifying Families in the Core Wave Files
Three households formed bypeople who were originallymembers of the same originallysampled household (SSUID of110077777723). Twosubfamilies split off from theoriginal household to becometwo new primary families ataddresses 21 and 22.
a EFTYPE = 1 means the person belongs to a primary family (including related subfamily members). EFTYPE = 3 means the person belongs to an unrelatedsubfamily. EFTYPE = 4 means the person is a primary individual. EFTYPE = 5 means the person is a secondary individual.
(table continues)
When text copy applies to both 1996 and pre-1996 panel files, pre-1996 variable nam
es appear in parenthesesfollow
ing 1996 variable names.
10
-13
US
ING
TH
E C
OR
E W
AV
E F
ILE
S
Table 10-7. Uniquely Identifying Families in the Core Wave Files (continued)
Three households formed bypeople who were originallymembers of the same originallysampled household (SUID of110077777). Two subfamiliessplit off from the originalhousehold to become two newprimary families at addresses21 and 22.
This household contains aprimary individual and anunrelated subfamily.
610000000 11 101 1 1 0 4 Primary individual.
897454644 11 101 1 1 0 5897454644 11 102 2 2 0 5
Group quarters with twosecondary individuals.
b FAMTYP = 1 means the person belongs to a primary family (including related subfamily members). FAMTYP = 3 means the person belongs to an unrelatedsubfamily. FAMTYP = 4 means the person is a primary individual. FAMTYP = 5 means the person is a secondary individual.
When text copy applies to both 1996 and pre-1996 panel files, pre-1996 variable nam
es appear in parenthesesfollow
ing 1996 variable names.
10
-14
SIP
P U
SE
RS
’ GU
IDE
USING THE CORE WAVE FILES
When text copy applies to both 1996 and pre-1996 panel files, pre-1996 variable names appear in parenthesesfollowing 1996 variable names.
10-15
Other Variables Describing Household andFamily Composition
Table 10-8 shows the primary core wave variables summarizing household and familycomposition.11
Table 10-8. Variables Describing Household and Family Composition in theCore Wave Files
Variable Name
1996Panel
Prior to the1996 Panel Description
RHNF HNF Number of families, subfamilies, and pseudo-families in householdRHNFAM HNFAM Number of families and pseudo-families but excluding related
subfamilies in householdRHNSF HNSF Number of related subfamilies in householdEHREFPER HREFPER Household reference person (ENTRY concatenated with PNUM)EHHNUMPP HNP Number of persons in householdRHTYPE HTYPE Type of household (e.g., married-couple family, male householder
family, etc.)EFREFPER FREFPER Family reference person (ENTRY concatenated with PNUM)EFTYPE FTYPE Type of family (e.g., primary family, unrelated subfamily, etc.)EFKIND FKIND Head of family (e.g., husband and wife, male reference person, etc.)ESFT FAMTYP Type of family to which this person belongs (e.g., primary family, related
subfamily, etc.)ESFRa FAMREL Family relationship (e.g., reference person, spouse of family reference
person, child of family reference person, etc.)ERRP RRP Recoded relationship to the household reference person (e.g., household
reference person living with relatives, child of household referenceperson, etc.)
Not a variable forthe 1996 Panel
RRPU Unedited relationship to the household reference person (e.g., stepchildof household reference person, grandchild of household reference person,etc.)
EPNSPOUS PNSP Person number of spouseEPNGUARD PNGDU Person number of guardianEPNMOM Person number of motherEPNDAD Person number of father
PNPT Person number of parenta ESFR (edited subfamily relationship) is defined the same as FAMREL, but it applies only to subfamilies (bothrelated and unrelated).
11 Detailed information about the relationships between members is collected in the Household Relationships topicalmodule (see Chapter 3 for a discussion of topical module content). See those data for extensive information abouthousehold composition.
SIPP USERS’ GUIDE
When text copy applies to both 1996 and pre-1996 panel files, pre-1996 variable names appear in parenthesesfollowing 1996 variable names.
10-16
Identifying Household and Family Reference Persons
The EHREFPER (HREFPER) variable’s value identifies the household reference person. Asexplained in Chapter 2, the household reference person is the owner or renter of record. Prior tothe 1996 Panel, the variable identified the household reference person by concatenating ENTRYwith PNUM. For the 1996 Panel, the variable simply contains the person number of thehousehold reference person (EHREFPER = EPPPNUM). Prior to the 1996 Panel, the householdreference person was the one for whom:
l HREFPER = ENTRY * 1000 + PNUM (for Waves 1-9) or
l HREFPER = ENTRY * 10000 + PNUM (for Wave 10 of the 1992 Panel).
The EFREFPER (FREFPER) variable identifies the family reference person. For the 1996 Panel,the variable simply contains the person number of the family reference person (EFREFPER =EPPPNUM). Prior to the 1996 Panel, the family reference person was the one for whom:
l FREFPER = ENTRY * 1000 + PNUM (for Waves 1-9) or
l REFPER = ENTRY * 10000 + PNUM (for Wave 10 of the 1992 Panel)
Using the Relationship to Reference Person [ERRP (RRP)]Variable
For the 1996 Panel, ERRP describes how each person is related to the household referenceperson. As seen in Table 10-9, the new variable provides information about several householdrelationship categories that were not available from earlier panels. However, as in earlier panels,this variable summarizes the relationship to the household reference person, not to the familyreference person.
Prior to the 1996 Panel, both edited and unedited versions of the RRP variable were included onthe core wave files. As shown in Table 10-10, RRP (the edited version of the variable)summarized the values of RRPU (the unedited variable). The RRPU variable can distinguishwhether someone is a grandchild, stepchild, foster child, or natural/adopted child of thehousehold reference person. What it cannot do, however, is distinguish the type of child withineach family: RRPU is the relationship to the household reference person, not the relationship tothe family reference person. For example, using records with RRPU = 6 will not identify allfoster children, because some could be in an unrelated subfamily. The variable FAMRELsummarizes the relationship of the person to the family reference person (as reference person offamily, spouse, or child).
USING THE CORE WAVE FILES
When text copy applies to both 1996 and pre-1996 panel files, pre-1996 variable names appear in parenthesesfollowing 1996 variable names.
10-17
Table 10-9. The ERRP Variable in the 1996 Core Wave FilesEdited Relationship to the Household Reference Person (ERRP)
Edited Relationship to theHousehold ReferencePerson (ERRP) Description
1 Household reference person, living with relatives 2 Household reference person, living alone or with nonrelatives 3 Spouse of household reference person 4 Child of household reference person 5 Grandchild of household reference person 6 Parent of household reference person 7 Brother or sister of household reference person 8 Other relative of household reference person 9 Foster child of household reference person
10 Unmarried partner of household reference person11 Housemate or roommate12 Roomer or boarder13 Other nonrelative of household reference person
Table 10-10. Comparison of RRP and RRPU Variables of the Core Wave FilesPrior to the 1996 Panel
Edited Relationshipto the HouseholdReference Person(RRP) Description
Relationship to theHousehold ReferencePerson(RRPU) Notes
1 Household reference person,living with relatives
1 Same as code 1 under RRP
2 Household reference person,living alone or withnonrelatives
2 Same as code 2 under RRP
3 Spouse of household referenceperson
3 Same as code 3 under RRP
4 Natural/adopted child ofhousehold reference person
4 Child of household referenceperson
5 Stepchild of householdreference person
7 Grandchild of householdreference person
8 Parent of householdreference person
9 Brother/sister of householdreference person
5 Other relative of householdreference person
10 Other relative of householdreference person
6 Nonrelative of householdreference person, but related toother members of thehousehold
11 Same as code 6 under RRP
6 Foster child of householdreference person
12 Partner/roommate ofhousehold reference person
7 Nonrelative of all members ofthe household
13 Other type of nonrelative ofhousehold reference person
SIPP USERS’ GUIDE
When text copy applies to both 1996 and pre-1996 panel files, pre-1996 variable names appear in parenthesesfollowing 1996 variable names.
10-18
The ERRP (RRP) variable contains summary information about each person’s relationship to thehousehold reference person. Analysts should bear in mind that the household descriptiondepends upon the identity of the household reference person. For example, the household inTable 10-11 contains a mother, her daughter, and her daughter’s son. If the mother is thehousehold reference person [ERRP = 1 (RRP = 1)], her daughter is listed as a child of thehousehold reference person [ERRP = 4 (RRP = 4)], and the daughter’s son is listed as agrandchild of the reference person in the 1996 Panel (ERRP = 5), but as another relative of thehousehold reference person in earlier panels (RRP = 5, but the same value has a differentmeaning from that of the 1996 Panel variable). If the daughter is the reference person, her son islisted as a child of the household reference person (RRP = 4), and her mother is listed as theparent of the reference person in the 1996 Panel (ERRP = 6), but as another relative of thehousehold reference person in earlier panels (RRP = 5).12 Users should note that the identity ofthe household reference person can change from one month to the next; thus, the householddescription could also change.
Table 10-11. Identifying Households Containing Three Generations in the Core Wave Files
1996 Panel
Household MemberRelationship to HouseholdReference Person (ERRP) Notes
Mother as Household Reference PersonMother 1 Reference personDaughter 4 Child of reference personDaughter’s son 5 Grandchild of reference personDaughter as Household Reference PersonDaughter 1 Reference personDaughter’s son 4 Child of reference personMother 6 Parent of reference person
Panels Prior to 1996
Household MemberRelationship to the HouseholdReference Person (RRP) Notes
Mother as Household Reference PersonMother 1 Reference personDaughter 4 Child of reference personDaughter’s son 5 Other relative of reference personDaughter as Household Reference PersonDaughter 1 Reference personDaughter’s son 4 Child of reference personMother 5 Other relative of reference person
12 Because it is impossible to anticipate all of the different living arrangements found in SIPP sample households,and in some cases more than one rule for identifying a reference person may apply, some interviewer discretion inidentifying the reference person is inevitable. For that reason, the resulting choices can sometimes appear to the dataanalyst to be somewhat arbitrary.
USING THE CORE WAVE FILES
When text copy applies to both 1996 and pre-1996 panel files, pre-1996 variable names appear in parenthesesfollowing 1996 variable names.
10-19
Identifying a Person’s Spouse, Parent, or Guardian
Four other variables on the core wave files (three prior to the 1996 Panel) can also be used todescribe household and family composition. They are EPNSPOUS (PNSP), EPNDAD orEPNMOM (PNPT), and EPNGUARD (PNGDU). These variables identify the person number ofthe spouse, the father or mother (just one parent is identified in files from panels prior to 1996),and guardian of the person, respectively. In each case, the relative is identified only if she or heis living at the same address as the person. By building from these variables, analysts canidentify a variety of family configurations. For example, these variables can be used to identifyhouseholds containing three generations. Table 10-12 displays one household containing amother and her two children. One child, EPPPNUM = 0102 (PNUM = 0102), has a son, and theother child, EPPPNUM = 0104 (PNUM = 0104), has a spouse.
Table 10-12. Identifying Households Containing Three Generations in the Core Wave Files
The core wave files contain a number of family-level income variables. The family incomevariables on these files include the income of all related subfamily members. In other words,primary family members, including related subfamily members, are treated as one family by theCensus Bureau when calculating family-level income amounts. The core wave files also contain
SIPP USERS’ GUIDE
When text copy applies to both 1996 and pre-1996 panel files, pre-1996 variable names appear in parenthesesfollowing 1996 variable names.
10-20
related subfamily income variables. These variables pool the income of all persons who aremembers of the same related subfamily.
Table 10-13 illustrates how the family income variables on the core wave files include theincome of related subfamily members. From the previous example of a primary family of fivepeople, the primary family contains two related subfamilies. Total family income, TFTOTINC(FTOTINC), is $4,200. The first related subfamily has a total income, TSTOTINC (STOTINC),of $1,000. The second related subfamily has $2,000 in total income.
More About Using the SIPP ID Variables:Identifying Movers
When a person moves, the current address field, SHHADID (ADDID), changes. The SSUID(SUID), EENTAID (ENTRY), and EPPPNUM (PNUM) values remain the same. The first part(two digits in the 1992 Panel and the 1996 Panel, one digit in all others) of SHHADID (ADDID)indicate(s) the wave in which a household is first interviewed at that new address. The remainingdigits sequentially number the households that split into two or more households, as a result of amove to a different location by original sample members. Thus, new addresses in Wave 2 arenumbered 021 (21), 022 (22), and so on. New addresses in Wave 3 are numbered 031 (31), 032(32), and so on.
Table 10-14 shows that persons 0101 (101) and 0102 (102) in the first household are originalsample members. Person 0401 (401) moved into the home of persons 0101 (101) and 0102 (102)in Wave 4. In Wave 7, all three of them moved to a new location and were joined by person 0701(701). In the second household, person 101 is an original sample member who moved to a newlocation in Wave 3. In the third household, person 0102 (102) is an original sample member whoused to live with persons 0101 (101) and 0103 (103) of the same sample unit ID, but moved to anew location in Wave 3 [to a different location from person 0101 (101)]. In the fourth household,person number 0103 (103) is an original sample member who used to live with persons 0101(101) and 0102 (102) of the same sample unit ID number. All but two people moved from theiroriginal location [i.e., only two people have SHHADID (ADDID) equal to EENTAID(ENTRY)].
The next example (Table 10-15) further illustrates how the ID system works as people move tonew addresses, additional people move in with them, and households split. A review of Figure2-1 may help in understanding the various household changes.
l In Wave 1, there is a five-person household consisting of a husband, wife, daughter, son, andcousin. Since this is the first wave, the current address number is 011 (11), indicating address1 of Wave 1, and the entry address number for each member of the household is the same asthe current address number. Since they are assigned in Wave 1, the person numbers are in the0100 (100) series and are numbered sequentially, beginning with 0101 (101).
Table 10-13. How the Family-Level Variables Include the Subfamily’s Information in the Core Wave Files
Persons 0101 and 0102 are the originalsample members. Person 0401 begins tolive with them in Wave 4. All threepeople move in Wave 7 and person 0701joins them.
321456789123 031 011 0101 Person 0101 is an original samplemember who moved in Wave 3.
321456789123 032 011 0102 Person 0102 is an original samplemember who moved in Wave 3 to adifferent location from person 0101.
Persons 101 and 102 are the originalsample members. Person 401 begins tolive with them in Wave 4. All threepeople move in Wave 7 and person 701joins them.
321456789 31 11 101 Person 101 is an original sample memberwho moved in Wave 3.
321456789 32 11 102 Person 102 is an original sample memberwho moved in Wave 3 to a differentlocation from person 101.
USING THE CORE WAVE FILES
When text copy applies to both 1996 and pre-1996 panel files, pre-1996 variable names appear in parenthesesfollowing 1996 variable names.
10-23
Table 10-15. Example of Household Changes and Their Effects on the IDVariables of the Core Wave Files
a Prior to the 1996 Panel, only the 1992 Panel had 10 or more waves. The Wave 2 core wave file of the1992 Panel has expanded address ID and person ID fields (3 and 4 digits, respectively) to accommodateWave 10 of the 1992 Panel.
USING THE CORE WAVE FILES
When text copy applies to both 1996 and pre-1996 panel files, pre-1996 variable names appear in parenthesesfollowing 1996 variable names.
10-25
l During Wave 2, the son joins the Army, moves into the military barracks, and thereforeleaves the SIPP sample. For the son’s record, person number 0104 (104), the person-monthfile, will contain a Wave 1 record for him and a Wave 2 record containing information (eitherimputed or provided by proxy) on his characteristics in the months of Wave 2 that he wasstill in the sample. If he does not return to the sample during the remainder of the panel, therewill be no records for him beyond Wave 2.
l During Wave 3, the daughter marries and her husband moves into the household. The currentaddress number where the mother, father, cousin, daughter, and son-in-law live remains thesame since it is the same address. The son-in-law’s entry address number is 011 (11), sincehe first enters the SIPP sample at an address coded 011 (11). The person number for the son-in-law is in the 0300 (300) series [0301 (301)] since he joins the SIPP sample in Wave 3.
l During Wave 4, the daughter and son-in-law move into a new house. Their current addressnumber changes to 041 (41) to indicate that a new address has been established in Wave 4.Meanwhile, the cousin, who is over age 15, moves in with an uncle.13 The cousin’s currentaddress number changes to 042 (42) (i.e., the second new household formed in the fourthwave from this sample unit). The assignment of address number 041 (41) to the daughter and2 (42) to the cousin is arbitrary—it could be the other way around. The uncle enters the SIPPsample and receives an address number of 042 (42) and an entry address number of 042 (42).The uncle’s person number is in the 0400 (400) series [0401 (401)], since he joins the surveyin Wave 4.
l No changes in household composition are observed during Waves 5–9.
l During Wave 10,14 the daughter and son-in-law have a baby. This new sample member isassigned the sample unit ID of the daughter and son-in-law. The newborn’s entry address is041 (41) because that is the current address ID of the daughter and son-in-law at the time ofbirth. The newborn’s person number is 1001, reflecting the fact that the newborn came intothe SIPP sample in Wave 10. Meanwhile, the cousin moves to Europe and therefore leavesthe SIPP sample. The uncle, even though he did not move to Europe with the cousin, alsoleaves the SIPP sample because he no longer resides with an original SIPP sample member.Their records are no longer listed.
Prior to the 1996 Panel, there were two extremely rare occasions when the original SUID,ENTRY, and PNUM values were modified by the Census Bureau:
1. The first occasion was when two separate sampling units, each containing original samplemembers, were merged, perhaps because of a marriage. In this situation, one of the originalsets of SUID and ENTRY values was retained and the other set was changed to agree withthat retained set. The person-number values (PNUM) of the changed set were modifiedfurther to be between 180 and 199, inclusive.
13 In the 1993 Panel, all original sample members were followed, no matter what their age. In all other panels(including the 1996 Panel), only those age 15 or older were followed when they moved to new addresses.14 Prior to the 1996 Panel, only the 1992 Panel had 10 or more waves.
SIPP USERS’ GUIDE
When text copy applies to both 1996 and pre-1996 panel files, pre-1996 variable names appear in parenthesesfollowing 1996 variable names.
10-26
2. The second occasion was when a household split into two new households (in which eachnew household gained a new sample person) and later the households recombined. Forexample, suppose that a married couple separated in Wave 3, each moving in with a sibling.Both siblings were assigned a person number of 301 because they entered the sample inWave 3 at different addresses (thus, ADDID = 31 and 32). If the husband and wife reunitedin Wave 6, bringing the siblings with them, one sibling’s person number would have beenchanged. In this case, one of the siblings would have a person number of 301 and the otherwould have a person number of 680 (or some number between 680 and 699, inclusive).
Those two occasions were the only times when SUID, ENTRY, and PNUM changed. When itdid occur, the old ID variables were stored in the previous wave variables (PWSUID,PWENTRY, and PWPNUM).15
When the merge occurred after the first month of a reference period, the members of the mergedhousehold (whose ID variables were modified) were assigned two sets of monthly records in thecore wave file. The first set of records contained the original ID information and identified theperson as having exited the sample at the time of the merge. The second set contained the newID information and identified the person as having entered the sample at the time of the merge.When the merge occurred at the start of the reference period, only the second set of records wasretained in the core wave files.
Because merged households were very rare prior to the 1996 Panel, information about them willno longer be carried on the core wave files from the 1996 Panel. When either of those two kindsof events occur in the 1996 Panel, one or more original sample members will appear to leave thesample when the merge takes place, and new people will appear to enter the sample when themerged household forms. There is no indication in the data files that the “new” sample memberswere previously members of the SIPP sample with different ID values.
Identifying Program Units
Besides household and family composition, the core wave files contain detailed informationabout participation in health insurance and various government transfer programs. For mostprograms, three characteristics are recorded (Table 10-16):
1. Whether the person is covered;
2. Who received the income or benefit; and
3. The amount of the income or benefit.
15 In the 1993 Panel, merged households are identified with the variables PWSUID, PWENTRY, and PWPNUM.Before the 1993 Panel, they were identified with the variables PREV-ID, SC0064, and SC0066.
USING THE CORE WAVE FILES
When text copy applies to both 1996 and pre-1996 panel files, pre-1996 variable names appear in parenthesesfollowing 1996 variable names.
10-27
Table 10-16. Variables Describing Participation in Government Transfer Programs andHealth Insurance Programs in the Core Wave Files
1996 Panel
Program CoverageAuthorizedRecipient Recipiency Amount
Social Security—Adults RCUTYP01 RCUOWN01 ER01A T01AMTASocial Security—Children ER01K T01AMTKRailroad Retirement—Adults ER02 T02AMTFederal Supplemental Security Income RCUTYP03 RCUOWN03 ER03 T03AMTVeteran’s Benefits RCUTYP08 RCUOWN08 ER08 T08AMTAid to Families with Dependent Children/Temporary Assistance for Needy Familiesa
RCUTYP20 RCUOWN20 ER20 T20AMT
General Assistance RCUTYP21 RCUOWN21 ER21 T21AMTFoster Child Care RCUTYP23 RCUOWN23 ER23 T23AMTOther Welfare RCUTYP24 RCUOWN24 ER24 T24AMTWomen, Infants and Children (WIC) RCUTYP25 RCUOWN25 ER25 T25AMTFood Stamps RCUTYP27 RCUOWN27 ER27 T27AMTMedicare ECRMTHMedicaid RCUTYP57 RCUOWN57 ER57CHAMPUS RCHAMPMOther Health Insurance RCUTYP58 RCUOWN58 ER58
Panels Prior to 1996
Program CoverageAuthorizedRecipient Recipiency Amount
Social Security—Adults SOCSEC SSPNUM R01A S01AMTASocial Security—Children R01K S01AMTKRailroad Retirement—Adults RAILRD RRPNUM R02A S02AMTARailroad Retirement—Children R02K S02AMTKFederal Supplemental Security Income SSICOVRGb R03 S03AMTVeteran’s Benefits VETS VETNUM R08 S08AMTAid to Families with Dependent Children AFDC AFDCPNUM R20 S20AMTGeneral Assistance GENASST GAPNUM R21 S21AMTFoster Child Care FOSTKID FKPNUM R23 S23AMTOther Welfare OTHWELF OWPNUM R24 S24AMTWomen, Infants and Children (WIC) WICCOV WICPNUM R25 WICVALFood Stamps FOODSTMP FSPNUM R27 S27AMTMedicare CARECOVMedicaid CAIDCOV MCDPNUMCHAMPUS CHAMP CHPNUMOther Health Insurance HIIND HIPNUMa In August 1996, the Personal Responsibility and Work Opportunity Reconciliation Act was signed into law. Thislegislation replaced the old welfare system, Aid to Families with Dependent Children (AFDC), with a new program,Temporary Assistance for Needy Families (TANF). In the 1996 Panel, the questions for income type 20 referred tothe AFDC program prior to Wave 4 and to the TANF program beginning in Wave 4. In Wave 9, the questions wereexpanded somewhat to capture the larger array of program types that could exist under TANF.b During the 1990s, SSI was extended to children with disabilities. Consequently, beginning with the 1992 Panel,SSICOVRG was added to the core wave data files.
SIPP USERS’ GUIDE
When text copy applies to both 1996 and pre-1996 panel files, pre-1996 variable names appear in parenthesesfollowing 1996 variable names.
10-28
The coverage variables identify whether the income or benefit covers that person. In other words,when a person is flagged as covered by food stamps, RCUTYP27 (FOODSTMP) = 1, the personreceived the benefits either directly (because he or she was the authorized food stamp recipient)or indirectly (because he or she was in the same food stamp unit as the authorized recipient). Thecoverage variables also allow users to determine situations in which the program unit is a subsetof the family or household.16
The authorized recipient variables identify the people who actually received the income orbenefit for the people in their program units. In the 1996 Panel, the variables identifying theauthorized recipient use only the person number, EPPPNUM. Prior to the 1996 Panel, thevariables identifying the authorized recipient were constructed by concatenating the entryaddress, ENTRY, with the person number, PNUM.
Individuals who are members of a common program unit can be identified by using the sampleunit ID, SSUID (SUID), and the authorized recipient variable. For example, members of acommon food stamp unit are those with common values of SSUID (SUID) and RCUOWN27(FSPNUM). Identifying members of common units is often necessary because most programsallow more than one program unit in a household. Medicare, however, is a person-based programin which each participant is an authorized recipient, so no additional authorized recipient variablefor that program is included on the files. Prior to the 1996 Panel, there was also no authorizedrecipient variable for SSI on the core wave files.
There are some exceptions to these rules:
l Social Security, Railroad Retirement (prior to 1996), WIC, AFDC, and Medicaid can offerbenefits solely to children. When that happens, an adult receives the income on behalf of thechildren. The adult, therefore, is flagged as the authorized recipient but is not flagged ascovered by the program. The children are flagged as covered and have nonzero benefits.
l Most SSI recipients are elderly and disabled adults, but they can also be disabled children. Inthe 1990s, the definition of qualifying disabling conditions was expanded. That change indefinition resulted in a rapid expansion of the child SSI caseload. Consequently, theSSICOVRG variable was included (beginning with the 1992 Panel). This variable indicateson the recipient’s (the adult’s) record whether the children, the adults, or both, within afamily are covered by the income. Prior to the 1996 Panel, however, SSICOVRG did not flageach person individually, like the other coverage variables. Only the recipient will have had anonzero SSI income. Beginning with the 1996 Panel, two new variables identify eachindividual covered by federally administered SSI (RCUTYP03) or state-administered SSI(RCUTYP04).
16 In the 1984 and 1985 Panels, WIC coverage was imputed to children under 6 years old if a mother reportedparticipation in the WIC program. Beginning with the 1986 Panel, WIC coverage is assessed directly for all samplemembers.
USING THE CORE WAVE FILES
When text copy applies to both 1996 and pre-1996 panel files, pre-1996 variable names appear in parenthesesfollowing 1996 variable names.
10-29
l The medical insurance variables simply reflect who is enrolled in which type of program.There are no associated amount variables.
These rules and exceptions are illustrated in Table 10-17. The household contains one AFDCunit and two food stamp units. The mother is covered by Social Security and SSI. The mother ofthe disabled child receives WIC benefits and SSI on behalf of her child, but she did not receiveWIC or SSI for herself. Everyone in the household is enrolled in Medicaid. The coveragevariables are set to 2 whenever the person is not covered by the particular program; the oneexception (for panels prior to 1996) is SSI coverage—a value of 2 means that only the childrenare covered.
Users should note that, except for WIC, no amounts of income or benefit from governmenttransfer and health insurance programs are listed in the records of children under age 15. Thus, inthe case of WIC, users need to sum the amounts over all persons, including children, to get theproper WIC unit total. For all other programs, users will find the unit total benefit in therecipient’s record.
Income Topcoding in the 1996 Panel
To protect the confidentiality of SIPP respondents, the Census Bureau topcodes very highincomes on the SIPP public use data files. New income topcoding procedures were institutedwith the 1996 Panel. As in the past, summary income variables for persons, families, andhouseholds are the sums of the component variables after they have been topcoded. Thesummary variables are not independently topcoded. Thus, a person, family, or household withhigh income from several sources (multiple jobs, businesses, property) could have aggregatemonthly income well over the topcode threshold for each source.
Topcoding Unearned Income in the 1996 Panel
When the total amount of asset income or of certain types of general income for a wave exceedsthe established ceiling, the monthly amounts in excess of the monthly threshold are replaced bymonthly topcode values. For example:
l When the amount of interest on joint municipal/corporate bonds exceeds $10,000 for thewave, each monthly amount in excess of $2,500 is recoded to $2,500.
l When the amount of interest on self-owned municipal/corporate bonds exceeds $12,800 forthe wave, each monthly amount in excess of $3,200 is recoded to $3,200.
SIPP USERS’ GUIDE
When text copy applies to both 1996 and pre-1996 panel files, pre-1996 variable names appear in parenthesesfollowing 1996 variable names.
10-30
Table 10-17. Example of Program Units, Coverage, and Recipiencyin the Core Wave Files
When text copy applies to both 1996 and pre-1996 panel files, pre-1996 variable names appear in parenthesesfollowing 1996 variable names.
10-32
Not all income sources are topcoded. For example, the amount of food stamp income is nottopcoded. For a complete list of topcoded income variables with the topcode amounts for the1996 Panel, users should refer to Appendix B (Topcoding).
Topcoding Employment Income in the 1996 Panel
Three different sources of monthly employment income are identified in the SIPP public usefiles: (1) wage and salary income, (2) self-employed earnings, and (3) other workerarrangements. Each of these three sources is topcoded separately. For each source, monthlyamounts over $12,500 (one-twelfth of the $150,000 annual benchmark) are topcoded if the totalincome from those sources from all 4 months in the wave is greater than $50,000 (one-third of$150,000). Table 10-18 provides examples of employment income amounts that requiretopcoding.
Table 10-18. Topcoding Criteria for the 1996 Panel
Reported Monthly Earned Income Amounts
Example Month 1 Month 2 Month 3 Month 4Sum for theWave
2, 3, and 45 $0 $0 $0 $49,000 $49,000 No None6 $15,000 $15,000 $15,000 $15,000 $60,000 Yes Topcode all 4
When topcoding is required because the reported value exceeds the acceptable threshold, thevalue assigned to the variable can be determined in one of two ways: it can be set equal to thethreshold, or it can be set equal to the mean of the reported amounts above the threshold. In thesecond case, the topcode value that is assigned is based on the respondent’s gender, race/ethnicorigin, and employment status (full or part year, full or part time). Table 10-19 illustrates theprocedure. It shows the topcodes used in Wave 1 of the 1996 Panel for employment income.Those Wave-1-based topcodes are adjusted for inflation and real growth in earned income (seeBox 10-1) and then used for all later waves of the panel.
Because of the way in which the topcode values were computed (explained in the nextparagraph), the values listed for each cell are greater than the monthly value that is tested($12,500). This method of computation may result in instances in which use of the topcodevalues results in total amounts for the wave (summed across all 4 months) that are greater than$50,000.
USING THE CORE WAVE FILES
When text copy applies to both 1996 and pre-1996 panel files, pre-1996 variable names appear in parenthesesfollowing 1996 variable names.
10-33
Table 10-19. Topcode Amounts Used for Monthly Employment Income inWave 1 of the 1996 Panel
Example Sex Race Worker StatusEarned IncomeTopcode
1 Male Nonblack, non-Hispanic Full year; full time $29,6602 Male Nonblack, non-Hispanic Not full year; full time $38,2703 Male Black, non-Hispanic Full year; full time $17,5304 Male Black, non-Hispanic Not full year; full time $24,0155 Male Hispanic, any race Full year; full time $26,2506 Male Hispanic, any race Not full year; full time $24,0157 Female Nonblack, non-Hispanic Full year; full time $21,9908 Female Nonblack, non-Hispanic Not full year; full time $49,4509 Female Black, non-Hispanic Full year, full time $24,015
10 Female Black, non-Hispanic Not full year; full time $24,01511 Female Hispanic, any race Full year; full time $24,01512 Female Hispanic, any race Not full year; full time $24,015
Box 10-1. Computing Earned Income Topcode Amounts forWaves 2–12 in the 1996 Panel
The topcode amount for wave k is computed as:1
1 019.1* −= kWavekWave TopcodeTopcode
Example: Nonblack, non-Hispanic male employed full year, full time.Wave 1 Topcode (from Table 10-19) = $29,660Wave 7 Topcode = $29,660 * 1.019(7-1) = $29,660 * 1.120 = $32,206
The topcode values were computed from data collected in Wave 1 of the 1996 Panel. Thetopcode values are the unweighted mean amounts from records identified for topcoding in Wave1 of the 1996 Panel. A separate topcode value was computed for each of the 12 cells of Table 10-19. Each topcode value is based on amounts from all three employment income sources, and thesame topcode is used for all three employment income sources. The algorithm used to calculatethe assigned topcode amount is as follows:
1. Add the four monthly amounts of wage and salary income. If the sum is greater than$50,000, store the monthly amounts greater than $12,500 in the 12-cell matrix.
2. Add the four monthly amounts of self-employed earnings. If the sum is greater than $50,000,store the monthly amounts greater than $12,500 in the 12-cell matrix.
3. Add the four monthly amounts of contingent worker earnings. If the sum is greater than$50,000, store the monthly amounts greater than $12,500 in the 12-cell matrix.
SIPP USERS’ GUIDE
When text copy applies to both 1996 and pre-1996 panel files, pre-1996 variable names appear in parenthesesfollowing 1996 variable names.
10-34
On the basis of the amounts accumulated, compute a mean amount within each of the 12 cells ofthe matrix. That mean amount is the topcode value shown in Table 10-19.
The amounts shown in Table 10-19 were computed with data from Wave 1. Current plans callfor using these amounts, adjusted for inflation and real growth in earned income by 1.019percent per wave for all remaining waves of the 1996 Panel. This is equivalent to an annualincrease of 5.8 percent. The mean amounts will not be recomputed from microdata for laterwaves. The formula to compute the topcode amounts for earned income in later waves is shownin Box 10-1.
The following three examples and Table 10-20 illustrate employment income topcoding:
l A black male software consultant works full time for the entire year and reports an annualsalary of $196,600. His salary income varies from month to month, however, sometimesdramatically. For this wave, it is $57,100, above the first test of $50,000. The earned incometopcode value for black males who work full time, full year is $17,530 (see Table 10-19:example 3, last column). That value will be used instead of the consultant’s reported monthlyearned income for the 1 month in which his earned income exceeded $12,500.
l A Hispanic female attorney normally works full time, the full year, with an annual income ofabout $300,000. In the middle of this wave, she has returned from a 6-month maternity leave;for the first 2 months of the wave, she has no earned income. Her income for the wave inquestion is $51,000, just over the threshold value of $50,000. The earned income topcodevalue for Hispanic women who work full time, full year is $24,015 (see Table 10-19:example 11, last column). That is the value that will be used as the attorney’s monthly earnedincome for the months in which her income exceeds $12,500.
l A white male psychiatrist spends the month of August at his beach house. While on vacation,he has no earned income. When he returns to the city in September his income returns to itsusual level of $20,000 for the next 3 months. His income for the wave is $60,000, exceedingthe $50,000 threshold. The earned income topcode for nonblack, non-Hispanic males is$38,270 (see Table 10-19: example 2, last column). That value is used for the 3 months thepsychiatrist reported income over $12,500, resulting in a total earned income for the wave of$114,810. That total, after topcoding, is substantially higher than $50,000.
l A white television actress does not work during her series’ hiatus. When the series is inproduction, she works full time. Her annual earned income is $880,000; her income for thewave in question is $160,000. She has earned nothing in the first 3 months of the wave, and$160,000 for the fourth month. The SIPP matrix topcode for nonblack, non-Hispanic womenwho work full time but less than full year is $49,450 for each month (see Table 10-19:example 8, last column). That value will be assigned for the 1 month of the wave in whichthe actress reported earned income.
USING THE CORE WAVE FILES
When text copy applies to both 1996 and pre-1996 panel files, pre-1996 variable names appear in parenthesesfollowing 1996 variable names.
10-35
Table 10-20 Example of Employment Income Topcoding in the 1996 Panel
Reported Monthly Income AmountsWorkerCharacteristics Income Month 1 Month 2 Month 3 Month 4
Sum for theWave
Reported $10,000 $10,000 $12,300 $ 24,800 $ 57,100Black, non-Hispanicmale, working fulltime, full year Topcoded $10,000 $10,000 $12,300 $ 17,530 $ 49,830
Reported $0 $0 $25,000 $ 26,000 $ 51,000Hispanic female,working full time,full year Topcoded $0 $0 $24,015 $ 24,015 $ 48,030
Reported $0 $20,000 $20,000 $ 20,000 $ 60,000Nonblack, non-Hispanic maleworking full time,part year
Topcoded $0 $38,270 $38,270 $ 38,270 $114,810
Reported $0 $0 $0 $160,000 $160,000Nonblack, female,not full year Topcoded $0 $0 $0 $ 49,450 $ 49,450
Topcoding Prior to the 1996 Panel
Prior to the 1996 Panel, the data dictionary indicates a topcode of $33,332 for monthly income;that is also the income topcode for the wave. That topcode is, therefore, rarely used for a singlemonth. In most cases, the monthly income is topcoded at $8,333 (one-fourth of $33,332), whichactually represents $8,333 or more. Individual amounts above $8,333 may occasionally beshown if the respondent’s income varied considerably from month to month. For example, if arespondent’s income from a single job was concentrated in only 1 of the 4 reference months,SIPP could show a figure as high as $33,332.
Summary income variables on the person, family, and household records are simply the sums ofthe component variables after they have been topcoded. The summary variables are notindependently topcoded. Thus, a person with high income from several sources (multiple jobs,businesses, property) could have aggregate monthly income well over the topcode for eachsource and yet SIPP could still be greatly understating the person’s true income.
As shown in Table 10-21, person 101 has wages topcoded. The person received considerablymore money in December than in the other months. In addition, total family income and totalhousehold income are the sum of the income amounts (in this case, WS1AMT+S01AMT) afterthey have been topcoded.
SIPP USERS’ GUIDE
When text copy applies to both 1996 and pre-1996 panel files, pre-1996 variable names appear in parenthesesfollowing 1996 variable names.
10-36
Table 10-21. Example of Topcoding in the Core Wave Files Prior to the 1996 Panel:Single Person Household
As described in Chapter 4, the Census Bureau often imputes information when a person does notrespond to the survey or to a particular question.
1. Prior to the 1996 Panel, the whole record may have been imputed because the person refusedto be interviewed (and no proxy interview was obtained) or because the person left thesample in the middle of the wave and no interview was conducted. If that happened, INTVWwill be 3 or 4.17
2. A variable of interest may be imputed. In the core wave files prior to the 1996 Panel, there isan allocation (imputation) flag for almost all of the person-level variables. Beginning withthe 1996 Panel, there is an allocation (imputation) flag associated with every variable subjectto imputation. For example, AEDUCATE is the allocation (imputation) variable thatidentifies whether EEDUCATE is imputed.
For labor force items, the Census Bureau uses the following special imputation procedures whena person has no current wave information indicating whether or not he or she worked during thereference period.18 If the Census Bureau can infer from what it knows about the previousreference period whether the person had a job or business at the start of the current period, theCensus Bureau carries out the following procedure:
1. If the person was working at the end of the prior wave, then labor force participation isimputed from a single donor for the complete current wave.
2. The Census Bureau then projects job characteristics for the person from the person’s priorwave through the current wave.
17 For cases in the 1996 Panel for whom prior wave information did not exist for a person-level noninterview (suchas in Wave 1 or in Waves 2–12 when the person was new to the sample), the whole record may have been imputed.To identify such cases, users need to check both person number (to distinguish wave of entry into the sample) andEPPINTVW, which will be 3 or 4 for these cases.18 Chapter 4 contains a discussion of how analysts can determine whether these special imputation procedures wereused.
USING THE CORE WAVE FILES
When text copy applies to both 1996 and pre-1996 panel files, pre-1996 variable names appear in parenthesesfollowing 1996 variable names.
10-37
3. Finally, the Census Bureau edits the job characteristics for consistency with the imputedlabor force participation variables.
This procedure is known as an EPPFLAG imputation, after the name of the variable thatindicates its use.
If a person was a nonworker in the prior wave or the Census Bureau cannot infer work status onthe basis of prior wave data, then the person’s work status is imputed. If the person is imputed asa worker in the reference period, the Census Bureau imputes the complete set of job/businesscharacteristics variables and labor force participation variables to the person from one donor, inorder to maintain consistency among the fields. That procedure is called a “little Type Z”imputation.
For some items in some cases, a direct logical or carryover imputation is made. The carryoverimputation takes the previous wave’s value for the item for the sample member and imputes it tothe current wave. That imputation is done particularly for items that rarely (or never) change fora sample member across waves (such as sex and race) or for items that change in predictableways (such as age).
Variables are imputed and the allocation (imputation) flags are set before composite variables arecreated. For example, if income is imputed for one member of a household, that person’sallocation (imputation) flag is set. However, total household income is computed after thatimputation; if any household member had any income imputed, then total household income isbased, in part, on imputed information. There is no direct indication on the records of otherhousehold members that any information has been imputed.
Because the edit and imputation procedures used in the core wave files and in the full panellongitudinal research files are different, data from the two sources will not always agree. SeeChapter 4 for a more detailed discussion of the SIPP edit and imputation procedures.
Using Weights
The core wave files include a number of alternative reference month weights for use in dataanalysis. Table 10-22 includes examples of the weights for the 1996 and the 1990–1993 Panelcore wave files. The choice of the appropriate weight for a given analysis depends on thepopulation of interest for that analysis—person, household, family, or related subfamily.Suggestions for which weights to use and how to use them are included in the source andaccuracy statements that accompany files ordered from the Census Bureau. Also, Chapter 8 ofthe Guide contains a full discussion of how to use weights in the core wave files.
SIPP USERS’ GUIDE
When text copy applies to both 1996 and pre-1996 panel files, pre-1996 variable names appear in parenthesesfollowing 1996 variable names.
10-38
Table 10-22. Weight Variables in SIPP Core Wave Files for the 1996 and 1990–1993 Panels
Variable Name DescriptionWPFINWGT (FNLWGT) Reference month, final weight of personWHFNWGT (HWGT0) Reference month, final weight of householdWFFINWGT (FWGT) Reference month, final weight of familyWSFINWGT (SWGT) Reference month, final weight of related subfamilyWPFINWGT (P5WGT)a Interview (5th) month, final weight of personWHFNWGT (H5WGT)a Interview (5th) month, final weight of householda Beginning with the 1996 Panel, SIPP files no longer include the interview month weights.
Identifying States
For the 1996 Panel, the variable TFIPSST identifies 45 states and the District of Columbia. Tohelp protect the confidentiality of respondents, the Census Bureau combined the remaining fivestates as follows:
1. Maine, Vermont; and
2. North Dakota, South Dakota, Wyoming.
The core wave files from panels prior to the 1996 Panel contain the variable HSTATE, whichidentifies 41 individual states and the District of Columbia; the nine other states are combinedinto three groups:
1. Maine, Vermont;
2. Iowa, North Dakota, South Dakota; and
3. Alaska, Idaho, Montana, Wyoming.
Even though it is possible to identify most states, the SIPP sample was not designed to berepresentative at the state level and should not be used to produce direct state-level estimates.The state variable is included on the public use files to allow examination of how state-levelcharacteristics affect national estimates. For example, a user could apply the state-specificeligibility criteria for a means-tested program in order to arrive at a national estimate of thenumber of people eligible for the program. Because some states are not uniquely identified, somemethod of allocating the state-specific eligibility rules to sample persons in those states wouldneed to be devised.
USING THE CORE WAVE FILES
When text copy applies to both 1996 and pre-1996 panel files, pre-1996 variable names appear in parenthesesfollowing 1996 variable names.
10-39
Identifying Metropolitan Areas
The core wave files include two variables useful in identifying metropolitan areas. The firstvariable, TMETRO (HMETRO), identifies residences located in metropolitan areas. It can beused to produce national estimates of the metropolitan population. However, it cannot be used toproduce estimates of the nonmetropolitan population. To protect respondent confidentiality, theCensus Bureau recoded and identified a small random sample of metropolitan households in thepublic use files as nonmetropolitan. The remaining metropolitan sample should still produce(approximately) unbiased estimates of the metropolitan population. However, the procedure“contaminates” the nonmetropolitan sample, and estimates of nonmetropolitan characteristicsbased on that sample will be biased (the magnitude of the bias depends on the specific analysisbeing performed).
A second variable, TMSA (HMSA), identifies 93 MSAs (Metropolitan Statistical Areas) andCMSAs (Consolidated Metropolitan Statistical Areas), as defined by the Office of Managementand Budget.
This chapter discusses procedures for working with data from the topical module public use filesfrom the Survey of Income and Program Participation (SIPP). The chapter begins by describingthe documentation that accompanies the topical module public use files obtained from theCensus Bureau. The discussion then turns to the data files themselves. The data file structure isdescribed, and detailed explanations are provided about how to use the topical module files whenperforming common tasks. Those tasks include:
! Using the monthly interview status variables;
! Identifying people, households, and families;
! Using imputation flags; and
! Identifying states and metropolitan areas.
Before reading this chapter, users should read Chapter 9, �The SIPP Public Use Files,� for anintroduction to Section II. Analysts using only one topical module file also should read about theuse of sample weights (Chapter 8) and the computation of standard errors (Chapter 7). Thoseplanning on merging data from a topical module to data from the core wave or full panel filesshould also read Chapter 10 for information about the core wave files, Chapter 12 forinformation about the full panel files, and Chapter 13 for information about linking SIPP publicuse files.
This chapter focuses on the topical module files. It is written so that it can be used independentlyof the chapters describing the core wave and full panel files. Although there are many similaritiesacross the three types of SIPP public use data files, important differences do exist. Because thosedifferences are sometimes subtle, users familiar with the core wave and full panel files shouldread this chapter carefully, paying close attention to information about variable names and filestructures. Tables 9-2 and 9-3 summarize the differences between the core wave, topical module,and full panel longitudinal research files.
For the 1996 Panel, most variable names changed from those used in previous panels. To aidusers working with files from panels prior to 1996, this chapter presents both the old and the newvariable names when the text applies to both 1996 and pre-1996 panel files. In the main body ofthe text, the old names are presented in parentheses following the new names. For example, thesample unit ID variable name, which is SSUID in the 1996 Panel, was SUID in previous panels;it is written in this chapter as SSUID (SUID). In tables, a variety of methods are used to presentboth the old and the new names.
Using the Technical Documentation of theUsing the Technical Documentation of theUsing the Technical Documentation of theUsing the Technical Documentation of theTopical Module FilesTopical Module FilesTopical Module FilesTopical Module Files
Each data file received from the Census Bureau comes with a set of technical documentation anda data dictionary. The technical documentation includes:
! The item booklets (for the 1996 Panel);
! The paper survey instrument (for panels prior to 1996);
! A glossary of selected terms;
! A cross-walk, mapping reference months into calendar months for each rotation group;
! A source and accuracy statement describing the sample weights and the computation ofstandard errors; and
! User Notes.
The survey instrument is vital to understanding what questions were asked, how they were asked,the order in which they were asked, to whom they were asked, and the way in which the answerswere recorded. Some questions employ skip patterns (Chapter 3), so users should pay particularattention to which questions were skipped for which respondents. The skip patterns are bestunderstood by consulting the survey instruments. With the introduction of computer-assistedinterviewing (CAI) in the 1996 Panel, questionnaire documentation is now available from theSIPP Web site (http://www.sipp.census.gov/sipp/).
The source and accuracy statements provide information about the weights on the files, whenand how to make adjustments to the weights, and one approach to computing standard errors forsome common types of estimates. More detailed discussions of those topics are provided inChapters 7 and 8 of this Guide.
The data dictionary provides a detailed description of each variable on the file. It describes fouraspects of each variable:
1. The definition,
2. The sample universe of the corresponding survey question,
3. The ranges for all legal values, and
4. The location (and size) in the file.
A machine-readable version of the data dictionary accompanies each data file. It can also bedownloaded from the Internet (http://www.sipp.census.gov/sipp/).
The data dictionary is formatted to facilitate processing by user-written computer programs. Theupper panel of Figure 11-1 shows an excerpt from the data dictionary for the topical modulefrom Wave 1 of the 1996 Panel. A �D� in the first column signifies that the next few lines definethe variable: (1) the variable name; (2) the size (i.e., how many digits it contains); (3) the startingposition; and (4) the definition. Lines beginning with a �T�, added with the 1996 Panel, containshort variable descriptions that can be used by many software packages as variable labels.
Figure 11-1. Excerpt from the Data Dictionary for the Topical Module FilesWave 1 of the 1996 SIPP Panel
Wave 1 of the 1996 SIPP Panel
D EENTAID 3 45
T PE: Address ID of hhld where person entered Sample
Address ID of the household that this person belonged to at the time this
person first became part of the sample. Address ID in a specific wave should
never be greater than (WAVE * 10 + 9).
U All persons
V 11:129 .Entry address ID
D EPPPNUM 4 48
T PE: Person number
Person number. This field differentiates persons within the sample unit.
Person number is unique within the sample unit across all waves of a panel.
Person number for a specific wave should never be greater than
(WAVE * 100 + 99).
U All persons
V 101:1299 .Person number
D EPOPSTAT 1 52
T PE: Population status based on age in fourth ref. Month
Population status. This field identifies whether or not a person was
eligible to be asked a full set of questions, based on his/her age in
the fourth month of the reference period.
U All persons
V 1 .Adult (15 years of age or older)
V 2 .Child (Under 15 years of age)
D EPPINTVW 2 53
T PE: Person’s interview status at time of interviewU All persons
V 1 .Interview (self)
V 2 .Interview (proxy)
V 3 .Noninterview - Type Z
V 4 .Nonintrvw - pseudo Type Z. Left sample during the reference
Figure 11-1. Excerpt from the Data Dictionary for the Topical Module Files (continued)
Wave 3 of the 1993 SIPP Panel
D ENTRY 2 30
Entry address ID
Address of the household that person belonged to at the time person
first became part of the sample
U All persons, including children
D PNUM 3 32
Person number
U All persons, including children
D FILLER 3 35
Filler
D FINALWGT 9 38
Person weight (interview month)
There are four implied decimal places.
U All persons, including children
A �U� in the first column signifies that the next words describe the sample universe.1 A �V� inthe first column indicates that the next number and phrase describe one of the values of thevariable. A blank in the first column denotes either a variable description or other comment. Aperiod (.) before a word denotes the start of the value label.
Prior to the 1996 Panel, the dictionaries had a different format, shown in the second panel ofFigure 11-1. A �D� in the first column signifies that the next few lines define the variable: (1) thevariable name; (2) the size (i.e., how many digits it contains); (3) the starting position; and (4)the definition. A �U� in the first column signifies that the next words describe the sampleuniverse.2 A �V� in the first column indicates that the next number and phrase describe one ofthe values of the variable. An asterisk in the first column denotes a comment. A period (.) beforea word denotes the start of the value label.
Figure 11-2 shows sample SAS and FORTRAN syntax for reading the data described by thecodebook fragments in Figure 11-1. Additional SAS program code could be used to associatevalue labels (a SAS �format�) with the INTVW variable.
1 The universe definitions included in the data dictionaries prior to the 1996 Panel were not always accurate. Usersof pre-1996 SIPP Panels should check the skip patterns in the actual survey questionnaire to determine which subsetof respondents was asked each question.2 See footnote 1.
Relationship of the Topical Module Data Files toRelationship of the Topical Module Data Files toRelationship of the Topical Module Data Files toRelationship of the Topical Module Data Files tothe Survey Instrumentthe Survey Instrumentthe Survey Instrumentthe Survey Instrument
Each wave�s survey instrument includes one or more topical modules,3 as described in Chapter 3.The questions in those modules are often asked after the core survey questions and can be foundtoward the end of the survey instrument. The data from the topical modules are usually combinedinto one topical module data file for each SIPP wave.
The topical module data dictionary does not replicate the survey instrument. Thus, analystsshould keep a few things in mind when using the data:
! The variables on the data files do not correspond one-to-one with the questionnaire items�the variables are listed in a different order, some are not included in the public use files, andsome are created from a combination of other variables;
! The range of possible values of the variables on the data files does not always correspondone-to-one with the response categories shown on the survey instrument or in the datadictionary;
! The variable name in the data dictionary may not readily indicate the variable�s content;
! Prior to the 1996 Panel, some variable names were used in different topical module files fordifferent variables. For example, in the 1990 Panel, TM8400 was used in the Wave 2 topicalmodule for a variable that indicates whether the respondent completed 12th grade. The samevariable name was used in the Wave 6 topical module to indicate whether the respondent wasa parent of children under 21 years of age living in the respondent�s household.
! The complexity of the skip patterns may not be apparent just by looking at the datadictionary. Many questions were administered only to the household reference person, or toadults (age 15 years or older), or to people 25 years or older, or to some other subset ofsurvey respondents.4
To avoid potential problems and confusion, analysts should become familiar with the surveyinstrument before using the data. When working with the data, refer to both the surveyinstrument and the data dictionary.
3 Prior to the 1992 Panel, there were no topical modules administered with the Wave 1 interview, although sometopical content was included in the Wave 1 core questionnaire for the purpose of obtaining historical information.As of the 1992 Panel, Wave 1 has had topical modules.4 The universe definitions included in the data dictionaries prior to the 1996 Panel were not always accurate. Usersof pre-1996 SIPP panels should check the skip patterns in the actual survey questionnaire to determine which subsetof respondents was asked each question.
Structure of the Topical Module FilesStructure of the Topical Module FilesStructure of the Topical Module FilesStructure of the Topical Module Files
The topical module files for the 1996 Panel contain one record for each person who was in thesample with a completed (or imputed) interview in the fourth month of the wave�s referenceperiod (the month immediately prior to the interview). This arrangement is similar to the person-month format of the core wave files, but only records for month four are included in the topicalmodule files. Prior to the 1996 Panel, the topical module files contained one record for eachperson who was interviewed or for whom an interview was attempted in that wave (Table 11-1shows one record for each such person; compare with Table 10-1, which shows up to fourrecords per sample person in the core wave files).5
In general, each topical module file contains data for all of the topical module subject areasadministered during a particular wave.6 Each topical module file also contains selectedinformation from the SIPP core; thus, for some analyses, those files can be used independentlyfrom the core wave and full panel data files. When more detailed information from the SIPP coreis needed, data from the topical modules must be merged with data from the core wave or fullpanel files. Chapter 13 provides a detailed discussion of merging SIPP files.
Table 11-1. Example of the Topical Module File Structure
5 The variables shown�sample unit ID, current address ID, entry address ID, and person number�are discussed indetail later in this chapter.6 Chapter 3 offers a detailed listing of the topical modules administered with each wave of each SIPP panel.
The topical module file structure differs from that of the core wave files in the following ways:
! For the 1996 Panel, the topical module files contain one record for each person who was aSIPP sample member during month four of the wave; the core wave files contain one recordper person for each month the person is in the sample.
! Prior to the 1996 Panel, the topical module files contain one record per person for eachperson present in a SIPP household at the time of the interview; the core wave files containone record per person for each month the person was in the sample during the previous 4months.
! Prior to the 1996 Panel, the topical module files include records for people whose entirehousehold refused to be interviewed or left the sample;7 those people are excluded from thecore wave files.
! Prior to the 1996 Panel, the structure of the topical module files was roughly similar to that ofthe full panel files, containing one record per person.
Reference Periods and SamplesReference Periods and SamplesReference Periods and SamplesReference Periods and Samples
Sample definitions and reference periods in the topical modules vary across panels, acrosstopical modules within panels, and even within topical modules. Users should pay carefulattention to those details in the topical module files they are using.
In the 1996 Panel, most topical module questions were asked only of people who were in theSIPP sample during the fourth month of the wave�s reference period. People who were membersof SIPP households at the time of the interview (month five) but who were not members of SIPPhouseholds during the previous month were not asked the topical module questions in the 1996Panel. In the 1996 Panel, many of the questions refer to just that month (month four). However,some topical module questions, and in some cases entire topical modules, refer to longer periodsof time, such as the previous 4 months, the previous year, or, in the various history topicalmodules administered with Wave 1, the person�s life before SIPP.
Prior to the 1996 Panel, most topical module questions were asked of people who were in theSIPP sample at the time of the interview (month five). This included people who were householdmembers at the time of the interview but who were not members of SIPP households at any timeduring the previous 4 months, the reference period for SIPP core questions in that wave.8 Manyquestions asked about �current� (month five) conditions, although some asked about longerperiods in the past.
7 7 Panels that included topical modules in Wave 1, such as the 1993 and 1996 Panels, exclude those people fromthe Wave 1 topical module files.8 This has important implications for procedures used to merge the topical modules to data from the core. Core datathat correspond to the same reference month as a topical module must often be merged from the subsequent waverather than from the same wave as the topical module, as discussed in Chapter 13.
Using a Person’s Monthly Interview StatusUsing a Person’s Monthly Interview StatusUsing a Person’s Monthly Interview StatusUsing a Person’s Monthly Interview StatusVariablesVariablesVariablesVariables
A person�s monthly interview status variable is used to determine whether the data for thatperson in a given month should be used. Some analysts refer to it as the in sample variable todistinguish it from the household interview status variable, EOUTCOME (ITEM36B), andanother variable that indicates the type of interview or noninterview for the person, EPPINTVW(INTVW). The interview status variable has three possible values: 0, 1, and 2. A value of 1indicates that the person was both in-scope for the survey (a member of the population that theSIPP sample is intended to represent) and, aside from some item nonresponse, providedcomplete answers to the SIPP core questions for the reference month in question.9
Monthly Interview Status in the Topical Module FilesMonthly Interview Status in the Topical Module FilesMonthly Interview Status in the Topical Module FilesMonthly Interview Status in the Topical Module Filesfrom the 1996 Panelfrom the 1996 Panelfrom the 1996 Panelfrom the 1996 Panel
There is only one interview status variable in the topical module files from the 1996 Panel. Thatvariable, EPPMIS4, identifies a person�s status in the fourth reference month of the wave.Because the topical module files from the 1996 Panel contain records only for people for whomthis variable is equal to 1 (and so equals 1 on all records in the file), EPPMIS4 can be safelyignored when working with topical module files from the 1996 Panel.
Monthly Interview Status in the Topical Module FilesMonthly Interview Status in the Topical Module FilesMonthly Interview Status in the Topical Module FilesMonthly Interview Status in the Topical Module Filesfrom Panels Prior to 1996from Panels Prior to 1996from Panels Prior to 1996from Panels Prior to 1996
The topical module files for panels prior to 1996 are different. On those files, a person�sinterview status variable is labeled PP-MIS1, PP-MIS2, PP-MIS3, PP-MIS4, and PP-MIS5.These variables refer to the four reference months of the wave (PP-MIS1 to PP-MIS4) and theinterview month itself (PP-MIS5).
The monthly interview status is the only reliable guide to whether the data for a given personshould be used in a given month. Analysts should use data for only those months in which aperson�s interview status (PP-MIS) is equal to 1.10
9 The only exception is for Type Z noninterviews. For Type Z noninterviews prior to the 1996 Panel, completerecords for the SIPP core were imputed and the monthly interview status variable was set to 1, indicating that, formost analytic purposes, the responses should be treated as though they were provided by the respondent. Thisexception is handled similarly in the 1996 Panel when there is no prior wave information. When prior waveinformation exists, items are imputed using the same hot-deck methods applied to instances of item nonresponse.10 As a safeguard against inadvertently using data for months when PP-MIS is not equal to 1, all monthly variablesin the user�s data extract should be set to a missing value for months when PP-MIS is not equal to 1. Most statisticalpackages allow certain values to be flagged as missing. Once flagged, those values are excluded from computations.
Any data present for months when a person�s interview status is coded either 0 or 2 should beignored. A code of 0 indicates that the person was not in the sample that month, and a code of 2indicates a noninterview for that month.
On the topical module files for panels prior to 1996, the topical module questions were askedonly of sample members with PP-MIS5 equal to 1:11 that is, the topical module questions wereasked only of those who were in the SIPP sample at the time of the interview. Because thereference periods of the topical module questions vary, some topical module questions containinformation about people who had been secondary sample members during previous months,even though they were no longer part of the SIPP sample at the time of the interview. Thevariables PP-MIS1 to PP-MIS4 are useful when working with topical module questions that referto previous months. The four variables are also useful when merging topical module data withdata from the core, a topic discussed in Chapter 13.
Four sample members are shown in Table 11-2. Two were present in the interview month (PP-MIS5 = 1), and two were not present (PP-MIS5 = 2). Analysts interested in just the interviewmonth should use data only for people with PP-MIS5 = 1. In this example, only persons 101 and201 would be included.
Table 11-2. Monthly Interview Status Variables in the 1984-1993 SIPP Panels
If the research focuses on January, analysts should use data only for people with PP-MISx = 1,where x corresponds to the reference month that contains information about January (whichvaries by wave and rotation group). Assuming an analyst is interested in January 1994, theexample represents Wave 4 and rotation group 1 of the 1993 Panel (see Table 11-3 for thereference months); the analyst would use only the people with PP-MIS1 = 1. Thus, only persons101 and 102 would be included.
Table 11-3. Interview Month and Reference Months for Each Rotation Groupin Wave 4 of the 1993 Panel
Rotation Group Reference Months for Core Questions Interview Month2 Oct., Nov., Dec. 1993; Jan. 1994 Feb. 19943 Nov., Dec. 1993; Jan., Feb. 1994 Mar. 19944 Dec. 1993; Jan., Feb., Mar. 1994 Apr. 19941 Jan., Feb., Mar., Apr. 1994 May 1994
11 In some cases, questions are asked of all household members over 14 years old. In other cases, they may be askedonly of the household reference person. There are also topical modules in which other subsets of householdmembers are interviewed.
As demonstrated by this example, the topical module files for panels conducted before 1996contain a record for each person for whom no interview data were collected, either because theperson refused to be interviewed (and no proxy interview was obtained) or because the personleft the survey sample (e.g., died or entered the Armed Forces or an institution). Thoseindividuals have PP-MIS5 = 2 and PP-MISj = 1 for j = 1, 2, 3, or 4 or INTVW = 3 or 4. Theirdemographic information was gathered from the previous time that they were successfullyinterviewed; if they have topical module information, it was completely imputed by the CensusBureau.
Comparison of Variables in the Topical ModuleComparison of Variables in the Topical ModuleComparison of Variables in the Topical ModuleComparison of Variables in the Topical Moduleand Core Wave Filesand Core Wave Filesand Core Wave Filesand Core Wave Files
The topical module files contain a number of variables that are also present in the core wavefiles. These include variables needed to identify the household and the person. Also included areselected background (demographic) characteristics. In the 1996 Panel, the values for thebackground characteristics correspond to the month-four values in the core wave file for thesame wave for the 1996 Panel. Variables common to the core wave and topical module files aregenerally given the same names in both files. For example, SSUID is used for the sample unitidentifier, SHHADID is the current address ID, and EPPPNUM is the person number on bothfiles.12 Among the background variables, TAGE is used on both files for the respondent�s age,and EMS is used for the respondent�s marital status. Table 11-4 shows the 27 variables that arecommon to the core wave file and topical module file from Wave 1 of the 1996 Panel.
Prior to the 1996 Panel, the demographic data on the topical module files corresponded to theinterview month (month five), not to any of the 4 reference months for the core interview. Forthat reason, the information in variables such as AGE, RRP, and MS (the respondent�s age,relationship to the household reference person, and marital status) could differ from the corewave file variables of the same names for the wave in which the topical module wasadministered. This would indicate that a change occurred between the last month of the referenceperiod (month four) and the interview month (month five). Some variables included on both thecore wave and topical module files have different names. As shown in Table 11-5, sample unitID, rotation group, state, interview status in month five, and the person-level weight arecontained in both files but have different variable names.
12 Use of common names facilitates merging of the core wave and topical module files from the 1996 Panel.Merging files is discussed extensively in Chapter 13.
Table 11-4. Variables Common to the Core Wave and TopicalModule Files from Wave 1 of the 1996 Panel
VariableName DescriptionEEDUCATE Highest degree received or gradeEENTAID Address ID of household where person enteredEMS Marital statusEORIGIN Origin of this personEOUTCOME Interview status code for this householdEPNDAD Person number of fatherEPNGUARD Person number of guardianEPNMOM Person number of motherEPNSPOUS Person number of spouseEPOPSTAT Population status based on ageEPPINTVW Person�s interview statusEPPPNUM Person numberERACE Race of this personERRP Household relationshipESEX Gender of this personRDESGPNT Designated parent or guardian flagRFID Family ID number for this monthRFID2 Family ID excluding related subfamilySHHADID Household address ID�differentiates householdsSPANEL Sample code�indicates panel yearSROTATON Rotation of data collectionSSUID Sample unit identifierSSUSEQ Sequence number of sample unit � primarySWAVE Wave of data collectionTAGE Age as of last birthdayTFIPSST FIPS state codeWPFINWGT Person weight
Table 11-5. Examples of Same Variables with Different Names in theCore Wave and Topical Module Files Prior to the 1996 Panel
DescriptionVariable Name in theCore Wave File
Variable Name in theTopical Module File
Sample unit ID SUID IDRotation group ROT ROTATIONState of residence HSTATE STATEMonthly interview status in the interview month MIS5 PP-MIS5Person-level weight in the interview month P5WGT FINALWGT
Identifying PeopleIdentifying PeopleIdentifying PeopleIdentifying People
There are many occasions when it is necessary to identify which records belong to eachindividual in the SIPP data files. This need arises, for example, when
! Merging data from topical module files to data from the core wave or full panel files,
! Merging data from two or more topical module data files,
! Linking husbands and wives, and
! Linking parents and children.
In the 1996 Panel, two variables are needed to uniquely identify a person: the sample unit ID andthe person number.13 For files from panels prior to 1996, three variables are needed to uniquelyidentify a person: the sample unit ID, entry address ID, and person number. Table 11-6 showsthe variable names used in the topical module files for the 1996 Panel and for the pre-1996Panels.
Table 11-6. Variables Used to Uniquely Identify a Person in theTopical Module Files
Variable Name DescriptionSSUID (ID) Sample unit IDEENTAID (ENTRY) Entry address ID (not needed in the 1996 panel)EPPPNUM (PNUM) Person number
The variables can be described as follows:
! SSUID (ID) uniquely identifies each initially sampled dwelling unit.14 Every person in a corewave file was either a member of one of those units (an original sample member) or liveswith someone who was a member of an initially sampled dwelling unit. A person�sconnection to that unit is an attribute of that person and does not change over time.15 Thismeans that as people move from address to address, their SSUID (ID) stays the same. As newpeople join the homes of original sample members, they receive the SSUID (ID) of theoriginal sample members.
13 Users should note that in the 1996 Panel, the entry address ID is no longer needed for unique identification. Itscontinued use will not create any problems; it is simply redundant information. That is a change from earlier panels,in which the entry address ID was key to uniquely identifying a person.14 The SSUID (ID) is a random recode of three other variables in the Census Bureau�s internal (not public use) files:the respondent�s sampling area (primary sampling unit), the cluster of housing units within that area (called the�segment�), and a sequentially assigned serial number. Those three variables are omitted from the public use files toprotect the confidentiality of the respondents.15 There is one rare exception to this rule for panels prior to 1996, which is described in the section entitled�Identifying Movers� later in this chapter.
! EENTAID (ENTRY) identifies the address where the person lived at the time he or she wasfirst interviewed. It does not change even if the person moves.16 Prior to the 1996 Panel, itwas used in conjunction with the person number and the sample unit ID to uniquely identifypeople within the sampling unit. It is not needed to uniquely identify people in the 1996Panel. Values for this variable are unique only within sample units. The entry address ID hastwo components. The first part of the ID number (two digits in the 1992 and 1996 Panels,and one digit in all others) identifies the wave in which SIPP interviews were first conductedat the address. The second part of the number (one digit in all panels) sequentially numbersaddresses within a sample unit [SSUID (ID)] that enter the sample in the same wave. SeeChapter 10 for a more complete discussion.
! Prior to the 1996 Panel, PNUM uniquely identified a person within the sample unit and entryaddress ID. In the 1996 Panel, EPPPNUM uniquely identifies a person within the sampleunit. EPPPNUM (PNUM) does not change even if the person moves.17 The first part ofEPPPNUM (PNUM) (two digits in the 1992 and 1996 Panels, and one digit in all others)indicates the wave in which the person was first interviewed.18 The remaining two digits aresequentially assigned within the household. Thus, original sample members are assignedperson numbers ranging from 100 to 199. Individuals who enter the SIPP sample in Wave 2are assigned a person number ranging from 200 to 299. Those who enter in Wave 10 areassigned person numbers ranging from 1001 to 1099.
Table 11-7 illustrates how the combination of SSUID (ID), EENTAID (ENTRY), andEPPPNUM (PNUM) uniquely identifies people and provides information about when they firstentered the SIPP sample. In this example, there are eight individuals: five are original samplemembers, one person joined the SIPP sample in Wave 4, one person joined in Wave 7, and oneperson joined in Wave 10.
To uniquely identify a household or group quarters in the topical module files, analysts shoulduse the two variables shown in Table 11-8.
People with the same SSUID (ID) (sample unit ID) and SHHADID (ADDID) (current addressID) values live in the same household (or group quarters location) in the relevant month. For the1996 Panel, household membership refers to month four of the wave�s reference period. Forpanels prior to 1996, household membership refers to the interview month. The eight individualsshown in Table 11-9 make up four households. The first household contains the first fourindividuals. The second household contains one person. The third household contains oneperson. The fourth household contains two people. (Users may find it helpful to refer to Figure2-1 [pp. 2-10-2-14], which illustrates the concepts of household and changes in household.)
16 16 See footnote 7.17 For cases in the 1996 Panel for whom prior wave information did not exist for a person-level noninterview (suchas in Wave 1 or in Waves 2�12 when the person was new to the sample), the whole record may have been imputed.To identify such cases, users need to check both person number (to distinguish wave of entry into the sample) andEPPINTVW, which will be 3 or 4 for these cases.18 Chapter 4 contains a discussion of how analysts can determine whether these special imputation procedures wereused.
The term family, as used in Census Bureau publications, refers to a group of two or more peoplerelated by birth, marriage, or adoption who reside together; all such individuals are consideredmembers of one family.
The Census Bureau distinguishes among several types of families:
! A primary family is a family containing the household reference person and all of his or herrelatives. This means that a household composed of a husband and wife, their son, and theirson�s wife (i.e., the daughter-in-law) is classified as a primary family containing four people.
! A related subfamily is a nuclear family that is related to but does not include the householdreference person. For example, the son and his wife (i.e., the daughter-in-law) in thepreceding example are a related subfamily.
! An unrelated subfamily (sometimes called a secondary family) is a nuclear family that is notrelated to the household reference person. Thus, a husband and wife who live in a friend�shouse are classified as an unrelated subfamily. A mother and daughter who live in themother�s boyfriend�s apartment are classified as an unrelated subfamily.
! A primary individual is a household reference person who lives alone or lives with onlynonrelatives. Primary individuals are sometimes treated by the Census Bureau as families ofonly one person and are referred to as pseudo-families.
! A secondary individual is not a household reference person and is not related to any otherpeople in the household. Secondary individuals are sometimes treated by the Census Bureauas families of only one person and are referred to as pseudo-families.
In the topical module files for the 1996 Panel, the variables shown in Table 11-10 can be used touniquely identify families.
Table 11-10. Variables Used to Uniquely Identify a Family in theTopical Module Files for the 1996 Panel
Variable Name DescriptionSSUID Sample unit IDSHHADID Current address IDand one of the following:RFID Family ID in month four of the waveRFID2 Family ID in month four (excluding related subfamily members; RFID2=0
for related subfamily members)
The Census Bureau has two principal methods for distinguishing families that are based on thevariables and numbering schemes shown in Table 11-10. Analysts must remember to choosewhich type of family classification they want and then use the appropriate method.
! The first method defines a family as all persons who are related and living together. Thefamily ID variable RFID is used with this definition. RFID groups the household referenceperson with all related household members by assigning them the same ID number. Thisfamily group corresponds to the Census Bureau�s definition of primary family. RFID groupsmembers of each unrelated subfamily (and primary and secondary individuals) separately.
! The second method is similar to the first in defining a family, but the family excludes relatedsubfamilies. The family ID variable RFID2 is used with this definition. RFID2 equals zerofor related subfamilies. RFID2 groups members of each unrelated subfamily (and primaryand secondary individuals) in the same way as RFID�each group has a unique number.19
Table 11-11 illustrates the difference between the RFID and RFID2 variables. Those variablesrefer to month four of the wave�s reference period. For example, a mother, a father, and a childwould be family 1 (RFID = 1). The first household in the table contains a primary family of fivepeople. The primary family contains members of related subfamilies. However, the topical
19 The variables included on the topical module files do not allow analysts to distinguish among different relatedsubfamilies living in the same household. If needed, the RSID variable (which groups each related and unrelatedsubfamily separately) can be merged from the core wave files. Chapter 10 discusses the core wave files, and Chapter13 discusses the merging of multiple SIPP files.
Three households formed by peoplewho were originally members of thesame originally sampled household(SSUID of 110077777723). Twosubfamilies split off from the originalhousehold to become two new primaryfamilies at addresses 21 and 22.
This household contains a primaryindividual and an unrelated subfamily.
610000000123 32 1 1 0101 Primary individual.
897454644123 11 1 1 0101897454644123 11 2 2 0102
Group quarters with two secondaryindividuals.
module files for the 1996 Panel do not contain the variables needed to determine whether allsubfamily members are members of the same subfamily. To determine that, an analyst wouldneed to merge the RSID variable from the month four records in the core wave file.
The second �household� is actually three households, each containing a primary family, thatoriginally formed one household. The third household contains a primary family and twounrelated subfamilies. The fourth household contains a primary family and two unrelatedsubfamilies. The fifth household contains a primary individual and an unrelated subfamily. Thefifth household contains only a primary individual. The sixth household is a group quarterscontaining two people.
The topical module files contain several additional variables from the SIPP core that describehousehold and family composition.20 The household composition variables included in thetopical module files from the 1996 Panel and from panels prior to 1996 are shown in Table11-12. Additional variables from the core wave files and the full panel files can be merged withdata from the topical module files when added detail is needed (Chapters 10, 12, and 13).
Table 11-12. Household and Family Composition Variables in theTopical Module Files
1996 PanelVariable Name DescriptionERRP Relationship to household reference person in month fourEMS Marital status in month fourEPNMOM Person number of mother in month fourEPNDAD Person number of father in month fourEPNGUARD Person number of guardian in month fourEPNSPOUS Person number of spouse in month fourRDESGPNT Designated parent or guardian in month four
Panels Prior to 1996RRP Revised relationship to the household reference person (living
with relatives, child of household reference person, etc.)PNSP Person number of spousePNPT Person number of parent
Using the Relationship to Reference PersonUsing the Relationship to Reference PersonUsing the Relationship to Reference PersonUsing the Relationship to Reference Person[ERRP (RRP)] Variable[ERRP (RRP)] Variable[ERRP (RRP)] Variable[ERRP (RRP)] Variable
As Table 11-13 shows, ERRP (RRP) provides a summary description of how each individual isrelated to the household reference person.21
20 Detailed information about the relationships between members is collected in the Household Relationships topicalmodule. For the 1996 Panel, those data provide extensive information about household composition during monthfour of the wave�s reference period. For earlier panels, the topical module provides information about householdcomposition at the time of the interview.21 Prior to the 1996 Panel, the RRPU variable, available in the core wave files, provides additional detail notcontained in the RRP variable. When needed, RRPU can be merged to data from the topical module files (Chapters10 and 13).
Table 11-13. Relationship to the Household Reference Person in the Topical Module Files
1996 PanelERRP Description 1 Reference person w/related people in household 2 Reference person w/out related people in household 3 Spouse of reference person 4 Child of reference person 5 Grandchild of reference person 6 Parent of reference person 7 Brother or sister of reference person 8 Other relative of reference person 9 Foster child of reference person10 Unmarried partner of reference person11 Housemate or roommate12 Roomer or boarder13 Other nonrelative of reference person
Panels Prior to 1996Revised Relationship tothe HouseholdReference Person (RRP) Description 1 Household reference person, living with relatives 2 Household reference person, living alone or with nonrelatives 3 Spouse of household reference person 4 Child of household reference person 5 Other relative of household reference person 6 Nonrelative of household reference person, but related to other members of the household 7 Nonrelative of all members of the household
The ERRP (RRP) variable contains summary information about each person�s relationship to thehousehold reference person. Analysts should bear in mind that the household descriptiondepends upon the identity of the household reference person. For example, the household inTable 11-14 contains a mother, her daughter, and her daughter�s son. If the mother is thehousehold reference person [ERRP = 1 (RRP = 1)], her daughter is listed as a child of thehousehold reference person [ERRP = 4 (RRP = 4)] and the daughter�s son is listed as agrandchild of the reference person in the 1996 Panel (ERRP = 5), but as another relative of thehousehold reference person in earlier panels (RRP = 5, but the same value has a differentmeaning from that of the 1996 Panel variable). If the daughter is the reference person, her son islisted as a child of the household reference person (RRP = 4) and her mother is listed as theparent of the reference person in the 1996 Panel (ERRP = 6), but as another relative of thehousehold reference person in earlier panels (RRP = 5).22 Users should note that the identity ofthe household reference person can change from one month to the next; thus, the householddescription could also change.
22 Because it is impossible to anticipate all of the different living arrangements found in SIPP sample households,and in some cases more than one rule for identifying a reference person may apply, some interviewer discretion inidentifying the reference person is inevitable. For that reason, the resulting choices can sometimes appear somewhatarbitrary to the analyst.
Table 11-14. ERRP (RRP) Coding for the Same Three-Generation Household When TwoDifferent People Are Designated as the Reference Person in the Topical Module Files
DesignatedReferencePerson
Relationship to theHousehold ReferencePerson [ERRP (RRP)] Meaning of ERRP (RRP) Value
Mother as Household Reference PersonMother 1 (1) Reference person (Reference person)Daughter 4 (4) Child of reference person (Child of reference person)Daughter�s son 5 (5) Grandchild of reference person (Other relative of reference person)Daughter as Household Reference PersonMother 6 (5) Parent of reference person (Other relative of reference person)Daughter 1 (1) Reference person (Reference person)Daughter�s son 4 (4) Child of reference person (Child of reference person)
Identifying a Person’s Spouse, Parent, or GuardianIdentifying a Person’s Spouse, Parent, or GuardianIdentifying a Person’s Spouse, Parent, or GuardianIdentifying a Person’s Spouse, Parent, or Guardian
Four other variables on the topical module files from the 1996 Panel can be used to describehousehold and family composition. They are EPNSPOUS, EPNDAD or EPNMOM, andEPNGUARD. These variables identify the person number of the spouse, the father or mother(just one parent is identified in files from panels prior to 1996), and guardian of the person,respectively. On the topical module files from panels prior to 1996, only two variables are found:PNPT and PNSP, the person numbers of the person�s parent and spouse, respectively. In eachcase, the relative is identified only if she or he is living at the same address as the person.
By building from these variables, the analyst can identify a variety of family configurations. Forexample, these variables can be used to identify households containing three generations. Table11-15 displays one household containing a mother and her two children. One child, EPPPNUM= 0102 (PNUM = 102), has a son; the other child, EPPPNUM = 0104 (PNUM = 104), has aspouse.
More About Using the SIPP ID Variables:More About Using the SIPP ID Variables:More About Using the SIPP ID Variables:More About Using the SIPP ID Variables:Identifying MoversIdentifying MoversIdentifying MoversIdentifying Movers
Most of the SIPP topical modules collect information that pertains to a single month�generallymonth four of the wave�s core reference period in the 1996 Panel, and month five (the interviewmonth) for prior panels. However, some topical modules collect information about longerreference periods, most commonly either the previous 4 months (the same period as the corequestions but often not with monthly resolution), the year prior to the interview (e.g., some itemsin the child and adult well-being topical modules), or the prior calendar year (e.g., the annualincome and retirement accounts topical module of the 1996 Panel). In instances such as these, it
is sometimes useful to know something about household composition during the reference periodof the topical module.23 This section of the Users� Guide is primarily for users who need to knowhow to access that kind of information. This section may also be helpful to those who wish togain a better understanding of the SIPP ID variables for other reasons.
When a person moves, the current address field, SHHADID (ADDID), changes. The SSUID(ID), EENTAID (ENTRY), and EPPPNUM (PNUM) values remain the same. The first part (twodigits in the 1992 Panel and the 1996 Panel, one digit in all others) of SHHADID (ADDID)indicates the wave in which a household is first interviewed at that new address. The remainingdigit sequentially numbers the households that split into two or more households, as a result of amove to a different location by original sample members. Thus, new addresses in Wave 2 arenumbered 021 (21), 022 (22), and so on. New addresses in Wave 3 are numbered 031 (31), 032(32), and so on.
23 For example, a person who joined the SIPP sample in Wave 4 of the 1996 Panel could not have contributed to thehousehold income (at least not as a household member) of the prior calendar year.
Table 11-16 shows that persons 0101 (101) and 0102 (102) in the first household are originalsample members. Person 0401 (401) moved into the home of persons 0101 (101) and 0102 (102)in Wave 4. In Wave 7, all three of them moved to a new location and were joined by person 0701(701). In the second household, person 101 is an original sample member who moved to a newlocation in Wave 3. In the third household, person 0102 (102) is also an original sample memberwho used to live with persons 0101 (101) and 0103 (103) of the same sample unit ID, but movedto a new location in Wave 3 [to a different location from person 0101 (101)]. In the fourthhousehold, person number 0103 (103) is an original sample member who used to live withpersons 0101 (101) and 0102 (102) of the same sample unit ID number. All but two peoplemoved from their original location [i.e., only two people have SHHADID (ADDID) equal toEENTAID (ENTRY)].
Table 11-16. Identifying Movers in the Core Wave Files
Persons 0101 and 0102 are the originalsample members. Person 0401 beginsto live with them in Wave 4. All threepeople move in Wave 7 and person0701 joins them.
321456789123 031 011 0101 Person 0101 is an original samplemember who moved in Wave 3.
321456789123 032 011 0102 Person 0102 is an original samplemember who moved in Wave 3 to adifferent location from person 0101.
Persons 101 and 102 are the originalsample members. Person 401 begins tolive with them in Wave 4. All threepeople move in Wave 7 and person 701joins them.
321456789 31 11 101 Person 101 is an original samplemember who moved in Wave 3.
321456789 32 11 102 Person 102 is an original samplemember who moved in Wave 3 to adifferent location from person 101.
The next example (Table 11-17) further illustrates how the ID system works as people move tonew addresses, additional people move in with them, and households split. (Users may also findit helpful to review Figure 2-1 [pp. 2-10�2-14], which illustrates changes in householdcomposition.)
! In Wave 1, there is a five-person household consisting of a husband, a wife, a daughter, ason, and a cousin. Since this is the first wave, the current address number is 011 (11),indicating address 1 of Wave 1, and the entry address number for each member of thehousehold is the same as the current address number. Since they are assigned in Wave 1, theperson numbers are in the 0100 (100) series and numbered sequentially, beginning with 0101(101).
! During Wave 2, the son joins the Army, moves into the military barracks, and thereforeleaves the SIPP sample. For the son�s record, person number 0104 (104), the person-monthfile will contain a Wave 1 record for him and a Wave 2 record containing information (eitherimputed or provided by proxy) on his characteristics in the months of Wave 2 that he wasstill in the sample. If he does not return to the sample during the remainder of the panel, therewill be no records for him beyond Wave 2.
! During Wave 3, the daughter marries and her husband moves into the household. The currentaddress number where the mother, father, cousin, daughter, and son-in-law live remains thesame since it is the same address. The son-in-law�s entry address number is 011 (11), sincehe first enters the SIPP sample at an address coded 011 (11). The person number for the son-in-law is in the 0300 (300) series [0301 (301)] since he joins the SIPP sample in Wave 3.
! During Wave 4, the daughter and son-in-law move into a new house. Their current addressnumber changes to 041 (41) to indicate that a new address has been established in Wave 4.Meanwhile, the cousin, who is over age 15, moves in with an uncle.24 The cousin�s currentaddress number changes to 042 (42) (i.e., the second new household formed in the fourthwave from this sample unit). The assignment of address number 041 (41) to the daughter and042 (42) to the cousin is arbitrary�it could be the other way around. The uncle enters theSIPP sample and receives an address number of 042 (42) and an entry address number of 042(42). The uncle�s person number is in the 0400 (400) series [0401 (401)] because he joins thesurvey in Wave 4.
! No changes in household composition are observed during Waves 5 through 9.
! During Wave 10,25 the daughter and son-in-law have a baby. This new sample member isassigned the sample unit ID of the daughter and son-in-law. The newborn�s entry address is041 (41), since that is the current address ID of the daughter and son-in-law at the time ofbirth. The newborn�s person number is 1001, reflecting the fact that the newborn came intothe SIPP sample in Wave 10. Meanwhile, the cousin moves to Europe and therefore leavesthe SIPP sample. The uncle, even though he did not move to Europe with the cousin, alsoleaves the SIPP sample because he no longer resides with an original SIPP sample member.Their records are no longer listed.
24 In the 1993 Panel, all original sample members were followed, regardless of age. In all other panels (including the1996 Panel), only those aged 15 or older were followed when they moved to new addresses.25 Prior to the 1996 Panel, only the 1992 Panel had more than nine waves.
a Prior to the 1996 Panel, only the 1992 Panel had 10 or more waves. Wave 2 of the 1992 Panel of the core wavefiles has expanded address and person ID fields (3 and 4 digits, respectively) to accommodate Wave 10 of the 1992panel.
Prior to the 1996 Panel, there were two extremely rare occasions when the original ID, ENTRY,and PNUM values were modified by the Census Bureau:
1. The first occasion was when two separate sampling units, each containing original samplemembers, were merged, perhaps because of a marriage. In this situation, one of the originalsets of ID and ENTRY values was retained and the other set was changed to agree with thatretained set. The person-number values (PNUM) of the changed set were modified further tobe between 180 and 199, inclusive.
2. The second occasion was when a household split into two new households (in which eachnew household gained a new sample person) and later the households recombined. Forexample, suppose that a married couple separated in Wave 3, each moving in with a sibling.Both siblings were assigned a person number of 301 because they entered the sample inWave 3 at different addresses (thus, ADDID = 31 and 32). If the husband and wife reunitedin Wave 6, and brought the siblings with them, one of the sibling�s person numbers wouldhave been changed. In this case, one of the siblings would have a person number of 301 andthe other would have a person number of 680 (or some number between 680 and 699,inclusive).
Those two occasions were the only times when ID, ENTRY, and PNUM changed. When it didoccur, the old ID variables were stored in the previous wave variables (PWSUID, PWENTRY,and PWPNUM), found only on the core wave files.26
When the merge occurred after the first month of a reference period, the members of the mergedhousehold (whose ID variables were modified) were assigned two sets of monthly records in thecore wave file. The first set of records contained the original ID information and identified theperson as having exited the sample at the time of the merge. The second set contained the newID information and identified the person as having entered the sample at the time of the merge.When the merge occurred at the start of the reference period, only the second set of records wasretained in the core wave files.
Because merged households were very rare prior to the 1996 Panel, information about them willno longer be carried on the topical module files from the 1996 Panel. When either of those twokinds of events occur in the 1996 Panel, one or more original sample members will appear toleave the sample when the merge takes place, and new people will appear to enter the samplewhen the merged household forms. There is no indication in the data files that the �new� samplemembers were previously members of the SIPP sample with different ID values.
TopcodingTopcodingTopcodingTopcoding
To protect the confidentiality of SIPP respondents, the Census Bureau topcodes characteristicsavailable on the topical module files that might allow a user to recognize the identity of a SIPP
26 In the 1993 Panel, merged households are identified with the variables PWSUID, PWENTRY, and PWPNUM.Before the 1993 Panel, they were identified with the variables PREV-ID, SC0064, and SC0066.
respondent. The topcoding procedures used in the topical module files are similar to those usedin the core wave files.27 Generally, topcodes for continuous variables that apply to the totaluniverse include at least ½ of 1 percent of all cases. For income variables that apply tosubpopulations, topcodes include either 3 percent of the appropriate cases or ½ of 1 percent of allcases, whichever is the higher topcode. Any discrete information that is topcoded in the corewave files is topcoded in a consistent manner in the topical module files.
Characteristics that are frequently topcoded in SIPP topical module files include income andexpense values, including those for a broad range of assets and liabilities. For example, thefollowing groups of topical module variables appear in Wave 3 of the 1996 Panel: assets andliabilities, interest earnings, medical expenses, mortgage amounts, other financial assets, realestate, rental properties, stocks and mutual funds, value of business, and work-related expensesand child support paid. The documentation for the variables included in these groups indicateswhether the values are topcoded and the value ranges for the variables.
As described in Chapter 4, the Census Bureau often imputes information when a person does notrespond to the survey or to a particular question. A variable of interest may be imputed. In thetopical module files prior to the 1996 Panel, there is an allocation (imputation) flag for almost allof the person-level variables. Beginning with the 1996 Panel, there is an allocation (imputation)flag associated with every variable subject to imputation. For example, AEDUCATE is theallocation (imputation) variable that identifies whether EEDUCATE is imputed.
Variables are imputed and the allocation (imputation) flags are set before composite variables arecreated. For example, if income is imputed for one member of a household, that person�sallocation (imputation) flag is set. However, total household income is computed after thatimputation; if any household member had any income imputed, total household income is based,in part, on imputed information. There is no direct indication on the records of other householdmembers that any information has been imputed.
Using WeightsUsing WeightsUsing WeightsUsing Weights
The topical module files contain one weight variable�WPFINWGT (FINALWGT). For the1996 Panel, this weight is the person cross-sectional weight for the fourth reference month. Priorto 1996, this weight was the person interview month weight for people who provided data for atopical module. It shows the number of people in the population represented by the sampleperson in the interview month.
27 Chapter 10 contains a discussion of both the new income topcoding procedures used in the 1996 Panel core wavefiles and the income topcoding procedures used in the pre-1996 core wave files. See also Appendix B: SIPPTopcoding Specifications.
The source and accuracy statements that accompany all SIPP topical module files ordered fromthe Census Bureau provide suggestions on how to use the topical module weight variable. Also,Chapter 8 of this Guide contains a full discussion of how to use weights in SIPP data files.
Identifying StatesIdentifying StatesIdentifying StatesIdentifying States
For the 1996 Panel, the variable TFIPSST identifies 45 states and the District of Columbia. Theremaining five states are combined as follows:
1. Maine, Vermont; and
2. North Dakota, South Dakota, Wyoming.
The topical module files from panels prior to the 1996 Panel contain a variable STATE thatidentifies the state in which the household resides. The variable identifies 41 individual statesand the District of Columbia; the nine other states are combined into three groups:
1. Maine, Vermont;
2. Iowa, North Dakota, South Dakota; and
3. Alaska, Idaho, Montana, Wyoming.
Even though it is possible to identify most states, SIPP was not designed to be representative atthe state level and should not be used to produce state-level estimates. The state variable isincluded on the public use files to allow examination of how state-level characteristics affectnational estimates. For example, a user could apply the state-specific eligibility criteria for ameans-tested program in order to arrive at a national estimate of the number of eligibleparticipants. Because some states are not uniquely identified, some method of allocating thestate-specific eligibility rules to sample people in those states would need to be devised.
Identifying Metropolitan AreasIdentifying Metropolitan AreasIdentifying Metropolitan AreasIdentifying Metropolitan Areas
The topical module files do not contain any variables identifying metropolitan areas. Thoseneeding that information should merge it from the core wave files or the full panel files. Analystsshould see Chapters 10 and 12 for discussions of the core wave files and the full panel files,respectively. Chapter 13 discusses how to merge multiple SIPP public use files.
12-1
12.12.12.12. Using the 1990–1993 Full PanelUsing the 1990–1993 Full PanelUsing the 1990–1993 Full PanelUsing the 1990–1993 Full PanelLongitudinal Research FilesLongitudinal Research FilesLongitudinal Research FilesLongitudinal Research Files
This chapter discusses procedures for working with data from the full panel longitudinal researchfiles for the 1990 through 1993 Panels of the Survey of Income and Program Participation(SIPP). Because the full panel longitudinal research file for the 1996 Panel was still underdevelopment at the time this chapter was written, it is not yet possible to describe procedures forusing that file. A revised version of this chapter will be available once the longitudinal researchfile for the 1996 Panel is released to the public.
The chapter begins by describing the documentation that accompanies the full panel public usefiles obtained from the Census Bureau. The discussion then turns to the data files themselves.The data file structure is described, and detailed explanations are provided about how to use thelongitudinal research files when performing common tasks, including:
! Realigning the data by calendar month;
! Using the monthly interview status variables;
! Identifying persons, households, families, and program units;
! Working with the unearned income data;
! Understanding the effects of topcoding;
! Using imputation flags; and
! Identifying states and metropolitan areas.
Before reading this chapter, users should read Chapter 9 for an introduction to Section II.Analysts using only one longitudinal research file should also read about the use of sampleweights (Chapter 8) and the computation of standard errors (Chapter 7). Those planning onmerging data from a longitudinal research file to data from the core wave or topical module filesshould read Chapter 10 for information about the core wave files, Chapter 11 for informationabout the topical module files, and Chapter 13 for information about linking SIPP public usefiles.
This chapter focuses on the longitudinal research files. It is written so that it can be usedindependently of the chapters describing the core wave files and topical module files. Althoughthere are many similarities across the three types of files, important differences do exist. Becausethose differences are sometimes subtle, users familiar with the core wave and topical modulefiles should read this chapter carefully, paying close attention to information about variable
names and file structures. Table 9-2 summarizes the differences between the core wave, topicalmodule, and longitudinal research files.1
Using the Technical Documentation of theUsing the Technical Documentation of theUsing the Technical Documentation of theUsing the Technical Documentation of the1990–1993 Longitudinal Research Files1990–1993 Longitudinal Research Files1990–1993 Longitudinal Research Files1990–1993 Longitudinal Research Files
Each data file received from the Census Bureau comes with a set of technical documentation anda data dictionary. The technical documentation includes:
! The paper survey instrument;
! A glossary of selected terms;
! A cross-walk, mapping reference months into calendar months for each rotation group;
! A source and accuracy statement describing the sample weights and the computation ofstandard errors; and
! User Notes.
The survey instrument is vital to understanding what questions were asked, how they were asked,the order in which they were asked, to whom they were asked, and the way in which the answerswere recorded. Some questions employ skip patterns (Chapter 3), so users should pay particularattention to which questions were skipped for which respondents. These skip patterns are bestunderstood by consulting the survey instruments.2
The source and accuracy statements provide information about the weights on the files, whenand how to make adjustments to the weights, and one approach to computing standard errors forsome common types of estimates. More detailed discussions of those topics are provided inChapters 7 and 8 of this Guide.
The data dictionary provides a detailed description of each variable on the file. It describes fouraspects of each variable:
1. The definition;
2. The sample universe of the corresponding survey question;
1 Some of this information will change once the 1996 longitudinal research file becomes available. At that time, thisguide will be updated to reflect the differences.2 With the introduction of CAI (computer-assisted interviewing) in the 1996 Panel, questionnaire documentation isnow available at the SIPP Web site at http://www.sipp.census.gov/sipp/.
USING THE 1990–1993 FULL PANEL LONGITUDINAL RESEARCH FILESUSING THE 1990–1993 FULL PANEL LONGITUDINAL RESEARCH FILESUSING THE 1990–1993 FULL PANEL LONGITUDINAL RESEARCH FILESUSING THE 1990–1993 FULL PANEL LONGITUDINAL RESEARCH FILES
12-3
3. The ranges for all legal values; and
4. The location (and size) in the file.
A machine-readable version of the data dictionary accompanies each data file. It can also bedownloaded from the Internet (http://www.sipp.census.gov/sipp/).
The data dictionary is formatted to facilitate processing by user-written computer programs.3 Asshown in Figure 12-1, a �D� in the first column signifies that the next few lines define thevariable: (1) the variable name, (2) the total number of columns occupied by the variable, (3) thestarting position, (4) the number of occurrences of that variable, and (5) the size of eachoccurrence of the variable.4 A �U� in the first column indicates that the next words describe theuniverse.5 A �V� in the first column indicates that the next number and phrase describe one ofthe values of the variable. An asterisk in the first column denotes a comment. A period (.) beforea word denotes the start of the value label.6
The format of the data dictionary for the longitudinal research files is different from that used forthe core wave and topical module files. The full panel data dictionary includes two extra fieldson the line with a �D� in the first column. The first extra field contains the number ofoccurrences of the variable, and the second extra field contains the number of digits for eachoccurrence of the variable. These fields are needed because some variables in the longitudinalresearch file occur x times, depending on the number of waves, or y times, depending on thenumber of months in the panel.
HH-ADDID in Figure 12-1 is a monthly variable containing two digits (monthly because itoccurs 36 times). PP-MIS is also a monthly variable, but its length is one digit. PP-INTVWappears once per wave (because it occurs nine times), and PP-ENTRY, PP-PNUM, SU-TOTPP,and PP-RCSEQ occur once for the entire panel.
Figure 12-2 shows sample SAS and FORTRAN syntax for reading the data described by thecodebook fragment in Figure 12-1. Additional SAS program code could be used to associatevariable labels and value labels (SAS �formats�) with the PP-MIS and PP-INTVW variables.
3 The data dictionaries for the longitudinal research files use a different format from that used for the core wave andtopical module files. Users who have worked with the core wave and topical module files should take care to notethose differences. In addition, the formats of the data dictionaries for the 1996 Panel core wave and topical modulefiles, as well as the variable names used in those files, have changed in the 1996 Panel. This chapter uses variablenames from the 1990�1993 SIPP Panels. When longitudinal research files are released from the 1996 Panel, arevised version of this chapter will be available with updated information. Users will be able to download thatversion from the SIPP Web site at http://www.sipp.census.gov/sipp/.4 The data dictionary for the 1992 longitudinal research file used a different format from that used in the other pre-1996 longitudinal research files. In the 1992 data dictionary, the first line for each new variable, labeled with a �D�in column 1, has the following fields: variable name, total size (number of characters), start location, the length of asingle occurrence of the variable, the number of occurrences of the variable, and the number of implied decimals.5 The universe definitions included in the data dictionaries prior to the 1996 Panel were often inaccurate. Users ofpre-1996 SIPP Panels should check the skip patterns in the actual survey questionnaire to determine which subset ofrespondents was asked each question.6 The data dictionary for the 1992 longitudinal research file also has a line labeled with an �R� in column 1. Thisline provides the range of values for the variable.
Figure 12-1. Excerpt from the 1993 Longitudinal Research File Data Dictionary
D PP-ENTRY 2 17 1 2
Range = (11:99)
Edited entry address ID
Address ID of the household that this person belonged to at the time thisperson first became part of the sample
D PP-PNUM 3 19 1 3
Range = (101:999)
Edited person number
D SU-TOTPP 2 22 1 2
Range = (1:60)
Total number of person records for this sample unit
D PP-RCSEQ 2 24 1 2
Range = (1:60)
Sequence number of person record within sample unit
D HH-ADDID 72 26 36 2
Range = (0:99)
Address ID. —— This field identifies the household this person lived inthis month
D PP-INTVW 9 98 9 1
Range = (0:4)
Person’s interview status for the relevant interview
V 0 .Not applicable (children under .15), not in sample, nonmatch
V 1 .Interview (self)
V 2 .Interview (proxy)
V 3 .Noninterview – Type Z refusal
V 4 .Noninterview - Type Z other
D PP-MIS 36 107 36 1
Range = (0:2)
Person’s interview status for this month
V 0 .Not matched or not in sample
V 1 .Interview
V 2 .Non-interview
USING THE 1990–1993 FULL PANEL LONGITUDINAL RESEARCH FILESUSING THE 1990–1993 FULL PANEL LONGITUDINAL RESEARCH FILESUSING THE 1990–1993 FULL PANEL LONGITUDINAL RESEARCH FILESUSING THE 1990–1993 FULL PANEL LONGITUDINAL RESEARCH FILES
12-5
Figure 12-2. Corresponding SAS and FORTRAN Syntax to Read in Datafrom the 1993 Longitudinal Research File Data Dictionary
SAS
Input
@17 PP_ENTRY 2.
PP_PNUM 3.
SU_TOTPP 2.
PP_RCSEQ 2.
(ADDID1-ADDID36) (2.)
(INTVW1-INTVW9) (1.)
(PP_MIS1-PP_MIS36) (1.)
;
FORTRAN
INTEGER*2 PP_ENTRY
INTEGER*2 PP_PNUM
INTEGER*1 SU_TOTPP
INTEGER*1 PP_RCSEQ
INTEGER*1 HH_ADDID(36)
INTEGER*1 PP_INTVW(9)
INTEGER*1 PP_MIS(36)
READ(infile,1000) PP_ENTRY, PP_NUM, SU_TOTPP,
$ PP_RCSEQ, HH_ADDID, PP_INTVW, PP_MIS
1000 FORMAT(T17, I2, I3, I2, I2, 36I2, 9I1, 36I1)
Relationship of the Longitudinal Research DataRelationship of the Longitudinal Research DataRelationship of the Longitudinal Research DataRelationship of the Longitudinal Research DataFiles to the SIPP Survey InstrumentFiles to the SIPP Survey InstrumentFiles to the SIPP Survey InstrumentFiles to the SIPP Survey Instrument
The data dictionaries for the longitudinal research files do not replicate the survey instruments.Analysts should keep a few things in mind when using the data:
! The variables on the longitudinal research files do not correspond one-to-one with thequestionnaire items. The variables are listed in a different order, some are not included in thelongitudinal research file at all, and some are created from a combination of other variables.
! The range of possible values of the variables does not always correspond one-to-one with theresponse categories shown on the survey instrument or in the data dictionary;
! The variable name may not readily indicate its meaning; and
! The complexity of the skip patterns may not be apparent just by looking at the datadictionary.7
To avoid potential problems and confusion, users should become familiar with the surveyinstrument before using the data. When working with the data, analysts should refer to both thesurvey instrument and the data dictionary.
Structure of the Longitudinal Research FilesStructure of the Longitudinal Research FilesStructure of the Longitudinal Research FilesStructure of the Longitudinal Research Files
The longitudinal research files contain one record for each person who was ever in the SIPPsample for that panel. Even if the person was in the sample for just 1 month, there will be arecord for that person. There are records for children as well as for adults, and there are recordsfor people who entered the sample after the first wave.
Within each record, the variables correspond to the information that was collected in the coreinterviews. While most of the core items are included in the longitudinal research files, someitems are not, and not all of the constructed variables found on the core wave files are includedon the longitudinal research files. In addition, no items from any of the topical modules areincluded on the longitudinal research files. When items from the core wave or topical modulefiles are needed, those variables must be merged with data from the longitudinal research files.Chapter 13 provides a detailed discussion of merging SIPP files.
The longitudinal research file structure differs from that of the core wave files. The longitudinalresearch files contain just one record per person, while the core wave files contain one record perperson per month. Because some attributes do not change over the course of the panel, thosevariables appear once on each record (e.g., rotation group, sample unit ID, person number, sex,race, and ethnic origin). Some questions were asked once during each wave, so they appear xtimes on each record, where x equals the number of waves for that panel (e.g., highest gradeattended, and participation in school breakfast and lunch programs). Most of the core questionswere asked for each month of the panel. They appear y times on each record, where y equals thenumber of months for that panel (e.g., current address ID, monthly interview status, relationshipto the reference person, income, and program participation).
Table 12-1 shows that the 1992 Panel has 10 waves (or 40 months) of data. The 1993 Panel hasnine waves (or 36 months) of data. Thus, the interview status variable (PP-MIS) appears 40times in the 1992 longitudinal research file, and it appears 36 times in the 1993 longitudinalresearch file.
7 See footnote 5.
USING THE 1990–1993 FULL PANEL LONGITUDINAL RESEARCH FILESUSING THE 1990–1993 FULL PANEL LONGITUDINAL RESEARCH FILESUSING THE 1990–1993 FULL PANEL LONGITUDINAL RESEARCH FILESUSING THE 1990–1993 FULL PANEL LONGITUDINAL RESEARCH FILES
12-7
Table 12-1. Summary of Panels, Waves, Reference Months, and Sample Sizes
PanelYear Reference Months
Numberof Waves
Number ofMonths
Wave 1EligibleHouseholds
1984 Jun. 83 � Jun. 86 9 36 20,8971985 Oct. 84 � Jul. 87 8 32 14,3061986 Oct. 85 � Mar. 88 7 28 12,4251987 Oct. 86 � Apr. 89 7 28 12,5271988 Oct. 87 � Dec. 89 6 24 12,7251989 Oct. 88 � Dec. 89 3 There is no longitudinal research file for the 1989 SIPP.1990 Oct. 89 � Aug. 92 8 32 23,6271991 Oct. 90 � Aug. 93 8 32 15,6261992 Oct. 91 � Mar. 95 10 40 21,5771993 Oct. 92 � Dec. 95 9 36 21,823Source: SIPP Quality Profile, 3rd Ed. (U.S. Census Bureau, 1998a).
Table 12-2 illustrates the longitudinal research file structure. In this example, there are fivepeople. Sample unit ID (PP-ID), person number (PP-PNUM), and entry address ID (PP-ENTRY)appear once on each record because they are permanent characteristics of those people. Monthlyinterview status (PP-MIS), a monthly variable, appears 40 times because the 1992 Panel had 10waves and each wave collected information about the 4 months prior to the interview month.
People who were not interviewed (in person or by proxy) for 1 or more months over the courseof the panel either have their data imputed8 or are identified as not in the sample (PP-MIS equalto either 0 or 2) for the months when they were not in the sample. The discussion of the PP-MISvariable later in this chapter provides additional information.
How to Align Data by Calendar MonthHow to Align Data by Calendar MonthHow to Align Data by Calendar MonthHow to Align Data by Calendar Month
It is frequently useful to realign the SIPP data by calendar month instead of reference month. Forexample, researchers often want to analyze data for a specific calendar year (January throughDecember) or federal fiscal year (October through September).9 To do this, the analyst must
8 Imputation would be by Type Z and missing-wave imputations. Chapter 4 discusses imputation methods.9 The longitudinal research files do not contain calendar month weights. Those weights would be needed for sometypes of longitudinal analyses, such as analyses of the dynamics of program participation, where the unit of analysisis a spell of program participation (Chapter 8 provides a discussion of this example). Data from the longitudinalresearch files can also be used for cross-sectional estimation, and they are often preferable to the data from the corewave files because the edit and imputation procedures used for the longitudinal research files are believed to resultin less imputation error than the procedures used for the core wave files. The format of the file is sometimes easierto work with, even for cross-sectional applications. In those instances, the calendar month weights must be mergedfrom the core wave files. Chapter 8 provides a detailed discussion of weighting procedures in the SIPP. Chapter 13provides a detailed discussion of linking SIPP files.
Table 12-2. Example of the Longitudinal Research File Structure
USING THE 1990–1993 FULL PANEL LONGITUDINAL RESEARCH FILESUSING THE 1990–1993 FULL PANEL LONGITUDINAL RESEARCH FILESUSING THE 1990–1993 FULL PANEL LONGITUDINAL RESEARCH FILESUSING THE 1990–1993 FULL PANEL LONGITUDINAL RESEARCH FILES
12-9
know the reference period for each rotation group of the panel. That information is included withthe technical documentation that accompanies the longitudinal research files.
Table 12-3 shows the reference period for each rotation group of the 1992 Panel. It shows thatthe reference period for rotation group 2 is October 1991�January 1995. The reference period forrotation group 3 is November 1991�February 1995. The reference period for rotation group 4 isDecember 1991�March 1995. The reference period for rotation group 1 is January 1992�December 1994 (interviews were not conducted in Wave 10 for this rotation group).
Table 12-3. Reference Periods for Each Rotation Groupof the 1992 Panel
RotationGroup(ROT) Reference Period2 October 1991�January 19953 November 1991�February 19954 December 1991�March 19951 January 1992�December 1994
The following algorithm (Figure 12-3), written for the 1992 Panel, illustrates one approach torealigning the SIPP reference months to common calendar months. The mapping depends on thepanel and rotation group and must be applied to each person. The first step establishes thedisplacement or realignment of the months. The second step initializes each monthly variable to�9 to distinguish the calendar months in which the variable is not relevant.10 The loop goes from1 to 42 because in the 1992 Panel the first reference month was October 1991 and the lastreference month was March 1995, which means that there were 42 calendar months covered bythe panel. The third part of the algorithm realigns the input data to be based on the calendarmonth. Table 12-4 displays the data after the realignment.
Using the Monthly Interview StatusUsing the Monthly Interview StatusUsing the Monthly Interview StatusUsing the Monthly Interview Status(PP-MIS) Variables(PP-MIS) Variables(PP-MIS) Variables(PP-MIS) Variables
The monthly interview status variable helps to determine whether the data for a person in a givenmonth should be used. In the longitudinal research files, this variable is labeled PP-MIS, and ithas one occurrence for each reference month of the SIPP panel. Some people refer to it as the in-sample variable to distinguish it from the interview status variable (PP-INTVW). The PP-MISvariables have three possible values: 0, 1, and 2.
10 If �9 is a possible value for the variables being realigned (e.g., self-employed income can be negative), a differentstarting value must be used.
Figure 12-3. Algorithm for Realigning SIPP Panel Month to Calendar Monthsin the 1992 Panel
/*Create a variable that identifies the number of months eachrotation group differs from the baseline*/If ROT = 2 DISPLACEMENT = 0Else if ROT = 3 DISPLACEMENT = 1Else if ROT = 4 DISPLACEMENT = 2Else if ROT = 1 DISPLACEMENT = 3End if
/*Initialize the new, re-aligned variable. This is not needed in SAS.When this step is used, an initial value should be chosen thatis not a legal value for the variable in the actual data.*/For each calendar month (for CALMM = 1 to 42): NEW-PP-MIS(CALMM) = -9End loop
/*Create the newly re-aligned variable*/For each reference month (for MONTH = 1 to 40): CALMM = MONTH + DISPLACEMENT NEW-PP-MIS(CALMM) = PP-MIS(MONTH)End loop
The monthly interview status is the only reliable guide to whether the data for a given personshould be used in a given month. Analysts should use only data for those months in which aperson�s interview status (PP-MIS) is equal to 1.11
Any data present for months in which a person�s interview status is coded either 0 or 2 should beignored. A code of 0 indicates that the person was not in the sample that month, and a code of 2indicates a noninterview for that month.12
11 As a safeguard against inadvertently using data for months when PP-MIS is not equal to 1, all monthly variablesin the user�s data extract should be set to a missing value for months when PP-MIS is not equal to 1. Most statisticalpackages allow certain values to be flagged as �missing.� Once flagged, those values are excluded fromcomputations.12 Beginning with the 1991 Panel, new �missing wave� imputation procedures were instituted for the longitudinalresearch files. Whenever data for a wave are imputed (the WAVFLG variable), PP-MIS is recoded to 1 on thelongitudinal research files, indicating that the data for those months should be used. In some cases, these people willhave records in the core wave files that were created during the Type Z imputation processing (see Chapter 4 fordetails). In some of these instances, however, the longitudinal research file will have data for people who are notpresent on the associated core wave data files.
Table 12-4. Monthly Data from the 1992 Panel, Realigned by Calendar Month
NEW-PP-MIS1991 1992
PP-IDPP-ENTRY
PP-PNUM
PP-ROT Oct Nov Dec Jan Feb Mar Apr May Jun Jul Aug Sep Oct Nov Dec
USING THE 1990–1993 FULL PANEL LONGITUDINAL RESEARCH FILESUSING THE 1990–1993 FULL PANEL LONGITUDINAL RESEARCH FILESUSING THE 1990–1993 FULL PANEL LONGITUDINAL RESEARCH FILESUSING THE 1990–1993 FULL PANEL LONGITUDINAL RESEARCH FILES
12-13
The presence of data in analysis fields for any given month is not a reliable guide to whether theperson should be included in the planned analyses. Data are collected for all months of thereference period for a given wave, even if the interviewed person was in the sample for only partof the reference period. Data are also present even if the person was not interviewed. Informationfrom the questionnaire is imputed when the person was in sample for at least 1 month of thereference period but not actually interviewed. That includes people who moved out of scope (asdefined in Chapter 2), people who died, and people who refused to be interviewed. The entirequestionnaire was imputed for Type Z noninterviews (people who refused to be interviewed,living in households where other members were successfully interviewed). Chapter 4 examinesimputation procedures; Chapter 8 provides information on weighting. Data are collected for allmonths of the reference period even if the interviewed person was in the sample for only part ofthe reference period.
The presence of a positive weight is also not a reliable guide to whether a person should beincluded in the planned analysis. Although people with zero weights will not enter into anyweighted tabulations, they may provide important contextual information about people who doenter into those (weighted) tabulations. For example, a zero-weight person who is a member ofthe same household as a positive-weight person for only 3 months provides information aboutthe positive-weighted person�s household (including, for example, household size, composition,income, and program participation) for that 3-month period. That is why records for these zero-weighted people are retained in the SIPP full panel data files.13
There are many occasions when a user may need to identify which records belong to eachindividual in the SIPP data files. That need arises, for example, during the following procedures:
! Merging data from topical module or full panel files to core wave files;
! Combining data from two or more core wave files;
! Linking husbands and wives;
! Linking parents and children; and
! Identifying which person received government transfer income on behalf of the family.
To uniquely identify a person in the longitudinal research files, analysts should use the threevariables shown in Table 12-5.14
13 Using the PP-MIS variable shown in Table 12-2, one can see that the first person within each rotation group wasin sample every month of the panel. The second person shown in the table left the sample before the third interview(information was probably collected by proxy interview for that wave) and did not return to the sample. The eighthperson left the sample in month 13. The tenth person entered the sample in month 38 (the last wave).14 Beginning with the 1996 Panel, the entry address ID will no longer be needed: person numbers will be uniquewithin sample units. Continued use of the entry address ID will not create any problems. It is simply redundantinformation.
Table 12-5. Variables Used to Uniquely Identify a Person in theLongitudinal Research Files
Variable Name DescriptionPP-ID Sample unit IDPP-ENTRY Entry address IDPP-PNUM Person number
! PP-ID uniquely identifies each initially sampled dwelling unit.15 Every person in thelongitudinal research file was either a member of one of those units (an original samplemember) or lived with someone during the life of the panel who was a member of an initiallysampled dwelling unit. A person�s connection to that unit is an attribute of that person anddoes not change over time.16 This means that as people move from address to address, theirPP-ID stays the same. As new people join the homes of original sample members, theyreceive the PP-ID of the original sample members.
! PP-ENTRY identifies the address where the person lived at the time he or she was firstinterviewed. It does not change even if the person moves.17 It is used in conjunction with theperson number and the sample unit ID to uniquely identify persons within the sampling unit.Values for this variable are unique only within sample units. The entry address ID has twocomponents. The first part of the ID number (two digits in the 1992 Panel, and one digit in allothers) identifies the wave in which SIPP interviews were first conducted at the address. Thesecond part of the number (one digit in all panels) sequentially numbers addresses within asample unit (PP-ID) that enter the sample in the same wave.
! PP-PNUM uniquely identifies a person within the sample unit ID and entry address ID. PP-PNUM does not change even if the person moves.18 The first part of PP-PNUM (two digits inthe 1992 Panel, and one digit in all others) indicates the wave in which the person was firstinterviewed.19 The remaining two digits are sequentially assigned within the household.Thus, original sample members are assigned person numbers ranging from 100 to 199.Individuals who enter the SIPP sample in Wave 2 are assigned a person number ranging from200 to 299. Those who enter in Wave 10 are assigned person numbers ranging from 1001 to1099.
Table 12-6 illustrates how the combination of PP-ID, PP-ENTRY, and PP-PNUM uniquelyidentifies people and provides information about when they first entered the SIPP sample. In thisexample, there are eight individuals: five are original sample members; one person joined the 15 The PP-ID is a random recode of three other variables in the Census Bureau�s internal (not public use) files: therespondent�s sampling area (PSU), the cluster of housing units within that area (called the �segment�), and asequentially assigned serial number. Those three variables are omitted from the public use files to protect theconfidentiality of the respondents.16 There is one rare exception to this rule, which is described in the section entitled �Identifying Movers� later in thischapter.17 See footnote 16.18 See footnote 16.19 For Wave 10 of the 1992 Panel and for the 1996 Panel, the first two digits of PNUM instead of the first digitidentify the wave in which the person entered the sample.
USING THE 1990–1993 FULL PANEL LONGITUDINAL RESEARCH FILESUSING THE 1990–1993 FULL PANEL LONGITUDINAL RESEARCH FILESUSING THE 1990–1993 FULL PANEL LONGITUDINAL RESEARCH FILESUSING THE 1990–1993 FULL PANEL LONGITUDINAL RESEARCH FILES
12-15
SIPP sample in Wave 4, one person joined in Wave 7, and one person joined in Wave 10 (of the1992 Panel).
Table 12-6. How to Uniquely Identify a Person in the Longitudinal Research Files
SampleUnit ID(PP-ID)
EntryAddress ID(PP-ENTRY)
PersonNumber(PP-PNUM) Notes
123456789 11 101 Original sample member123456789 11 102 Original sample member123456789 11 401 Enters SIPP sample in Wave 4123456789 71 701 Enters SIPP sample in Wave 7321456789 11 101 Original sample member321456789 11 102 Original sample member321456789 11 103 Original sample member456789123 101 1001 Enters SIPP sample in Wave 10 of the 1992 Panel
The term household, as used in Census Bureau publications, refers to a group of people whooccupy a housing unit. A house, an apartment or other group of rooms, or a single room isregarded as a housing unit if it is occupied or intended for occupancy as separate living quarters.That is, the occupants do not live and eat with any other people in the structure and there is directaccess from the outside or through a common hall. A group of friends sharing an apartmentconstitutes a household. Rooming and boarding houses, college dormitories, convents, andmonasteries are classified as group quarters rather than households.
To uniquely identify a household or group quarters in the longitudinal research files in a givenmonth, analysts should use the variables shown in Table 12-7.20
Table 12-7. Variables Used to Uniquely Identify a Household in theLongitudinal Research Files
Variable Name DescriptionPP-ID Sample unit IDHH-ADDIDi Current address ID in the ith monthPP-MISi Person�s interview status in the ith month
20 Since household composition changes from one month to the next, it is generally not possible to construct�longitudinal households.� Users should not infer commonality across months based solely on place of residence inone month. The characteristics of the household to which a given person belongs (such as household size andhousehold income) should be evaluated separately for each month, based on just those people who reside together ineach specific month. Similar caution should be exercised when dealing with the characteristics of the family and,when applicable, the subfamily to which a person belongs.
People with the same PP-ID and HH-ADDIDi values and with a PP-MIS value of 1 live in thesame household (or group quarters) in the ith month of the reference period. The eightindividuals shown in Table 12-8 make up four households. The first household contains the firstfour individuals. The second household contains one person. The third household contains oneperson. The fourth household contains two people.
This example depicts the households in the ith month. These people could belong to differenthouseholds in other months. (Users may find it helpful when reading the following pages to referto Figure 2-1 [pp. 2-10�2-14], which illustrates changes in household composition.)
Table 12-8. How to Uniquely Identify a Household or Group Quarters in a GivenMonth of the Longitudinal Research Files
321456789 11 101 1 31 One person in this household321456789 11 102 1 32 One person in this household321456789 11 103 1 101321456789 101 1001 1 101
Two people in this household a
a Because this example includes a person with an entry address of 101, we know that the example refers to a monthfrom Wave 10 of the 1992 Panel (the only panel prior to 1996 with 10 or more waves).
The term family, as used in Census Bureau publications, refers to a group of two or more peoplerelated by birth, marriage, or adoption who reside together; all such individuals are consideredmembers of one family.21
! A primary family is a family containing the household reference person and all of his or herrelatives. This means that a household composed of a husband and wife, their son, and theirson�s wife (i.e., the daughter-in-law) is classified as a primary family containing four people.
21 As with households (see footnote 20), because family composition changes from one month to the next, itgenerally is not possible to construct longitudinal families. Users should not infer commonality across months basedsolely on family membership in one month. The characteristics of the family to which a person belongs (such asfamily size and family income) should be evaluated separately for each month, and should be based on just thosepeople who reside together and are members of the same family in each specific month. Similar caution should beexercised when dealing with the characteristics of the household and, when applicable, the subfamily (related orunrelated) to which a person belongs.
USING THE 1990–1993 FULL PANEL LONGITUDINAL RESEARCH FILESUSING THE 1990–1993 FULL PANEL LONGITUDINAL RESEARCH FILESUSING THE 1990–1993 FULL PANEL LONGITUDINAL RESEARCH FILESUSING THE 1990–1993 FULL PANEL LONGITUDINAL RESEARCH FILES
12-17
! A related subfamily is a nuclear family that is related to but does not include the householdreference person. For example, the son and his wife (i.e., the daughter-in-law) in thepreceding example are a related subfamily.
! An unrelated subfamily (sometimes called a secondary family) is a nuclear family that is notrelated to the household reference person. Thus, a husband and wife who live in a friend�shouse are classified as an unrelated subfamily. A mother and daughter who live in themother�s boyfriend�s apartment are classified as an unrelated subfamily.
! A primary individual is a household reference person who lives alone or lives with onlynonrelatives. Primary individuals are sometimes treated by the Census Bureau as familieswith only one person and are referred to as pseudo-families.
! A secondary individual is not a household reference person and is not related to any otherpeople in the household. Secondary individuals are sometimes treated by the Census Bureauas families with only one person and are referred to as pseudo-families.
Unlike the core wave files, the longitudinal research files do not contain family identificationvariables (e.g., FID, FID2, and SID). Analysts needing family identification variables must eithermerge them from the core wave files (Chapters 10 and 13) or create them.22 Because familycomposition can change over time, these are monthly variables. The algorithm in Figure 12-4shows one approach to creating functional equivalents of the variables contained on the corewave files.23
The variables created by this algorithm are functionally equivalent to the variables with the samenames on the core wave files: they will group people into the same family and subfamily groups.However, the actual values assigned by this algorithm to these variables generally will not equalthe values found in the variables from the core wave files.
With these monthly variables (FIDi, FID2i, and SIDi), users can identify common familymembership in each month.24 The Census Bureau has two principal methods for distinguishingfamilies that are based on the variables and numbering schemes shown in Table 12-9. Analystsmust remember to choose which type of family classification they want and then use theappropriate method.
! The first method defines a family as all persons who are related and living together. Thefamily ID variable FIDi is used with this definition. FIDi groups the household referenceperson with all related household members by assigning them the same ID number.
22 In most cases, it is also possible to merge these variables from the core wave files. However, beginning with the1991 Panel, a missing wave imputation procedure was applied to the longitudinal research files: data were imputedfor people with missing data for a wave but with valid data for the two adjacent waves. Although these people havedata in the longitudinal research file for imputed waves, some have no data in the core wave files (some of thesepeople are subject to Type Z imputation procedures that create records in the core wave files). For these people,merging the family ID variables from the core wave files is not an option.23 This algorithm uses the following (monthly) variables found on the longitudinal research files: FAMTYP andFAMNUM. These variables are discussed in greater detail in the next section.24 See footnotes 20 and 21.
Else if FAMTYP(mo, ip) = 3 <i.e., related subfamily> then FID(mo, ip) = 1
FID2(mo, ip) = 0SID(mo, ip) = FAMNUM(mo, ip)
Else if FAMTYP(mo, ip) = 4 <i.e., primary individual> then FID(mo, ip) = 10000 + ip
FID2(mo, ip) = 10000 + ipSID(mo, ip) = 0
End ifEnd “PP-MIS = 1” Block
End month loopEnd person loop
Table 12-9. Variables Used to Identify Families in the Longitudinal Research Files
Variable Name DescriptionPP-ID Sample unit IDHH-ADDIDi Address ID in the ith monthPP-MISi Person�s interview status in the ith monthAnd one of the following created variables:FIDi Family ID in the ith monthFID2i Family ID in the ith month, excluding related subfamily members (FID2i
equals zero for related subfamily members)SIDi Family ID in the ith month for related subfamily members (SIDi assigns
nonzero values only to members of related subfamilies)FID2i and SIDi Family ID in the ith month, separating related subfamilies from the primary
familyNote: Variables FIDi, FID2i, and SIDi are not included on the longitudinal research files. They can be created byusing the algorithm shown in Figure 12-4 or merged from the core wave files.
USING THE 1990–1993 FULL PANEL LONGITUDINAL RESEARCH FILESUSING THE 1990–1993 FULL PANEL LONGITUDINAL RESEARCH FILESUSING THE 1990–1993 FULL PANEL LONGITUDINAL RESEARCH FILESUSING THE 1990–1993 FULL PANEL LONGITUDINAL RESEARCH FILES
12-19
This family group corresponds to the Census Bureau�s definition of a primary family. FIDigroups members of each unrelated subfamily (and primary and secondary individuals)separately.
! The second method is similar to the first in defining a family, but the family excludes relatedsubfamilies. The family ID variable FID2i is used with this definition. FID2i equals zero forrelated subfamilies.
Analysts who want to analyze multigenerational families would use FID2i and the variable SIDi.SIDi treats related subfamilies as distinct family units by assigning them nonzero values.Analysts can easily distinguish unrelated subfamilies from other family units when they usethese variables and numbering schemes.
Table 12-10 illustrates the difference between FIDi, FID2i, and SIDi for a single month. In themonth shown, the first household contains a primary family of five people. The primary familycontains two related subfamilies. FIDi and FID2i mask the fact that there are two relatedsubfamilies; only SIDi provides that information. SIDi has nonzero values only for members ofrelated subfamilies. The second household contains a primary family and two unrelatedsubfamilies. The third household contains a primary individual and an unrelated subfamily. Thefourth household contains only a primary individual. The fifth household is group quarterscontaining two people. This example depicts those families in the ith month. These people couldbelong to different families in other months.25
The specific analysis being planned will inform the choice of which family classification to use.To group people into families in the same way that the Census Bureau does, analysts should usePP-ID, PP-MISi, HH-ADDIDi, and FIDi. To analyze primary families excluding relatedsubfamily members, analysts should include only those records with FID2i greater than zero. Toanalyze related subfamilies as distinct family units, analysts should use only those records withSIDi greater than zero. To uniquely identify (1) primary families excluding related subfamiliesand (2) related subfamilies treated as distinct family groups, analysts should use PP-ID, PP-MISi,HH-ADDIDi, FID2i, and SIDi. In those analyses, it is easy to distinguish unrelated families fromother families.
Variables Describing Household and FamilyVariables Describing Household and FamilyVariables Describing Household and FamilyVariables Describing Household and FamilyCompositionCompositionCompositionComposition
Table 12-11 shows the variables contained on the longitudinal research files summarizinghousehold and family composition.26
25 See footnote 18.26 More detailed information about the relationships between members is collected in the Household Relationshipstopical module. Those data provide extensive information about household composition at the time of the topicalmodule interview.
Table 12-10. How to Uniquely Identify a Family in a Given Month of the Longitudinal Research Files
Notes: Variables FIDi, FID2i, and SIDi are not part of the longitudinal research files. They can be merged from the core wave files or createdusing the algorithm shown in Figure 12-4. FAMTYP = 0 means the person belongs to a primary family. FAMTYP = 1 means the person is asecondary individual. FAMTYP = 2 means the person belongs to an unrelated subfamily. FAMTYP = 3 means the person belongs to a relatedsubfamily. FAMTYP = 4 means the person is a primary individual.
12-20
SIP
P U
SE
RS
’ GU
IDE
SIP
P U
SE
RS
’ GU
IDE
SIP
P U
SE
RS
’ GU
IDE
SIP
P U
SE
RS
’ GU
IDE
USING THE 1990–1993 FULL PANEL LONGITUDINAL RESEARCH FILESUSING THE 1990–1993 FULL PANEL LONGITUDINAL RESEARCH FILESUSING THE 1990–1993 FULL PANEL LONGITUDINAL RESEARCH FILESUSING THE 1990–1993 FULL PANEL LONGITUDINAL RESEARCH FILES
12-21
Table 12-11. Variables Used to Describe Household Composition in theLongitudinal Research Files
Variable Name DescriptionFAMTYPi Type of family in the ith month (e.g., primary family, related subfamily)FAMRELi Family relationship in the ith month (e.g., reference person, spouse of family reference
person, child of family reference person)RRPi Recoded relationship to the household reference person in the ith month (e.g., household
reference person living with relatives, child of household reference person)ENTID-SPi Entry address ID of spouse in the ith monthPNSPi Person number of spouse in the ith monthENTID-PTi Entry address ID of parent in the ith monthPNPTi Person number of parent in the ith monthU-PNGj Person number of guardian in the jth waveENTID-GDj Entry address ID of guardian in the jth wave
As Table 12-12 shows, RRPi summarizes the relationship of each person to the householdreference person in month i.
Table 12-12. Relationship to the Household Reference Person in a Given Month
Edited Relationship tothe Household ReferencePerson (RRPi) Description1 Household reference person, living with relatives2 Household reference person, living alone or with nonrelatives3 Spouse of household reference person4 Child of household reference person5 Other relative of household reference person6 Nonrelative of household reference person, but related to other members of
the household7 Nonrelative of all members of the household
The household description depends on the identity of the reference person. For example, in Table12-13, the household contains a mother, her daughter, and her daughter�s son. If the mother is thehousehold reference person (RRPi = 1), her daughter is listed as a child of the householdreference person (RRPi = 4) and the daughter�s son is listed as other relative of the householdreference person (RRPi = 5). If the daughter is the reference person, her son is listed as a child ofthe household reference person (RRPi = 4) and her mother is listed as other relative of thehousehold reference person (RRPi = 5). Users should note that the household reference personcan change from one month to the next; thus, the household description could also change.
Table 12-13. Using RRP to Identify Households Containing Three Generations in theLongitudinal Research Files
Household Reference PersonRelationship to the HouseholdReference Person (RRPi) Notes
Mother as Household Reference PersonMother 1 Reference personDaughter 4 Child of reference personDaughter�s son 5 Other relative of reference personDaughter as Household Reference PersonDaughter 1 Reference personDaughter�s son 4 Child of reference personMother 5 Other relative of reference person
Six other variables in the longitudinal research file can be used to describe household and familycomposition: PNSPi, ENTID-SPi, PNPTi, ENTID-PTi, U-PNGj, and ENTID-GDj. These sixvariables identify the person number and entry address ID of the spouse, parent, or guardianliving at the same address as the person in the ith month or jth wave (in the last two cases).27 Bybuilding from these variables, the analyst can identify a variety of family configurations. Forexample, these variables can be used to identify households containing three generations.Table 12-14 displays one household containing a mother and her two children. One child (PP-PNUM = 102) has a son, and the other child (PP-PNUM = 104) has a spouse.
Table 12-14. Using PNSP and PNPT to Identify Households ContainingThree Generations in the Longitudinal Research Files
27 Parents and spouses always share the same sample unit ID (PP-ID) as the respondent. The variables are assignedvalues only in the months that people are living together. For example, a couple living together in Wave 1 wouldhave values in the PNSP and ENTID-SP variables that pointed to each other. However, if they separate (and remainmarried) in Wave 2, the PNSP and ENTID-SP variables will be assigned values of 999 (indicating that the variablesare not applicable).
USING THE 1990–1993 FULL PANEL LONGITUDINAL RESEARCH FILESUSING THE 1990–1993 FULL PANEL LONGITUDINAL RESEARCH FILESUSING THE 1990–1993 FULL PANEL LONGITUDINAL RESEARCH FILESUSING THE 1990–1993 FULL PANEL LONGITUDINAL RESEARCH FILES
12-23
Using Family-Level Income VariablesUsing Family-Level Income VariablesUsing Family-Level Income VariablesUsing Family-Level Income Variables
The longitudinal research files contain a number of family-level income variables. The familyincome variables on the longitudinal research files include the income of all related subfamilymembers. In other words, primary family members and related subfamily members are treatedas one family by the Census Bureau when calculating family-level income amounts. Thelongitudinal research files do not contain any subfamily income variables. If family incomevariables are needed that do not pool related subfamilies with primary families, those incomevariables must be created. That is done by looping over persons with PP-MISi of 1 and withcommon PP-ID, HH-ADDIDi, FID2i, and SIDi for each month.28
Table 12-15 illustrates how the family income variables on the longitudinal research files includethe income of related subfamily members. From the previous example of a primary family offive people, the primary family contains two related subfamilies. Total family income (FF-INCi)is $3,100. The incomes of all subfamily members are included in that amount.
Table 12-15. Family Income in the Longitudinal Research Files
More About Using the SIPP ID Variables:More About Using the SIPP ID Variables:More About Using the SIPP ID Variables:More About Using the SIPP ID Variables:Identifying MoversIdentifying MoversIdentifying MoversIdentifying Movers
When a person moves, the current address field (HH-ADDIDi) changes. The PP-ID, PP-ENTRY,and PP-PNUM values remain the same. The first digit (or first two digits in the 1992 Panel) ofHH-ADDIDi indicate(s) the wave in which a household is first interviewed at that new address.The remaining digits sequentially number the households that split into two or more households,as a result of a move to a different location by original sample members. Thus, new addresses inWave 2 are numbered 21, 22, and so on. New addresses in Wave 3 are numbered 31, 32, and soon. New addresses in Wave 10 are numbered 101, 102, and so on. (Readers may wish to refer toFigure 2-1 [pp. 2-10�2-14], which illustrates movement into and out of households.)
28 FIDi and SIDi are not included on the longitudinal research files. They can be merged from the core wave files orcreated by using the algorithm shown in Figure 12-4.
Table 12-16 shows that persons 101 and 102 in the first household are original sample members.Person 401 moved into the home of persons 101 and 102 in Wave 4. In Wave 7, all three movedto a new location and were joined by person 701. In the second household, person 101 is anoriginal sample member who moved to a new location in Wave 3. In the third household, person102 is an original sample member who used to live with persons 101 and 103 of the same sampleunit ID (PP-ID), but moved to a new location in Wave 3 (to a different location from person101). In the fourth household, person number 103 is an original sample member who used to livewith persons 101 and 102 of the same sample unit ID number. Person 103 moved to a newlocation in Wave 10 and was joined by person 1001, who just entered the SIPP sample. All buttwo people moved from their original location (i.e., only two people have HH-ADDIDi equal toPP-ENTRY).
Table 12-16. How to Identify Movers in the Longitudinal Research Files
Wave
SampleUnit ID(PP-ID)
EntryAddressID (PP-ENTRY)
PersonNumber(PP-PNUM)
PersonInterviewStatus(PP-MISi)
CurrentAddressID (HH-ADDIDi) Notes
123456789 11 101 1 111123456789 11 102 1 11
Persons 101 and 102 are the originalsample members
Person 103 is an original sample memberwho used to live with persons 101 and 102of the same ID. In Wave 10, person 103lives in a new location with person 1001,who just entered the SIPP sample.
The next example (Table 12-17) further illustrates how the ID system works as people move tonew addresses, additional people move in with them, and households split. A review of Figure2-1 (pp. 2-10�2-14) may help in understanding the various household changes.
! In Wave 1, there is a five-person household consisting of a husband, a wife, a daughter, ason, and a cousin. Because this is the first wave, the current address number is 11, indicating
USING THE 1990–1993 FULL PANEL LONGITUDINAL RESEARCH FILESUSING THE 1990–1993 FULL PANEL LONGITUDINAL RESEARCH FILESUSING THE 1990–1993 FULL PANEL LONGITUDINAL RESEARCH FILESUSING THE 1990–1993 FULL PANEL LONGITUDINAL RESEARCH FILES
12-25
Table 12-17. Another Example of Household Changes and Their Effects on theID Variables in the Longitudinal Research Files
address 1 of Wave 1, and the entry address number for each member of the household is thesame as the current address number. Because they are assigned in Wave 1, the personnumbers are in the 100 series and are numbered sequentially, beginning with 101.
! During Wave 2, the son joins the Army, moves into military barracks, and therefore leavesthe SIPP sample.29 The son�s record, person number 104, will contain information (either
29 Members of the armed forces are included in the SIPP sample only if they are living state-side in private housing.Those living overseas or in military barracks are not included in the SIPP sample universe.
imputed or provided by proxy) on his characteristics for the time in Wave 2 that he was stillin the sample. If he does not return to the sample during the remainder of the panel, there willbe no records for him beyond Wave 2.
! During Wave 3, the daughter marries and her husband moves into the household. The currentaddress number where the mother, father, cousin, daughter, and son-in-law live remains thesame because it is the same address. The son-in-law�s entry address number is 11 because hefirst enters the SIPP sample at an address coded 11. The person number for the son-in-law isin the 300 series (301) because he joins the SIPP sample in Wave 3.
! During Wave 4, the daughter and son-in-law move into a new house. Their current addressnumber changes to 41 to indicate that a new address has been established in Wave 4.Meanwhile, the cousin, who is over age 15, moves in with an uncle.30 The cousin�s currentaddress number changes to 42 (i.e., the second household added into the SIPP sample in thefourth wave). The assignment of address number 41 to the daughter and 42 to the cousin israndom. It could be the other way around. The uncle enters the SIPP sample and receives anaddress number of 42 and an entry address number of 42. The uncle�s person number is inthe 400 series (401) since he joins the survey in Wave 4.
! No changes in household composition are observed during Waves 5�9.
! During Wave 10, the daughter and son-in-law have a baby. This new sample member isassigned the sample unit ID of the daughter and son-in-law. The newborn�s entry address is41, since that is the current address ID of the daughter and son-in-law at the time of birth.The newborn�s person number is 1001, reflecting the fact that the newborn came into theSIPP sample in Wave 10. Meanwhile, the cousin moves to Europe and therefore leaves theSIPP sample. The uncle, even though he did not move to Europe with the cousin, also leavesthe SIPP sample because he no longer resides with an original SIPP sample member. Theirrecords are no longer listed.
Table 12-18 displays this example again, but this table depicts how the HH-ADDIDi variablechanges over time to reflect the household composition changes. The table also illustrates thestructure of the full panel data files.
There are two extremely rare occasions in which the original PP-ID, PP-ENTRY, and PP-PNUMvalues are modified:
1. The first occasion is when two separate sampling units, each containing original samplemembers, are merged, perhaps because of a marriage. In this situation, one of the original setof PP-ID and PP-ENTRY values is retained and the other set is changed to agree with theretained set. The person number values (PP-PNUM) of the changed set are modified furtherto be between 180 and 199, inclusive.
30 In the 1993 Panel, all original sample members were followed, no matter what their ages. In all other panels, onlypeople 15 years of age or older were followed when they moved to new addresses.
Table 12-18. Household Changes and Their Effects on the Household ID (HH-ADDIDi) Variable in theLongitudinal Research File
2. The second occasion is when a household splits into two new households (in which each newhousehold gains a new sample person) and later the households recombine. For example,assume that a married couple separate in Wave 3, each moving in with a sibling. Bothsiblings are assigned a person number of 301, because they entered the sample in Wave 3 atdifferent addresses (thus, HH-ADDIDi = 31 and 32). If the husband and wife reunite inWave 6, and bring the siblings with them, one sibling�s person number would be changed. Inthis case, one of the siblings would have a person number of 301 and the other would have aperson number of 680 (or some number between 680 and 699, inclusive).
Because a record in the longitudinal research file describes the person throughout the entire paneland because the sample unit ID (PP-ID) cannot change on this record, each person in a mergedhousehold whose ID values were changed is assigned two full panel records. The first recordcontains the original ID information of the person before the merge and identifies the person ashaving exited the sample at the time of the merge. The second record contains the new IDinformation and identifies the person as having entered the sample at the time of the merge.There is no way to link the two records in the longitudinal research files.31
Identifying Program UnitsIdentifying Program UnitsIdentifying Program UnitsIdentifying Program Units
Besides household and family composition data, the longitudinal research files contain detailedinformation about participation in health insurance and various government transfer programs.For most programs, three characteristics are recorded (Table 12-19):
1. Whether the person is covered;
2. Who received the income or benefit; and
3. The amount of the income or benefit.
The coverage variables identify whether the income or benefit covers that person in month i. Inother words, when a person is flagged as covered by food stamps (FOODSTMPi = 1), the personeither received the benefits directly (because he or she was the authorized food stamp recipient)or indirectly (because he or she was in the same program unit as the authorized recipient). Thecoverage variables also allow users to determine each person�s membership in each programunit. That is useful because program units often exclude some members of the family orhousehold.32 Also, as with households and families, membership in program units can changefrom one month to the next. For that reason, program unit membership and characteristics of theunit should be evaluated for each month.
31 If needed, this information can be merged from the core wave files. Chapters 10 and 13 provide details.32 In the 1984 and 1985 Panels, coverage for the Women, Infants, and Children (WIC) nutrition program wasimputed to children under 6 years old if their mother reported participation in the WIC program. Beginning with the1986 Panel, WIC coverage has been assessed directly for all sample members.
USING THE 1990–1993 FULL PANEL LONGITUDINAL RESEARCH FILESUSING THE 1990–1993 FULL PANEL LONGITUDINAL RESEARCH FILESUSING THE 1990–1993 FULL PANEL LONGITUDINAL RESEARCH FILESUSING THE 1990–1993 FULL PANEL LONGITUDINAL RESEARCH FILES
12-29
Table 12-19. Variables Describing Participation in Government Transfer Programs andHealth Insurance Programs in the 1990�1993 Longitudinal Research Files
Program CoverageAuthorizedRecipient
G1SourceCode Amount
Social Security SOC-SEC SS-PIDX 1Railroad Retirement RAILROAD RR-PIDX 2Federal SupplementalSecurity Income
� � 3
Veteran�s Benefits VETS VA-PIDX 8Aid to Families withDependent Children
Locate one of the amountvariables: G1AMT1�G1AMT10, using thecorresponding sourcevariables: G1SRC1�G1SRC10
The authorized recipient variables identify the people who actually received the income orbenefit for the people in their program units. In the longitudinal research files, those variables donot use the entry address and person number values. Instead, they use the sequence number ofthe person within the sample unit (PP-RCSEQ) to identify authorized recipients. In other words,the authorized food stamp recipient is the person for whom FS-PIDXi in month i equalsPP-RCSEQ.
Individuals who are members of a common program unit in a given month (i) can be identifiedby using the sample unit ID (PP-ID), the person�s interview status in month i (PP-MISi), and theauthorized recipient variable in month i. For example, members of a common food stamp unit inmonth i are those with PP-MISi of 1 and common values of PP-ID (a value that does not changefrom month to month) and FS-PIDXi (a value that does change from one month to the next). TheSIPP longitudinal research files do not include authorized recipient variables for Medicare andSSI programs.33
There are some exceptions to the rules:
! Social Security, Railroad Retirement, WIC, and AFDC can offer benefits solely to children.When that happens, an adult will receive the income on behalf of the children. The adult,therefore, is flagged as the authorized recipient and the income amounts appear on the recordof the adult. The adult authorized recipient, however, is not flagged as being covered by theprogram. The children are flagged as covered.
33 In effect, each person covered by these two programs is an authorized recipient, and the program units are thepeople themselves.
! Most SSI recipients are elderly and disabled adults, but they can also be children withdisabilities.34 Even so, the SSI amount is recorded on an adult�s record, not on the child�srecord. Unlike the core wave files, the longitudinal research files have no coverage variableindicating whether or not the child, adult, or both, were covered. If needed, this informationcan be merged from the core wave files. Chapter 13 provides a detailed discussion ofmerging SIPP files.
! The medical insurance variables simply reflect who is enrolled in which type of program.There are no associated amount variables.
These rules and exceptions are illustrated in Table 12-20. The household contains one AFDCunit and two food stamp units. The mother is covered by Social Security and SSI. The mother ofthe (disabled) child receives SSI on behalf of her child. The grandchild receives WIC. Everyonein the household is enrolled in Medicaid. The coverage variables are set to 2 whenever theperson is not covered by the particular program. The indicators for the authorized recipients donot use the PP-ENTRY and PP-PNUM values. Instead, they are based on the �line number� ofthe authorized recipient on the household roster. That is very different from the indicators usedon the core wave files.
Using the Unearned Income VariablesUsing the Unearned Income VariablesUsing the Unearned Income VariablesUsing the Unearned Income Variables
To save space, the Census Bureau organizes the unearned income variables differently in thelongitudinal research files than in the core wave files. As shown in Table 12-21, 10 variables oneach person�s record identify up to 10 different sources of unearned income(G1SRC1�G1SRC10). For each source identified, there is a corresponding amount variable(G1AMT1i�G1AMT10i). Income amounts are recorded with monthly resolution. The person inTable 12-21 periodically receives $500 in federal SSI and $125 in food stamps. The person doesnot receive any other source of unearned income.
When using these fields, analysts often find it helpful to realign the unearned income into newincome-specific variables.35
34 In the 1990s, the definition of qualifying disabling conditions was expanded. That change in definition resulted ina rapid expansion of the child SSI caseload.35 For example, Table 12-22 includes monthly variables for SSI and food stamps that were created by using thealgorithm in Figure 12-5.
USING THE 1990–1993 FULL PANEL LONGITUDINAL RESEARCH FILESUSING THE 1990–1993 FULL PANEL LONGITUDINAL RESEARCH FILESUSING THE 1990–1993 FULL PANEL LONGITUDINAL RESEARCH FILESUSING THE 1990–1993 FULL PANEL LONGITUDINAL RESEARCH FILES
12-31
Table 12-20. Example of Program Units, Coverage, and Benefit Amountsin the Longitudinal Research Files
a These codes are explained in the next section of text.
Income TopcodingIncome TopcodingIncome TopcodingIncome Topcoding
The Census Bureau topcodes each income variable to protect against the possibility that a usermight identify a SIPP respondent with very high income.36 While the data dictionary indicates atopcode of $33,332 for monthly income, that is also the income topcode for the wave. Thattopcode is, therefore, rarely used for a month. In most cases, the monthly income is topcoded at$8,333, which actually represents $8,333 or more. Individual amounts above $8,333 mayoccasionally be shown if the respondent�s income varied considerably from month to month
36 New topcoding procedures are being implemented with the 1996 Panel. When a longitudinal research file for the1996 Panel is available, this discussion will be revised to describe those new procedures. At present, users shouldnote that this description does not pertain to the core wave files from the 1996 Panel.
Table 12-21. Unearned Income in the Longitudinal Research Files
Figure 12-5. Creating Monthly Food Stamp and SSI Income Variables from the UnearnedIncome Variables in the Longitudinal Research Files
For each person:/*
This step is not needed in SAS*/For each month (index = mo):
If PP-MIS (mo) = 1 Then doSSI(mo) = 0FSP(mo) = 0
End If PP-MIS (mo) = 1Else do
SSI(mo) = -99FSP(mo) = -99
End ElseEnd month loop/*
Begin here for SAS*/For each G1SRC (index=i):
If G1SRC(i)=3 Then doFor each month (index=mo)
If PP-MIS (mo) = 1 Then do SSI(mo)=G1AMT(i,mo)End If PP-MIS (mo) = 1
End month loopEnd If G1SRC(i)=3Else if G1SRC(i)=27 Then do
For each month (index=mo)If PP-MIS (mo) = 1 Then do FSP(mo)=G1AMT(i,mo)End If PP-MIS (mo) = 1
End month loopEnd if G1SRC(i)=27
End G1SRC loop
within a wave. For example, if a respondent�s income from a single job was concentrated in onlyone of the four reference months, a figure as high as $33,332 could be shown.
Summary income variables on the person, family, and household records are simply the sums ofthe component variables after they have been topcoded. The summary variables are notindependently topcoded. Thus, a person with high income from several sources (multiple jobs,businesses, property) could have aggregate monthly income well over the topcode for eachsource, and yet the data could still be greatly understating the person�s true income.
As shown in Table 12-23, person 101 has wages topcoded. The person received considerablymore money in December than in the other months. Also, total family income and totalhousehold income are the sum of the income amounts (in this case, WS-ERN-AMT1i +G1AMT1i) after they have been topcoded.
USING THE 1990–1993 FULL PANEL LONGITUDINAL RESEARCH FILESUSING THE 1990–1993 FULL PANEL LONGITUDINAL RESEARCH FILESUSING THE 1990–1993 FULL PANEL LONGITUDINAL RESEARCH FILESUSING THE 1990–1993 FULL PANEL LONGITUDINAL RESEARCH FILES
12-37
Table 12-23. Example of Topcoding in the Longitudinal Research Files
PersonNumber(PP-PNUM)
CalendarMonth
HouseholdTotal Income(HH-INCi)
Family TotalIncome(FF-INCi)
Wages(WS-ERN-AMT1i)
Child SupportPayments(G1AMT1i)
101 10 $ 9,333 $ 9,333 $ 8,333 $1,000101 11 $ 9,333 $ 9,333 $ 8,333 $1,000101 12 $13,123 $13,123 $12,123a $1,000101 01 $ 5,793 $ 5,793 $ 4,543 $1,250a This figure can exceed the nominal monthly topcode of $8,333 because the person�s total earnings for the wavewere below $33,332.
As described in Chapter 4, the Census Bureau often imputes information when a person does notrespond to the survey or to a particular question. Two sources identify whether information hasbeen imputed:
1. Beginning with the 1991 Panel, all data for a wave are imputed if a person was notsuccessfully interviewed in one wave but had complete information (from either a successfulinterview or a proxy interview) in the two adjacent waves. In those cases, the value ofWAVFLG will be greater than zero and INTVW will be 3 or 4.
2. A variable of interest may be imputed. In the longitudinal research files, allocation(imputation) flags are included for the earned income, asset income, and unearned (transfer)income variables.
Other variables are also subject to editing and imputation. The edit and imputation proceduresused for the longitudinal research files differ from those used for the core wave files. Theprocedures used for the longitudinal research files make use of the full set of longitudinal datafor a person. Because the core wave files are processed individually, the edit and imputationprocedures applied to those files have, at most, 4 months of observations for a person. Theprocedures applied to the core wave files make greater use of cross-observation imputationmethods than do those applied to the longitudinal research files.37
Using WeightsUsing WeightsUsing WeightsUsing Weights
The full panel longitudinal research files include the calendar year weights (FNLWGTs) and thefull panel weight (PNLWGT). The number of calendar year weights depends on the duration of
37 The edit and imputation procedures applied to the core wave files from the 1996 Panel make greater use ofretrospective information than procedures used in earlier panels. See Chapters 4 and 10 for details.
the panel; the number varies from one calendar year weight for the 1989 Panel to three calendaryear weights for the 1993 Panel. When the 1996 full panel file is available, it will have fourcalendar year weights.
The source and accuracy statements that accompany all SIPP full panel files ordered from theCensus Bureau provide suggestions on how to use the weight variables in those files. Also,Chapter 8 of this Guide contains a full discussion of how to use weights in full panel files.
Identifying StatesIdentifying StatesIdentifying StatesIdentifying States
The longitudinal research file contains a variable (GEO-STE) that identifies 41 individual statesand the District of Columbia; the nine other states are suppressed into three groups:
1 Maine, Vermont;
2. Iowa, North Dakota, South Dakota; and
3. Alaska, Idaho, Montana, Wyoming.
Even though it is possible to identify most states, the SIPP sample was not designed to berepresentative at the state level and should not be used to produce direct state-level estimates.The state variable is included on the public use files to allow examination of how state-levelcharacteristics affect national estimates. For example, a user could apply the state-specificeligibility criteria for a means-tested program in order to arrive at a national estimate of thenumber of people eligible for the program. Because some states are not uniquely identified, somemethod of allocating the state-specific eligibility rules to sample persons in those states wouldneed to be devised.
Identifying Metropolitan AreasIdentifying Metropolitan AreasIdentifying Metropolitan AreasIdentifying Metropolitan Areas
The longitudinal research files do not contain any variables identifying metropolitan areas.Analysts who need this information should merge it from the core wave files. Chapter 11provides details about how to use the variables identifying metropolitan areas. Chapter 13provides instructions for merging data from multiple SIPP public use files.
When text copy applies to both 1996 and pre-1996 panel files, pre-1996 variable names appear inparentheses following 1996 variable names.
13-1
13.13.13.13. Linking Core Wave, TopicalLinking Core Wave, TopicalLinking Core Wave, TopicalLinking Core Wave, TopicalModule, and LongitudinalModule, and LongitudinalModule, and LongitudinalModule, and LongitudinalResearch FilesResearch FilesResearch FilesResearch Files
In many situations, a single Survey of Income and Program Participation (SIPP) data file will notcontain the information needed for a project. Because only limited core information is includedon the topical module files, analysts often need to merge data from the core wave or longitudinalresearch files with topical module information. Also, they may need to link two or more topicalmodule files, each containing data on a different topic and collected in different waves. Andthere are situations in which it is necessary to merge data from the core wave files with data fromthe longitudinal research files. Those situations arise because not all of the core wave content isincluded on the longitudinal research files (e.g., calendar month weights are only on the corewave files).1 This chapter describes procedures for linking core wave, topical module, and fullpanel data files.
This chapter assumes a working knowledge of the files that will be linked.2 Analysts who are notfamiliar with those files should read the following before proceeding with this chapter:
! Chapter 9 for an overview of the SIPP data files;
! Chapter 10 for a discussion of the core wave files;
! Chapter 11 for a discussion of the topical module files; and
! Chapter 12 for a discussion of the longitudinal research files.
In all cases, this chapter describes procedures for linking person records across files. It does notdiscuss procedures for linking households or families because those procedures becomeproblematic when working with longitudinal data.3
1 Even when the same variables are on both the core wave and longitudinal research files, the data may not be thesame. Different edit and imputation procedures are used for these two types of files. Prior to the 1996 Panel, all editand imputation procedures applied to the core wave files worked entirely within the given file. Information fromprevious waves or later waves was not used. Beginning with the 1996 Panel, edit and imputation procedures appliedto the core wave files make greater use of information from previous waves. However, because the core wave filesare processed as the data become available, it is not possible to make use of information from future waves. The editand imputation procedures applied to the longitudinal research files, however, make use of each person�s fulllongitudinal record. There are many times when the preferred data for a study will be on the longitudinal researchfiles but the weights will be on the core wave files.2 This chapter does not discuss the longitudinal research file from the 1996 Panel because, as of this writing, it is notavailable. That information will be added to an updated version of this chapter once the file becomes available. Inthe interim, the only information included in this chapter on the 1996 longitudinal research file is the new variablenames being used in the 1996 Panel data files.3 Difficulties arise when unit composition changes over time. In those situations, there is no unambiguous way todefine longitudinal households and families, and many ad hoc procedures run the risk of introducing biases into
When text copy applies to both 1996 and pre-1996 panel files, pre-1996 variable names appear inparentheses following 1996 variable names.
13-2
This chapter begins with a discussion of the mechanics involved in linking SIPP data files. Theprocedures are straightforward and easily implemented. In each case there are three basic steps:
1. Create data extracts from each of the files to be linked;
2. Sort the files in common order by using the variables identified as match keys; and
3. Merge the files.
There are two general formats that the final files can take. This chapter refers to these as person-month format (the format of the current core wave files) and person-record format (the format ofthe longitudinal research files).4 The choice of format will be a function of the planned analysisand the software that will be used for that analysis. Where appropriate, procedures for generatingeach type of data file are described.
After discussing the mechanics of linking SIPP files, this chapter discusses why nonmatchesoccur and suggests ways to deal with them.
For the 1996 Panel, most variable names changed from those of previous panels. To aid usersworking with pre-1996 panel files, this chapter presents both the old and the new variable nameswhen the text applies to both. In the main body of the text, the old names are presented inparentheses following the new names. For example, the sample unit ID variable name, which isSSUID in the 1996 Panel, was SUID in previous panels; it is written in this chapter as SSUID(SUID). In tables, a variety of methods are used to present both the old and the new names.
Procedures for Linking FilesProcedures for Linking FilesProcedures for Linking FilesProcedures for Linking Files
There are six types of merges that SIPP users commonly need to perform:
1. Person-month records within a core wave file can be linked, creating a single wide record foreach person rather than a record for each person for each month;5
2. Two or more core wave files can be linked together;
3. Core wave files can be linked to longitudional research files;
analyses of those units. The alternative approach that has gained acceptance in the research community involvesassigning to people the characteristics of the households or families to which they belong at each point in time.Subjects can then be followed over time, as can the characteristics of the households or families to which theybelong. One exception to the longitudinal household problem is with program units (e.g., food stamp units), whereprogram rules can be used to define when changing composition constitutes the formation of a new unit (as opposedto changed composition of an existing unit). For discussions of the issues involved in studying longitudinalhouseholds and families, see McMillen and Herriot (1985), Duncan and Hill (1985), Citro et al. (1986), and Kaltonet al. (1987).4 Some software (e.g., Stata) refers to this as �wide� format, while the person-month format is referred to as �long.�5 This procedure transforms the current format of the core wave files into a format similar to that used prior to the1990 Panel, a format analogous to that used for the longitudinal research files.
When text copy applies to both 1996 and pre-1996 panel files, pre-1996 variable names appear inparentheses following 1996 variable names.
13-3
4. Two or more topical module files can be linked to each other;
5. Topical module files can be linked to core wave files; and
6. Topical module files can be linked to longitudinal research files.
This chapter addresses each of these merges in turn.
Linking Within a Core Wave File—Transforming theLinking Within a Core Wave File—Transforming theLinking Within a Core Wave File—Transforming theLinking Within a Core Wave File—Transforming thePerson-Month Format into the Person-Record FormatPerson-Month Format into the Person-Record FormatPerson-Month Format into the Person-Record FormatPerson-Month Format into the Person-Record Format
This procedure transforms the person-month-format core wave files (with one record per personper month) into a single wide record per person (the format used for the core wave files beforethe 1990 Panel). As well as being useful in its own right, reformatting is often a necessary firststep when merging core wave files with data from either the topical module files or from thelongitudinal research files.
Two approaches for this link are described. Programmers using third-generation languages, suchas FORTRAN and PL/1, typically use the first approach. Programmers using fourth-generationlanguages, such as SAS and SPSS, typically use the second approach.
The first approach (using FORTRAN) contains four steps:
1. Sort the file by person and reference month, using the following variables: sample unit ID[SSUID (SUID)], entry address ID [EENTAID (ENTRY)], person number [EPPPNUM(PNUM)], and reference month [SREFMON (REFMTH)].6 This is the sort order the CensusBureau uses for the core wave files. If the file being used is in its original sort order, this stepcan be skipped.
2. Define and initialize monthly variable arrays to some �missing data� code. Users should becareful to choose initial values outside the range of legal values for the variables of interest.For example, the variable TAGE (AGE) would be defined as an array of four elements, andeach element could be initialized to �9 (an age that no one can have); the variableTPTOTINC (TOTINC) would be defined as an array of four elements and each elementcould be initialized to �999999 (a negative value outside the range of the variable), and soon.
3. Read each person�s corresponding person-month record and put the information into theappropriate element of the array.
4. Write the person-based record from the information stored in the arrays.
The second approach (using SAS) also contains four steps:7
6 In the 1996 Panel, the entry address is no longer needed to uniquely identify people. Its continued use will notcreate any problems; it is simply redundant information for purposes of identifying SIPP sample members.7 An alternative procedure that may be useful in many cases uses SAS Proc Transpose. Stata also has aprocedure�reshape�that can accomplish this task.
When text copy applies to both 1996 and pre-1996 panel files, pre-1996 variable names appear inparentheses following 1996 variable names.
13-4
1. Sort the file by person and reference month, using the following variables: sample unit ID[SSUID (SUID)], entry address ID [EENTAID (ENTRY)], person number [EPPPNUM(PNUM)], and reference month [SREFMON (REFMTH)]. This is the sort order used by theCensus Bureau for the core wave files. If the file being used is in its original sort order, thisstep can be skipped.
2. Write out four files, each one containing the person ID variables and the variables for 1 of the4 months. For example, file1 would have the person ID variables [SSUID (SUID),EENTAID (ENTRY), and EPPPNUM (PNUM)] and the variables for month one, file2would have the person ID variables and the variables for month two, and so on.
3. Rename the (monthly) variables in each of the four files to unique names. For example, thevariable names in file1 might be TAGE1 (AGE1) and PTOTINC18 (TOTINC1); in file2 thevariable names might be TAGE2 (AGE2) and PTOTINC2 (TOTINC2).
4. Merge the four files together, using SSUID (SUID), EENTAID (ENTRY), and EPPPNUM(PNUM) as the match keys.
The SAS code in Figure 13-1 performs the above steps.
The person-month format of the core wave files (before reformatting) is illustrated in Table 13-1.Person number 101 is in the sample all 4 months, person number 102 is in the sample all 4months, person number 201 is in the sample for 2 months, and person number 202 is in thesample for 1 month. The person-record format (after reformatting) is illustrated in Table 13-2.Missing data are indicated by a single period, the default missing data code in SAS. For theFORTRAN example, the missing data would have codes of �9 and �999999.
Linking Two or More Core Wave FilesLinking Two or More Core Wave FilesLinking Two or More Core Wave FilesLinking Two or More Core Wave Files
There are three reasons to link two or more core wave files:
1. To create an analysis file for one or more calendar months containing data from all fourrotation groups. For example, data for March 1994 are contained in the Wave 7 file (of the1992 Panel) for rotation groups 4 and 1, and in the Wave 8 file for rotation groups 2 and 3.(Data for the same calendar month are also in Waves 4 and 5 of the 1993 Panel.)
2. To create an analysis file containing more than 4 months of information for each person. Thislinkage is of primary interest to users of the 1996 Panel, beause longitudinal research files forall other panels are available from the Census Bureau.
3. As preparation for merging core wave data with data from either the topical module files orthe longitudinal research files.
8 Because variable names in SAS are limited to eight characters, the monthly variable name is shortened fromTPTOTINC1 (nine characters) to PTOTINC1 (eight characters).
When text copy applies to both 1996 and pre-1996 panel files, pre-1996 variable names appear inparentheses following 1996 variable names.
13-5
Figure 13-1. Sample SAS Code to Change the Core Wave Files from Person-MonthFormat to Person-Record Format from Wave 2 of the 1996 Panel
/* this creates the initial extract from the full core wave file*/data allmnths; set corewv962 (keep = ssuid eentaid epppnum srefmth tage tptotinc );run;
/* sort the data – if the master file was in its original order, this step is not needed*/proc sort; by ssuid eentaid epppnum srefmth;run;
/* write out 1 file for each of the four months, renaming variables in the process*/data file1 (rename = (tage = tage1 tptotinc = ptotinc1 srefmth = srefmth1 ) ) file2 (rename = (tage = tage2 tptotinc = ptotinc2 srefmth = srefmth2 ) ) file3 (rename = (tage = tage3 tptotinc = ptotinc3 srefmth = srefmth3 ) )
select (srefmth); when (1) output file1; when (2) output file2; when (3) output file3; when (4) output file4; end;run;
/* merge the 4 “monthly” files together, forming the final file*/data newfile; merge file1 file2 file3 file4 ; by ssuid eentaid epppnum;run;
Creating files in the person-month format is straightforward. In this instance, the files from eachof the contributing core wave files simply need to be sorted and interleaved to create the finalanalysis file. The final sort order would likely be based on SSUID (SUID), EENTAID(ENTRY), EPPPNUM (PNUM), SWAVE (WAVE), and SREFMON (REFMTH).
If a person-record format (with just one record per person) is desired, the first step is interleavingthe files to create the person-month-format file. Then, using that as the input file, analysts canapply the procedures described in the preceding section to generate a file with a single widerecord for each person. There will be up to 4 months of data for each wave used. In the examplefrom Tables 13-1 and 13-2, if three waves of data are being combined, the final file will have 12values for SREFMON (REFMTH), TAGE (AGE), and TPTOTINC (TOTINC). In the SASprogram code, the names would likely be REFMTH1�REFMTH12, TAGE1�TAGE12, andTOTINC1�TOTINC12.
Users attempting to create their own longitudinal databases from the core wave files shouldproceed cautiously. The edit and imputation procedures applied to the core wave files for the
SIPP panels prior to the 1996 Panel were all �within wave� procedures. This means that the editsand imputations applied to a person�s records in one wave were independent of those in otherwaves. Imputation procedures for most of the core wave files from the 1996 Panel are different.The new procedures do make use of information from the preceding wave. When linking dataacross waves, apparent changes in income, program participation, labor force behavior, or mostother outcomes could be due to real changes reported by the respondent, or they could be anartifact of the data editing and imputation performed by the Census Bureau. Although thisproblem arises primarily with the core wave files from panels prior to 1996, it is also true of the1996 Panel.9 9 The new imputation procedures for the 1996 Panel are expected to introduce less error than procedures used forearlier panels. Thus, the number and magnitude of spurious changes (as well as falsely imputed stability) should bereduced. Even so, imputation errors will occur, and caution is advised when using the core wave files forlongitudinal research.
When text copy applies to both 1996 and pre-1996 panel files, pre-1996 variable names appear inparentheses following 1996 variable names.
13-8
There are two ways to identify cases with edited or imputed data. In panels prior to 1996, theentire record was imputed if (1) MIS5 = 2 and MISj = 1 for j = 1, 2, 3, or 4 or (2) INTVW = 3 or4. The record was imputed in the 1996 Panel if EPPINTVW = 3 or 4. In the 1996 Panel, personswith Type Z noninterviews with prior wave information have their items imputed withprocedures that use their prior wave responses. The relatively few cases with no prior waveinformation (those in Wave 1 and those in Waves 2�12 who are new to the sample) have theirrecords imputed with the Type Z procedure used in the pre-1996 files. For all panels, if therecord was not imputed, it is necessary to check the allocation (imputation) flags associated withthe variables of interest. Once identified, users might need to implement some form oflongitudinal editing and imputation or distinguish in their analyses between �real� changes andthose that may result from the core wave data processing procedures.
Basic demographic information, such as age, race, and sex, can also appear to change from onewave to the next. In these instances, changes reflect corrections made in later interviews toinformation collected in earlier interviews; it is generally safe to assume the most recent data arecorrect.
When using the core wave files for longitudinal research, analysts should also note that thesample weights included on the core wave files are calendar month specific. These weights maynot be appropriate for the planned longitudinal analyses. Chapter 8 has a detailed discussion ofhow to use the sample weights provided with the SIPP files.
Linking Core Wave Files to Longitudinal Research FilesLinking Core Wave Files to Longitudinal Research FilesLinking Core Wave Files to Longitudinal Research FilesLinking Core Wave Files to Longitudinal Research Files
There are relatively few circumstances in which the core wave and full panels files need to belinked because, for the most part, they contain the same information.10 In general, if the sameinformation is available from both the core wave and longitudinal research files, the informationfrom the longitudinal research files is preferable because the edit and imputation procedures usedfor the longitudinal research files are believed to introduce less error than the procedures used forthe core wave files.11 However, some core information is contained only on the core wave files,and, therefore, at times it will be necessary to merge the core wave and longitudinal researchfiles.
The following steps are necessary to link data from the core wave files with data from the fullpanel files:
1. Create data extracts from the core wave and longitudinal research files;
2. Put the two extracts into the same format (either person-month format or person-recordformat);
10 Because the 1996 longitudinal research file is not complete yet, the discussion in this section pertains only to filesfor earlier panels. A revised version of this chapter will be available on the Census Bureau SIPP Web site(http://www.sipp.census.gov/sipp/) when the 1996 longitudinal research file is completed.11 See footnote 1.
When text copy applies to both 1996 and pre-1996 panel files, pre-1996 variable names appear inparentheses following 1996 variable names.
13-9
3. Sort the extracts into the same order; and
4. Merge the extracts, creating the final file.
The variables that uniquely identify people in the core wave and longitudinal research files havedifferent names. Table 13-3 shows the names for the three variables needed to match peopleacross those files for panels prior to 1996.12
Table 13-3. Variables Identifying People in the Core Wave and LongitudinalResearch Files for Panels Prior to 1996
Sample Unit ID SUID is matched to PP-IDEntry Address ID ENTRY is matched to PP-ENTRYPerson Number PNUM is matched to PP-PNUM
If the final file will be in person-record format, these are the only variables needed for the sortand merge operations (steps 3 and 4, above). If the final file will be in person-month format, thenWAVE and REFMTH are also needed.
Figure 13-2 shows the SAS code to transform data from the longitudinal research files in wide-record format into the person-month format used in the core wave files. The program creates aperson-month format file from the 1993 longitudinal research file.
Because SAS does not allow variable names with embedded dashes, the �-� characters in thevariable names have been replaced with underscore (�_�) characters. The 1993 Panel had 10waves, so the output file will have up to 40 monthly records for each person: no records arewritten for any months when pp_mis is not equal to 1. The program creates a data set with sevenvariables: SUID (renamed from PP_ID), ENTRY (renamed from PP_ENTRY), PNUM (renamedfrom PP_PNUM), REFMTH (which ranges from 1 to 4), WAVE (which ranges from 1 to 10),AGE, and TOTINC.
The REFMTH variable is computed as modulus (i/4) if it is not equal to 0, or 4 if is equal to 0.The modulus is the remainder from the division, so in month six of the panel the quantity ismodulus (6/4) = 2, in month seven it is modulus (7/4) = 3, and in month eight it is 4 (since theremainder from the division of 8 by 4 is 0).
The wave is computed as the first integer greater than or equal to i/4. For month one, i/4 = 0.25,so wave = 1. For month four, i/4 = 1, so wave = 1. For month 17, 17/4 = 4.25, so wave = 5.
The file created by the program in Figure 13-2 could be merged with an extract from the corewave files from the 1993 Panel, using SUID, ENTRY, PNUM, WAVE, and REFMTH as thematch keys. If the longitudinal research file was in its original sort order, the file created by theprogram in Figure 13-2 will already be sorted by this set of match keys. 12 Current plans call for using consistent variable names across all files from the 1996 Panel.
/* this example works with the 1993 SIPP panel – 10 waves */ set sipp93fp (keep = pp_id pp_entry pp_pnum pp_mis1 – pp_mis40 age1 – age40 totinc1 – totinc40 );
do i = 1 to 40; /* for each month */ if (pp_mis{i} eq 1) then do; /* if pp_mis is 1, use the data */ age = ages{i}; /* the age in this month */ totinc = totincs{i}; /* total income this month */
j = mod(i,4); if (j eq 0) then refmth = 4;/* the reference month */ else refmth = j;
wave = ceil(i/4); /* the wave */ output; /* write out the record */ end; end;run;
When text copy applies to both 1996 and pre-1996 panel files, pre-1996 variable names appear inparentheses following 1996 variable names.
13-11
Values for AGE and TOTINC from the core wave and longitudinal research files will not matchfor all people in all months because the core wave files and the longitudinal research files aresubjected to different edit and imputation procedures.
In addition, beginning with the 1991 Panel, a missing wave imputation procedure has beenapplied to the longitudinal research files: people who had missing data from one wave butcomplete data from the two adjacent waves had data imputed for the missing wave in thelongitudinal research files.13 This means that some people will have data in the longitudinalresearch files for months in which they have no records in the associated core wave files (thosewho were not Type Z nonrespondents).
Linking Two or More Topical Module FilesLinking Two or More Topical Module FilesLinking Two or More Topical Module FilesLinking Two or More Topical Module Files
At times it will be necessary to merge data from two or more topical module files. Any projectthat studies the relationship between subject areas covered by different topical modules willrequire such a merge. One example might be a study of the relationship between the use of healthcare services (collected in Wave 3 of the 1993 Panel) and medical expenses (collected in Wave 4of the 1993 Panel).
The mechanical process of linking topical module files is relatively straightforward. The topicalmodule files all have the same format (one record per person) and variable names, for the IDvariables are consistent across the topical module files: individuals are uniquely identified by thecombination of SSUID (ID), EENTAID (ENTRY), and EPPPNUM (PNUM).
However, a number of cautions should be noted:
1. Prior to the 1996 Panel, there were instances in which the same variable name was used indifferent topical module files for different variables. For example, in the 1990 Panel,TM8400 was used in the Wave 2 topical module for a variable that indicates whether therespondent completed 12th grade. The same variable name was used in the Wave 6 topicalmodule to indicate whether the respondent was a parent of children under 21 years of ageliving in his or her household.
2. Not all people with records in one topical module file will have records in another topicalmodule file. In the topical module files from the 1996 Panel, there will generally be a recordfor each person who was a responding SIPP household member in the fourth month of thewave�s core reference period. Prior to the 1996 Panel, all household members in the interviewmonth have topical module records for a given wave. However, household compositionchanges from one wave to the next: some people leave SIPP households and others join SIPP
13 Many of these situations arise with Type Z nonrespondents: nonresponding people who live in households withother responding sample members. Type Z nonrespondents in the pre-1996 core wave files and those in the 1996Panel files with no prior wave information were subjected to a whole-record imputation procedure, described inChapter 10. These people would have records in the core wave files, but different information�because it wasimputed using different procedures�in the longitudinal research files.
When text copy applies to both 1996 and pre-1996 panel files, pre-1996 variable names appear inparentheses following 1996 variable names.
13-12
households, and this changing composition is reflected in the topical module files. Also, inthe 1996 Panel, some people who were nonrespondents in month four of one wave may havebeen respondents in month four of another wave. Thus, when topical module files aremerged, there will be a nontrivial number of nonmatches: people with data from only one ofthe topical modules. Nonmatches are addressed in greater detail later in this chapter.
3. Choosing appropriate weights is complicated by the fact that there are a substantial numberof nonmatches across topical modules. One solution is to use one of the weights from thelongitudinal research files. Chapter 8 gives a detailed discussion of the SIPP weights.
Often it will be necessary to merge additional information (such as sample weights) from thecore wave or longitudinal research files when working with multiple topical modules.
Users interested in measuring change with data from the topical module files (such as changes inasset holdings, or changes in health or disability status) should proceed with caution. First, insome instances measurement error is large relative to the actual changes that have taken place.One example is found in the topical modules that measure levels of household assets andliabilities.14 Although the topical modules can provide estimates of aggregate-level changes inthose instances, users should not attempt to measure those changes at the individual level. Also,the edit and imputation procedures applied to the topical module files are all �within wave�procedures. This means that the edits and imputations applied to a person�s records in one waveare independent of those in other waves. When data are linked across waves, apparent changescould be due to real changes reported by the respondent or they could be artifacts of the dataediting and imputation performed by the Census Bureau.
There are two ways to identify cases with edited or imputed data. In panels prior to 1996, theentire record was imputed if (1) PP-MIS5 = 2 and PP-MISj = 1 for j = 1, 2, 3, or 4 or (2)INTVW = 3 or 4. In the 1996 Panel, the record was imputed if (1) EPPMIS4 = 2 or (2)EPPINTVW = 3 or 4. In the 1996 Panel, persons with Type Z noninterviews who have priorwave information have their records imputed with procedures that use their prior waveresponses. For persons with no prior wave information (those in Wave 1 and those in Waves 2�12 who are new to the sample), the Type Z imputation procedure is used. On all panels, usersshould check the imputation flags associated with the variables of interest.
Linking Topical Module Files to Core Wave FilesLinking Topical Module Files to Core Wave FilesLinking Topical Module Files to Core Wave FilesLinking Topical Module Files to Core Wave Files
Because the topical module files contain only limited information from the SIPP core, there willbe many times when it is necessary to merge data from the topical module files with data fromthe SIPP core. One source of these data is the core wave files.15
14 See the SIPP Quality Profile, 3rd Ed. (U.S. Census Bureau, 1998a) and SIPP Working Paper series for discussionsof this issue as it relates to this and other SIPP topical modules.15 The next section describes procedures for merging topical module files with data from the longitudinal researchfiles.
When text copy applies to both 1996 and pre-1996 panel files, pre-1996 variable names appear inparentheses following 1996 variable names.
13-13
The first decision that must be made is which core wave file to use. Special attention should bepaid to the reference periods for the topical module items of interest. In the 1996 Panel, topicalmodule questions refer to either month four of the wave�s core reference period, or to a longerperiod in the past (such as the preceding 12 months or the prior calendar year). In thoseinstances, information would come from the month-four records of the core wave files from thesame wave (and possibly from earlier months and waves). Prior to the 1996 Panel, many topicalmodule items referred to conditions in the interview month. The interview month, however, isnot included as a separate record in the core wave file for the same wave as the topical module.16
Rather, core information for the interview month of one wave is found in the month-oneinformation from the following wave. For example, the interview month for Wave 3 is month 13in the SIPP panel, and core data for month 13 are collected as the first reference month of Wave4.17 Commonly used reference periods for topical module items are the current (interview) month(month one of the next wave), the previous month (month four of the current wave), the previous4 months (the full reference period for the current wave), and the previous year.
The topical module files have one record per person, while the core wave files have up to fourrecords for each person (one record per person for each month the person was a SIPP samplemember). There are at least three options available when merging topical modules with datafrom the SIPP core wave files:18
1. Pick a single month from the core wave files. For example, if the topical module items usethe interview month as their reference period, it may make sense to use records for monthone from the core wave files from the next wave.
2. Spread the topical module data across all records from the core wave file. That results in afinal file in person-month format.
3. Create a single record for each person from the appropriate core wave file and merge thetopical module data to that record. This results in a final file in the person-record format withthe same monthly detail as in the second option described above.
The steps involved are as follows:
1. Create an extract from the core wave file(s) of interest.
2. If a single record for each person is desired, apply the algorithm in Figure 13-1, which isdescribed in the section entitled Linking Within a Core Wave File�Transforming thePerson-Month Format into the Person-Record Format.
16 Some of the interview month information is contained on the records for the four reference months of the wave.But in the person-month-format file there is no separate record for the interview month itself.17 Information collected during the interview month of one wave may not match the information collected about thesame calendar month in the subsequent wave. In the 1996 Panel, dependent interviewing techniques and otherchecks made possible with CAI are used to help resolve those inconsistencies.18 Yet another option is to create a single record from the core wave files containing aggregate measures for thereference period of interest. For example, it might make sense to create a single record from the �current� core wavefile with total income received during all 4 months of the wave�s reference period. Or the average number of hoursworked per week during the previous 4 months might be appropriate. Once the aggregate record is created, themerge step is similar to the others described in this section.
When text copy applies to both 1996 and pre-1996 panel files, pre-1996 variable names appear inparentheses following 1996 variable names.
13-14
3. Sort the core wave extract using SSUID (SUID), EENTAID (ENTRY), and EPPPNUM(PNUM) as the sort keys. These three variables uniquely identify people in the core wavefiles. If the core wave extract is in the person-month format, include SREFMON (REFMTH)as the final sort key.
4. Create an extract from the topical module file of interest. Sort the topical module extractusing SSUID (ID), EENTAID (ENTRY), and EPPPNUM (PNUM) as the sort keys.
5. For the 1996 Panel, merge the core wave extract with the topical module extract; use SSUID,ENTAID, and EPPPNUM as the sort keys. For panels prior to 1996, merge the core waveextract with the topical module extract; use the sort keys shown in Table 13-4.
Table 13-4. Variables Identifying People in the Topical Module andCore Wave Files for Panels Prior to 1996
Variable Topical Module Files Core Wave FilesSample Unit ID ID is matched to SUIDEntry Address ID ENTRY is matched to ENTRYPerson Number PNUM is matched to PNUM
When data from panels prior to 1996 are used, there will likely be a nontrivial number ofnonmatches between the core wave files and the topical module files. That will be true evenwhen a topical module is merged with core data from the same wave, because people who weremembers of a SIPP household in the interview month but not during the previous 4 months willhave records in the topical module files but not in the core wave files.
Linking Topical Module Files to Longitudinal Research FilesLinking Topical Module Files to Longitudinal Research FilesLinking Topical Module Files to Longitudinal Research FilesLinking Topical Module Files to Longitudinal Research Filesfrom Pre-1996 Panelsfrom Pre-1996 Panelsfrom Pre-1996 Panelsfrom Pre-1996 Panels
While topical module files can be linked with data from the core wave files, there are many timeswhen it will be necessary or desirable to use the longitudinal research files instead.19 Forexample, if the full panel weights20 are needed for the planned analysis, they must come from thelongitudinal research files. When the same core items are available from the core wave and thelongitudinal research files, analysts may prefer to use the longitudinal research files because theedit and imputation procedures used for them are believed to introduce less error than theprocedures used for the core wave files.
19 Because the full panel longitudinal research file for the 1996 SIPP was still under development at the time thischapter was written, it is not yet possible to describe procedures for using that file. A revised version of this chapterwill be available once the longitudinal research file for the 1996 Panel is released to the public.20 Chapter 8 discusses the SIPP weights, their derivation, and use.
When text copy applies to both 1996 and pre-1996 panel files, pre-1996 variable names appear inparentheses following 1996 variable names.
13-15
The steps involved are as follows:
1. Create an extract from the longitudinal research file.
2. If a file in the person-month format is desired, apply the algorithm described in the sectionabove, Linking Core Wave Files to Longitudinal Research Files. The example in Figure 13-2can be adapted to that purpose, but the ID variables would need to be renamed to match thoseused in the topical module files rather than in the core wave files (Table 13-5).
3. Sort the full panel extract; use PP-ID, PP-ENTRY, and PP-PNUM as the sort keys. Thesethree variables uniquely identify people in the longitudinal research files. If the full panelextract is in the person-month format, include WAVE and REFMTH as the final sort keys.
4. Create an extract from the topical module file of interest. Sort the extract; use ID (thevariable name for the sample unit ID in the topical module files), ENTRY, and PNUM as thesort keys.
5. Merge the core wave extract with the topical module extract based on the sort keys describedhere and shown in Table 13-5.
Table 13-5. Variables Identifying People in the Topical Module andLongitudinal Research Files Prior to the 1996 Panel
Sample Unit ID ID is matched to PP-IDEntry Address ID ENTRY is matched to PP-ENTRYPerson Number PNUM is matched to PP-PNUM
Because the longitudinal research files contain a record for every person who was ever a memberof a SIPP household, every person with a record in a topical module file should have a record inthe longitudinal research file. However, analysts working with a person-month-format filecontaining records only for months when PP-MIS = 1 may find nonmatches.
Nonmatches When Merging FilesNonmatches When Merging FilesNonmatches When Merging FilesNonmatches When Merging Files
SIPP is designed to follow a group of people over an extended period of time. This groupincludes only those who were interviewed in the first wave of the panel and the childrensubsequently born to or adopted by them.21 Over the course of the panel, these original samplemembers are followed and interviewed every 4 months. Secondary sample members, on the
21 In the 1993 Panel all original sample members were followed no matter what their ages. In all other panels, onlyoriginal sample members aged 15 years or older are followed when they move to new addresses. In all cases,however, the SIPP data files contain a record for all people, including children, who reside in a household with atleast one original panel member present.
When text copy applies to both 1996 and pre-1996 panel files, pre-1996 variable names appear inparentheses following 1996 variable names.
13-16
other hand, are part of the SIPP sample only for as long as they continue to reside with at leastone original sample member. As long as they are part of the SIPP sample, the secondary samplemembers are interviewed and included in the SIPP data files.
The problem of nonmatches occurs only when users merge across waves for any types of files.There is no matching problem when the same or different types of files are merged within thesame wave.
As shown in Table 13-6, there are a variety of reasons why a person may be in one SIPP data filebut not in another. All but one of the reasons are associated with people entering and leaving theSIPP sample:22
1. The original sample person may have left the SIPP sample universe (e.g., died, movedabroad, moved into military barracks, or moved into an institution);
2. The original sample person may have left the sample but is still in the sample universe(sample attrition);
3. The original sample person may have just reentered the SIPP sample universe (after livingabroad, etc.);
4. The person is a newborn (a special case of a person joining the sample universe);
5. The secondary sample member has just begun living with an original sample person;
6. The secondary sample member no longer lives with an original sample member;
7. The person had data for a �missing wave� imputed in the longitudinal research file and hasno records in the core wave or topical module files for that wave; and
8. Prior to the 1996 Panel, the Census Bureau may have intentionally altered the identificationinformation of the person, thereby making it difficult to find a match for this person (in raresituations referred to as merged households).
A person�s reason for leaving the SIPP sample is identified in the core wave and longitudinalresearch files. In the former, the variable name is ULFTMAIN (REALFT). In the longitudinalresearch files, the name is REASLEFT, and it has a value for each wave rather than each month.Figure 13-3 shows the variable values and corresponding descriptions.
Procedures for dealing with nonmatches vary, depending largely on the reasons the personentered or left the SIPP sample. A number of common scenarios are presented below.
22 The SIPP following rules are described in greater detail in Chapter 2.
When text copy applies to both 1996 and pre-1996 panel files, pre-1996 variable names appear inparentheses following 1996 variable names.
13-17
Table 13-6. Reasons for Nonmatches
Reasons
File #1(earlier timeperiod)
File #2(later timeperiod)
People Exiting the SampleOriginal sample people left the SIPP sample universe (left the population ofinference) Person died Moved abroad�left sample universe Moved into military barracks�left sample universe Moved into an institution�left sample universe
Present Not present
Original sample person exited from the sample (still in the sample universe butno longer in the sample) Refused to be interviewed
Present Not present
Secondary sample person no longer lives with an original sample member Present Not presentPeople Entering the SampleNewborn Not present PresentOriginal sample person returns to SIPP sample universe (returns to thepopulation of inference) Moved from abroad�entered sample universe Moved from military barracks�entered sample universe Moved from an institution�entered sample universe
Not present Present
Original sample member returns to sample Original sample member agrees to be interviewed and returns to sample
Not present Present
Secondary sample person now lives with an original sample member Not present PresentMissing Wave Imputation in the Longitudinal Research File (Beginning with the 1991 Panel)Person has data in the longitudinal research file but no data in the corresponding wave in the core wave or topicalmodule files.Merged Households�Special Case�Old� version of the ID information Present Not present�New� version of the ID information Not present Present
Exiting or Entering the PopulationExiting or Entering the PopulationExiting or Entering the PopulationExiting or Entering the Population
There is a fundamental distinction between situations in which people leave the sample becausethey leave the SIPP sample universe and situations in which they leave the sample despite thefact that they are still part of that population. The SIPP sample universe (the population that theSIPP sample represents) is the noninstitutionalized, resident population of the United States. Itincludes both civilian and military people; it includes adults and children who reside in theUnited States and outside of institutions.
People who leave this population because they die, move abroad, or move into institutions exitthe SIPP sample because they are no longer a part of the population that SIPP represents. Ingeneral, when nonmatches occur because people have entered or exited the populationrepresented by the SIPP sample, data should not be imputed and weights should not be adjustedfor the period when these people are outside of that population. From the perspective of SIPP,these people do not exist when they are outside of the population represented by the sample.
When text copy applies to both 1996 and pre-1996 panel files, pre-1996 variable names appear inparentheses following 1996 variable names.
13-18
Figure 13-3. Data Dictionary Entries for Variables Identifying the Reason a PersonLeft the SIPP Sample
Wave 2, 1996 Panel Core Wave FileD ULFTMAIN 2 606T PE: UNEDITED VARIABLE - Main reason left Household What is the main reason ... left the household?U Movers from households which contain sample persons at the time of
interview, movers from a household which splits into multiplehouseholds. Note: This is an unedited field and the universe is notexact.<BR>
V 0 .Not answeredV 1 .DeceasedV 2 .InstitutionalizedV 3 .On active duty in the Armed ForcesV 4 .Moved outside of U.S.V 5 .Separation or divorceV 6 .MarriageV 7 .Became employed/unemployedV 8 .Due to job change – otherV 9 .Listed in error in prior waveV 10 .OtherV 11 .Moved to type C household
1993 Full Panel Files
D REASLEFT 9 143 9 1 Range = (0:9) Preedited reason for leaving the Household Control Card item 23U Persons who left at any time during the reference period Subscript 1: not applicable for Observation 1 Subscript 2 - 8: reason left in Observations 2 – 8V 0 .Not applicable or not answered or nonmatchV 1 .Left – deceasedV 2 .Left – institutionalizedV 3 .Left - living in armed forces barracksV 4 .Left - moved outside of countryV 5 .Left - separation or divorceV 6 .Left - person #201 or greater no longer living with sample personV 7 .Left – otherV 8 .Entered merged householdV 9 .Interviewed in previous wave but not in sample
When text copy applies to both 1996 and pre-1996 panel files, pre-1996 variable names appear inparentheses following 1996 variable names.
13-19
Figure 13-3. Data Dictionary Entries for Variables Identifying the Reason a PersonLeft the SIPP Sample (continued)
1993 Core Wave Files
D REALFT 2 521 Reason for leaving the household Applicable when previous wave address ID is not equal to control card address ID Range=(00:00,05:12,25:31,99:99)U All persons, including children, no longer in the householdV 00 .Not applicable or not answeredV 05 .Left – deceasedV 06 .Left – institutionalizedV 07 .Left – living in Armed Forces barracksV 08 .Left – moved outside of countryV 09 .Left – separation or divorceV 10 .Left – person #201+ no longer living with sample personV 11 .Left – otherV 12 .Left – entered merged household* Should have been deleted in a previous wave:V 25 .Left – deceasedV 26 .Left – institutionalizedV 27 .Left – living in Armed Forces barracksV 28 .Left – moved outside of countryV 29 .Left – separation or divorceV 30 .Left - 201+ person no longer living with sample personV 31 .Left – otherV 99 .Listed in error
The following examples help explain why weighting adjustments and imputation are problematicin these situations:
! A person is in the SIPP sample at Time 1 but dies before Time 2. In this case, the person isnot part of the population at Time 2. In computing the aggregate (total) income of thepopulation at Time 1, this person�s income would be included. To impute income to thisperson for the Time 2 observation, analysts would compute an aggregate income that is toohigh: The person had no income at Time 2, and so none should be imputed.23 If this case isdropped from the analysis file and the weights are inflated for the remaining sample, theestimate of the total population at Time 2 would be too high. Because this person was not apart of the population at Time 2, the weights for the remaining sample members should notbe inflated to represent this individual.
23 If the person had been alive with income that she or he did not report to the Census Bureau, an estimate of his orher unreported income would be imputed to the individual. Failing to impute that unreported income would meanthat the income received by a member of the population is not represented anywhere in the sample. That valuewould result in a sample estimate of aggregate income in the population that was lower than the actual value in thepopulation.
When text copy applies to both 1996 and pre-1996 panel files, pre-1996 variable names appear inparentheses following 1996 variable names.
13-20
! A person is overseas at Time 1 but at Time 2 is living with an original sample member in theUnited States. At Time 1, this person was not part of the population represented by the SIPPsample. Because this person was not a part of that population, the SIPP sample should not beadjusted in any way to represent this individual.
A number of strategies are possible for dealing with cases in which nonmatches result frompeople entering or leaving the population represented by the SIPP sample. One approach is todrop those people from the analysis sample entirely. No adjustment would be made to theweights of the remaining cases. However, the definition of the population represented by theremaining sample would change. The remaining sample represents the population that existed atboth Time 1 and Time 2. It does not represent anyone who either entered or left the population.
That approach has the advantage of being simple to implement. It also results in a clearly definedpopulation of inference. Caution is necessary, however, to the extent that people entering andleaving the population are systematically different from those who are present throughout theperiod being studied: the remaining sample cannot be used to draw inferences about this otherpart of the population. People entering and leaving prisons and nursing homes, for example,likely have very different income profiles than the population that remains outside of theseinstitutions over the period under study.
If event-history models are used to analyze the data, another approach is possible.24 With thesemodels, exits from the population can be treated as competing outcomes. For example, in a studyof unemployment dynamics, a competing risks model might allow for three possible outcomes:spells of unemployment can end because (1) a person becomes employed, (2) a person exits thelabor force, or (3) a person exits the population.25
Exiting the Sample but Remaining in the PopulationExiting the Sample but Remaining in the PopulationExiting the Sample but Remaining in the PopulationExiting the Sample but Remaining in the Population(Sample Attrition)(Sample Attrition)(Sample Attrition)(Sample Attrition)
Sample attrition occurs when people leave the SIPP sample but remain a part of the populationrepresented by that sample. In these instances the remaining sample generally should be adjustedto represent the full population, including the part of the population represented by those wholeave the sample.
There are several options for handling such cases:
! Impute the missing data and proceed. This option is appropriate for researchers familiar withthe statistical literature on imputation for missing data. A full discussion of this topic is wellbeyond the scope of this manual. Analysts are cautioned, however, against using the commonpractice of �substituting the mean� for missing data. That practice can yield biased estimates
24 For a description of these methods, see, for example, Tuma and Hannan (1984).25 In actual applications, more than three outcomes would likely be modeled. The determinants of entering a nursinghome, for example, are likely quite different from the determinants of entering a prison.
When text copy applies to both 1996 and pre-1996 panel files, pre-1996 variable names appear inparentheses following 1996 variable names.
13-21
of multivariate statistics (such as regression coefficients) and generally leads to downward-biased estimates of standard errors.
! Drop cases with missing data, adjust (poststratify) the weights for the retained cases, andproceed. This poststratification involves several steps.
1. Tabulate the weighted number of cases by various socioeconomic categories beforedropping any cases.
2. Repeat the tabulation after dropping the nonmatches.
3. Compute adjustment factors by dividing the weighted numbers from step 1 (beforedropping any cases) by the weighted numbers from step 2 (after dropping cases).
4. Create a new weight variable by multiplying the original weight variable by theappropriate poststratification factor computed in step 3.
This situation requires caution. A user who drops records may introduce selection biases becausethose in the retained sample may be more stable than those who leave. For example, the fact thata (former) sample member has left may be associated with other changes in that person�s life,such as giving birth, getting married, or getting a new job. Because the person left the sample, itis not possible to know from the available data what changes actually did occur in each case.Also, when records are dropped, the procedures for computing standard errors as described in thesource and accuracy statements provided with the data will no longer apply. The proceduresdescribed in Chapter 7 for the direct estimation of standard errors should, however, work withoutany modification. If the number of cases lacking complete information is small relative to the fullanalysis sample (the full sample with positive weights), the biases introduced by dropping thosecases also are likely to be small and this procedure may be a viable alternative.
! If the longitudinal research file is available, use a subset of the cases with complete data forwhich Census Bureau�provided weights are available and proceed. At the extreme, thisprocedure entails retaining only cases with positive full panel weights and using thoseweights for any analyses performed.26 This is a conservative approach, but one that isrelatively easy to implement because the weights already exist, they have already beenadjusted for the observed sample attrition, and the population of inference is clearly defined.
! Use other missing data methods to provide estimates and their standard errors. A fulldiscussion of these methods is beyond the scope of this manual. The methods are designed tomake use of all available information from the cases with complete data without (directly)imputing data to cases with incomplete information. Interested users can consult the literatureon the E-M algorithm for one example of how this can be done.27 Also, Skinner et al. (1989)discuss model-based approaches to the analysis of complex surveys with missing data.
26 The calendar year weights on the longitudinal research files are also options worth exploring. Chapter 8 provides adetailed discussion of the SIPP sample weights, their derivation, and use.27 For example, see Little and Rubin (1987). Users should also note that some statistical packages (e.g., SPSS) haveincorporated more sophisticated options for handling missing data than have generally been available in the past.
When text copy applies to both 1996 and pre-1996 panel files, pre-1996 variable names appear inparentheses following 1996 variable names.
13-22
Missing Wave Imputation in the Longitudinal Research FilesMissing Wave Imputation in the Longitudinal Research FilesMissing Wave Imputation in the Longitudinal Research FilesMissing Wave Imputation in the Longitudinal Research FilesPrior to 1996Prior to 1996Prior to 1996Prior to 1996
Beginning with the 1991 Panel, a missing wave imputation procedure has been applied to thelongitudinal research files: persons who had missing data from one wave but complete data fromthe two adjacent waves had data imputed for the missing wave in the longitudinal researchfiles.28 Some of those cases are Type Z nonrespondents and will have records with different datain the core wave files.29 Other people will have data in the longitudinal research files for monthswhen they have no records in the associated core wave or topical module files.
The correct procedure for dealing with the resulting nonmatches depends on which weightvariables will be used. If the weights are coming from the core wave or topical module files,observations from the longitudinal research files not present in the cross-sectional files should bedropped. That is because the weights on the core wave and topical module files are computed forthe samples in those files, samples that do not include the people who have had that waveimputed in the longitudinal research files.
If the weights are coming from the longitudinal research file, then other procedures must be usedto deal with the missing data from the core wave and topical module files. In those instances, theprocedures described for dealing with sample attrition should be considered.
Merged Households in Panels Prior to 1996Merged Households in Panels Prior to 1996Merged Households in Panels Prior to 1996Merged Households in Panels Prior to 1996
Finally, nonmatches can occur when the Census Bureau changes the ID numbers for samplemembers.30 Prior to the 1996 Panel, there were two very rare occasions when this happened. Thefirst occurred when two separate sampling units, each containing original sample members, weremerged together, perhaps because of a marriage. In this situation, the people in one of thesampling units retained their identification information, while the people in the other samplingunit had their identification information changed to agree with the retained set. The personnumbers of the changed set were modified to be between 180 and 199.
The second instance occurred when a SIPP household split into two new households (in whicheach new household gained a new sample person), which later recombined. For example, a
28 Imputed waves can be identified on the longitudinal research files by using the WAVFLG variable.29 The data are different because different imputation procedures are used.30 Because the Census Bureau is using new procedures in the 1996 Panel, merged households will not be anidentifiable source of nonmatches when files from the 1996 Panel are merged. Rather, they will appear no differentfrom other situations where people enter and leave the SIPP sample, such as through marriages, divorces, deaths,and sample attrition. For example, in the 1996 Panel, there will be no way to identify which (if any) of the peoplewho appear to have entered the sample in Wave 3 were also sample members who appear to have left the samplefollowing Wave 2. The �new� sample members will be given person numbers in the same range as others who enterthe sample in Wave 3, and no previous wave information will be attached to them. The new procedures greatlysimplify the handling of these rare cases for both the Census Bureau and outside data users.
When text copy applies to both 1996 and pre-1996 panel files, pre-1996 variable names appear inparentheses following 1996 variable names.
13-23
married couple separated in Wave 3, each moving in with a sibling. Both siblings were assigneda person number of 301, because they entered the sample in Wave 3 at different addresses. If thehusband and wife reunited in Wave 6, bringing the siblings with them, one sibling�s personnumber was changed. In this case, one of the siblings would have a person number of 301 andthe other would have a person number of 680 (or some number between 680 and 699 because thehouseholds recombined in Wave 6).
Different file types (i.e., core wave, topical, and full panel) keep track of the changed ID valuesdifferently. If the move occurred after the first month of a reference period, the core wave filecontains two records for the person whose identification information changed. The first recordcontains the original identification information of the person before the move and identifies theperson as having exited the sample at the time of the move. The second record contains the newidentification information after the move and identifies the person as having entered the sampleat the time of the move. When the move occurs at the start of a reference period, only the secondrecord is retained in the core wave file. The topical module file, however, contains only thesecond record, no matter when the move took place. The longitudinal research file contains bothrecords, no matter when the move took place.
The easiest way to find these people is to search the core wave file for people with a previouswave identified as present, that is, PWSUID > 0 or PWENTRY > 0 or PWPNUM > 0. Users thenneed to decide how they want to handle these special cases. There are several possibilities:
! Change the identification information used in the waves before the move to the new valuesseen in the wave(s) after the move, and then merge the records using these ID values. Thisoption is useful when working primarily with the person�s core wave data after the move.
! Change the identification information in the waves after the move to the original values, andthen use those ID values to merge records. This option is useful when working primarily withthe person�s core wave data before the move.
! Duplicate the person�s record, and use the initial identification information with one recordand the new identification information with the other record; then merge those records. Withthis approach, the weights for the duplicated records will need to be adjusted so that theduplicated weights sum to the original (unduplicated) weights.
! Treat this person as two people: once as someone who exits the sample at the time of themove and once as someone who enters the sample at the time of the move. That is how thesecases are treated in the longitudinal research files. The weighting implications of thisapproach depend on the planned analysis.
AppendixesAppendixesAppendixesAppendixes
A-1
A.A.A.A. SIPP Users’ GuideSIPP Users’ GuideSIPP Users’ GuideSIPP Users’ Guide Variable Variable Variable VariableCrosswalk: 1993 to 1996Crosswalk: 1993 to 1996Crosswalk: 1993 to 1996Crosswalk: 1993 to 1996
This appendix contains four sections showing the correspondences between the core wave filevariables in 1993 and those in 1996. The sections differ by order as follows:
The topcoding of earnings amounts is based on the procedure used by the Current PopulationSurvey (CPS). Monthly amounts are topcoded if the wave amount is greater than one-third of theannual earnings benchmark of $150,000. The Survey of Income and Program Participation(SIPP) uses the benchmark of $150,000 set by CPS to �annualize� the topcoding procedure. SIPPtopcodes on a monthly basis (reporting level) for amounts exceeding $12,500 (1/12 of $150,000)if the wave amount is greater than $50,000 (1/3 of $150,000). The topcoded amounts are definedonce for the Panel based on Wave 1 edited data.
Three variables require topcoding:
! EPM(1-4)SUM�wage and salary earnings,
! EBM(1-4)SUM�self-employed earnings,
! EMLM(1-4)SUM�earnings from additional jobs and moonlighting.
To compute the topcodes, the Census Bureau tallies all amounts that require topcoding based onthe above criteria into a 12-cell matrix. The cells are based on sex, race/ethnic origin, and full-time/part-time worker definition. When all values have been tallied, a mean is computed for eachcell based on the total amount divided by total number of occurrences. Those means will be usedfor the entire 1996 Panel with an adjustment for inflation and real growth in earned income of1.019% per wave for all remaining waves in the panel.
Topcoding Earnings for the 1996 SIPP PanelTopcoding Earnings for the 1996 SIPP PanelTopcoding Earnings for the 1996 SIPP PanelTopcoding Earnings for the 1996 SIPP Panel
If the sum of the monthly earnings amounts for a job for the wave is greater than $50,000, thenthose monthly amounts that are greater than $12,500 are topcoded. After matching on sex,race/ethnic origin, and labor force status, the Census Bureau uses the topcode amounts from thetopcoding matrix for earnings. See Table B-1 for examples of income amounts that need to betopcoded.
with the mean3 $15,000 $15,000 $10,000 $12,000 $52,000 Yes Topcode months 1
and 2 with themean
4 $12,000 $12,000 $12,000 $15,000 $51,000 Yes Topcode month 4with the mean
5 $0 $0 $0 $49,000 $49,000 No None6 $15,000 $15,000 $15,000 $15,000 $60,000 Yes Topcode all 4
months with themean
Specification of the Matrix for Calculating theSpecification of the Matrix for Calculating theSpecification of the Matrix for Calculating theSpecification of the Matrix for Calculating theMeans for EarningsMeans for EarningsMeans for EarningsMeans for Earnings
The mean values are created by summing the reported monthly amounts that are greater than$12,500 and dividing by the total number of inputs to the cell.
For cells with fewer than six amounts, create a mean value by summing all values for those cellswith fewer than six amounts and dividing by the total number of inputs to the cells. Matrixdefinition: 2 × 3 × 2 matrix for sex, race, and labor force status
SexSexSexSex
Use the edited variable ESEX with the following values:
ESEX: 1 = Male
2 = Female
RaceRaceRaceRace
Set the index RACORIG, using the edited ERACE and EORIGIN, as described below:
Create the index variable RACORIG, defined as follows:
RACORIG: 1 = Nonblack, non-Hispanic
2 = Black, non-Hispanic
3 = Hispanic, any race
IF (EORIGIN = 20 - 28) THEN RACORIG = 3
ELSE IF (ERACE = 2) THEN RACORIG = 2
ELSE THEN RACORIG = 1
Labor Force StatusLabor Force StatusLabor Force StatusLabor Force Status
Set the index FTFULYR, which will define a worker as a full-time, full-year or a full-time, notfull-year worker.
FTFULYR:
1 = Yes, full-time, full-year worker
2 = No, not full-time, full-year worker
IF (RM1ESR = 1 AND RM2ESR = 1 AND RM3ESR = 1 AND RM4ESR = 1) AND
(the number of variables in the EHRSWK01 - EHRSWK(EMAX) array that equal 1 is greaterthan EMAX/2)
THEN FTFULYR = 1 (YES)
ELSE FTFULYR = 2 (NO)
Filling the Matrix to Create the Means for TopcodingFilling the Matrix to Create the Means for TopcodingFilling the Matrix to Create the Means for TopcodingFilling the Matrix to Create the Means for Topcoding
Perform the following calculations in the order shown:
! Sum the four monthly amounts reported for EPM1SUM, EPM2SUM, EPM3SUM, andEPM4SUM. If the sum is greater than $50,000, then store the amounts greater than $12,500in the appropriate cell in the matrix (matched on ESEX, RACORIG, FTFULYR).
! Sum the four monthly amounts reported for EBM1SUM, EBM2SUM, EBM3SUM, andEBM4SUM. If the sum is greater than $50,000, then store the amounts greater than $12,500in the appropriate cell in the matrix (matched on ESEX, RACORIG, FTFULYR).
! Sum the four monthly amounts reported for EMLM1SUM, EMLM2SUM, EMLM3SUM,and EMLM4SUM. If the sum is greater than $50,000, then store the amounts greater than$12,500 in the appropriate cell in the matrix (matched on ESEX, RACORIG, FTFULYR).
! Sum the values in each cell and divide by the number of inputs to the cell for the meanamount for the cell.
! For cells with fewer than six inputs, create the mean by combining all of the amounts fromeach of the cells and dividing by the total number of inputs to the cells. Use this mean for allcells with zero to six entries.
Table B-2. Earnings Topcodes
Sex Race Worker Status TopcodeSex = 1 (Male) Nonblack, non-Hispanic Full year, full time $29,660Sex = 1 (Male) Nonblack, non-Hispanic Not full year, full time $38,270Sex = 1 (Male) Black, non-Hispanic Full year, full time $17,530Sex = 1 (Male) Black, non-Hispanic Not full year, full time $24,015Sex = 1 (Male) Hispanic, any race Full year, full time $26,250Sex = 1 (Male) Hispanic, any race Not full year, full time $24,015Sex = 2 (Female) Nonblack, non-Hispanic Full year, full time $21,990Sex = 2 (Female) Nonblack, non-Hispanic Not full year, full time $49,450Sex = 2 (Female) Black, non-Hispanic Full year, full time $24,015Sex = 2 (Female) Black, non-Hispanic Not full year, full time $24,015Sex = 2 (Female) Hispanic, any race Full year, full time $24,015Sex = 2 (Female) Hispanic, any race Not full year, full time $24,015Note: The topcodes listed above for each cell are greater than the monthly value that is tested, $12,500. This topcodeis the mean of all amounts greater than $12,500. The intention is to reveal as much information as possible by usingthe mean value.
Year of Birth (TBYEAR)Year of Birth (TBYEAR)Year of Birth (TBYEAR)Year of Birth (TBYEAR)
Year of birth is bottomcoded to 1912 to ensure that age does not exceed 88 during the panel. Ifyear of birth (EBYEAR) is earlier than 1912, set year of birth to 1912. Age must be recalculatedbased on the new year of birth.
Age (TAGE)Age (TAGE)Age (TAGE)Age (TAGE)
Age is topcoded to 88 for the entire panel. TAGE is topcoded through birth year (EBYEAR),which is bottomcoded to 1912, and then age is recalculated.
Age at Receipt of Social Security DisabilityAge at Receipt of Social Security DisabilityAge at Receipt of Social Security DisabilityAge at Receipt of Social Security DisabilityBenefits (TAGESS)Benefits (TAGESS)Benefits (TAGESS)Benefits (TAGESS)
EAGESS is age at which person began receiving Social Security Disability benefits.
If EAGESS is greater than TAGE, set TAGESS equal to the topcoded value for age (88).
If EAGESS GT TAGE THEN TAGESS = TAGE
Age Respondent Started Job or BusinessAge Respondent Started Job or BusinessAge Respondent Started Job or BusinessAge Respondent Started Job or Business(TSJDATE, TEJDATE, TSBDATE, TEBDATE)(TSJDATE, TEJDATE, TSBDATE, TEBDATE)(TSJDATE, TEJDATE, TSBDATE, TEBDATE)(TSJDATE, TEJDATE, TSBDATE, TEBDATE)
ESJDATE is date respondent started job.
EEJDATE is date respondent ended job.
ESBDATE is date respondent started business.
EEBDATE is date respondent ended business
A respondent cannot be over 88 years old during the life of the panel. Therefore, year of birth isbottomcoded to 1912. A respondent cannot have �worked� or �owned a business� before age 14years. The earliest a respondent can be shown beginning or ending a job or business is 1926(1912 + 14). If the date in ESJDATE, EEJDATE, ESBDATE, or EEBDATE is earlier than 1926,set the date to 1926 (exclude values equal to �1).
After bottomcoding the year to 1926, check the month and day fields to ensure that the end dateis after the start date for the job or business and then switch the dates as follows:
1 TBDJTINT $2,500 NA Assets: Amount of monthly interest on joint municipal-corporate bonds
2 TBDOINT $3,200 NA Assets: Amount of monthly interest on self-ownedmunicipal-corporate bonds
3 TCDJTINT $450 NA Assets: Amount of monthly interest on joint certificates ofdeposit
4 TCDOINT $825 NA Assets: Amount of monthly interest on solely ownedcertificates of deposit
5 TCKJTINT $55 NA Assets: Amount of monthly interest from joint checkingaccount
6 TCKOINT $110 NA Assets: Amount of monthly interest on solely ownedchecking account
7 TGVJTINT $550 NA Assets: Amount of monthly interest on joint U.S.government securities
8 TGVOINT $1,725 NA Assets: Amount of monthly interest on self-owned U.S.government securities
9 TJACLR $1,375 ($1,000) Assets: Amount of net rent from property owned jointly withspouse
10 TJACLR2 $6,000 ($1,000) Assets: Amount of net income from rental property withothers
11 TJARNT $2,725 NA Assets: Amount of gross rent from property owned jointlywith spouse
12 TMDJTINT $275 NA Assets: Amount of monthly interest on joint money marketaccount
13 TMDOINT $550 NA Assets: Amount of monthly interest on self-owned moneymarket deposit account
14 TMIJNT $1,775 NA Assets: Amount of interest on mortgage owned with spouse15 TMIOWN $1,650 NA Assets: Amount of interest on own mortgage16 TMJADIV $700 NA Assets: Amount of dividend credited to joint margin
account/reinvestment in mutual funds17 TMJNTDIV $1,100 NA Assets: Amount of check for jointly own mutual funds
18 TMOWNADV $1,825 NA Assets: Amount of dividend credited to sole marginaccount/reinvestment in mutual funds
19 TMOWNDIV $1,375 NA Assets: Amount of check for solely owned mutual funds20 TOACLR $2,450 ($1,250) Assets: Amount of net income from own rental property21 TOARNT $4,350 NA Assets: Amount of gross rent from own property22 TRNDUP1 $3,300 NA Assets: Amount of income from royalties23 TRNDUP2 $4,750 ($1,250) Assets: Amount of other income from financial investments24 TSJADIV $825 NA Assets: Amount of dividend credited to margin
account/reinvestment in stocks owned jointly25 TSJNTDIV $775 NA Assets: Amount of dividend check for jointly owned stocks26 TSOWNADV $1,375 NA Assets: Amount of monthly dividend credited margin
account/reinvestment in stock27 TSOWNDIV $1,150 NA Assets: Amount of dividend check for solely owned stocks28 TSVJTINT $150 NA Assets: Amount of monthly interest on joint savings account.
29 TSVOINT $175 NA Assets: Amount of monthly interest on self-only savingsaccount
30 TCSAGY(M) NA NA GenInc: Amount received by agency on your behalf31 T28AMT $1,200 NA GenInc: Amount of child support payments32 T29AMT $3,275 NA GenInc: Amount of alimony payments33 T30AMT $2,500 NA GenInc: Amount of pension from a company or union34 T31AMT $3,925 NA GenInc: Amount from federal civil service or other federal
civilian employee pension35 T32AMT $3,825 NA GenInc: Amount of U.S. military retirement pay36 T34AMT $3,270 NA GenInc: Amount of state government pension37 T35AMT $3,600 NA GenInc: Amount of local government pension38 T36AMT $2,200 NA GenInc: Amount of income from a paid-up life insurance
policy or annuity39 T37AMT $5,000 NA GenInc: Amount from estates or trusts40 T38AMT $2,600 NA GenInc: Amount of payments for retirement, disability, or as
a survivor benefit41 T39AMT $110,000 NA GenInc: Amount of payments for pension/retirement lump
sums42 T42AMT $13,625 NA GenInc: Amount of draw from an IRA/Keough/401k or
Thrift Plan43 T50AMT $75 NA GenInc: Amount of income assistance from a charitable
group44 T51AMT $10,900 NA GenInc: Amount of money from relatives or friends45 T52AMT $325 NA GenInc: Amount of lump-sum payments46 T53AMT $1,960 NA GenInc: Amount of income from roomers or boarders47 T55AMT $3,500 NA GenInc: Amount of incidental or casual earnings48 T56AMT $21,800 NA GenInc: Amount of miscellaneous cash income49 TBM(M)SUM1/2 See Spec No. 1 NA Business: Income received this month50 TPM(M)SUM1/2 See Spec No. 1 NA Job: Earnings from job received in MONTH151 TMLM(M)SUM See Spec No. 1 NA LabFor: Amount of income from this work (moonlighting)
this month52 TBYEAR See Spec No. 2 NA Person: Birth year53 TAGE See Spec No. 3 NA Person: Age as of last birthday54 TAGESS See Spec No. 4 NA GenInc: Age Social Security Disability receipt began55 TSJDATE See Spec No. 5 NA Job: Date started this job56 TEJDATE See Spec No. 5 NA Job: Date ended this job57 TSBDATE See Spec No. 5 NA Business: Date started operating this business58 TEBDATE See Spec No. 5 NA Business: Date ended operating this business59 TPYRATE $30 NA Job: Regular hourly pay rate60 TPRFTB $17,450 ($2,500) Business: Net profit or loss61 TROLLAMT $999,000 NA GenInc: Amount rolled over into a retirement account during
the reference period62 TMTHRNT(M) $650 NA Household: Amount of monthly rent
C-1
C.C.C.C. Computing the SIPP SamplingComputing the SIPP SamplingComputing the SIPP SamplingComputing the SIPP SamplingWeightsWeightsWeightsWeights
This appendix supplements the discussion in Chapter 8 (Using Sampling Weights on SIPP Files)with more detailed information about how the core wave file person-level weight FNLWGT andthe full panel file person-level weights FNLWGT_x and PNLWGT are computed;1 it is intendedas a reference for users who require a comprehensive description of how the sampling weightsare computed.
Sections 1 and 2 of this appendix discuss the algorithms that are used to compute the final corewave file person-level weights FNLWGT, with the first section discussing the Wave 1 weightsand the second section discussing the Wave 2+ weights. The third section discusses thealgorithm that computes the final full panel weights FNLWGT_x (the calendar year weight foryear x) and PNLWGT (the panel weight).
For the 1996 Panel, the final weights used in deriving estimates consist of the product of fourfactors: the base weight, the duplication control factor, the household noninterview adjustmentfactor, and the second-stage adjustment factor. For panels prior to 1996, these four factors mayhave been multiplied by two other factors�the first-stage ratio estimate factor and the newconstruction noninterview adjustment factor�which are discussed later in this chapter.
Base Weight (BW)Base Weight (BW)Base Weight (BW)Base Weight (BW)
The primary component of the sampling weight is the base weight. The base weight for anysampled person or sampled household is the reciprocal of the probability under the sampledesign of that person or household being selected. If there was full response and if there were nocalibration adjustments, then the summation of base weights for a particular subgroup (e.g.,Hispanics in the Southwest) is an unbiased estimator of the total U.S. population within thatsubgroup. In simplified terms, a base weight of 1,000 assigned to a sampled person means thatthe sampled person �represents� 1,000 people in the U.S. population. The base weight for a
1 The remaining weights given in Table 12-2 (HWGT, FWGT, SWGT, P5WGT, H5WGT, and FINALWGT) arederived directly from the basic person-level weight FNLWGT. This derivation is discussed in the �How WeightsAre Constructed� subsection of Chapter 8.
household and the base weight for a person within a household are the same, since every personwithin a sampled household is automatically selected (i.e., selected with a conditional probabilityof 1, given household selection).
Duplication Control Factor (DCF)Duplication Control Factor (DCF)Duplication Control Factor (DCF)Duplication Control Factor (DCF)
The duplication control factor, an integer value between 1 and 4 inclusive, is applied to the baseweights of specified households to account for subsampling done in clusters of housing unitsselected at the last stage of sample selection. These clusters typically contain an unmanageablenumber of housing units. When this occurs, a sampling fraction, 1/N, is determined by selectinga value of N such that the number of sample households in the cluster is reduced to a manageablesize. After this is done, a duplication control factor of N or 4, whichever is smaller, is included asa weighting factor for sampled housing units in the cluster.
The noninterview adjustment factor is intended to adjust for the presence of Type Anoninterview households (households that are not interviewed because the occupants weretemporarily absent, no one was home, the occupants refused participation, or the occupants couldnot be located). Noninterview adjustment factors are computed for each of a set of noninterviewcells. These cells are based on 512 cells generated from all possible cross-classifications of thefollowing household characteristics (256 cells for panels prior to 1996):
! Within-PSU oversampling strata: poverty stratum and nonpoverty stratum (only for 1996and later panels);
! Census region;
! Race of reference person: black or nonblack;
! Tenure: owner or renter;
! Residence status: MSA urban, MSA nonurban, NonMSA Census place, or NonMSA notCensus place; and
! Household size: one, two, three, or four or more persons.
Any cells with fewer than 30 interviewed households or with noninterview adjustment factorsexceeding 2.0 are collapsed with a neighboring cell. To define cells as neighboring, the CensusBureau uses a sort order and scale values based on estimates of the 1979 poverty rate within thecell. The total number of noninterview cells is less than or equal to 512 for the 1996 Panel (256or fewer for the earlier panels). In pre-1996 Panels, no cells were collapsed across the four cellsdefined by the cross-classification of race of reference person and tenure. For the 1996 Panel, no
COMPUTING THE SIPP SAMPLING WEIGHTSCOMPUTING THE SIPP SAMPLING WEIGHTSCOMPUTING THE SIPP SAMPLING WEIGHTSCOMPUTING THE SIPP SAMPLING WEIGHTS
C-3
cells are collapsed over the cross-cells defined by race of reference person, tenure, within-PSUoversampling strata, and Census region.
Within each final noninterview cell c, the formula for the noninterview adjustment factor (NAFc)is
NAF sum of BW *DCF over all sampled households in cell sum of BW * DCF over all interviewed households in cell c
cc
= . (C-1)
This factor is applied to the weight of each interviewed household in the cell; with thesenoninterview-adjusted weights, the interviewed households in each cell can be seen to�represent� themselves and also the Type A noninterviewed households in the cell.2
For the second-stage calibration adjustments, the Census Bureau uses tallies of CurrentPopulation Survey (CPS) weights for independent population controls. The CPS weights arecalibrated to match population controls provided by the population division of the CensusBureau and then a �March type� adjustment is done to equalize the weights of husbands andwives. Because the population division does not produce family-type controls, SIPP family-typecontrols are in fact CPS sample estimates. SIPP controls for age, sex, and race, on the other hand,should not differ appreciably from the original population division controls.
The primary steps in the calibration (or ratio estimation) process are the attaching of second-stage calibration adjustment factors to the pre-second-stage weights (BW*DCF*NAF) withinparticular cells (e.g., male Hispanic 14-year-olds) so that the resulting adjusted weights(BW*DCF*NAF*SSCA) aggregate to independent CPS-derived population estimates within thecell. The summation of the pre-second-stage weights within any cell are unbiased estimates(assuming the nonresponse adjustment successfully adjusts for all effects of nonresponse) of thepopulation totals (e.g., the summation of BW*DCF*NAF over all male Hispanic 14-year-olds inthe panel is an unbiased estimate of the total number of male Hispanic 14-years-olds in the U.S.population).
For SIPP, the monthly CPS estimates of the population totals in these cells are generally superiorto the aggregations of nonresponse-adjusted SIPP weights (superior in the sense of having lowersampling and/or nonsampling error). The adjusted weights (BW*DCF*NAF*SSCA) giveestimates then for these cells that are equal to the independent estimates. This adjustmentgenerally improves the overall precision of all estimates of these cells or any other related surveycharacteristics that are prevalent in these cells.
2 In pre-1996 Panels, group quarters housing units were not included in the nonresponse computations, and receivednonresponse adjustments equal to 1. Group quarters housing units are treated as other households in the 1996 Panel.
The population cells for which adjustments are made to independent estimates are given inFigures C-1, C-2, and C-3 (see pages C-6�C-11). The cells include (as can be seen in the figures)age, race, sex, Spanish origin, family relationship, and household type. As noted earlier, theindependently derived estimates for these cells are based on CPS March supplement-typeestimates, except the estimates for family type. (The CPS estimates are not the usual CPSmonthly estimates. [See U.S. Census Bureau (1998) for more details.] The estimates arespecially computed for this purpose by summing the CPS weights within a given cell for allsample units in the relevant CPS sample [there are some extra steps also, such as the equalizationof husbands� and wives� CPS weights, which are not generally part of the CPS estimationprocess]).
Outline of the Second-Stage Calibration AlgorithmOutline of the Second-Stage Calibration AlgorithmOutline of the Second-Stage Calibration AlgorithmOutline of the Second-Stage Calibration Algorithm
The second-stage calibration algorithm uses as its inputs the pre-second-stage weightsBW*DCF*NAF computed for each sampled person represented on a completed questionnaire ina SIPP panel.3 These weights are run through a series of adjustments, which result in a finalweight (FNLWGT).4 This final weight can be written as FNLWGT = SSCA*BW*DCF*NAF,with SSCA (the second-stage calibration adjustment) equal to the ratio of the pre-second-stageweight and the final weight after the calibration process is completed.
This algorithm can be segmented into five major steps5:
1. Calibration of Hispanic children weights;
2. Calibration of non-Hispanic children weights;
3. Initial calibration steps for all adults;
4. Calibration of Hispanic adults; and
5. Calibration of non-Hispanic adults.
Each of these steps consists of numerous substeps. The next two sections describe certain stepsthat are common to all of the steps in the algorithm (the ratio adjustment step, the raking step, thecell-collapsing step, and the computation of control totals), the third section discusses details of
3 Children do not answer any SIPP questionnaires, but any children who are indicated as dependents by a sampledhousehold receive weights in this process.4 In pre-1996 Panels, households with all adults categorized as military personnel were interviewed and assignedweights (except for households in barracks, which are ineligible for SIPP). These households were not included inthe second-stage calibration process (as they are not eligible for CPS and are not included in the CPS-derivedcontrol totals), and they received final weights equal to their pre-second-stage weights. For the 1996 Panel, thesehouseholds are assigned as ineligible households and are not included in the weighting at all.5 Separate runs of the calibration algorithm are made for each reference month and each rotation group (a total of 16calibration runs for each panel wave).
COMPUTING THE SIPP SAMPLING WEIGHTSCOMPUTING THE SIPP SAMPLING WEIGHTSCOMPUTING THE SIPP SAMPLING WEIGHTSCOMPUTING THE SIPP SAMPLING WEIGHTS
C-5
particular calibration steps, and the last section describes steps that were carried out only for pre-1996 Panels.
Ratio Adjustments, Raking, and Cell CollapsingRatio Adjustments, Raking, and Cell CollapsingRatio Adjustments, Raking, and Cell CollapsingRatio Adjustments, Raking, and Cell Collapsing
The most important steps in the algorithm are the ratio adjustment and raking steps. Each ratioadjustment step takes all of the person weights (as they are at that point in the algorithm) withinparticular second-stage cells and multiplies them by a common ratio adjustment factor. Thecommon factor is chosen for the second-stage cell so that the summation of the adjusted personweights within the cell equals the control total for that second-stage cell. The common ratioadjustment factor for each cell is equal to the control total divided by the summation of thecurrent person weights for all sample persons in the cell.
The raking step is similar to the ratio adjustment step except that there are two sets of second-stage cells, with separate control totals (one set of second-stage cells is called the �rowdimension,� and the other set is called the �column dimension�). At the end of the raking process(also called iterative proportional fitting), each person weight (as it is at that point in thealgorithm) has been adjusted so that all person weights aggregate to the appropriate control totalsfor both the row cells and the column cells. The adjusted person weights have the property ofaggregating within the second-stage cells to each control total while remaining as �close aspossible� (in terms of a particular algebraic distance function) to the person weight values at thebeginning of the raking step. Thus, the new person weights are consistent with both sets ofindependent control totals and have been altered as little as possible from the person weightsbefore the step.
Most of the ratio adjustment and raking steps are preceded by a cell-collapsing step. This step isdesigned to prevent extreme alterations in the person weights (which will increase variability ofthe estimators) in any of the ratio adjustment and raking steps. Each second-stage cell is checkedin its sample size: if the sample size is less than 35, then the cell is collapsed with a neighboringcell. The second-stage cells are also checked by computing the ratio adjustment for that cell. Ifthat adjustment is less than 0.67 or greater than 2.0, then the cell is collapsed with a neighboringcell.
Ratio adjustments are computed for each set of second-stage cells before the raking process isperformed. Ratio adjustments are computed for the row cells and the column cells as if only aratio adjustment were being done for the row cells alone or the column cells alone, rather than afull raking step. If the computed ratio adjustments for any of the row cells are less than 0.67 orgreater than 2.0, or the sample size for any row cell is less than 35, then the row cell is collapsedwith a neighboring row cell. The same process is carried out for the column cells. All collapsingof this kind is completed before the raking step is executed.
When a second-stage cell is designated as requiring collapsing during the cell-collapsing step,the neighboring cell is chosen through a predetermined mechanism. Hispanic second-stage cells(see Figure C-1) are collapsed by sex (e.g., Hispanic males 15�24 are collapsed with Hispanic
females 15�24). The same is true for the household status second-stage cells for non-Hispanicchildren (the column dimension for non-Hispanic children; see Figure C-2). For the householdstatus second-stage cells for adults (the column dimension for adults; see Figure C-3, pp. C-8through C-11), the following pairs are collapsed when collapsing is necessary (the numbers inparentheses are the column numbers in the Figure C-3 tables):6
! Spouse in primary family (1); spouse in subfamily (3).
! Householder, no spouse present, in household with family (2); householder in householdwithout a family (5).
! Not a spouse in household with family (4); not a householder in household without family (6).
For the age status second stage for adults (the row dimension for adults: see Figure C-3),neighboring cells are found on the basis of the scale value (which is given for the 1996 Panel inFigure C-3). The cell with the scale value closest to that of the cell that requires collapsingbecomes the neighboring cell used in collapsing.
Figure C-1. Second-Stage Cells for Hispanics
Second-stage cells for Hispanic children
Male Female
Second-stage cells for Hispanic adults7
Male Female15�24 25�44 45+ 15�24 25�44 45+
Second-stage cells for unmarried Hispanic adults
Male Female
6 Collapsing is never done across black and nonblack status, or across sex, but only within the four primary groups:black males and females, and nonblack males and females (see Figure C-3).7 Hispanic adults in the military are not defined as Hispanics in the computation of control totals or in the calculationof second-stage adjustments.
COMPUTING THE SIPP SAMPLING WEIGHTSCOMPUTING THE SIPP SAMPLING WEIGHTSCOMPUTING THE SIPP SAMPLING WEIGHTSCOMPUTING THE SIPP SAMPLING WEIGHTS
C-7
Figure C-2. Second-Stage Cells for Non-Hispanic Children
Second-Stage Cells for Black Children (14 years of age and younger)
MALESAge (years)
Childrenin FamilyHouseholds
ChildrenNot inFamilyHouseholds SCALE
FEMALESAge (years)
Childrenin FamilyHouseholds
ChildrenNot inFamilyHouseholds SCALE
Under 2 15 Under 2 152 to 3 17 2 to 3 174 to 5 25 4 to 5 256 to 7 27 6 to 7 278 to 9 45 8 to 9 4510 to 11 47 10 to 11 4712 to 13 55 12 to 13 5514 57 14 57
Second-Stage Cells for Nonblack Children (14 years of age and under)
MALESAge (years)
Childrenin FamilyHouseholds
ChildrenNot inFamilyHouseholds SCALE
FEMALESAge (years)
Childrenin FamilyHouseholds
ChildrenNot inFamilyHouseholds SCALE
Under 1 15 Under 1 151 17 1 172 25 2 253 27 3 274 45 4 455 47 5 476 55 6 557 57 7 578 75 8 759 77 9 7710 to 11 85 10 to 11 8512 to 13 105 12 to 13 10514 107 14 107
The cell-collapsing procedure in some cases requires more than one iteration if cells aftercollapsing to the nearest neighbor are still too small or show extreme ratio adjustments (thisgenerally occurs only in row-dimension collapsing for adults). New scale values are computedfor the collapsed cells and are used to designate neighboring cells for any further collapsing thatis necessary.
Computation of Control TotalsComputation of Control TotalsComputation of Control TotalsComputation of Control Totals
The control totals are equal to the CPS March-type estimates within each second-stage cell forsome of the earlier ratio adjustment and raking steps in the algorithm.8 For the remaining ratioadjustment and raking steps, the control totals are derived by taking the CPS March-typeestimate within the second-stage cell and subtracting from this the adjusted weights of any
8 For the 1984 and 1985 Panels, the control totals excluded people illegally residing in the United States. For the1986 Panel and all panels following, the people are included in the control totals.
COMPUTING THE SIPP SAMPLING WEIGHTSCOMPUTING THE SIPP SAMPLING WEIGHTSCOMPUTING THE SIPP SAMPLING WEIGHTSCOMPUTING THE SIPP SAMPLING WEIGHTS
C-9
Figure C-3. Second-Stage Cells for Non-Hispanic Adults (continued)
Second-Stage Cells for Black Females (15+ years of age)
Persons in Households That Contain a Primary Familyor Subfamily
Persons Not in HouseholdsContaining a Primary Family orSubfamily
Wife of Female House- Other Household Members Not a HouseholderAge(years)
subgroups whose weights have been completed. For example, control totals are derived for non-Hispanic children by taking the CPS March-type estimates for all children in each row cell andcolumn cell (see Figure C-2) and subtracting the adjusted weights of all SIPP panel-rotation-group Hispanic children within that cell.
Details of the Calibration StepsDetails of the Calibration StepsDetails of the Calibration StepsDetails of the Calibration Steps
The first step (for Hispanic children) is a direct ratio adjustment to CPS control totals (using onlytwo cells defined by sex). The second step (for non-Hispanic children) is a raking adjustment toderived controls; for row cells and column cells, the second-stage cells given in Figure C-2 areused. The derived control totals for each second-stage cell are equal to CPS control totals for allchildren in the cell minus the adjusted weights of all sampled Hispanic children in the cell.
Following the steps for children (which complete all second-stage adjustments for the children�sweights) are the initial calibration steps for adults. Those steps are as follows:
1. A raking adjustment to CPS control totals that uses the Figure C-3 second-stage cells (theinput weights are the pre-second-stage weights of all sampled adults);
2. A direct ratio adjustment to CPS control totals for sampled Hispanic adults; the input weightsare the adjusted weights from step 1, and the second-stage cells are the cells given in FigureC-3 (for adults);
3. An equalization of all husbands� weights to their wives� weights (so that spouses in onefamily have equal weights);
4. A second raking adjustment identical to step 1 except that the input weights are the adjustedweights after steps 1 through 3 are completed;
5. A second Hispanic adult ratio adjustment identical to step 2 except that the input weights arethe Hispanic adult adjusted weights from step 4.
COMPUTING THE SIPP SAMPLING WEIGHTSCOMPUTING THE SIPP SAMPLING WEIGHTSCOMPUTING THE SIPP SAMPLING WEIGHTSCOMPUTING THE SIPP SAMPLING WEIGHTS
C-11
Figure C-3. Second-Stage Cells for Non-Hispanic Adults (continued)
Second-Stage Cells for Nonblack Females (15+ years of age)
Persons in Households That Contain a Primary Familyor Subfamily
Persons Not in HouseholdsContaining a Primary Family orSubfamily
Wife of Female House- Other Household Members Not a HouseholderAge(years)
The next two steps complete the weights for Hispanic adults. The first step is an equalization ofall husbands� weights in married couples, including at least one Hispanic, to their wives�weights. The exception to this is when the wife is not Hispanic, in which case the wife�s weightis set equal to the husband�s weight. At this point, all married couples including at least oneHispanic have their final weights. The second step is a ratio adjustment for sampled unmarriedHispanics (only males and females are used as second-stage cells) to derived control totals,which are CPS control totals for all Hispanic adults minus the adjusted weights of the sampledmarried Hispanics.
The last steps complete the calibration process for sampled non-Hispanic adult weights. Thosesteps are as follows:
6. An equalization of wives� weights to their husbands� weights.
7. A raking adjustment to derived control totals that uses the Figure C-3 second-stage cells (theinput weights are the current adjusted weights of all non-Hispanic adults). The control totalsare the CPS control totals for all adults for the second-stage cells minus the adjusted weightsof Hispanic adults within those cells.
8. An equalization of husbands� weights to their wives� weights. This step finalizes the weightsfor all non-Hispanic females and all non-Hispanic husbands.
9. A raking adjustment to derived control totals; the Figure C-3 second-stage cells for adultmales (with the two husband columns deleted) are used, and the current adjusted weights ofall non-Hispanic nonhusband males are used. The derived control totals are the CPS controltotals minus the adjusted weights of all groups who have had their weights completed. Thisstep produces the final weights for all non-Hispanic nonhusband male adults (the last groupwithout completed weights).
Weighting Factors Used in Panels Prior to 1996Weighting Factors Used in Panels Prior to 1996Weighting Factors Used in Panels Prior to 1996Weighting Factors Used in Panels Prior to 1996
In all panels prior to the 1996 Panel, a first-stage ratio estimate factor (FSF) was applied to thebase weight of each person in non-self-representing PSUs (i.e., PSUs not sampled withcertainty). This first-stage factor was a ratio adjustment step that used as cells Census region,residence status, and race; it was designed to reduce the variance resulting from sampling ofPSUs. Although this factor is no longer computed in the 1996 Panel, the cells are now used in thecomputation of noninterview adjustment factors.
Also, beginning with the 1985 Panel, a new construction noninterview adjustment factor (NCF)was applied to the base weight of new households in new construction housing-unit clusters.This factor was used to account for newly constructed housing units that were selected for thesample but were unavailable for interviewing. It was set equal to 1 in the 1986�1993 Panels (itwas not used in the 1984 Panel), and eventually it was discontinued.
Thus, in the 1984 Panel, FNLWGT was equal to BW*DCF*HNF*FSF*SSCA (excludes NCF).FNLWGT was equal to BW*DCF*NCF*HNF*FSF*SSCA in the 1985�1993 Panels.
The later wave cross-sectional weight is computed separately for each reference month of eachwave. This Wave 2+ FNLWGT has the following factors for people in households whoseresidents have not changed from Wave 1: an initial weight (IW), a later wave noninterview
COMPUTING THE SIPP SAMPLING WEIGHTSCOMPUTING THE SIPP SAMPLING WEIGHTSCOMPUTING THE SIPP SAMPLING WEIGHTSCOMPUTING THE SIPP SAMPLING WEIGHTS
C-13
adjustment (LWNIA), and a second-stage calibration adjustment (SSCA). The initial weight isgenerally equal to the pre-second-stage weight for the Wave 1 household weight (with someexceptions). For households that have had people move into or out of the household after Wave1, there is an adjustment to the initial weight called the mover�s weight (MW). For these people,the cross-sectional weight has as factors the mover�s weight, the later wave noninterviewadjustment, and the second-stage calibration adjustment. In summary, people in households thatdo not need mover�s adjustments receive the cross-sectional weight FNLWGT =IW*LWNIA*SSCA, and persons in households that do require a mover�s adjustment receive theWave 2+ final weight FNLWGT = MW*LWNIA*SSCA.
The initial weight is essentially the pre-second-stage Wave 1 weight, that is, IW =BW*DCF*NAF.9 The second-stage calibration adjustment for the Wave 1 reference months isnot included as a factor: the second-stage calibration adjustment is redone using control totalscurrent for the later wave reference months. The initial weight allows the original sample personto represent unsampled persons in the population and persons in households who were notsuccessfully interviewed in Wave 1. The initial weight does not generally change from wave towave after Wave 1, unless special circumstances arise that cause an alteration in the panelsample (such as a cut in the sample for budgetary or other reasons).
People in any households that an original sample person enters during later waves, or any peoplewho become part of a Wave 1 sample household during later waves, also become part of thesample for those waves. If the original sample person moves away from the householdcontaining those people, the additional people immediately drop from the sample (their in-sample status in any given wave is entirely dependent on the presence of original sample personsin the household). Any of the additional people who were part of the SIPP population in Wave 1(and therefore could have been sampled) and who become members of households with originalsample persons are called associated sample persons. If any of these additional persons were notpart of the SIPP population in Wave 1 (because they were out of the country, institutionalized,etc.), then they are called additional sample persons.
9 The 1985 Panel had an initial weight that was computed differently. The initial weight for this panel included anew-construction noninterview adjustment factor and a first-stage ratio estimate factor. The Wave 1 noninterviewadjustment factor was also recomputed in the 1985 Panel to account for sampled households mistakenly left off thesample roster during Wave 1, and sampled households that were noncooperative in Wave 1 but were convertedduring Wave 2. There was also an added �sample cut� factor, adjusting for sampled households that were deselectedbecause of a reduction in the 1985 Panel sample. Pre-1996 Panels following 1985 had only one difference from the1996 Panel initial weight described in the text: the presence of the first-stage ratio estimate factor.
Any household that consists of people who were in the SIPP universe who lived in separatehouseholds during the Wave 1 reference period (with at least one of the households sampled inWave 1) is called an enhanced household. In most cases, an enhanced household consists oforiginal sample persons from a Wave 1 sample household and associated sample persons from ahousehold (or households) not sampled in Wave 1. In a few rare cases, an enhanced householdwill contain original sample persons from more than one Wave 1 sample household. Thosehouseholds are rare because the probability of selection of any given household in SIPP is quitesmall, making the joint probability of a later wave merged household having two or more of itsWave 1 predecessor households selected in Wave 1 quite small (but the situation does occur inthe SIPP panels).
Enhanced households require an adjustment of the Wave 1 base weight for each person in thehousehold. These people in effect had multiple chances of being in the selected enhancedhousehold: they could have been selected as original sample persons in the household they werein during Wave 1 (which then became an enhanced household), or they could become anassociated sample person if their Wave 1 household was not selected but merged later with asampled Wave 1 household. Their true probability of being included in the enhanced householdis higher than their nominal Wave 1 probability of selection, and their assigned base weightshould be the reciprocal of this true sample inclusion probability.
This true inclusion probability is not computed directly, for it requires the computation of jointprobabilities of selection of multiple households, some of which were not in the original Wave 1household sample. Instead, a �mover�s weight� is assigned to each original and associatedsample person in the enhanced household, which has as its expectation the inverse of the truesample inclusion probability. In other words, the movers� weights are unbiased weights, takinginto account the complex realized sample design for enhanced households.
In the case in which an enhanced household is formed from only one Wave 1 sample household(with associated persons added to it), the mover�s weight for each person in the household(original, associated, or additional) is computed as follows for reference month t, enhancedhousehold i:
W W SS Sti
i ti
ti tai=
−1 1 , (C-2)
where W1i is the initial weight that is common to all original sample persons in the ith enhancedhousehold, S1ti is the number of original sample persons in the ith enhanced household in montht, Sti is the size of the ith enhanced household in month t (all persons), and Stai is the number ofadditional sample persons in the ith enhanced household in month t. The numerator of thisexpression is the sum of the initial weights over all original sample persons in the householdduring month t, and the denominator of this expression is the number of original and associatedsample persons in the ith enhanced household in month t. For a discussion of why these areunbiased weights, see, for example, Kalton and Brick (1994).
COMPUTING THE SIPP SAMPLING WEIGHTSCOMPUTING THE SIPP SAMPLING WEIGHTSCOMPUTING THE SIPP SAMPLING WEIGHTSCOMPUTING THE SIPP SAMPLING WEIGHTS
C-15
When two Wave 1 sample households merge, the mover�s weight for each sample person(original, associated, or additional) in the household is computed as follows:
W W S W SS Sti
i ti i ti
ti tai= + ′ ′
−1 1 1 1 . (C-3)
The two terms in the numerator are for the first and second Wave 1 sample households. Themovers� weights for more than two merged Wave 1 sample households are computedanalogously.
Wave 2+ Later Wave Noninterview AdjustmentsWave 2+ Later Wave Noninterview AdjustmentsWave 2+ Later Wave Noninterview AdjustmentsWave 2+ Later Wave Noninterview Adjustments
The initial weights have an adjustment for noncooperation in Wave 1; that is, the samplehouseholds with nonzero initial weights represent households for which an interview was notcompleted in Wave 1. There are, however, further losses of sample households in later waves forseveral reasons:
! The household refuses to cooperate in some or all of the later waves.
! The people in the household have moved and cannot be found.
! The household has moved, and has been found, but is too far away for a personal interviewand cannot be reached by telephone. 10
The weights of households for which later wave interviews are completed are adjusted to�represent� sample households (who cooperated in Wave 1) whose interviews are not completedfor any of the above reasons. Those adjustments are computed by assigning each samplehousehold with a nonzero initial weight to one of 109 later wave noninterview cells.11 Thenoninterview cells are based on the following household characteristics:
1. Reference person is a non-Hispanic white person, or other (two categories).
2. Reference person is a female householder without a spouse and with her own children, ahouseholder 65 years of age or older, or other (three categories).
3. Household income includes welfare payments (AFDC, WIC, Food Stamps, Medicaid, orother welfare), or not (two categories).
4. Household size is 1, 2, 3, or 4 or more persons (four categories).
5. Household has some bond-type financial assets, or not (two categories).
10 The SIPP sample is designed so that most of the field work takes place within the SIPP PSUs, to reduce travelingcosts. If a household moves too far away from the field areas, a telephone interview is attempted.11 In pre-1996 Panels, 53 noninterview cells were used, based on the first 7 of the 10 listed household characteristics.
6. Reference person�s education level is less than 8 years, 8 to 11 years, 12 to 15 years, or 16 ormore years (four categories).
7. Household owns housing unit, is renter, or is living in a public housing project or receiving arent subsidy from the government (three categories).
8. Census division (nine categories).
9. Number of imputations in household Wave 1 questionnaire is none, 1, or more than 1 (threecategories).
10. Household income as a percentage of the household poverty threshold (with both averagedover 4 reference months): less than or equal to 175 percent, 176 through 450 percent, andmore than 450 percent (three categories).
These categories have been found in empirical research to be consistently heterogeneous in laterwave noninterview rates (i.e., the categories have divergent noninterview rates). The later wavenoninterview adjustment for each noninterview cell is equal to the sum of the initial or mover�sweights of all households that have had the later wave interview completed, divided by the sumof the initial or mover�s weights of all Wave 1 sample households.12 (The mover�s weight isused whenever a mover�s weight is computed for the household.) These adjustments are madeseparately for each reference month of each later wave of the panel.
Before the final noninterview adjustment is computed for each wave, each noninterview cell ischecked. Any noninterview cell with fewer than 30 interviewed households, or with anoninterview adjustment greater than 2, is collapsed with a neighboring cell. Cells are defined asneighboring on the basis of a set of scale values assigned to each noninterview cell. Thisprocedure prevents extreme noninterview adjustments from being made (which will increasesampling variability). The final noninterview adjustment (LWNIA) for the cell, or collapsed cell,is assigned to each household within the cell.
Table C-1 presents the major groupings of noninterview cells (the noninterview cells withinthese major groupings have similar scale values and would be collapsed together within thesegroupings before any collapsing was done across groupings).
A second-stage calibration adjustment is carried out for each reference month in each later wave,for each rotation group of the panel separately. This adjustment uses the same algorithm asdescribed for Wave 1 weights, with new CPS or CPS-derived control totals computed for each
12 In pre-1996 Panels, general quarters households were not included in these calculations and receive noninterviewadjustments equal to 1. In the 1996 Panel, these households are treated in the same way as family households innoninterview calculations, but households with only military adults were included.
COMPUTING THE SIPP SAMPLING WEIGHTSCOMPUTING THE SIPP SAMPLING WEIGHTSCOMPUTING THE SIPP SAMPLING WEIGHTSCOMPUTING THE SIPP SAMPLING WEIGHTS
C-17
Table C-1. Major Groupings of Later WaveNoninterview Cells
Hispanic or nonwhiteMinimal assets 15Assets include bonds 9
White Non-HispanicSingle female householder 1Householder 65 and older 14Other householder
No welfare incomeOne person in household 20Two people in household 14Three people in household 7Four or more in household 19
Has welfare income 10Total 109
new reference month. The pre-second-stage weights in this case are IW*LWNIA, orMW*LWNIA if a mover�s weight was computed for the household. The second-stage calibrationadjustments reduce sampling variability by calibrating the final weights to agree withindependent control totals. With the later wave cross-sectional weights, the second-stagecalibration adjustments also have the effect of reducing biases from population undercoverage(arising from eligible people entering the U.S. population after the Wave 1 reference months).
Calendar Year and Panel WeightsCalendar Year and Panel WeightsCalendar Year and Panel WeightsCalendar Year and Panel Weights
The algorithm for generating the calendar year and panel weights is very similar to that used forcomputing Wave 2+ weights, with some differences. The most important differences are thefollowing:
! A control date is associated with each calendar year and panel weight (rather than the weightbeing associated with a month, as with the Wave 1 and Wave 2+ weights).
! For a sample person to have a nonzero weight, data must be present for the sequence ofmonths defined for the weight (12 months for the calendar year weights and all months of thepanel for the panel weights). Months for which the sample person is ineligible are excludedfrom this check.
Calendar Year and Panel Initial WeightsCalendar Year and Panel Initial WeightsCalendar Year and Panel Initial WeightsCalendar Year and Panel Initial Weights
The initial weight computed for each sample person for all calendar year and panel weights isIW = BW*DCF*NAF, that is, the same quantity that is used as the initial weight for all Wave 2+weights. This initial weight allows each original sample person who has interviews for themonths for which they are eligible in the calendar year (or panel) to represent unsampled peoplein the population and people in households that were not successfully interviewed in Wave 1.
Calendar Year and Panel Noninterview AdjustmentsCalendar Year and Panel Noninterview AdjustmentsCalendar Year and Panel Noninterview AdjustmentsCalendar Year and Panel Noninterview Adjustments
The noninterview adjustments for each calendar year and panel weight are computed by firstassigning each sampled person with a nonzero initial weight to one of 149 noninterview cells.13
These noninterview cells are based on the following person-level characteristics:
1. Person is a non-Hispanic white person, or other (two categories).
2. Person was self-employed, or not (two categories).
3. Family income was a percentage of the family poverty threshold (with both averaged over 4reference months): less than or equal to 175 percent, 176 through 450 percent, and morethan 450 percent (three categories).14
4. Person in household whose income includes welfare payments (SSI, AFDC, WIC, FoodStamps, Medicaid, or other welfare), person receiving unemployment compensation but notin household with welfare payments, or neither (three categories).
5. Person in household with some bond-type financial assets, or not (two categories).
6. Person�s education level is less than 12 years, 12 to 15 years inclusive, or 16 or more years(three categories).
7. Person was in labor force at least 1 month of wave, or not (two categories).
8. Census division of household (nine categories).
9. Number of imputations in household Wave 1 questionnaire is none, 1, or more than 1 (threecategories).
10. Within PSU, stratum code of household is poverty stratum or nonpoverty stratum (twocategories).
13 In pre-1996 Panels, 126 noninterview cells were used, based on the first 7 of the 10 listed person characteristics.14 In pre-1996 Panels, household income (averaged over 4 reference months) was used instead: less than $1,200 amonth, between $1,200 and $4,000 a month, and greater than or equal to $4,000 a month.
COMPUTING THE SIPP SAMPLING WEIGHTSCOMPUTING THE SIPP SAMPLING WEIGHTSCOMPUTING THE SIPP SAMPLING WEIGHTSCOMPUTING THE SIPP SAMPLING WEIGHTS
C-19
These categories have been found in empirical research to be consistently heterogeneous in laterwave noninterview rates. The noninterview adjustment for the noninterview cell (for theparticular calendar year [panel] weight) is equal to the sum of the initial weights of all sampledpersons whose households were interviewed in Wave 1,15 divided by the sum of the initialweights of all sampled persons who have interviews for every month of the calendar year (panel)in which they are eligible.16
As with other noninterview adjustments discussed in this appendix, each noninterview cell ischecked for small sample sizes and extreme noninterview adjustments. Any noninterview cellwith fewer than 30 sampled persons with complete interview strings, or with a calendar year(panel) noninterview adjustment greater than 2, is collapsed with a neighboring cell for thatcalendar year and panel weight. If necessary, this process can be iterative: a cell may becollapsed into another cell, and then the combined cell may be collapsed further with other cells.A set of scale values determines how cells are collapsed when collapsing is necessary. Table C-2presents the major groupings of noninterview cells (i.e., the noninterview cells with similar scalevalues). The noninterview cells within these groupings would be collapsed together amongthemselves before any collapsing would be done outside of these groupings.
Table C-2. Major Groupings of Calendar Year (Panel)Noninterview Cells
Person CharacteristicsNumber ofNonresponse Cells
Hispanic or nonwhite 50White Non-Hispanic
Less than 12 years of education 2512 to 15 years of education
In labor force 32Not in labor force 18
16 or more years of education 24Total 149
15 People who entered the sample during or after the calendar year (panel) period (by entering a sampled household)are excluded from these calculations (and receive calendar year [panel] weights of zero). Children who movewithout their parents (into nonsampled households) during the period are also excluded from these computations andreceive calendar year (panel) weights of zero.16 In pre-1996 Panels, sample persons living in group quarters are not included in these noninterview adjustments,and those people are given noninterview adjustments equal to 1 (when their calendar year and panel weights arenonzero). In the 1996 Panel, sample persons living in group quarters are treated in the same way as other samplepersons.
Calendar Year and Panel Second-Stage AdjustmentsCalendar Year and Panel Second-Stage AdjustmentsCalendar Year and Panel Second-Stage AdjustmentsCalendar Year and Panel Second-Stage Adjustments
The calendar year and panel weights that have been computed up to this point (called the pre-second-stage weights) for each sampled person (with a complete set of interviews for theireligible months) are equal to BW*DCF*NAF*LWNIA. The formula for the final calendar yearweights (FNLWGT) is BW*DCF*NAF*LWNIA*SSCA, where SSCA is the second-stagecalibration adjustment. The final panel weight follows the same formula: PNLWGT =BW*DCF*NAF*LWNIA*SSCA, though LWNIA and SSCA are computed differently here. Thefinal weight is computed in both cases from the pre-second-stage weightsBW*DCF*NAF*LWNIA in accordance with the algorithm described below. As with the Wave1 and Wave 2+ weights, the algorithm for second-stage adjustment for calendar year and panelweights can be segmented into the following five major steps:
1. Calibration of Hispanic children weights;
2. Calibration of non-Hispanic children weights;
3. Initial calibration steps for all adults;
4. Calibration of Hispanic adults; and
5. Calibration of non-Hispanic adults.
However, the actual steps within these five major steps are different in their details for calendaryear (panel) weights. The primary difference between the calendar year (panel) weights second-stage calibration algorithm and the Wave 2+ weights second-stage calibration algorithm is that amarried couple weighting equalization is not done for the calendar year (panel) weights, andmarried and unmarried persons are not separated out for separate calibration steps in the calendaryear (panel) weights algorithm.
The independent estimates for the control month are the same CPS March supplement-typeestimates that were used for the Wave 2+ weights, except they are computed for differentsecond-stage cells when used for calendar year (panel) weights. The second-stage cells forcalendar year (panel) weights are given in Figures C-4, C-5, and C-6. The second-stagecalibration algorithm is run separately for each rotation group, with the control totals for eachrotation group equal to one-quarter of the CPS control totals.
COMPUTING THE SIPP SAMPLING WEIGHTSCOMPUTING THE SIPP SAMPLING WEIGHTSCOMPUTING THE SIPP SAMPLING WEIGHTSCOMPUTING THE SIPP SAMPLING WEIGHTS
C-21
Figure C-4. Calendar Year and Panel Weight Second-Stage Cellsfor Hispanics
Second-Stage Cells for Hispanics (14 years and younger)
Male Female
Second-Stage Cells for Hispanics (15+ years of age)17
Male Female15�24 25�44 45+ 15�24 25�44 45+
Figure C-5. Calendar Year and Panel Weight Second-Stage Cellsfor Non-Hispanic Children
Cells for Children (14 years and younger)
AgeNonblackMales
NonblackFemales
BlackMales
BlackFemales SCALE
Under 2 152 to 3 174 to 5 256 to 7 278 to 9 4510 to 11 4712 to 13 5514 57
17 Hispanic adults in the military are not defined as Hispanics in the computation of control totals or in thecalculation of second-stage adjustments.
Details of the Calendar Year and Panel Second-StageDetails of the Calendar Year and Panel Second-StageDetails of the Calendar Year and Panel Second-StageDetails of the Calendar Year and Panel Second-StageCalibration StepsCalibration StepsCalibration StepsCalibration Steps
The individual steps in the calendar year (panel) second-stage calibration algorithm are generallythe same as the corresponding steps in the Wave 1 and Wave 2+ second-stage calibration
COMPUTING THE SIPP SAMPLING WEIGHTSCOMPUTING THE SIPP SAMPLING WEIGHTSCOMPUTING THE SIPP SAMPLING WEIGHTSCOMPUTING THE SIPP SAMPLING WEIGHTS
C-23
Figure C-6. Calendar Year and Panel Weight Second-Stage Cells forNon-Hispanic Adults (continued)
1996 Panel Second-Stage Cells for Black Females (15+ years of age)
algorithm.18 The differences in the two calibration algorithms are primarily the second-stagecells, with some other minor differences, as described in this section.
The first step (for Hispanic children) is a ratio adjustment to CPS control totals that uses only thetwo cells defined by sex (this step is identical to the Wave 1 and Wave 2+ algorithm step forHispanic children). The second step (for non-Hispanic children) is a ratio adjustment step toderived controls that uses as cells the second-stage cells given in Figure C-5.
18 The cell-collapsing procedures described for the Wave 1 and Wave 2+ weights are also used as stated in thatsection for the calendar year and panel weights, except for the column dimension collapsing for non-Hispanic adults.For calendar year and panel weights, and for any of the four race/sex groups given in Figure C-6, columns 1 and 2(see Figure C-6 for the numbering of the columns) are collapsed if either does not meet the criterion (which is thesame as described in the earlier section on ratio adjustment, raking, and cell collapsing), column 4 is collapsed withcolumn 2 if it does not meet the criterion, column 7 is collapsed with column 9 if either does not meet the criterion,and column 8 is collapsed with column 10. Collapsing of columns 3, 5, and 6 and further collapsing of the othercolumns should never be necessary in practice.
Following these steps for children (which complete all second-stage adjustments for thechildren�s weights) are the initial calibration steps for adults. Those steps are as follows:
1. A raking adjustment to CPS control totals that uses the Figure C-6 second-stage cells; theinput weights are the pre-second-stage weights of all sampled adults.
2. A direct ratio adjustment to CPS control totals for sampled Hispanic adults; the input weightsare the adjusted weights from step 1, and the second-stage cells are the cells given in FigureC-4 (for adults).
3. A second raking adjustment identical to step 1 except that the input weights are the adjustedweights after steps 1 and 2 are completed.
COMPUTING THE SIPP SAMPLING WEIGHTSCOMPUTING THE SIPP SAMPLING WEIGHTSCOMPUTING THE SIPP SAMPLING WEIGHTSCOMPUTING THE SIPP SAMPLING WEIGHTS
C-25
Figure C-6. Calendar Year and Panel Weight Second-Stage Cells forNon-Hispanic Adults (continued)
1996 Panel Second-Stage Cells for Black Males (15+ years of age)
4. A second Hispanic adult ratio adjustment identical to step 2 except that the input weights arethe Hispanic adult adjusted weights from step 3.
At this point, the weights are completed for Hispanic adults. The final step is a raking adjustmentto derived control totals that uses the Figure C-6 second-stage cells. The derived control totalsare the CPS control totals for all adults for the second-stage cells minus the adjusted weights ofHispanic adults within those cells. The input weights are the current adjusted weights for non-Hispanic adults.
D-1
D.D.D.D. AcronymsAcronymsAcronymsAcronyms
ADL = Activities of Daily Living
AFDC = Aid to Families with Dependent Children
ASA = American Statistical Association
BLS = Bureau of Labor Statistics
BW = base weight
CAI = computer-assisted interviewing
CAPI = computer-assisted personal interviewing
CMSA = Consolidated Metropolitan Statistical Area
CPS = Current Population Survey
DADS = Data Access and Dissemination System
DCF = duplication control factor
DES = Data Extraction System
EDs = enumeration districts
FERRET = Federal Electronic Research Review and Extraction Tool
FHNSP = female with no spouse present living with relatives
GA = General Assistance
GVFs = generalized variance functions
ICPSR = Inter-university Consortium for Political and Social Research
OASDI = Old-Age, Survivors, and Disability Insurance
OMB = Office of Management and Budget
PRWORA = Personal Responsibility and Work Opportunity Reconciliation Act
PSID = Panel Study of Income Dynamics
PSU = primary sampling units
SIPP = Survey of Income and Program Participation
SPD = Survey of Program Dynamics
SRS = simple random sample
SSCA = second-stage calibration adjustment
SSI = Supplemental Security Income
TANF = Temporary Assistance for Needy Families
WIC = Women, Infants, and Children nutrition program
E-1
E.E.E.E. GlossaryGlossaryGlossaryGlossary
AAAA
address unitaddress unitaddress unitaddress unit
This collection unit is a person or group of persons living at the same address at the time of theinterview. The address unit may consist of one person living by himself or herself, a group ofunrelated individuals, or one or more families.
allocation flagallocation flagallocation flagallocation flag
See imputation flag.
BBBB
CCCC
CAI (computer-assisted interviewing)CAI (computer-assisted interviewing)CAI (computer-assisted interviewing)CAI (computer-assisted interviewing)
A method of interviewing in which a computer is used as the data collection instrument.
CAPI (computer-assisted personal interviewing)CAPI (computer-assisted personal interviewing)CAPI (computer-assisted personal interviewing)CAPI (computer-assisted personal interviewing)
A method of interviewing in which field representatives use a laptop computer to collect dataduring in-person interviews. In SIPP, the field representatives also periodically use the laptopcomputers during telephone interviews conducted from their homes.
The matrix of starting values that constitutes the first step in the hot-deck imputation procedure.The matrix values can be determined a priori from information external to the current file beingprocessed or can be determined from reported information from the current file.
In the paper instrument for SIPP, a mechanism for carrying demographic and case managementinformation forward from one wave to the next for each sample member.
core contentcore contentcore contentcore content
Questions asked at every SIPP interview. They cover demographic characteristics, workexperience, earnings, program participation, transfer income, and asset income.
Pertaining to data collected for a single time period from a representative sample. In SIPP hot-deck imputation procedures, cross-sectional refers to current-wave data.
Current Population Survey (CPS)Current Population Survey (CPS)Current Population Survey (CPS)Current Population Survey (CPS)
A labor force survey sponsored jointly by the Census Bureau and the Bureau of Labor Statisticsthat is used to compute the government�s official monthly unemployment statistics along withother estimates of labor force characteristics.
DDDD
data dictionarydata dictionarydata dictionarydata dictionary
Contains information about the file structure and the names, locations, and contents of allvariables in a microdata file.
data editingdata editingdata editingdata editing
The use of related information to replace missing or inconsistent data in the survey.
This type of noninterview occurs when someone was a member of a SIPP interviewed householdduring the 4-month reference period but was no longer a household member on the date of theinterview.
GLOSSARYGLOSSARYGLOSSARYGLOSSARY
E-3
EEEE
FFFF
familyfamilyfamilyfamily
Two or more people who are living together and are related by blood, marriage, or adoption.
FERRETFERRETFERRETFERRET
An on-line data access tool available on the SIPP Web site. SIPP data are available on FERRETbeginning with the 1992 longitudinal panel.
following rulesfollowing rulesfollowing rulesfollowing rules
SIPP rules that guide which original sample members continue to be interviewed should theymove.
full panel filesfull panel filesfull panel filesfull panel files
Files containing all data for every person who was a member of a SIPP panel at any time duringthe life of that panel.
GGGG
general incomegeneral incomegeneral incomegeneral income
Any type of income except earnings and asset income.
Codes that identify where each sample household is located and permit linkage to a file thatcontains a full set of geographic codes for different kinds of areas. This level of geography is notavailable on the public use files.
group quartersgroup quartersgroup quartersgroup quarters
Noninstitutional living quarters, such as rooming and boarding houses, college dormitories,convents, and monasteries. These do not constitute households and are often treated differentlyfrom households.
The matrix used in all but the first stage of hot-deck imputation. As cold-deck values arereplaced with information from the current wave, the resulting array of cells constitutes the hot-deck matrix.
The statistical method used to impute items missing from the core questionnaire and topicalmodules. This procedure replaces missing item data in a wave with nonmissing values fromsimilar interviewed cases. The imputation method can be a purely cross-sectional procedure oflocating donors from the current file on the basis of characteristics reported in this wave, or it canbe a longitudinal procedure of locating donors from the prior wave on the basis of characteristicsreported at that earlier time for items missing in the current wave.
householdhouseholdhouseholdhousehold
People living in a housing unit at the time of the interview. SIPP infers households from theinterviews conducted at each address.
Nonresponse that occurs when the interviewer either cannot locate a household or cannotinterview any of its adult members. See Type A, Type B, Type C, and Type D noninterviews.
household reference personhousehold reference personhousehold reference personhousehold reference person
See reference person.
housing unithousing unithousing unithousing unit
Living quarters with its own entrance and cooking facilities.
GLOSSARYGLOSSARYGLOSSARYGLOSSARY
E-5
IIII
imputationimputationimputationimputation
The most common method for handling missing data in SIPP. Imputation replaces missingvalues with statistical estimates that are based on the best relevant information available.
imputation flagimputation flagimputation flagimputation flag
An imputation flag is associated with each core questionnaire item subject to statisticalimputation and indicates whether information has been imputed.
Pertaining to data collected at different times over an extended period from a representativesample. In SIPP hot-deck imputation procedures, longitudinal refers to previous-wave data.
Households created either when two separate sampling units, each containing original samplemembers, are merged together, perhaps because of a marriage, or when a household splits intotwo new households and later the households recombine.
Data files containing information at the person, family, or household level. For SIPP, theyinclude the core wave files, topical module files, and full panel files.
missing item datamissing item datamissing item datamissing item data
Data that are missing for one or more individual questions or variables, but the observation hassufficient reported information to be classified as interviewed.
Waves in which a respondent has no data, although data are present for other waves.
monthly interview status variablesmonthly interview status variablesmonthly interview status variablesmonthly interview status variables
Variables that indicate whether a person was in sample in a particular month, and whether aperson was in sample in the interview month. They are known as the PP-MIS variables.
movermovermovermover
An original sample person who moves during the life of the panel.
Collects data on current labor force and employment status, work history, and characteristics ofthe current or last job.
non-self-representing (NSR) primary sampling units (PSUs)non-self-representing (NSR) primary sampling units (PSUs)non-self-representing (NSR) primary sampling units (PSUs)non-self-representing (NSR) primary sampling units (PSUs)
Smaller PSUs that must be grouped with similar PSUs from the same region in order to formstrata for sampling. This level of geography is not available on the public use files.
OOOO
original sample membersoriginal sample membersoriginal sample membersoriginal sample members
All people who were interviewed in the first wave of the panel and any children subsequentlyborn to or adopted by them.
oversamplingoversamplingoversamplingoversampling
Sampling that involves selecting certain groups or units with higher probabilities than others,resulting in the oversampled group having greater representation than occurs in the populationfrom which it was drawn.
PPPP
P-70 reportsP-70 reportsP-70 reportsP-70 reports
Primary source for published estimates from the SIPP. These reports can be obtained from theSIPP Web site or from the Census Bureau.
panelpanelpanelpanel
Refers both to a new sample that is introduced periodically in the SIPP and to the full collectionof information for that sample. For example, the 1996 Panel refers to both the sample introducedin 1996 and the 12 waves of interviews conducted with that sample.
Persons for whom an interview is missing for a wave.
Panel Study of Income Dynamics (PSID)Panel Study of Income Dynamics (PSID)Panel Study of Income Dynamics (PSID)Panel Study of Income Dynamics (PSID)
A nationally representative, longitudinal survey of the U.S. population, conducted by theUniversity of Michigan. The focus of the survey is economics and demographics, especiallyincome sources and amounts, employment, family composition changes, and residential location.
This type of noninterview occurs when data are collected for at least one member of a household,but are missing for one or more other sample persons within that household.
A household reference person who lives alone or lives with only nonrelatives.
primary sample membersprimary sample membersprimary sample membersprimary sample members
See original sample members.
primary sampling units (PSUs)primary sampling units (PSUs)primary sampling units (PSUs)primary sampling units (PSUs)
Geographic units based on Census data and used in developing the SIPP sample. This level ofgeography is not available on the public use files.
GLOSSARYGLOSSARYGLOSSARYGLOSSARY
E-9
program unitsprogram unitsprogram unitsprogram units
The group of individuals which constitutes one case, as defined by a particular benefit program.In SIPP, program units apply to health insurance and transfer programs and are identified forprograms in which a case can consist of more than one person.
Interviews taken on behalf of a sample member who is unable to answer.
public use microdata filespublic use microdata filespublic use microdata filespublic use microdata files
Data files that have been prepared by the Census Bureau for public use. These files have alreadybeen processed to impute missing data, to edit data for confidentiality, and to provide weights.Microdata files are available from the Census Bureau or on-line from the SIPP Web site.
QQQQ
RRRR
random carryover methodrandom carryover methodrandom carryover methodrandom carryover method
Longitudinal imputation procedure used to impute missing wave data.
reference personreference personreference personreference person
An owner or renter of record who can reasonably be expected to answer questions about thehousehold in general and about other household members should they be unavailable forinterview. All people in the household are listed according to their relationship to the referenceperson.
related subfamilyrelated subfamilyrelated subfamilyrelated subfamily
A married couple and dependents or parent-child family related to the reference person but notincluding him or her. An example would be the reference person�s daughter and son-in-law.
rotation grouprotation grouprotation grouprotation group
A subsample containing roughly one-quarter of the sample members. One rotation group isinterviewed each month of a 4-month wave.
Loss of sample members. Sample attrition rates decline over time, but total attrition numbersincrease.
seam effectseam effectseam effectseam effect
The tendency of respondents to report a disproportionate number of changes as occurring at the�seam� between the fourth month of one wave and the first month of the following wave.
An individual who is neither a household reference person nor a relative of any other people inthe household.
secondary sample memberssecondary sample memberssecondary sample memberssecondary sample members
People living with original sample members.
GLOSSARYGLOSSARYGLOSSARYGLOSSARY
E-11
self-representing (SR) primary sampling units (PSUs)self-representing (SR) primary sampling units (PSUs)self-representing (SR) primary sampling units (PSUs)self-representing (SR) primary sampling units (PSUs)
Larger PSUs that do not have to be combined with other PSUs in order to form strata forsampling. This level of geography is not available on the public use files.
Mechanisms embedded in the survey that allow the interviewer to skip over irrelevant questionsand call up the next relevant question.
source and accuracy statementsource and accuracy statementsource and accuracy statementsource and accuracy statement
A statement included with the technical documentation that accompanies public use files; itcontains detailed information about weights on the files, when and how to make adjustments tothe weights, and how to use generalized variance procedures to compute standard errors for somecommon types of estimates. It also includes cautions for users about sources of nonsamplingerror.
Survey of Program Dynamics (SPD)Survey of Program Dynamics (SPD)Survey of Program Dynamics (SPD)Survey of Program Dynamics (SPD)
An offshoot of SIPP that began recontacting members of the 1992 and 1993 Panels, with datacollection to continue through 2001 in order to collect 10 years of data.
An on-line data access tool available on the SIPP Web site. Surveys-on-Call allows users todefine microdata extracts from SIPP public use files through the 1993 Panel.
Information that accompanies microdata files and that includes a description of file contents, aglossary, codes, a data dictionary, a source and accuracy statement, and a copy of the corequestions for the panel in question.
Tendency of sample members to �learn� the survey over time, possibly resulting in alteredresponses.
topcodingtopcodingtopcodingtopcoding
Practice of recoding income variables to protect against the possibility that a user mightrecognize the identity of a SIPP respondent with very high income. Incomes exceeding amaximum value are recoded to that maximum value or to a mean of responses in excess of thatvalue.
Questions that are not repeated in every wave. They cover a wide range of topics and can occuronce or more than once in a panel. The questions are grouped into modules by topic.
Missing data in topical modules are imputed using the same hot-deck procedure used to imputemissing data in the core questionnaire.
Type A noninterviewType A noninterviewType A noninterviewType A noninterview
Households that are occupied by people eligible for interview but for which no interview isobtained.
Type B noninterviewType B noninterviewType B noninterviewType B noninterview
A household noninterview that occurs when the address unit is vacant or in some way unfit forresidence.
GLOSSARYGLOSSARYGLOSSARYGLOSSARY
E-13
Type C noninterviewType C noninterviewType C noninterviewType C noninterview
In Wave 1, a household noninterview that occurs when the housing unit has been demolished orconverted to some other use; in subsequent waves, a household noninterview that occurs whenall sample members in a household are outside the scope of the survey, for example, deceased,living abroad, living in institutions, or living in armed forces barracks.
Type D noninterviewType D noninterviewType D noninterviewType D noninterview
Households or people who have moved to an unknown address, or who have moved more than100 miles from the nearest field representative and for whom no telephone interview isconducted. This type of noninterview applies only to Wave 2 and beyond.
Type Z imputationType Z imputationType Z imputationType Z imputation
Procedures used to impute missing data for Type Z noninterviews and for situations when aperson was in sample early in the wave but not in sample by the month of interview.
Type Z noninterviewType Z noninterviewType Z noninterviewType Z noninterview
An eligible person in an interviewed household from whom the field representative could not getan interview or for whom the interviewer could not obtain a proxy interview. A noninterviewalso occurs when a person who was part of the household for a portion of the reference periodmoves and is no longer a household member on the date of the interview. If the person is anoriginal sample member, an effort will be made to locate and follow the person.
A family, that is, a group of two or more related individuals, living at a sample address unit thatdoes not contain the reference person or anyone related to the reference person.
User NotesUser NotesUser NotesUser Notes
Issued periodically by the Census Bureau, these contain updated information for specificmicrodata files.
Provides a complete characterization of a variable�s content. Variable metadata are available onthe SIPP Web site.
WWWW
wavewavewavewave
One round of interviewing, which takes 4 months to complete; one fourth of the sample (i.e., arotation group) is interviewed each month.
wave fileswave fileswave fileswave files
See core wave files.
weightsweightsweightsweights
Estimates of the number of units in the target population that a given unit represents.
XXXX
YYYY
ZZZZ
R-1
References
Allen, T. M., Petroni, R. J., and Singh, R. P. (1993). The effectiveness of oversampling low-income households in the Survey of Income and Program Participation, U.S. Bureau of theCensus, Washington, DC. Proceedings of the American Statistical Association.Alexandria, VA: American Statistical Association.
Brick, J. M., and Kalton, G. (1996). Handling missing data in survey research. StatisticalMethods in Medical Research 5, 215–238.
Bye, B., and Gallicchio, S. (1989). Two Notes on Sampling Variance Estimates from the 1984SIPP Public-Use Files. SIPP Working Paper No. 8902. Washington, DC: U.S. Bureau ofthe Census.
Citro, C. F., Hernandez, D., and Herriot, R. (1986). Longitudinal household concepts in SIPP:Preliminary results. Proceedings of the Bureau of the Census Second Annual ResearchConference, Washington, DC: U.S. Department of Commerce, pp. 598-619. (Alsoavailable as SIPP Working Paper No. 8611, Washington, DC: U.S. Bureau of the Census.)
Citro, C. F., and Kalton, G. (1993). The Future of the Survey of Income and ProgramParticipation. Washington, DC: National Academy Press.
Citro, C. F., Michael, R. T., and Maritano, N. (eds.) (1995). Measuring Poverty: A NewApproach. Washington, DC: National Academy Press, Appendix B.
Coder, J., and Scoon-Rogers, L. S. (1996). Evaluating the Quality of Income Data Collection inthe Annual Supplement to the March Current Population Survey and the Survey of Incomeand Program Participation. SIPP Working Paper No. 9604. Washington, DC: U.S. CensusBureau.
Doyle, P., and Dalrymple, R. (1987). The impact of imputation procedures on distributioncharacteristics of the low income population. Proceedings of the Bureau of the CensusThird Annual Research Conference. Washington, DC: U.S. Department of Commerce, pp.483–508. (Also available as SIPP Working Paper No. 8710, Washington, DC: U.S. CensusBureau)
Duncan, G., and Hill, M. (1985). Conceptions of longitudinal households: Fertile or futile?Journal of Economic and Social Measurement 13, 361–376.
Eargle, J. (1990). Household Wealth and Asset Ownership: 1988. Current Population ReportsP70-22. Washington, DC: U.S. Census Bureau.
Guo, G. (1993). Event-history analysis for left-truncated data. Sociological Methodology 23,217–243.
SIPP USERS’ GUIDE
R-2
Huggins, V. J., and King, K. E. (1997). Evaluation of oversampling the low-income populationin the 1996 Survey of Income and Program Participation (SIPP), U.S. Bureau of theCensus, Washington, DC. Proceedings of the American Statistical Association, SurveyResearch Methods Section. Anaheim, CA: American Statistical Association.
Jabine, T., King, K., and Petroni, R. (1990). SIPP Quality Profile, 2nd Ed. Washington, DC:U.S. Census Bureau.
Jinn, J. H., and Sedransk, J. (1987). Effect on secondary data analysis of different imputationmethods. Proceedings of the Bureau of the Census Third Annual Research Conference.Washington, DC: U.S. Department of Commerce, pp. 509–530.
Kalbfleisch, J. D., and Prentice, R. L. (1980). The Analysis of Failure Time Data. New York:John Wiley & Sons.
Kalton, G., and Brick, J. M. (1995). Survey Methodology, 21, 33-44.
Kalton, G., and Kasprzyk, D. (1986). The treatment of missing survey data. Survey Methodology12(1), 1–16.
Kalton, G., Lepkowski, J., Heeringa, S., Lin, T., and Miller, M. E. (1987). The Treatment ofPerson-Wave Nonresponse in Longitudinal Surveys. SIPP Working Paper No. 8704.Washington, DC: U.S. Census Bureau.
Kalton, G., Miller, D. P., and Lepkowski, J. (1992). Analyzing Spells of Program Participation inthe SIPP. SIPP Working Paper No. 9210 (171). Washington, DC: U.S. Census Bureau.
Kalton, G., Winglee, M., and Jabine, T. (1998). SIPP Quality Profile, 3rd Ed. Washington, DC:U.S. Census Bureau.
King, K., Petroni, R., and Singh, R.P. (1987). SIPP Quality Profile. Washington, DC: U.S.Census Bureau.
Lepkowski, J., and Bowles, J. (1996). Sampling error software for personal computers. SurveyStatistician 35, 10–17.
Lepkowski, J. M., Landis, R. L., and Stehouwer, S. A. (1987). Strategies for the analysis ofimputed data from a sample survey. Medical Care 25(8), 705–716.
Little, R. J. A. (1986). Missing data in Census Bureau surveys. Proceedings of the Bureau of theCensus Second Annual Research Conference. Washington, DC: U.S. Department ofCommerce, pp. 442–454.
Little, R. J. A., and Rubin, D. B. (1987). Statistical Analysis with Missing Data. New York:John Wiley & Sons, pp.129–139.
Marquis, K. H., and Moore, J. C. (1989a). Response errors in SIPP: Preliminary results.Proceedings of the Bureau of the Census Fifth Annual Research Conference. Washington,DC: U.S. Department of Commerce, pp. 515–536.
REFERENCES
R-3
Marquis, K. H., and Moore, J. C. (1989b). Some response errors in SIPP—with thoughts abouttheir effects and remedies. Proceedings of the, American Statistical Association, SurveyResearch Methods Section. Anaheim, CA: American Statistical Association, pp. 381–386.
Marquis, K. H., and Moore, J. C. (1990). Measurement errors in SIPP program reports.Proceedings of the U.S. Bureau of the Census’ 1990 Annual Research Conference.Washington, DC: U.S. Department of Commerce, pp. 721–745.
Marquis, K. H., Moore, J. C., and Huggins, V. J. (1990). Implications of SIPP Record Checkresults for measurement principles and practice. Proceedings of the American StatisticalAssociation, Survey Research Methods Section. Anaheim, CA: American StatisticalAssociation, pp. 564–569.
McCormick, M. K., Butler, D. M., and Singh, R. P. (1992). Investigating time in sample effectfor the Survey of Income and Program Participation. Paper prepared for the AmericanStatistical Association Annual Meeting. Washington, DC: U.S. Census Bureau.
McMillen, D., and Herriot, R. (1985). Toward a longitudinal definition of households. Journal ofEconomic and Social Measurement 13, 504–509. (Also available as SIPP Working PaperNo. 8402. Washington, DC: U.S. Census Bureau.)
McNeil, J. (1988). CPS and SIPP Estimates of Health Insurance Coverage Status. Census BureauInternal Memorandum, May 3.
Moore, J.C. (1988). Self/proxy Response Status and Survey Response Quality—A Review of theLiterature. Journal of Official Statistics 4, 155–172.
Pennell, S. G. (1993). Cross-Sectional Imputation and Longitudinal Editing Procedures in theSurvey of Income and Program Participation. Prepared by the University of MichiganSurvey Research Center, Ann Arbor. Washington, DC: U.S. Census Bureau.
Pennell, S. G., and Lepkowski, J. M. (1992). Panel Conditioning Effects in the Survey of Incomeand Program Participation. Proceedings of the American Statistical Association, SurveyResearch Methods Section. Alexandria, VA: American Statistical Association, pp. 566–571.
Ruggles, P., and Williams, R. (1989). Measuring the Duration of Poverty Spells. SIPP WorkingPaper No. 8909. Washington, DC: U.S. Census Bureau.
Rust, K. (1985). Variance estimation for complex estimators in sample surveys. Journal ofOfficial Statistics 1, 381–397.
Sedransk, J. (1985) The objectives and practice of imputation. Proceedings of the Bureau of theCensus First Annual Research Conference. Washington, DC: U.S. Census Bureau, pp.445–452.
Shapiro, G. M., Diffendal, G., and Cantor, D. (1993). Survey Undercoverage: Major Causes andNew Estimates of Magnitude. Census Bureau Internal Memorandum.
SIPP USERS’ GUIDE
R-4
Shea, M. (1995a). Dynamics of Economic Well-Being: Poverty 1990–1992. Current PopulationReports P70-112. Washington, DC: U.S. Census Bureau.
Shea, M. (1995b). Dynamics of Economic Well-Being: Program Participation, 1990 to 1992Current Population Reports P70-41. Washington, DC: U.S. Census Bureau.
Skinner, C. J., Holt, D., and Smith, T. M. F. (1989). Analysis of Complex Surveys. New York:John Wiley & Sons.
Tuma, N. B., and Hannan, M. T. (1984). Social Dynamics, Models and Methods. Orlando, FL:Academic Press.
U.S. Census Bureau (1991). Survey of Income and Program Participation Users’ Guide, 2nd Ed.Washington, DC: U.S. Census Bureau.
U.S. Census Bureau (1993). Survey of Income and Program Participation Initial Training Guide.Washington, DC: U.S. Census Bureau.
U.S. Census Bureau (1994). SIPP Information Booklet: 1990 and 1991 Panels. Form SIPP-7004A. Washington, DC: U.S. Census Bureau.
U.S. Census Bureau (1998a). Survey of Income and Program Participation Quality Profile, 3rdEd. Washington, DC: U.S. Census Bureau.
U.S. Census Bureau (1998b). The Current Population Survey: Design and Methodology.Technical Paper 63. Washington, DC: U.S. Census Bureau.
Waite, P.J. (1996). SIPP (1996) Specifications for Interview Mode Flag. Internal Census BureauMemorandum to Chester Bowie, May 17th.
Williams, T., and Bailey, L. (1996). Compensating for Missing Wave Data in the SIPP. SIPPWorking Paper No. 9605. Washington, DC: U.S. Census Bureau.
Index-1
Index
Accessing SIPP information. See alsoInformation resourcespublished estimates, 1-5–1-6, 5-1, 5-2–5-3
Activities of Daily Living (ADL)instrument, 3-10, 3-11
10-30–10-31, 12-29, 12-30, 12-31misinterpretation of questions on, 6-3replacement with TANF, 1-3, 9-7, 10-27weights, 8-2
Algorithmscalendar-year and panel weight generation, C-17family identification variables, 12-17, 12-18monthly program income variables, 12-30, 12-36reference months aligned to calendar months,
Health insurance coverage. See alsoMedicaid; Medicarechild support arrangements, 3-15characteristics of, 10-26data edits, 4-16errors in estimates, 6-4ID variables, 9-14, 10-27, 10-29information resources, 5-2, 5-3, 5-16time-specific data, 2-4topical modules, 3-4, 3-8, 3-9–3-10, 3-11, 3-12,
3-13variables, 12-29
Health statuschildren, 3-11disability, 3-11, 3-15topical modules, 3-7, 3-9, 3-11
Home-based employment, 3-6Home health care, 3-11Hospitalized persons, 2-16Hot-deck matrix, 4-9–4-10, 4-11, 4-12, E-4Hotel rooms, 2-6Household(s). See also Family
defined, 2-6, 8-10, 9-6, 10-9, 12-15, E-4enhanced, C-14grouping of related primary families, 10-12identification, 9-6, 9-11, 10-9–10-11, 11-11,
Quality of dataaccuracy of definitions in data definitions, 11-6CAI and, 1-3, 3-1, 6-2, 8-16interview consistency checks, 2-17, 3-1matched records containing imputed data, 1-9nonresponse and, 2-18
Quarterly estimates, 8-14–8-16Questionnaires. See also Computer-assisted
interviewingcore items, 2-3, 3-1, 3-2–3-6correspondence of variables to items on, 10-4–
10-6, 11-6, 12-5–12-6data dictionary correspondence to, 10-4–10-6,
Sample designcomparison of surveys, 1-10oversampling, 2-8–2-9selection of sampling units, 2-5–2-7and variance estimates, 7-1
Sample populationcomparison with other surveys, 1-9, 1-10entries and exits, 13-17–13-20. See also Attritionsize considerations, 1-2, 1-3, 2-2, 6-2, 8-5, 9-9,
12-7, C-19universe, 13-17
Sample Unit IDsadditional household members, 9-3, 10-8, 10-9,
analyzing people in, 10-12defined, 8-11, 10-11, 12-17as distinct family unit, 10-12, 12-19edited relationships, 10-15excluding for analysis purposes, 10-12, 10-13–
ID variables, 9-3, 9-6, 11-7, 11-11–11-27, 13-11,13-14, 13-15, 13-23
imputed data, 4-14, 9-15, 11-11linking family members, 11-13linking two or more, 13-1, 13-11–13-12linking with core wave files, 1-9, 13-12–13-14linking with full panel files, 1-9, 13-14–13-15merging two or more, 11-13merging with core wave files, 1-8, 3-10, 9-6, 9-9,
Unit frame, 2-6University of Michigan, 1-10U.S. Government Printing Office, 5-1User Notes, 5-12, 5-14, 10-2, 11-2, E-13Uses of SIPP, 1-3–1-4Usual place of residence, E-14
Variable metadata, 5-15, E-14Variables. See also ID variables
11-11–11-12, 13-9, A-1–A-34covariances among, 4-11, 4-13crosswalk of 1993 and 1996 names, A-1–A-34dash characters in names, 13-9description of, 10-2, 11-2; see also Data dictionarydifferences by file type, 9-10, 9-11–9-15duplicate names for different variables, 13-11family composition, 9-13, 10-15–10-20, 11-16–