161
SISTEMA PJSFC Annual Report 2016

SISTEMA PJSFC
Annual Report
2016

2
To whom it may concern April 27, 2017 Responsibility Statement To the best of my knowledge (a) the financial statements, prepared in accordance with IFRS, give a true and fair view of the assets, liabilities, financial position and profit or loss of Sistema PJSFC and the undertakings included in the consolidation taken as a whole; and (b) the management report includes a fair review of the development and performance of the business and the financial position of Sistema PJSFC and the undertakings included in the consolidation taken as a whole, together with a description of the principal risks and uncertainties that they face. Yours sincerely, Mikhail Shamolin President and Chief Executive Officer

3
CONTENTS PAGE
RESPONSIBILITY STATEMENT 2
1. MAIN EVENTS 4
2. STRATEGY 7
3. SHAREHOLDER CAPITAL 9
4. MANAGEMENT’S DISCUSSION AND ANALYSIS OF FINANCIAL CONDITION AND RESULTS OF OPERATIONS
15
5. RISKS 57
6. CORPORATE GOVERNANCE SYSTEM
64
7. CORPORATE SOCIAL
RESPONSIBILITY
85
8. AUDITED CONSOLIDATED FINANCIAL STATEMENTS
95

4
1. MAIN EVENTS
Corporate governance
New progressive dividend policy
In April 2016, the Board of Directors of Sistema PJSFC (“Sistema” or “the Company”, together with its
subsidiaries, “the Group”) adopted a new dividend policy. The new policy stated that dividends
recommended for each reporting year would be, at a minimum, the higher of either an amount equivalent
to a dividend yield of at least 4%, or RUB 0.67 per ordinary share.
In April 2017, the Board of Directors approved amendments to the dividend policy: total dividends
recommended for each reporting year will be, at a minimum, the higher of either an amount equal to a
dividend yield of at least 6%, or RUB 1.19 per ordinary share.
Sistema will seek to distribute dividends twice per year, based on its results for the first nine months and
the full year. Sistema’s calculation of the dividend yield on its ordinary shares shall use the weighted
average price of one ordinary share of the Company traded on Moscow Exchange in the relevant
reporting year.
In July 2016, Sistema paid dividends for 2015 in the amount of RUB 6.47bn (RUB 0.67 per ordinary
share or RUB 13.4 per GDR).
In November 2016, Sistema distributed RUB 3.667bn in dividends for the first half of 2016 (RUB 0.38
per ordinary share or RUB 7.6 per GDR).
In April 2017, the Board of Directors recommended that the AGM approves a final dividend for the 2016
financial year of RUB 7.8bn. As a result, the total amount of the interim and final dividends paid for 2016
will be RUB 11.5 bn, which is equivalent to a dividend yield of 6% based on the weighted average price
of Sistema’s shares in 2016.
Co-investment Programme
In May 2016, Sistema adopted a programme for senior management of the Company to participate in the
share capital of Sistema and Group companies ("the Programme"). Under the Programme, heads of
Sistema's investment portfolios have the obligation to make a one-off investment equal to a substantial
part of their total annual income in shares and participatory interests of existing assets under their
management. Heads of investment portfolios also invest a portion of their total annual income in shares
and participatory interests of each of new assets acquired under their management during a year. Heads
of Sistema's functional subdivisions invest a substantial part of their total annual income in the
Company’s shares every year.
Monetisation of investments
Detsky Mir Group’s IPO
In February 2017, Detsky Mir’s shares were listed on the Moscow Exchange. The offering price was set
at RUB 85 per share, corresponding to the company’s market capitalisation of approximately RUB
62.8bn. The shares were admitted to trading in Level 1 of the List of Securities Admitted to Trading on
Moscow Exchange under the ticker DSKY. Sistema owned 72.57% of the company’s shares before the
Offering and sold 151,301,256 shares, which corresponds to approximately 20.5% of Detsky Mir’s share
capital. Following the offering Sistema’s stake in Detsky Mir amounted to 52.1%. As a result of the
transaction, Sistema raised ~RUB 12.9bn (before underwriting fees and other expenses).

5
The transaction represented the first Russian IPO with full-scale international marketing in three
years
The order book was 2x oversubscribed
More than 90% of the final allocation went to foreign investors
The EV/EBITDA’2016 ratio was ~9х, comparable to the multiples of the largest food retail
companies in Russia
Sale of the stake in SG-trans
In August 2016, Sistema sold 50% of SG-trans to a group of non-affiliated buyers for RUB 6.0bn. The
Corporation remains the owner of assets previously spun off from SG-trans, including SG-trading and
real-estate assets.
New projects
Development of Sistema’s land bank
Sistema continues to make significant investments in agricultural assets. During 2016, Sistema’s
agricultural business increased its total land bank 2.3 times to 315,000 hectares adding 176,000 hectares
of land with acquisitions in May, November and December of 2016 in the Rostov and Stavropol regions.
Acquisition of Lesosibirsk LDK No. 1
In 2016, Segezha Group, Sistema’s pulp and paper holding, acquired a 99% stake in Lesosibirsk LDK
No. 1 (“LDK”), one of the largest vertically integrated wood processing enterprises in Russia, based in
Krasnoyarsk region. LDK is Russia’s leading producer of lumber, fibre board, planed mouldings and
furniture made from Angara pine. The acquisition allowed Segezha Group to more than double sales of
lumber during the year. In 2016, LDK delivered strong operational and financial performance,
contributing RUB 5.7 billion in revenue.
Private equity fund with Rusnano
In September 2016, Sistema and Rusnano launched a joint private equity fund specialising in investments
in high-tech companies and projects. The fund will have up to USD 100m under management. Sistema
and Rusnano each own 50% of the fund, and will allocate cash funds as soon as it becomes necessary to
finance specific transactions. The private equity fund has been established for an initial seven-year term,
which may be extended for an additional three years. The average investment size being targeted is USD
5-20m. In the future third party investors will also be able to invest in the fund. For more details about
the fund, see Other Investment Activities: Funds.
Development of the hotel business
In November 2016, Sistema’s subsidiary Sistema Hotel Management agreed to acquire nine Regional
Hotel Chain (RHC) hotels from VIYM, a company managing the private equity funds in the CIS and
Europe, for RUB 2.6bn. The hotels include Courtyard by Marriott Paveletskaya (Moscow), Holiday Inn
Express (Voronezh) and seven Park Inn hotels in Astrakhan, Volgograd, Izhevsk, Kazan, Novosibirsk,
Sochi, and Yaroslavl, and have a total of 1,379 rooms with floor space of 87,613 sq m. The hotels had
total external debt of RUB 4bn. All of the hotels were built over the past five years and do not currently
require any capital investments. The hotels opened in 2014-2015 – Holiday Inn Express (Voronezh), Park
Inn (Volgograd), Park Inn (Novosibirsk) and Park Inn (Sochi) – have significant potential for increased
profitability when they achieve their target performance indicators. For more details about Sistema’s
hotel business see: Other Investments.
Other events
Changing ownership stake in MTS

6
During 2016, Sistema conducted a number of transactions to sell MTS shares, bringing Sistema’s
effective stake in MTS’s share capital to 50.03%. As a result of the sales, Sistema raised RUB 18.1bn in
2016 on the Corporate Centre level; an additional RUB 4.7bn was received in the first quarter of 2017
from participating in MTS’s share buyback programme.
Restructuring of Rusnano’s put option
In October 2016, Sistema signed an agreement with Rusnano to restructure an option agreement dated 15
May 2014 with respect to shares of Mikron. Under the terms of restructuring, in 2017 Sistema will
acquire from Rusnano 20.42% of Mikron shares for RUB 8.1bn, of which RUB 4.8bn were paid in 2016
and RUB 3.3bn will be paid on or before 29 December 2017. The option agreement signed on 15 May
2014 gave Rusnano the right to sell a stake in Mikron to Sistema for RUB 8.1bn between 31 October
2016 and 1 November 2017.

7
2. STRATEGY
Sistema’s vision
Sistema’s mission is to build a first-class Russian investment company that grows long-term shareholder
value by efficiently managing its asset portfolio and achieving high returns on investment.
Value creation model
Sistema’s investment model aims to monetise its portfolio of assets by accumulating cash from incoming
dividends and proceeds from asset sales, and subsequently either
(1) investing in new, high-potential investment projects capable of generating high returns on invested
capital;
(2) distributing profit to shareholders in the form of dividends; or
(3) investing in the development of existing assets to increase their value.
Basic investment strategy principles
Generation of returns on investment above the long-term cost of capital (IRR>WACC), with a
five to seven-year payback period
Focus on investments with a positive net cash flow
Acquisition of assets with acceptable debt levels (Debt/OIBDA of the acquired asset <3.0x)
Maintaining the consolidated debt/EBITDA ratio at 2.5x or less
Distributing up to 30% of cash income in dividends
Investment criteria:
Sectors and industries: Sistema mostly buys assets in sectors that are complementary to those in
which it already operates, making it possible to leverage existing expertise and build synergies
with its existing portfolio. It also invests in new attractive industries, including export-oriented
sectors, where it has expertise or partners with relevant expertise.
Geography: Sistema sees Russia and other CIS countries as its highest-priority investment
locations, while also considering opportunities for further expansion to support future growth and
diversity its FX and country risks.
Asset size: Sistema focuses on large and medium-sized assets with the potential to become
market leaders through synergies, industry consolidation, and efficient investment and
operational strategies.
Sistema’s goals for the next three to five years:
1. Maximising total shareholder return (TSR)
2. Creating undisputed leaders in key industries, in particular agriculture, pulp and paper, healthcare,
etc.
3. Dividend yield for shareholders above the market average
4. Raising and managing external capital
5. Increasing the share of assets other than MTS to approximately 70% of the portfolio
6. Reducing market capitalisation discount to NAV
Medium-term goals of Sistema as an investment company
Consistent implementation of portfolio strategy:

8
- Generating substantial cash flows to Sistema through portfolio monetisation and higher
dividends from portfolio companies
- Diversifying the asset portfolio by acquiring large and medium-sized export-oriented
companies in Russia capable of generating revenues in foreign currencies for Sistema’s benefit
Creating value in current portfolio companies:
- Transforming existing assets into new industry leaders by applying best business practices
- Restructuring and supporting portfolio companies operating in segments that are most
vulnerable to negative macroeconomic factors and are struggling to implement their strategies
- Implementing best corporate governance practices at subsidiaries, including appointing
independent directors to their boards
Developing international investment platforms in Europe, Asia and the US to:
- Raise funds from co-investors
- Ensure extra points of growth for the asset portfolio by entering export markets
Co-investment Programme
In May 2016, Sistema adopted a programme for senior management of the Company to participate in the
share capital of Sistema and Group companies ("the Programme"). Under the Programme, heads of
Sistema's investment portfolios have the obligation to make a one-off investment equal to a substantial
part of their total annual income in shares and participatory interests of existing assets under their
management. Heads of investment portfolios also invest a portion of their total annual income in shares
and participatory interests of each of new assets acquired under their management during a year. Heads
of Sistema's functional subdivisions invest a substantial part of their total annual income in the
Company’s shares every year.

9
3. SHAREHOLDER CAPITAL
Sistema PJSFC has 9,650,000,000 ordinary shares outstanding with a nominal value of RUB 0.09 each.
Share capital amounts to RUB 868,500,000.
In February 2005, Sistema held an IPO on the London Stock Exchange (LSE). Its shares are traded on the
LSE in the form of global depositary receipts (GDRs) under the ticker symbol SSA. One GDR represents
20 ordinary shares. Sistema’s ordinary shares are listed on Moscow Exchange (MOEX) under the ticker
symbol AFKS. GDRs in free float traded on LSE represent 17.6% of Sistema’s equity, and ordinary
shares in free float account for 15.3%.
Moscow Exchange includes Sistema’s shares when calculating its key indices (MOEX Russia Index,
formerly known as MICEX, and RTS), as well as its Broad Market Index and Banks and Finances Index.
Sistema’s GDRs are included in the MSCI Russia Index, one of the MSCI Emerging Markets indices.
Inclusion in the MSCI indices testifies to the company’s international recognition and promotes the
issuer’s good reputation among major institutional investors that use these indices when selecting
securities.
Shares of PJSC MTS, a Sistema subsidiary, are traded on MOEX under the ticker MTSS and on the New
York Stock Exchange (NYSE) in the form of American Depository Receipts (ADRs) under the ticker
MBT.
Shares of PJSC Detsky Mir, a Sistema subsidiary, began trading on MOEX in February 2017 under the
ticker DSKY.
Sistema’s principal shareholder is the Chairman of the Board of Directors Vladimir Evtushenkov, who
owns 64.2% of the Corporation’s equity.
Sistema PJSFC’s shareholding structure*
*As of 31 March 2017.
** Ordinary shares and GDRs owned by Sistema Group companies, Sistema’s management and members of the Board of Directors
Sistema GDR and ordinary share prices performance1
Sistema’s GDRs rose at the same rate as the market in 2016, growing by 52.5%, while its ordinary shares
increased by 31.3%. Growth of Sistema’s market capitalisation during the year was driven mostly by
1 Source: Bloomberg
64.2%
17.6%
15.3%
2.9%
Vladimir Evtushenkov
GDRs in free float
Ordinary shares in free float
Other**

10
higher valuations of non-public assets, selective monetisations, adoption of a new dividend policy and
increased dividend payments.
On the first trading day of 2016, Sistema’s GDRs on the LSE closed at USD 6.04, for a total market
capitalisation of USD 2,914.3m. On the last trading day of the year, the closing price was USD 9.00, for a
total market capitalisation of USD 4,342.5m.
The highest GDR closing price of 2016, USD 9.00, was achieved on the final trading day of the year. On
8 December, ordinary shares rose to a maximum of RUB 23.49. The lowest GDR closing price was seen
on 21 January 2016 (USD 5.06), while the lowest price for the ordinary shares was registered on 7 April
2016 (RUB 16.99). The average daily trading volume on the LSE was 395,144 GDRs, while the average
trading volume on MOEX was 6,891,000 ordinary shares.

11
3.1 Remuneration policy for Board members and senior management
Remuneration policy for Sistema Board members
Remuneration for members of the Board of Directors is calculated and paid in accordance with the Policy
on Remuneration and Compensation Payable to Members of the Board of Directors of Sistema PJSFC2.
Basic remuneration of Board members
Board members are paid RUB 13.7m or RUB 17.8m per year, depending on whether the director in
question is a tax resident of Russia. Basic remuneration is paid to Board members in cash in four equal
quarterly instalments.
Supplementary remuneration of Board members
Board members are awarded supplementary remuneration in the form of ordinary shares of Sistema,
subject to investment targets for the reporting year being achieved: (i) the arithmetic mean of total
shareholder return (TSR) and internal total shareholder return (iTSR) exceeds or equals cost of equity
(CoE)3; or (ii) TSR exceeds or equals the change of the MSCI index (ΔMSCI), provided that iTSR
exceeds or equals CoE. The number of ordinary shares awarded to Board members is calculated as
follows:
Remuneration in monetary terms
Weighted average price of one share
To calculate the number of shares to be awarded to Board members, the amount of remuneration in
monetary terms is equal to the amount of basic remuneration less applicable taxes, and the weighted
average price of one share is calculated based on the price of the Corporation’s GDRs during the month
preceding the date of the AGM.
Remuneration for performance of additional duties
Board members performing additional duties such as Chairman and Deputy Chairman of the Board of
Directors, and chairmen of Board Committees, receive remuneration quarterly in the amount stipulated by
the Policy on Remuneration and Compensation.
Board members are reimbursed for expenses accrued in connection with their duties, including
participation in meetings of the Board of Directors and Board Committees.
Sistema insures the liability of members of the Board of Directors.
Sistema does not grant loans to members of the Board of Directors.
Remuneration policy for senior management
Short-term incentive system
In 2016, the short-term (up to one year) incentive scheme for senior managers consisted of:
a fixed monthly salary determined in line with the internal system of job categories (grades);
2 Approved by the General Meeting of Shareholders on 27 June 2015. 3 This investment target was achieved in 2016, since the arithmetic mean of TSR and iTSR was 41.2% and CoE was 14.6%. CoE represents the minimum level of return that a company must provide to its shareholders for the expectation of profit and risk. CoE is calculated as the sum of
risk-free returns (such as government bonds) and the risk premium associated with investing in the stock market, taking into account the capital
structure of the asset in question and country risk.

12
bonuses paid for project implementation and generation of cash income. Remuneration is paid
based on employees’ individual performance and positive cash flow generated by projects of
Sistema’s Investment Portfolios, Functions and Departments. Payments may amount to up to 20%
of cash income.
For the purpose of calculating bonuses, cash income means the increase in the value of an asset (in case
of an asset sale or IPO) or the amount of dividends (in case of dividend payments), net of the following:
hurdle rate determined by the Corporation’s Finance and Investment Committee before the start
of a project or the acquisition of an asset;
investment in an asset and project costs.
Long-term incentive system
In 2016, the long-term (more than one year) incentive scheme for senior managers formed part of a three-
year incentive programme (2015-2017) designed to increase Sistema’s shareholder value and create
additional incentives for maintaining long-term employment and corporate relations between the
Corporation and its management. Programme participants are assigned a certain number of shares that are
transferred to them in instalments in the form of Sistema’s ordinary registered shares when targets set by
Sistema’s shareholders are achieved. Share transfers take place annually over the course of five years
from the launch of the programme. The number of shares allocated to a programme participant is
calculated using the following formula:
Participant′s total annual income
Weighted average price of one share during the year
Co-investment programme
In May 2016, the Board of Directors approved a programme allowing Sistema’s senior managers to co-
invest in subsidiaries and/or shares of Sistema. The Co-investment Programme aims to increase senior
management’s motivation to boost the Corporation’s market capitalisation, and includes additional
incentives linked to achievement of strong financial results through project origination and
implementation and efficient management of the Corporation’s assets, including asset acquisitions, sales,
restructurings, growth of market capitalisation and increasing dividend flows.
The programme participants are the President and heads of Investment Portfolios, Functions and
Departments. Co-investment Programme participants use their own funds to acquire:
shares/stakes in Sistema’s subsidiaries; and/or
ordinary shares of Sistema PJSFC.
The amount of co-investment is limited by the participant’s average annual income.
Remuneration is paid if:
there is a liquidity event in relation to a subsidiary (IPO or sale of a stake); or
a participant holds Sistema’s ordinary shares for two years without interruption.
Remuneration is paid in cash. The amount is directly linked to the gain in the value of the shares of the
subsidiary and/or ordinary shares of Sistema.
No extra compensation above the level stipulated by Russian labour legislation is paid to the President or
other senior executives in case of termination of employment.

13
Sistema does not pay remuneration to members of executive bodies for serving on the Management
Board.
The Corporation does not grant loans to senior executives.
Remuneration paid to Board members and senior management in 20164
Members of Sistema’s Board of Directors received the following remuneration in 2016:
Cash remuneration RUB 498,400,342 Remuneration for work in the Board of
Directors and additional duties, as well as
salaries and bonuses for 2016 paid to Board
members who were also employees of the
Corporation in 2016.5
Remuneration in the form of
ordinary shares of Sistema
RUB 422,928,991 Shares paid to Board members for corporate
year 2015-20166 and remuneration under the
long-term incentive programme.
Reimbursement of expenses
incurred by Board members
in connection with their
duties
RUB 3,713,752
Members of Sistema’s Management Board7 received the following remuneration in 2016:
Cash remuneration RUB 3,148,937,048 Including fixed salaries and bonuses.8
Remuneration in the form of
ordinary shares of Sistema
RUB 1,155,134,028 Shares paid under the long-term incentive
programme.
4 All figures in this section are given before the applicable income tax. 5 Excluding members of Sistema’s Board of Directors who were members of its Management Board. 6 The rouble equivalent of fixed amounts in US dollars, calculated at the Russian Central Bank’s exchange rate on the date of payment (see above in this section). 7 Including the President of Sistema PJSFC. 8 Bonuses for 2016 were paid to Sistema’s employees in January 2017.

14
3.2 Dividends
In 2016, Sistema’s Board of Directors approved a revised dividend policy. In line with the new policy,
total dividends recommended for each reporting year will be, at a minimum, the higher of either an
amount equivalent to a dividend yield of at least 4%, or RUB 0.67 per ordinary share. The Corporation
also set itself the goal of paying dividends twice a year: for the first half of a reporting year and for a full
reporting year.
In April 2017, after the end of the reporting period, the Board of Directors made further amendments to
the Dividend Policy and approved increases of minimum annual dividend yield to 6% from 4% and
minimum dividend per share to RUB 1.19 from RUB 0.67. This revised approach to distribution of
dividends allows the Corporation to increase the total amount of dividends paid, thereby increasing
shareholder returns and strengthening the Corporation’s investment case.
In April 2017, the Board of Directors recommended that the AGM approve a final dividend for the 2016
financial year of RUB 7.8bn. As a result, the total amount of the interim and final dividends paid for 2016
will be RUB 11.5bn, which is equivalent to a dividend yield of 6% based on the weighted average price
of Sistema’s shares in 2016.
Dividends distributed for FY 2015
On 25 June 2016, the AGM approved a dividend payment of RUB 6,465,500,000.00 in dividends, or
RUB 0.67 per ordinary share. As of 31 December 2016, the total amount of dividends distributed was
RUB 6,465,433,999.64. Withholding tax on dividends distributed to foreign shareholders totalled RUB
2,383,622.00.
Dividends distributed for the first six months of 2016
On 23 September 2016, an EGM approved the distribution of RUB 3,667,000,000.00 in dividends, or
RUB 0.38 per ordinary share in Sistema PJSFC. As of 31 December 2016, the total amount of dividends
distributed was RUB 3,666,960,913.20. Withholding tax on dividends distributed to foreign shareholders
totalled RUB 1,337,413.00.
Omitted dividends
Omitted dividends as of 31 December 2016 totalled RUB 899,034.32, including RUB 105,087.16 due in
2016. These dividends were declared but unpaid due to lack of necessary information about the recipients
to make the cash transfers.
2012 2013 2014 2015
2016
(For FY
2015)
2016
( H1 2016)
Total
dividends,
RUB
2,702,000,000 9,264,000,000 19,879,000,000 4,535,500,000 6,465,500,000 3,667,000,000
Dividend per
share, RUB 0.28 0.96 2.06 0.47 0.67 0.38
Date of
dividend
announcement
30.06.2012 29.06.2013 28.06.2014 27.06.2015 25.06.2016 23.09.2016
Payable date 24.08.2012 26.08.2013 31.07.2014 29.07.2015 27.07.2016 20.10.2016

15
4. MANAGEMENT’S DISCUSSION AND ANALYSIS OF FINANCIAL POSITION AND
RESULTS OF OPERATIONS
The following is a discussion of our financial position as of 31 December 2016 and 2015 and results of
operations for 2016 and 2015 and of the material factors that we believe are likely to affect our
consolidated financial position. You should read this section together with our audited consolidated
financial statements for 2016 and 2015 (further – the “Financial Statements”). References to “the Group”,
“we” or “us” are references to Sistema PJSFC and its subsidiaries. Our reporting currency is the Russian
Ruble, and our Financial Statements have been prepared in accordance with International Financial
Reporting Standards (IFRS).
In addition, this discussion contains forward-looking statements that involve risks and uncertainties. Our
actual results may differ materially from those discussed in forward-looking statements as a result of
various factors.
We are one of the largest publicly-traded diversified investment companies in the Russian Federation and
the CIS, managing companies serving over 100 million customers. We are focused on delivering long-
term growth to our shareholders through returns on our diversified portfolio of investments and
identifying new and profitable investment opportunities. Our investment portfolio is currently largely
composed of stakes in Russian businesses in a variety of sectors, including telecommunications, retail,
high technology, finance, pulp and paper, utilities, pharmaceuticals, healthcare, agriculture and tourism.
We were established in 1993 by Vladimir Evtushenkov and his close associates and developed through
the 1990s and early 2000s through participation in privatisations and the creation of several successful
strategic partnerships. We completed an initial public offering in February 2005, when we listed our GDRs
on the London Stock Exchange under the symbol "SSA". Our ordinary shares are listed on the Moscow
Exchange.
The following table illustrates our ownership interests in our principal consolidated subsidiaries and
equity holdings as of 31 December 2016 and 2015.
Beneficial ownership
as of 31 December
Significant entities Short name
Principal activity
2016
2015
Mobile TeleSystems PJSC MTS
Telecommunications
50.03%
53.47%
Sistema Shyam TeleServices Limited SSTL
Telecommunications
56.68%
56.68%
MTS Bank PJSC MTS Bank
Banking
86.66%
87.11%
RTI OJSC RTI
Technology
87.00%
84.68%
Detsky mir PJSC Detsky mir
Retail trading
72.63%
75.82%
Medsi JSC Medsi
Healthcare services
100%
100%
Targin JSC Targin
Oilfield services
disposed
100%
Bashkirian Power Grid Company JSC BPGC
Energy transmission
90.96%(1)
90.96%(1)

16
Segezha Group LLC Segezha Group
Pulp and paper
100%
100%
Leader-Invest JSC Leader-Invest
Real estate
100%
100%
Agroholding Steppe JSC Steppe
Agriculture
88.13%
100%
(1) Voting interests as of December 31, 2016 and 2015 – 93%.
Segment Reporting
Our reportable segments are Mobile TeleSystems (“MTS”), Detsky mir, RTI, MTS Bank, Sistema Shyam
TeleServices (“SSTL”) and Corporate. MTS is one of the leading telecommunications group in Russia and
the CIS, offering mobile and fixed voice, broadband, internet access, pay TV as well as content and
entertainment services in Russia, Ukraine, Armenia and Turkmenistan. Detsky mir is the largest retail
chain in the children’s goods market in the Russian Federation and Kazakhstan. Activity of Detsky mir is
the sale of children’s clothing and goods through retail and internet stores. RTI is a Russian industrial
holding, which develops and manufactures high-tech products and infrastructure solutions in the fields of
radio communication and space technology, threat monitoring and control solutions, microelectronics and
system integration. MTS Bank is a universal commercial bank with operations in Russia and
Luxembourg. SSTL is a mobile operator in India. Corporate segment comprises the Company and
entities, which hold and manage the Company’s interests in its subsidiaries, joint ventures and associates.
The Other category includes other operating segments including Segezha Group, Sitronics, Kronshtadt
Group, Binnopharm, Medsi, Agroholding Steppe, Sistema Venture Capital, Intourist, Leader-Invest and
Bashkirian Power Grid Company (“BPGC”), none of which meets the quantitative thresholds for
determining reportable segments.
To measure the performance of these segments, we examine certain segment financial information,
including net sales to external customers, intersegment sales, operating income and OIBDA.
Operating environment
Potential adverse effects of economic instability and sanctions in Russia – Starting from 2014, sanctions
have been imposed in several packages by the U.S. and the E.U. on certain Russian officials, businessmen
and companies. This led to reduced access of the Russian businesses to international capital markets.
The impact of further economic and political developments on future operations and financial position of
the Group might be significant.
Political and economic crisis in Ukraine – During 2014, a deterioration in the political environment of
Ukraine has led to general instability, economic deterioration and armed conflict in eastern Ukraine. The
deterioration has further exacerbated the country’s already weak macroeconomic trends, which have led
to reduced credit ratings, significant depreciation of its national currency and increased inflation. During
2014, the Ukrainian Parliament adopted a law allowing for the imposition of sanctions against countries,
persons and companies deemed by the Ukrainian government to threaten Ukrainian national interests,
national security, sovereignty or the territorial integrity of Ukraine. The National Bank of Ukraine
(“NBU”) passed a decree prohibiting Ukrainian companies to pay dividends to foreign investors. The
decree was extended for a few times and its edition effective as of 31 December 2016 allows payment of
dividends for the years 2014-2015, subject to certain restrictions. These circumstances, combined with
continued political and economic instability in the country, could result in further negative impact on the
Group’s business including our financial position and results of operations.

17
Such risks especially apply to funds deposited in Ukrainian banks, whose liquidity is affected by the
economic downturn. During 2015, the Group created an additional reserve of RUB 1,698 million for cash
balances deposited in distressed Ukrainian banks which was included in Impairment of financial assets
line in the accompanying consolidated statement of profit or loss.
Also, in 2015 the Group entered into a factoring agreement in respect of cash balances deposited in bank
Kyivska Rus (reserved in full amount as of 31 December 2016), under which the factor is obliged to
reimburse the Group for 45% of the cash balance. As of 31 December 2016, the Group did not account
for any asset under this agreement, as no transfer of funds was made. As of 31 December 2016, the
Group’s held RUB 3,617 million in current accounts and deposits in Ukrainian banks.
Anti-terror law – On 7 July 2016, a series of anti-terror laws (also known as “Yarovaya-Ozerov packet of
laws”) was enacted. The laws provide for mandatory storage of recorded phone conversations, text
messages of subscribers, images, sounds, video and other types of messages by telecommunications
operators for certain periods of time. These requirements become effective starting 1 July 2018.
Compliance with laws may require construction of additional storage, processing and indexing centers
and significant increase in the Group capital expenditures. This may adversely impact Group’s financial
indicators.
The requirements of the series of anti-terror laws are in the process of clarification and in-depth
development. The Group will estimate the possible impact of the anti-terror laws on the Group’s
consolidated financial statements, including additional provisions, when the requirements and any
obligations are sufficiently specified.
Key Factors Affecting Our Results of Operations
General Factors
Russian Macroeconomic Conditions and Trends
The following table sets out key economic indicators of the Russian Federation and for the periods
indicated:
Year Ended 31 December
Macroeconomic indicator 2016 2015
Real GDP growth (%, period-on-period) -0.22 -2.83 Inflation Consumer price inflation (%) 5.39 12.9 Producer price inflation (%) 7.4 10.7 Exchange rates Period-end exchange rate (RUB/USD) 60.66 72.88 Average exchange rate (RUB/USD) 67.03 60.96 Nominal ruble appreciation (depreciation) against U.S. dollar (based on period-end
rates) 16.4% -29.5%
____________________________
Source: The Federal State Statistics Service (Rosstat).
The macroeconomic condition of the Russian economy substantially affects our results of operations.
A fall in GDP, for example, would likely lead to a decline in demand for the products our subsidiaries
offer. A fall in GDP may also lead to a decline in the prices of the products our subsidiaries sell. In
addition, a decline in real disposable income may negatively impact our results of operations, should it
cause a decline in demand for the key retail products our subsidiaries sell.

18
Inflation and exchange rate movements have a particular impact on our results of operations.
Inflation and exchange rate movements
While a significant part of our purchases are denominated in U.S. dollars or are closely tied to the U.S.
dollar, a significant share of our costs, including salaries and utility costs, are sensitive to rises in the general
price level in Russia. An increase in inflation, therefore, would increase our costs and thereby exert
downward pressure on our profit margin and may also negatively impact domestic demand for the products
of our subsidiaries. To the extent the increase in costs from higher inflation is not offset by an increase in
sales, our results of operations would be negatively affected.
MTS’ financial position and results of operations have been influenced by inflation in the various countries
in which it conducts business. Inflation in Russia in 2016 amounted to 5.39%, which was significantly
lower as compared to 12.9% in 2015. Over previous periods, there has been a tendency towards inflation-
driven increases in certain of our costs, which are sensitive to rises in the general price level in Russia. In
addition, high inflation level in Russia may lead, inter alia, to higher marketing expenditures by us in
order to remain competitive, which could affect our operating margins. In 2016, inflation in Ukraine
reached 12.4%, according to the “Inflation Report” of the National Bank of Ukraine as of January 2017.
Key reasons of high inflation rate in Ukraine are weakening of the national currency, increase in prices
for energy carriers and utility payments.
At the end of 2014, 2015 and 2016, inflation in Belarus amounted to 16.2%, 12.0% and 10.6%,
respectively. Inflation rates in Armenia and Turkmenistan in 2016 were estimated at 4.0% and 6.17%,
respectively. High rates of inflation in Russia, Ukraine and other countries of our operation could increase
our costs and decrease our operating margins.
The depreciation of the ruble against the U.S. dollar would likely have a negative effect on our financial
position and results of operations. On the other hand, Segezha Group financial results would likely be
positively impacted by the ruble depreciation. With respect to our financial position, ruble depreciation
would lead to an increase in the ruble equivalent of our borrowings and other liabilities that are denominated
in U.S dollars, and would subject our investments in ruble-denominated monetary assets to the risk of loss
in U.S. dollar terms. As of 31 December 2016, our borrowings denominated in foreign currencies equaled
RUB 153,436 million. Ruble depreciation may also make it more difficult to fund timely cash payments on
debt denominated in foreign currencies. The negative impact of ruble depreciation on our financial position
would be partially offset, however, by an increase in the ruble equivalent of our monetary assets denominated
in foreign currencies, such as the U.S. dollar or euro. With respect to our results of operations, ruble
depreciation would have an adverse effect on our costs denominated in U.S. dollars. Depreciation of the
ruble against the U.S. dollar would also increase our costs denominated in rubles, both in absolute terms
and relative to ruble-denominated revenues.
While we could seek to raise our prices and tariffs to compensate for the increase in costs resulting from
depreciation of the ruble, competitive pressures may not permit increases that are sufficient to preserve
our operating margins.
We carry out a variety of measures to hedge against currency fluctuations, and, in particular, the
depreciation of the ruble against the U.S dollar.
Capital expenditures and the implementation of large-scale investment projects
We require substantial funds to support our operations and implement large-scale investment projects at
our subsidiaries. Our portfolio companies require capital expenditures for various reasons. MTS, for
example, needs to make significant capital expenditures, particularly in connection with the development
and the purchasing of software for our mobile and fixed line networks. Our results of operations,

19
therefore, are impacted by our ability to raise adequate levels of debt financing and successfully complete
capital investment projects in a timely manner and within budget.
In 2016 and 2015, our cash outlays for capital expenditures were RUB 122,878 million and RUB
139,223 million, respectively. In 2016 and 2015, we financed our cash requirements through a
combination of operating cash flows, proceeds from disposal of investments and borrowings. In
particular, we have used cash flows received through dividends from MTS to finance capital expenditures
in our other subsidiaries as well as to repay our debt.
The table below sets forth capital expenditures at each of our reportable segments for the periods indicated:
Year Ended 31 December
Segment 2016 2015
( in millions of Rubles)
MTS 86,149 106,537
Detsky mir 1,747 5,308
RTI 3,955 5,115 MTS Bank 1,793 631 SSTL 311 1,595 Corporation 7,256 1,870 Other* 21,667 18,167 122,878 139,223
*inter-segment eliminations are included
Certain of our subsidiaries, such as MTS, operate in capital-intensive industries, and their results of
operations depend significantly on their ability to successfully carry out large-scale investment projects.
This includes the ability to select and prioritise those large-scale investment projects which are most
likely to increase margins and the ability to plan and implement such projects, including attracting the
significant funding necessary to ensure their completion.
MTS spent in total RUB 86,149 million in 2016 for network development in Russia and the other
countries where it operates.
Acquisitions strategy
Our investment approach is based on seeking opportunities to create value for our portfolio, including
through acquisitions. During 2016 and 2015, several of our acquisitions have had an impact on our
results of operations and financial position. The ability to carry out large-scale acquisitions successfully
and on a timely basis is largely dependent on choosing the appropriate companies to acquire, securing the
necessary financing and properly integrating the acquired companies into our portfolio.
Our ability to create value is dependent on our ability to choose the appropriate acquisitions to make. For
this, we rely on various financial metrics including total shareholder return, or TSR, which is compared
against internal hurdle rates for specific industries and investment types when making an acquisition.
Having selected a potential value-enhancing acquisition, we often require substantial funding sources to
complete the transaction. Historically, we have relied on the combination of operating cash flows,
dividends from subsidiaries and external funding to finance our acquisitions. We expect to continue
relying on these sources for future acquisitions, and, in particular, expect to seek external funding sources
only for large-scale acquisitions. Therefore, our ability to make acquisitions depends on factors that
affect the overall performance of our subsidiaries and conditions on the lending market, including the
condition of the global and Russian economies and market interest rates.

20
Our results of operations are also dependent on properly integrating a newly acquired company into our
portfolio. We seek to influence our portfolio companies primarily through board representation, with
operational decisions taken by the management teams of each portfolio company. In certain circumstances,
we may also assist our portfolio companies in relation to overall strategy, partnerships, risk management,
corporate governance and internal controls, third party financing, management selection and identifying and
implementing synergies with other portfolio companies.
Factors Affecting MTS Results of Operations
In addition to general economic conditions, inflationary trends and currency fluctuations discussed above,
factors significantly affecting the results of operations of MTS are set forth below.
Competition and Market Penetration
Demand for wireless communications services in Russia has grown rapidly over the last years due to
increased business activity, declining prices due to intensified competition among wireless
communications providers and growth of new emerging consumers of telecom services such as IoT. As of
31 December 2016, overall wireless penetration in Russia was approximately 174.3%, or approximately
256 million subscribers, according to our estimates.
The primary mobile competitors in Russia include us, MegaFon and Vimpelcom, each of which has
effective national coverage in Russia. Competition is based on network coverage and quality, the level of
customer service provided, roaming and international tariffs, local tariff prices and the range of services
offered.
Tariff regulation
The Federal Tariff Service regulates certain tariffs in the sphere of telecommunications, including the
tariffs on the local and DLD calls by subscribers of public switched telephone networks and installation
and subscription fees. The Federal Service for the Oversight of Consumer Protection and Welfare is
responsible for the enforcement of sanitary regulations, including some authority over the location of
telecommunications equipment, and supervises the compliance of companies with the regulations relating
to the protection of consumer rights. The Federal Service for State Registration, Cadastre and
Cartography is responsible for registering certain telecommunications infrastructure that is considered
real property in accordance with Government Decree No. 68 dated February 11, 2005. The Federal
Service for Financial Monitoring (Rosfinmonitoring) is a federal executive body responsible for
countering money laundering and terrorism financing. Mobile operators are to comply with Federal Law
No. 115-FZ dated August 7, 2001 “On combating money laundering and terrorist financing.”
If MTS or any of MTS’ subsidiaries were to be classified by FAS (or the AMC with respect to our
operations in Ukraine) as a dominant market force or as having a dominant position in the market, FAS
and the Federal Tariff Service (or the AMC, as the case may be) would have the power to impose certain
restrictions on our or their businesses. In particular, the authorities may impose on us tariffs at levels that
could be competitively disadvantageous and/or set interconnect rates between operators that may
adversely affect our revenues. Moreover, MTS refusal to adjust its tariffs according to such government-
determined rates could result in the imposition of fines. Additionally, geographic restrictions on MTS
expansion could reduce MTS subscriber base and prevent it from fully implementing MTS business
strategy, which may materially adversely affect MTS’s business, financial position, results of operations
and prospects.

21
Factors Affecting Detsky mir Results of Operations
Sector overview
The size of Russia's children's goods market was RUB 519.5bn in 2016. Analysts project that the market
will grow by an average of about 1.5% per year and will reach RUB 554.4bn by 2020. After a double-
digit growth in 2011-2013, the market found itself in a long-term stagnation. The current economic
situation forced Russians to reconsider their approach to purchases of children's goods. In 2015, price has
become the most important factor, and consumer behaviour changed, shifting the emphasis towards
cheaper products. This resulted in consumer demand shifting from the premium and mid-price segments
to the mass market and low-price segments. Russian-made products and private labels became very
popular thanks to being priced lower than similar foreign or branded goods. Online stores become an
increasingly popular sales channel, offering both a wide range of products and good prices, as well as
opportunities for evaluation, selection and consultations. At the same time, the children's goods market is
the most resilient to crises (along with FMCG) and showed growth after both the crisis of 2008-2009 and
the crisis of 2014-2015.
Detsky mir Group expands its presence most actively in the Moscow region (with 40 new stores opened
in 2016) and in St. Petersburg. As of the end of 2016, the chain had a total of 147 stores in the Moscow
region and 33 stores in St. Petersburg.
The share of Detsky mir in the Russian market of children's goods in terms of revenue in 2016 was 17%
(13% in 2015) overall and 6% in the online channel (3% in 2015). Detsky mir Group is the undisputed
leader among specialised children's goods retailers, having three times the market share of the closest
competitor.
Business development in 2016
The Detsky mir Group opened 100 new Detsky Mir stores and one new ELC store in 2016, bringing the
total number of outlets to 525 as of December 31, 2016.
Further centralisation of supply via Detsky mir’s own warehouse in the village of Bekasovo (the Moscow
region) was another key business development projects during the year. Having own warehouse allowed
the company to reduce logistics costs, increase centralisation of supplies, improve stock management and,
ultimately, increase turnover.
The online store of Detsky mir (http://www.detmir.ru) became the largest specialised player in the online
market of children's goods in 2016. Over the past few years, the online store has demonstrated an
unprecedented growth in sales. Its revenue grew more than 2-fold in 2016 thanks to an improvement in
services and expanded product mix. The share of the online store in revenue was 2.1% in 2015 and grew
to 3.5% by the end of 2016.
Business development strategy
Detsky mir intends to continue the rapid development of the chain in Russia and Kazakhstan due to the
increase in the number of stores in the Moscow region, St. Petersburg and cities with 50,000+ population
and a high potential for business growth.
Detsky mir strives to continue using a flexible model of logistics distribution combining (1) a centralised
platform based on two distribution centres in the Moscow region (Bekasovo and Krekshino) and (2) direct
distribution of products to stores by suppliers.
To support the development of the chain in the Urals and Siberia, the management team of Detsky mir
made a provisional decision to open a new distribution centre in the Urals with approximately 60,000
square metres of warehouse space in 2018. The final decision regarding whether to own or lease the
warehouse will be taken in mid-2017.

22
Factors Affecting RTI Results of Operations
RTI is a major holding company that operates in the defence, microelectronics, comprehensive
communication and security systems segments, and a leading integrator of high-tech R&D and
manufacturing companies. RTI's production facilities have their own R&D infrastructure and implement
projects in radio and space technologies, security and microelectronics that are unique in terms of their
scale and complexity. RTI Group comprises the assets of RTI Systems Concern (defence and security
systems) and NIIME and Mikron (microelectronics).
Industry
One of the main trends in the defence markets is optimisation of state budgets, including state defence
contracts in Russia; however, RTI's key segment (Radars) was less affected by this trend due to its high
priority for the national defence. The preparation of the National Arms Programme through 2025 is under
way. In 2016, the technological focus was on improving high-precision weapons systems and increasing
effectiveness of decision support information systems. The company continued to aim at import
independence of the entire production chain, including components and firmware.
In the area of defence solutions, the work for the National Arms Programme through 2025 will be
continued, for which purpose RTI Group has prepared a number of new initiatives in accordance with the
latest global trends in the field of defence and security.
The demand for microelectronics for the Internet of Things is growing in the global market, which creates
opportunities for increasing the sales of chips, diodes and sensors produced by the Group. A continuing
shift from architecture of systems and services to cloud and distributed solutions creates an additional
demand for telecommunication microchips, solid-state memory and microprocessors suitable for the
processing of big data.
Mikron remains the undisputed market leader in terms of sales and technological level. With the only
functioning production facility at the level of 180-90 nm in Russia, Mikron provides more than 30% of all
supplies of Russian microelectronics manufacturers. The importance of own component base for Russia's
technological independence and cybersecurity strengthens Mikron's position in the public sector and
expands opportunities in the formation of protected markets and PPPs for developing next-generation
microchips for the energy sector, healthcare and distributed computing systems.
The Russian market of microelectronics in 2017 will be characterised by continuation of the programmes
aimed at independence of critically important types of equipment from imports. In addition, it is expected
that the demand will grow for RFID products in various industries (consumer and business solutions),
public sector employees will be shifted to Mir cards, and the introduction of electronic identification
documents will be under way. The Russian market of microelectronics is expected to grow by 9-10% to
RUB 136bn.
Sustainable growth of RTI and key events in 2016
In 2016, the defence business of RTI was focused on the state defence contracts most of which were for
radars.
As part of the creation of a continuous radar field for the missile warning system, RTI Group companies
have completed testing of three new prefabricated radar stations in Orsk, Barnaul and Yeniseysk, and also
commissioned prefabricated radar stations in Irkutsk and Kaliningrad. Also, one of the key tasks of the
defence division for 2017-2018 is the expansion of international military-technical cooperation. RTI is
planning to monetise on foreign markets its competences and in-house solutions on the basis of existing
technologies in the field of mobile radars and radar stations for all environments, systems, and control and
decision-making support tools.

23
In the domestic market, the key event of 2016 for Mikron was the approval of a plan for guaranteed
purchases of Russian civilian microelectronic products in the medium term. In accordance with this plan,
Mikron intends to increase production volumes for such sectors as transport, telecommunications,
payment systems, electronic documents, logistics and trade.
The main mass-delivered microchips of Mikron were granted the status of 1st category microcircuits,
which opens up opportunities for using preferences in state and municipal purchases.
Mikron began supplying chips for third-generation navigation satellites Glonass-K.
Thanks to projects for new markets, Mikron increased the production of microcontrollers for
identification and RFID applications in 2016.
Mikron's main achievement in the area of bank cards was the development and production of a
completely Russian-made microchip with proprietary operating system for the national bank cards Mir.
Mikron produced more than 600,000 integrated circuits in 2016 as part of the Mir project. In 2017, the
company plans to reach the level of 15 million microchips for bank cards. Mikron managed to establish
close cooperation with MTS Bank, KS Bank and a number of other financial institutions.
Mikron identified the Internet of Things as a new promising market where RFID chips will be used as
part of Sensor Fusion technologies. The company started research and development of chips for semi-
active tags with an interface to sensors and optical components. This is an emerging market where
Mikron is able to play a key role. The target segments of the IoT market are energy sector, healthcare and
manufacturing. As part of the pilot project of the Eurasian Economic Union to create a unified system for
labelling with identification marks, Mikron supplied a batch of 4 million RFID tags for the labelling of
fur products.
Strategy
The strategy of the defence solutions segment is aimed at growing the business through entering
promising innovative segments of government contracts, developing and modernising the core product
range, developing schools of thought and the research and education system.
In 2017, in the segment of defence industry, RTI will continue to work within the approved National
Arms Programme through 2020, increasing the share of own production. The main objectives include:
Presence in the most attractive market segments: state defence orders / microelectronics.
Leadership in market segments.
Preservation of scale and development of radar business:
Use expertise accumulated when performing defence jobs to create civilian & export products.
Develop solutions in Big Data processing, simulations, and forecasting.
Develop a line of on-board equipment: onboard radar complexes and broadband communication
systems.
Start serving civilian customers to boost capacity utilisation (pumps, compressors and prefab
agricultural systems).
Improve operating efficiency:
Shift to project-based company structure
Develop a single capacity utilisation management system
Automate production and business processes
The strategy of the microelectronic solutions segment aims at integrating the development and production
of microelectronic components into processes to supply ready-to-use sensor equipment and provide

24
technical support. The key objective is to ensure technological parity of Russian microelectronic solutions
for the defence, space and nuclear industries.
The following factors will determine the growth of business in the segment of microelectronics:
Adding new products to the Plan of Guaranteed Procurement, increasing the volume of
production of microchips for payment cards, and implementing new projects.
Import substitution will allow the company to increase its market share by selling products that
are Russian-made analogues.
Tougher control by the state over the trade in Russia.
Introduction of electronic identification documents.
Fast-growing market of LED products.
Development of information systems for transport monitoring based on radio frequency
identification.
Development of automation and the Internet of Things
Acquisitions
Acquisitions of businesses from third parties are accounted for using the purchase method. Upon acquisition,
the assets and liabilities of an acquired entity are measured at their fair value as at the date of acquisition.
The information on business combinations which took place in 2016 is summarized below (in millions
RUB):
Principal Date of Interest Acquiring Purchase
Acquiree activity acquisition acquired segment price
Lesosibirsk LDK No. 1 Pulp and paper
February
60%
Segezha Group
3,085
Agriculture businesses Agriculture
April-
October
99%-100%
Steppe 7,909
Regional Hotel Chain Hotel businesses
December
100%
Intourist
2,786
Other
810
Total 14,590
In addition, in the years ended 31 December 2016 and 2015, we spent RUB 26.8 billion and RUB 3.5 billion
on acquisitions of non-controlling stakes in existing subsidiaries (the purchase price comprised RUB 6.1
billion, the rest of the amount was paid in 2016).
Discontinued operations
Disposal of Targin – In December 2016, the Group and PJSC Rosneft closed the transaction on the sale
of 100% shares of Targin. The selling price amounted to RUB 4.1 bln with the possibility to be revised
following the completion of a due diligence. The Group is not aware of any facts or circumstances
leading to the price deduction.
Disposal of UMS – In August 2016, the Group sold its 50.01% stake in UMS (Universal Mobile
Systems) for USD 1 to the State Unitary Enterprise Centre of Radio Communication, Radio Broadcasting

25
and Television of Ministry of Development of Information Technologies and Communications of the
Republic of Uzbekistan.
Capital transactions in the year ended December 31, 2016
Acquisition of 15% in RTI – In December 2016, the Group purchased from VTB 15.32% of RTI share
capital for a cash consideration of RUB 4.5 billion with a final settlement due in January 2019 including
restructuring an option in respect of 2.91% for cash consideration of RUB 0.9 billion. The current Group's
ownership interest in RTI is 87%.
Disposal of 3.35% in MTS – In 2016 in a series of transactions the Group sold 33,911,737 American
Depositary Shares of MTS to a non-affiliated buyer for a consideration of USD 279.3 million (RUB 17.7
billion). As of 31 December 2016, the remaining Group ownership interest in MTS was 50.03%.
Additional share issues of Mikron – In February and December 2016, the Group participated in an
additional share issues of PJSC Mikron (subsidiary of RTI) for RUB 3.4 billion.
Additional share issues of MTS Bank – In February 2016 and November 2016, the Group participated in
additional share issues of MTS Bank for RUB 15.5 billion.
Restructuring of Steppe – In October 2016, the Group sold 11.9% of Steppe in exchange for a minority
stakes in Steppe’s subsidiaries and cash consideration of RUB 0.5 billion with a final settlement due in
October 2019.
Restructuring of Sitronics – In October 2016, the Group purchased 26% of Sitronics CAMS (subsidiary
of Sitronics) in an exchange of assets. In May 2016, Sistema Finance S.A. performed intragroup
acquisition from Sitronics 100% of SITRONICS IT BV for cash consideration of RUB 5.7 billion.
Disposal of 10% and 3% in RTI – In April 2016, the Group sold 10% of RTI share capital to PJSC
Sovcombank for a total cash consideration of RUB 1 billion. In March 2016, the Group also exchanged
3% in RTI for 1.5% in JSC Concern RTI Systems (subsidiary of RTI).
Acquisition of 39% in Lesosibirsk LDK No. 1 – In April 2016, in a series of transactions the Group
acquired an additional stake in Lesosibirsk LDK No. 1 for a total cash consideration of RUB 2 billion and
increased its stake from 60% to 99%.
SSTL – As of 31 December 2015 the Russian Government, represented by the Federal Agency for State
Property Management ("Rosimushchestvo"), had a put option to sell 17.14% stake in SSTL to Sistema for
the higher of USD 777 million or market value as of 26 March 2016 determined by an independent
valuator. In June 2016, the Group has signed an agreement with the Russian Government, represented by
Rosimushchestvo, whereby the Group acquired 17.14% of the shares of SSTL for USD 777 million (RUB
47,130 million as of 31 December 2016). The liability is due to be repaid in instalments in 2016-2020.
Ownership rights for the shares will be transferred to the Group in proportion to the repaid liability
balance subject to certain conditions. As of 31 December 2016 the beneficial ownership of SSTL has not
changed and the Group repaid part of the liability amounting to RUB 15,718 million in 2016. The Group
presented the current / non-current portions of the liability in separate lines in the consolidated statement
of financial position as of 31 December 2016.
Mikron – In October 2016, the Group has signed an agreement with RUSNANO on restructuring an
option agreement with respect to 20.42% of shares of Mikron for RUB 8,100 million. The liability will be
repaid in instalments in 2016-2017. Ownership rights for the shares will be transferred to the Group in
2017. The Group presented the outstanding liability of RUB 3,300 million in other financial liabilities in
the consolidated statement of financial position as of 31 December 2016.

26
Capital transactions in the year ended December 31, 2015
Sale of 23.1% in Detsky mir – In December 2015, the Group sold 23.1% of Detsky mir to the Russia-China
Investment Fund (“RCIF”) for a total consideration of RUB 9.75 billion. The remaining Group’s ownership
interest in Detsky mir is 75.8%. The Group granted the buyer an option to put its stake in Detsky mir to the
Group at fair value in case of the non-occurrence of prescribed future events. The Group concluded that this
puttable instrument should be classified as equity instrument rather than a financial liability because the
occurrence of these events is considered under the control of the Group.
Acquisition of 25.02% Medsi – In October 2015, the Group acquired additional 25.02% stake in Medsi
for RUB 6.1 billion and increased its stake to 100%.
Intragroup transfer of NVision Group to MTS – During 2015, in a series of transactions, the Group’s
subsidiaries Sistema Telecoms Assets and RTI sold 100% stake in NVision Group to MTS.
Intragroup transfer of Rent-Nedvizhimost – During 2015, in a series of transactions, MTS sold 100%
stake in Rent-Nedvizhimost to Business-Nedvizhimost, another subsidiary of Sistema.
Consolidated Financial Results Overview
The following table sets forth a summary of our financial results for the years ended 31 December 2016
and 2015. This financial information should be read in conjunction with our Financial Statements.
Years ended December 31,
2016 % of
revenues
2015 % of
revenues
(Amounts in millions of Russian Rubles, except percentages)
Revenue 697,705
100.0%
678,821
100.0%
TOTAL REVENUES 697,705
100.0%
678,821
100.0%
Cost of sales (349,741)
(50.1)%
(352,670)
(52.0)%
Selling,general and administrative
expenses (157,003)
(22.5)%
(148,232)
(21.8)%
Depreciation and amortisation (96,710)
(13.9)%
(88,670)
(13.1)%
Impairment of long-lived assets (2,896)
(0.4)%
(11,941)
(1.8)%
Impairment of financial assets (11,400)
(1.6)%
(7,220)
(1.1)%
Taxes other than income tax (5,574)
(0.8)%
(4,000)
(0.6)%
Share of the profit or loss of associates
and joint ventures, net 3,147
0.5%
4,377
0.6%
Gain on acquisitions 1,169
0.2%
-
-
Other income 6,840
1.0%
1,918
0.3%
Other expences (5,693)
(0.8)%
(3,995)
(0.6)%

27
OPERATING INCOME 79,844
11.4%
68,388
10.1%
Finance income 9,853
1.4%
18,451
2.7%
Finance expense (56,251)
(8.1)%
(50,496)
(7.4)%
Currency exchange gain/(loss) 6,055
0.9%
(16,249)
(2.4)%
Profit before tax 39,501
5.7%
20,094
3.0%
Income tax expense (21,575)
(3.1)%
(18,251)
(2.7)%
Profit from continuing operations 17,926
2.6%
1,843
0.3%
(Loss)/profit from discontinued
operations (8,767)
(1.3)%
44,531
6.6%
PROFIT FOR THE PERIOD 9,159
1.3%
46,374
6.8%
(Loss)/profit attributable to:
Shareholders of Sistema PJSFC (11,758)
28,800
Non-controlling interests 20,917
3.0%
17,574
2.6%
9,159
1.3%
46,374
6.8%
OIBDA 176,554
25.3%
157,058
23.1%
(1) OIBDA represents operating income before depreciation and amortisation. OIBDA is not a measure of financial performance under IFRS.
You should not consider it an alternative to net income as a measure of operating performance or to cash flows from operating activities as a measure of liquidity. Our calculation of OIBDA may be different from the calculation used by other companies and therefore comparability may be
limited. We believe that OIBDA provides useful information to investors because it is an indicator of the strength and performance of our ongoing
business operations, including our ability to fund discretionary spending such as capital expenditures, acquisitions of subsidiaries and other investments and our ability to incur and services debt. While depreciation and amortisation are considered operating costs under IFRS, these expenses
primarily represent non-cash current period allocation of costs associated with long-lived assets acquired or constructed in prior periods.
The following table presents a reconciliation of OIBDA to operating income for the periods indicated:
For the year ended 31 December
2016 2015
(In millions of Russian Rubles)
Operating income 79,844 68,388
Depreciation and amortisation (96,710) (88,670) OIBDA 176,554 157,058
In our comparison of period-to-period results of operations we analyze changes, developments and trends
in revenues by reference to individual segment revenues. We present our revenues on an aggregated basis
after elimination of intra-segment (between entities in the same segment) transactions, but before
intersegment (between entities in different segments) eliminations. Amounts attributable to individual
companies, where appropriate, are shown prior to both intra-segment and inter-segment eliminations.

28
The following tables set forth a summary of revenues and operating income by reportable segment for the
years ended 31 December 2016 and 2015.
Revenues by segment:
Year ended 31 December
2016 % of total
revenues 2015
% of total
revenues
(In millions of Russian Rubles, except percentages)
MTS 435,692
62.4%
426,639
62.9%
Detsky mir 79,547 11.4% 60,544 8.9%
RTI 44,589
6.4%
77,287
11.4%
MTS Bank 20,233
2.9%
25,619
3.8%
SSTL 12,466
1.8%
13,965
2.1%
Corporate 2,852
0.4%
3,417
0.5%
Other 110,190
15.8%
86,851
12.8%
Aggregated revenue 705,569
101.1%
694,322
102.3%
Intersegment eliminations (7,864)
(1.1%)
(15,501)
(2.3%)
Total 697,705
100.0%
678,821
100.0%

29
Operating income/(loss) by segments:
Year ended 31 December
2016
2015
% of total
operating
income
% of total
operating
income
(In millions of Russian Rubles, except percentages)
MTS 86,227
108.0%
91,708
134.1%
Detsky mir 6,620 8.3% 3,805 5.6%
RTI 275
0.3%
4,548
6.6%
MTS Bank (3,282)
(4.1%)
(17,658)
(25.8%)
SSTL (2,347)
(2.9%)
(3,227)
(4.7%)
Corporate (24,042)
(30.1%)
(14,392)
(21.0%)
Other 16,274
20.4%
(272)
(0.4%)
Aggregated operating income 79,725
99.9%
64,512
94.3%
Intersegment eliminations 119
0.1%
3,876
5.7%
Total 79,844
100.0%
68,388
100.0%
Explanation of Key Items in Statements of Operations
Revenues
Our sales are derived mainly from the revenues generated by MTS, Detsky mir and RTI. In 2016 and 2015,
before intersegment eliminations, revenues of MTS accounted for 62.4% and 62.9%, revenues of Detsky Mir
accounted for 11.4% and 8.9% and RTI – 6.4% and 11.4%, respectively, of our consolidated sales.
Cost of sales
Our cost of sales is primarily incurred at MTS, Detsky mir and RTI. In 2016 and 2015, cost of sales at
MTS, Detsky mir and RTI accounted for 73.6% and 74%, respectively, of our cost of sales.
Cost of sales at MTS, Detsky mir and RTI are those costs that are incurred directly in the sale and
production of MTS’, Detsky mir’ and RTI’s principal products and services. For MTS, they mainly
consist of cost of services, such as interconnect and line rental charges and roaming expenses, and the
cost of handsets and accessories. For Detsky mir they consist of cost of goods. For RTI, they mainly
consist of the cost of subcontract works, goods, raw materials, equipment and certain other operating
expenses.
Cost of sales also includes a share of rental expenses under operating leases.
Selling, general and administrative expenses
Selling, general and administrative expenses are primarily incurred at MTS, Detsky mir and Corporate. In
2016 and 2015, selling, general and administrative expenses at MTS accounted for 57.5% and 58%,

30
respectively, of our overall selling, general and administrative expenses. Detsky mir accounted for 12%
and 11.3% of our overall selling, general and administrative expenses in 2016 and 2015, respectively,
Our selling, general and administrative expenses consist of marketing, advertising costs, rent and utility,
employee salaries and bonuses, social contributions payable to state funds.
Selling, general and administrative expenses also include a share of rental expenses under operating lease
agreements.
Depreciation and amortisation
Most of our depreciation and amortisation expenses are incurred at MTS.
In 2016 and 2015, depreciation and amortisation at MTS accounted for 84% and 86%, respectively, of our
overall depreciation and amortisation expenses.
Depreciation and amortisation expenses primarily consist of expenses related to the depreciation of
property, plant and equipment and the amortisation of intangible assets.
Operating income
Operating income is revenues less operating costs, plus share of the profit or loss of associates and joint
ventures, gain on acquisition and other expenses or income.
Finance expense
Interest expenses consist primarily of interest expense on loans and borrowings net of amounts capitalized.
Currency transaction profit/(losses)
Management has determined that the functional currency of most of our subsidiaries are the currencies of
the countries of their domicile.
Foreign currency transaction gains/losses result from a change in exchange rates between the functional
currency and the currency in which foreign currency transactions are denominated.
Income tax expense
Income tax expense comprises current and deferred income tax. During the periods under discussion, the
corporate income tax rate in the Russian Federation was 20% and the income tax rate on dividends paid
within Russia was 13% or 0% subject to meeting certain conditions. Our foreign subsidiaries pay income
tax in their respective jurisdictions. The income tax rate in Ukraine was 18% during the reporting period.
Deferred income tax reflects the tax effect of all significant differences between the tax bases of assets
and liabilities and their amounts reported in the Financial Statements. Deferred tax assets and liabilities
are measured using the enacted tax rates applicable in the periods when the differences are expected to
affect taxable income. See Note 13 of our Financial Statemens.
Year Ended 31 December 2016 Compared to the Year Ended 31 December 2015
Revenues
In 2016, the Group’s revenues increased by 2.8% due to Detsky mir’s continued expansion in the Russian
market, acquisitions and organic growth in the agricultural sector, the consolidation of Kronshtadt and
strong results at Segezha Group.

31
Strong like-for-like9 growth and network expansion at Detsky mir contributed to the Group’s revenue
growth of RUB 19 billion; increase at agro business and consolidation of Kronstadt amounted RUB 10.2
billion; Segezha revenue growth was RUB 9.6 billion.
MTS is our largest revenue contributor. In the years ended 31 December 2016 and 2015, MTS share of
our consolidated revenues amounted to 62.4% and 62.9%, respectively. MTS remains Russia’s leading
mobile operator, growing revenue 2.1% in 2016 and 0.2% year-on-year in the fourth quarter 2016. Higher
data usage and handset sales offset weaker roaming usage and lower contributions from subsidiaries
outside Russia. An increase in internet traffic was driven by higher subscriber numbers for the “Smart”
voice and data (V&D) tariff in Russia and deployment of a 3G network in Ukraine.
In 2016, MTS’s total subscriber base increased by 3.1 million customers, 2.8 million of them in Russia.
MTS’s customer base is notable for its active internet users and high smartphone penetration. MTS
continues to successfully develop home internet and pay TV services in Russia.
Cost of sales
Cost of sales reduced by RUB 2,929 million, or 1%, from RUB 352,670 million in the year ended 31
December 2015 to RUB 349,741 million in the year ended 31 December 2016. The decline in cost was
due mainly to a reduction in provision charges and continued improvements in asset quality at MTS Bank,
which comprised RUB 15,725 million.
Selling, general and administrative expenses
In 2016, selling, general and administrative expenses (SG&A) grew by 5.9% to RUB 157,003 million
year-on-year, generally in line with the inflation rate in Russia over the same period, despite organic
growth at MTS and Detsky Mir and an acquisitions by Segezha Group and Steppe driving SG&A higher.
Depreciation and amortisation
Depreciation and amortisation expenses increased by RUB 8,040 million or 9.1% from RUB 88,670
million in the year ended 31 December 2015, to RUB 96,710 million in the year ended 31 December
2016 mainly as a result of growth in depreciable assets base as well as acquisitions made in the second
half of 2015 and in 2016.
Impairment of long-lived assets
Impairment of long-lived assets decreased by RUB 9,045 million, or four times, from RUB 11,941
million in the year ended 31 December 2015 to RUB 2,896 million in the year ended 31 December 2016.
In the year ended 31 December 2015, we recorded an impairment loss mainly in connection with an
impairment of goodwill of Kronstadt and MTS-Armenia. As of 31 December 2016, the impairment of
long-lived assets is mainly attributable to RTI assets. See also Note 11 of the Financial Statements.
Impairment of financial assets
Impairment of financial assets includes allowance for doubtful accounts, impairment of cash and deposits
in banks, impairment of available for sale securities and impairment of loans carried at amortised cost.
The increase in impairment of financial assets was RUB 4,180 million or 57.9% in 2016 as compared to
2015. The increase was caused mainly by recognition of the impairment of loans carried at amortised
cost. See also Note 12 of the Financial Statements.
Share of the profit or loss of associates and joint ventures, net
9 Like-for-like revenue growth based on the stores that have been in operations for at least 12 full calendar months

32
In the year ended 31 December 2016, we recorded a gain of RUB 3,147 million in our equity in the
results of affiliates. MTS-Belarus was the main contributor to the total equity income in results of
affiliates.
Gain on acquisitions
In the year ended 31 December 2016, we recorded a gain of RUB 1,169 million upon acquisitions in our
agricultural holding.
Operating income
For the reasons set forth above, our operating income increased by RUB 11,456 million, or 16.8%, from
RUB
68,388 million in the year ended 31 December 2015 to RUB 79,844 million in the year ended 31
December 2016.
Our consolidated operating income margin equaled 10% for the year ended 31 December 2015 and 11.4%
for the year ended 31 December 2016. In both years, MTS was the main contributor to our operating
income.
Finance income
Finance income reduced by RUB 8,598 million, or 46.6%, from RUB 18,451 million in the year ended
31 December 2015 to RUB 9,853 million in the year ended 31 December 2016 mainly due to the decline
in bank deposits in 2016.
Finance costs
Finance costs increased by RUB 5,755 million or 11.4%, from RUB 50,496 million in the year ended
31 December 2015 to RUB 56,251 million in the year ended 31 December 2016. The growth of our
finance expenses mainly resulted from the increase in our financial liabilities at the end of 2015.
Currency exchange gains/loss
In the year ended 31 December 2016, we recorded a foreign currency transaction gain of RUB 6,055
million, which was mainly due to the appreciation of the ruble against the U.S. dollar in 2016. The loss in
2015 is mostly attributable to indebtedness denominated in foreign currencies.
Profit/(loss) before income tax
For the reasons set forth above, profit before tax increased by RUB 19,407 million, from of RUB 20,094
million in the year ended 31 December 2015 to profit of RUB 39,501 million in the year ended 31
December 2016.
Income tax expense
Income tax expense increased by RUB 3,324 million, or 18.2%, from RUB 18,251 million in the year
ended 31 December 2015 to RUB 21,575 million in the year ended 31 December 2016.
The following table sets forth our income tax expense for the years ended 31 December 2016 and 2015:
For the year ended 31 December
2016
% of total
income tax
expense 2015
% of total
income tax
expense
(In millions of Russian Rubles, except percentages)
Current provision 23,360 108.3% 19,739 108.1%
Deferred income tax expense /(benefit) (1,785) (8.3%) (1,488) (8.1%)
Total income tax expense 21,575 100% 18,251 100%

33
Profit/(loss) from continuing operations
For the reasons set forth above, our profit from continuing operations increased by RUB 16,083 million,
from RUB 1,843 million in the year ended 31 December 2015 to RUB 17,926 million in the year ended
31 December 2016.
Profit/(loss) from discontinued operations
Amounts recorded in profit/(loss) from discontinued operations include results of Targin and UMS
(Universal Mobile Systems) and effects of their deconsolidation in 2016, as well as the gain from
settlements with Ural-Invest in 2015. In the year ended 31 December 2016, we recorded a loss of RUB
8,767 million, while in the year ended 31 December 2015, we recorded a gain of RUB 44,531 million,
which included loss of RUB 4,498 million as a result of deconsolidation Targin and UMS, and gain of
RUB 49,029 million from settlements with Ural-Invest. See Note 8 of the Financial Statements.
Profit/(loss) for the year
For the reasons set forth above, net income declined by RUB 37,215 million, from gain of RUB 46,374
million in the year ended 31 December 2015 to income RUB 9,159 million in the year ended 31
December 2016.
Non-controlling interest and net income attributable to PJSFC Sistema
Profit attributable to non-controlling interests equaled RUB 17,574 million in the year ended 31
December 2015 and RUB 20,917 million in the year ended 31 December 2016. The increase of profit
attributable to non-controlling shareholders of our subsidiaries was driven by subsidiaries’ operating
results and sale of minority stakes in MTS.
For the reasons set forth above, profit/(loss) attributable to PJSFC Sistema decreased by RUB 40,558
million from net gain of RUB 28,800 million in the year ended 31 December 2015 to net loss of RUB
11,758 million in the year ended 31 December 2016.
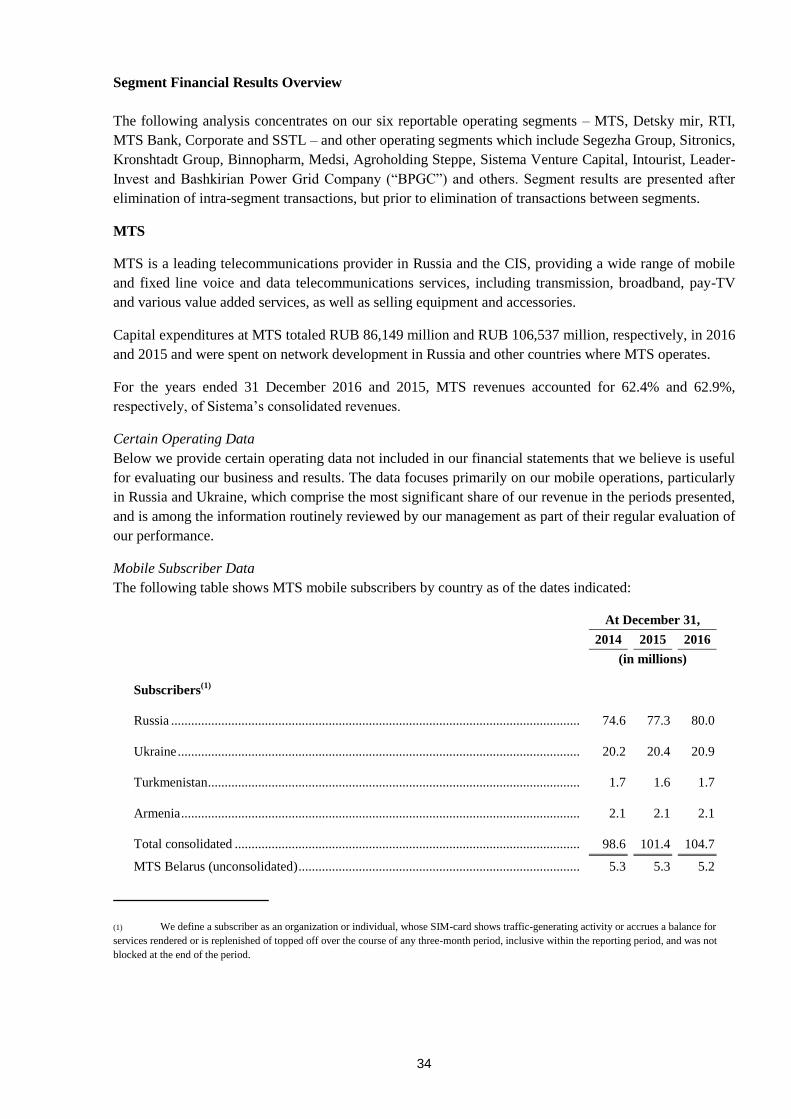
34
Segment Financial Results Overview
The following analysis concentrates on our six reportable operating segments – MTS, Detsky mir, RTI,
MTS Bank, Corporate and SSTL – and other operating segments which include Segezha Group, Sitronics,
Kronshtadt Group, Binnopharm, Medsi, Agroholding Steppe, Sistema Venture Capital, Intourist, Leader-
Invest and Bashkirian Power Grid Company (“BPGC”) and others. Segment results are presented after
elimination of intra-segment transactions, but prior to elimination of transactions between segments.
MTS
MTS is a leading telecommunications provider in Russia and the CIS, providing a wide range of mobile
and fixed line voice and data telecommunications services, including transmission, broadband, pay-TV
and various value added services, as well as selling equipment and accessories.
Capital expenditures at MTS totaled RUB 86,149 million and RUB 106,537 million, respectively, in 2016
and 2015 and were spent on network development in Russia and other countries where MTS operates.
For the years ended 31 December 2016 and 2015, MTS revenues accounted for 62.4% and 62.9%,
respectively, of Sistema’s consolidated revenues.
Certain Operating Data
Below we provide certain operating data not included in our financial statements that we believe is useful
for evaluating our business and results. The data focuses primarily on our mobile operations, particularly
in Russia and Ukraine, which comprise the most significant share of our revenue in the periods presented,
and is among the information routinely reviewed by our management as part of their regular evaluation of
our performance.
Mobile Subscriber Data
The following table shows MTS mobile subscribers by country as of the dates indicated:
At December 31,
2014 2015 2016
(in millions)
Subscribers(1)
Russia .......................................................................................................................... 74.6 77.3 80.0
Ukraine ........................................................................................................................ 20.2 20.4 20.9
Turkmenistan ............................................................................................................... 1.7 1.6 1.7
Armenia ....................................................................................................................... 2.1 2.1 2.1
Total consolidated ....................................................................................................... 98.6 101.4 104.7
MTS Belarus (unconsolidated) .................................................................................... 5.3 5.3 5.2
(1) We define a subscriber as an organization or individual, whose SIM-card shows traffic-generating activity or accrues a balance for
services rendered or is replenished of topped off over the course of any three-month period, inclusive within the reporting period, and was not
blocked at the end of the period.
35
Mobile churn
We define churn as the total number of subscribers who cease to be a subscriber during the period
(whether involuntarily due to non-payment or voluntarily), expressed as a percentage of the average
number of our subscribers during that period.
A vast majority of our subscribers are prepaid subscribers with no contractual commitment to us. As a
result, these subscribers have unfettered freedom to migrate between operators at their convenience. This
freedom, combined with the relative ease with which subscribers can obtain SIM cards, contributes to
churn and increasing penetration levels in the markets where we operate.
The churn rate is highly dependent on competition in our license areas and those subscribers who migrate
as a result of such competition. Our churn rate in Russia slightly decreased to 39.0% during the year
ended December 31, 2016, as compared to 39.6% for the year ended December 31, 2015, due to growth
in the number of new connections. We continued to offer our popular tariff plans ‘‘Super MTS’’ (free
calls to all subscribers of MTS Russia) and ‘‘Smart’’ (integrated voice and data bundles), updated options
for unlimited mobile Internet, further improved network quality and enhanced data rate through the
expansion of our 3G and LTE capabilities. We expect that the extension of the MTS-Bonus loyalty
program and further development of our mono-brand retail network will allow us to keep churn rate under
control in 2017, stimulate data usage and promote subscriber loyalty through superior customer service.
The churn rate in Ukraine slightly increased to 25.0% for the year ended December 31, 2016, from 24.5%
for the year ended December 31, 2015. In 2017, we expect subscriber loyalty to grow due to the launch of
3G-enabled data services with the support of our brand partnership with Vodafone.
Trend Information
Average monthly service revenue per subscriber in Russia remained relatively stable and amounted to
RUB 312.9 for the year ended December 31, 2016 as compared to 325.7 for the year ended December 31,
2015. Average monthly minutes of use per subscriber in Russia remained stable and amounted to 380
minutes in 2016 as compared to 381 minutes in 2015. We expect average monthly service revenue per
subscriber in Russia to remain stable in 2017 as we plan to decrease prices and stimulate growth in usage
of data services. We also believe that average monthly minutes of use per subscriber will remain stable
with an increase in megabytes of use per subscriber due to our efforts aimed at stimulating data usage and
on-net traffic.
In Ukraine, our subscriber base increased to approximately 20.9 million subscribers as of December 31,
2016, from 20.4 million subscribers as of December 31, 2015. The launch of 3G services under the
Vodafone brand in Ukraine was the most significant event in 2015. During 2016, company expanded
actively its network and now a high-speed mobile internet is available for more than 54% of Ukrainians.
In 2017, we expect revenues to remain stable under the impact of the weaker macroeconomic
environment.
Our subscriber base in Armenia remained stable and amounted to 2.1 million subscribers in 2016. The
average monthly service revenue per subscriber in Armenia decreased to 2,189 dram (RUB 305) from
2,706 dram (RUB 343). We expect the average monthly service revenue per subscriber in Armenia to
decline mainly due to the growth of competition in these markets which may, in turn, lead to decreasing
tariffs, the addition of lower-value mass market subscribers and macroeconomic trends calling for ‘‘save
mode’’.
Our primary operating license in Turkmenistan was resumed, and all of our operations in the country fully
recommenced since October 1, 2012. Our subscriber base in Turkmenistan remained stable last 5 years
and slightly increased to 1.7 million subscribers as of December 31, 2016 from 1.6 million subscribers as
of December 31, 2015. We expect our subscriber base and revenues to remain stable in 2017.
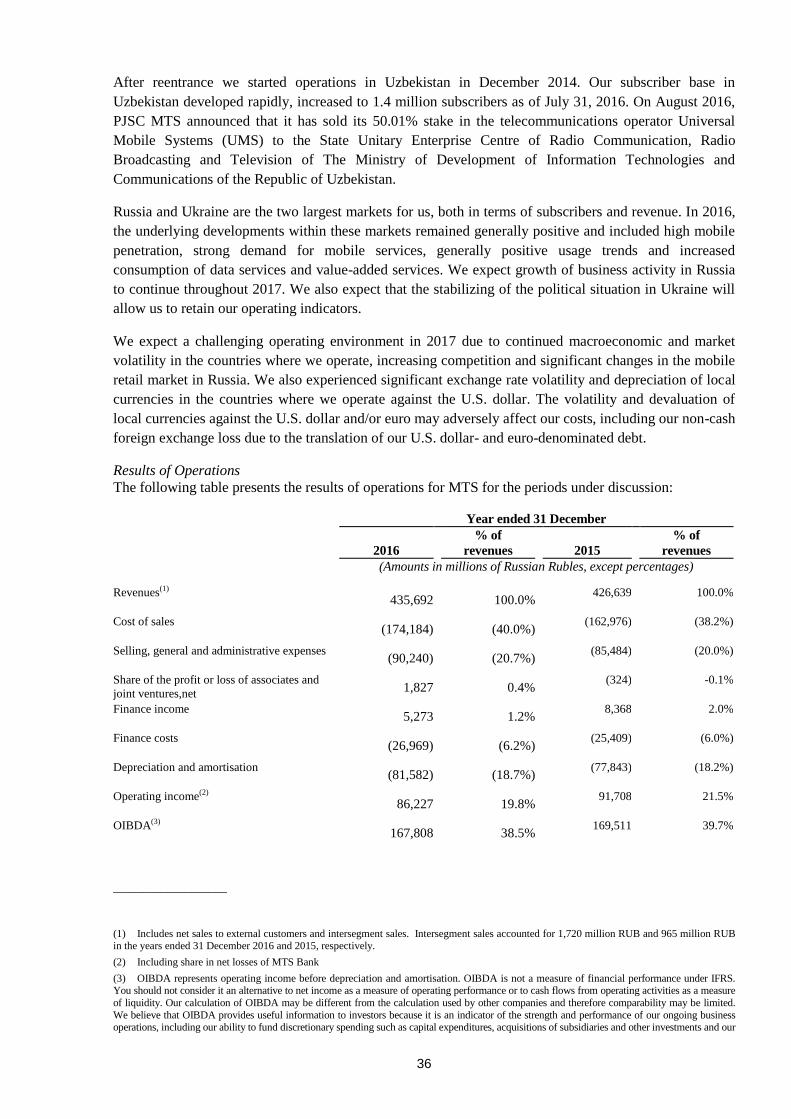
36
After reentrance we started operations in Uzbekistan in December 2014. Our subscriber base in
Uzbekistan developed rapidly, increased to 1.4 million subscribers as of July 31, 2016. On August 2016,
PJSC MTS announced that it has sold its 50.01% stake in the telecommunications operator Universal
Mobile Systems (UMS) to the State Unitary Enterprise Centre of Radio Communication, Radio
Broadcasting and Television of The Ministry of Development of Information Technologies and
Communications of the Republic of Uzbekistan.
Russia and Ukraine are the two largest markets for us, both in terms of subscribers and revenue. In 2016,
the underlying developments within these markets remained generally positive and included high mobile
penetration, strong demand for mobile services, generally positive usage trends and increased
consumption of data services and value-added services. We expect growth of business activity in Russia
to continue throughout 2017. We also expect that the stabilizing of the political situation in Ukraine will
allow us to retain our operating indicators.
We expect a challenging operating environment in 2017 due to continued macroeconomic and market
volatility in the countries where we operate, increasing competition and significant changes in the mobile
retail market in Russia. We also experienced significant exchange rate volatility and depreciation of local
currencies in the countries where we operate against the U.S. dollar. The volatility and devaluation of
local currencies against the U.S. dollar and/or euro may adversely affect our costs, including our non-cash
foreign exchange loss due to the translation of our U.S. dollar- and euro-denominated debt.
Results of Operations
The following table presents the results of operations for MTS for the periods under discussion:
Year ended 31 December
2016
% of
revenues
2015
% of
revenues
(Amounts in millions of Russian Rubles, except percentages)
Revenues(1)
435,692
100.0%
426,639
100.0%
Cost of sales (174,184)
(40.0%)
(162,976)
(38.2%)
Selling, general and administrative expenses (90,240)
(20.7%)
(85,484)
(20.0%)
Share of the profit or loss of associates and
joint ventures,net 1,827
0.4%
(324) -0.1%
Finance income 5,273
1.2%
8,368
2.0%
Finance costs (26,969)
(6.2%)
(25,409)
(6.0%)
Depreciation and amortisation (81,582)
(18.7%)
(77,843)
(18.2%)
Operating income(2) 86,227
19.8%
91,708
21.5%
OIBDA(3) 167,808
38.5%
169,511
39.7%
___________________
(1) Includes net sales to external customers and intersegment sales. Intersegment sales accounted for 1,720 million RUB and 965 million RUB in the years ended 31 December 2016 and 2015, respectively.
(2) Including share in net losses of MTS Bank
(3) OIBDA represents operating income before depreciation and amortisation. OIBDA is not a measure of financial performance under IFRS. You should not consider it an alternative to net income as a measure of operating performance or to cash flows from operating activities as a measure
of liquidity. Our calculation of OIBDA may be different from the calculation used by other companies and therefore comparability may be limited.
We believe that OIBDA provides useful information to investors because it is an indicator of the strength and performance of our ongoing business operations, including our ability to fund discretionary spending such as capital expenditures, acquisitions of subsidiaries and other investments and our

37
ability to incur and services debt. While depreciation and amortisation are considered operating costs under IFRS, these expenses primarily represent
non-cash current period allocation of costs associated with long-lived assets acquired or constructed in prior periods
The following table presents a reconciliation of OIBDA to operating income for the periods indicated:
For the year ended
2016 2015
(Amounts in millions of Russian Rubles)
Operating income 86,227 91,708
Depreciation and amortisation 81,582 77,843
OIBDA 167,808 169,551
Revenues
Consolidated revenues for the year ended December 31, 2016, increased by RUB 9,053 million, or 2.1%,
to RUB 435,692 million from RUB 426,639 million for the year ended December 31, 2015. The principal
reason for the growth of our consolidated revenues for the year ended December 31, 2016, was the large
increase in the usage of voice and data tariffs by our subscribers (by RUB 4,811 million), which was
mainly attributable to the increase in mobile internet penetration, an increase in usage of smartphones by
our subscribers, active 3G and LTE network expansion and the consequent improvement of the quality
and uptake of value-added services. The increase of our consolidated revenues for the year ended
December 31, 2016 was also supported by the growth in revenues from sales of handsets and accessories
by RUB 5,023 million and by the increase of revenues from sales of software products by RUB 3,718
million. The increase in sales of handsets and accessories by RUB 5,023 million resulted from active
marketing initiatives and continued expansion of our retail operations. The increase in sales of software
products is attributable to the acquisition of NVision group at the end of 2015.
The decrease of our revenues from roaming fees of own subscribers by RUB 5,262 million in the year
ended December 31, 2016 is attributable to promotion of tariff plans with reduced price per minute and
overall decrease of consumption due to adverse changes in macroeconomic situation in Russia and
Ukraine. Our consolidated mobile subscriber base increased and amounted to 104.6 million as of
December 31, 2016 as compared to 101.4 million as of December 31, 2015. The decrease in the mobile
churn rate in Russia to 39.0% from 39.6% in 2015 had an immaterial impact on our consolidated
revenues.
Cost of sales
Overall cost of sales, which includes cost of services and cost of handsets and accessories, exclusive of
depreciation and amortisation, increased by RUB 11,207 million, or 6.9%, from RUB 162,976 million in
the year ended 31 December 2015 to RUB 174,184 million in the year ended 31 December 2016.
Sundry operating expenses
Consolidated sundry operating expenses for the year ended December 31, 2016, decreased by
RUB 7,510 million. We generated income of RUB 3,337 million and expense of RUB 4,173 million for
the year ended December 31, 2016 and 2015, respectively. These amounts comprised (0.8)% and 1.0% as
a percentage of consolidated revenue for the year ended December 31, 2016 and 2015. In the year ended
December 31, 2015 consolidated sundry operating expenses included impairment of goodwill in Armenia
in the amount of RUB 3,516 million and impairment charges related to distressed Ukrainian banks in the
amount of RUB 1,698 million. In the year ended December 31, 2016 consolidated sundry operating
income included compensation from other operators for the transfer of radio frequencies obtained by us
through the auctions in the amount of RUB 848 million (income). The decrease in bad debt provision in
Russia in the year ended December 31, 2016 also contributed to the decrease in consolidated sundry
operating expenses.

38
Selling, general and administrative expenses
Selling, general and administrative expenses at MTS increased by RUB 4,757 million, or 5.6%, from
RUB 85,484 million in the year ended 31 December 2015 to RUB 90,240 million in the year ended 31
December 2016. Salary expenses and related social contributions increased by RUB 4,321 million
amounting to 10.2% of consolidated revenues for the year ended December 31, 2016 compared to 9.4%
of consolidated revenues for the year ended December 31, 2015 due to indexation of salaries and increase
in number of employees. Rent expenses as a percentage of consolidated revenues increased to 2.1% for
the year ended December 31, 2016 compared to 1.6% for the year ended December 31, 2015 mainly due
to expansion of own retail network. Taxes other than income tax as a percentage of consolidated revenues
increased to 0.9% for the year ended December 31, 2016 compared to 0.5% for the year ended
December 31, 2015 mainly due to recognition of a gain from release of provision for custom duties and
VAT in 2015. Dealers commissions as a percentage of consolidated revenues decreased to 1.5% for the
year ended December 31, 2016 compared to 2.1% for the year ended December 31, 2015 mainly due to
expansion of own retail network.
Depreciation and amortisation
Depreciation and amortisation of property, network equipment, numbering capacity, license costs and
other intangible assets increased by RUB 3,739 million, or 4.6%, from RUB 77,843 million in the year
ended 31 December 2015 to RUB 81,582 million in the year ended 31 December 2016 mainly in
connection with ongoing network development and modernization program and the build-out associated
with the regional networks.
Segment operating income
Operating profit of MTS declined by RUB 5,481 million or 6% from RUB 91,708 million in the year ended
December 31, 2015 to RUB 86,227 million in the year December 31, 2016 mainly due to decrease in
operating profit of Moscow fixed line and Ukraine segments.
Currency exchange gain/loss
Consolidated currency exchange and transaction gain for the year ended 31 December 2016, was RUB
3,241 million, compared to the loss of 6,154 million for the year ended 31 December 2015. The gain
recognized in the year ended December, 31 2016 was mainly attributable to the appreciation of the
Russian ruble against U.S. dollar and euro during the year ended 31 December 2016.
Detsky mir
Detsky mir is the largest retail chain in the children’s goods market in the Russian Federation. The
primary activity of the Group is the sale of children’s clothing and goods through retail and internet
stores. In 2016 and as at 31 December 2016 the Group operated Detsky mir branded stores in Russia and
Kazakhstan. For the years ended 31 December 2016 and 2015, Detsky mir’s sales accounted for 11% and
9%, respectively, of consolidated revenues. Capital expenditures at Detsky mir totaled RUB 1,747 million
and RUB 5,308 million, respectively, in 2016 and 2015.
The following table presents the results of operations for Detsky mir for the periods under discussion:

39
Year ended 31 December
2016
% of
revenues
2015
% of
revenues
(Amounts in millions of Russian Rubles, except percentages)
Revenues(1) 79,547 100.0% 60,544 100.0% Cost of sales (51,175) (64.3%) (37,752) (62.4%) Selling, general and administrative expenses (18,857) (23.7%) (16,821) (27.8%) Share of the profit or loss of associates and
joint ventures,net 9 0.0% 9 0.0%
Finance income 170 0.2% 723 1.2% Finance costs (1,938) (2.4%) (2,053) (3.4%) Depreciation and amortisation (1,591) (2.0%) (954) (1.6%) Operating income 6,620 8.3% 3,805 6.3% OIBDA(2) 8,211 10.3% 4,759 7.9%
___________________
(1) Includes net sales to external customers and intersegment sales. Intersegment sales amounted to 15 million and nil in the years ended 31
December 2016 and 2015, respectively.
(2) OIBDA represents operating income before depreciation and amortisation. OIBDA is not a measure of financial performance under IFRS.
You should not consider it an alternative to net income as a measure of operating performance or to cash flows from operating activities as a measure of liquidity. Our calculation of OIBDA may be different from the calculation used by other companies and therefore comparability may
be limited. We believe that OIBDA provides useful information to investors because it is an indicator of the strength and performance of our
ongoing business operations, including our ability to fund discretionary spending such as capital expenditures, acquisitions of subsidiaries and other investments and our ability to incur and services debt. While depreciation and amortisation are considered operating costs under IFRS,
these expenses primarily represent non-cash current period allocation of costs associated with long-lived assets acquired or constructed in prior
periods.
The following table presents a reconciliation of OIBDA to operating income for the periods indicated:
For the year ended
2016 2015
Amounts in millions of Russian Rubles)
Operating income 6,620 3,805
Depreciation and amortisation 1,591 954 OIBDA 8,211 4,759
Revenues
Revenues at Detsky mir increased in the year ended 31 December 2016 by 31.4% and amounted to RUB
79,547 million compared to RUB 60,544 million in the year ended 31 December 2015. Detsky mir’s
stores opened in previous years began to operate at full capacity and continued expansion of the retail
chain. The group opened 100 new Detsky mir stores and one new ELC store in 2016, bringing the total
number of outlets to 525 as of December 31, 2016.
Cost of sales
Cost of sales grew by RUB 13,423 million, or 35.6%, from RUB 37,752 million in the year ended 31
December 2015 to RUB 51,175 million in the year ended 31 December 2016.
Segment operating income
Detsky mir recorded operating income of RUB 6,620 million in the year ended 31 December 2016 and
RUB 3,805 million in the year ended 31 December 2015. The ratio of administrative expenses to
revenues declined from 27.8% in 2015 to 23.7% in 2016 in particular due to further automation of key
business processes. Detsky mir succeeded in significantly lowering rental costs as a percentage of sales
and increased the operational efficiency of its chain of stores.

40
RTI
RTI is a leading Russian technology holding company in the fields of defense, microelectronics and
high-tech R&D. RTI comprises four principal business units (BU): Defense Solutions, Complex Security
Systems and Microelectronic Solutions. For the years ended 31 December 2016 and 2015, RTI’s sales
accounted for 6% and 11%, respectively, of consolidated revenues. Capital expenditures at RTI totaled
RUB 3,955 million and RUB 5,115 million, respectively, in 2016 and 2015.
The following table presents the results of operations for RTI for the periods under discussion:
Year ended 31 December
2016
% of
revenues
2015
% of
revenues
(Amounts in millions of Russian Rubles, except percentages)
Revenues(1) 44,588 100.0% 77,287 100.0% Cost of sales (31,984) (71.7%) (60,346) (78.1%) Selling, general and administrative expenses (7,419) (16.6%) (10,319) (13.4%) Share of the profit or loss of associates and
joint ventures,net 58 0.1% 130 0.2%
Finance income 1,775 4.0% 2,242 2.9% Finance costs (6,026) (13.5%) (5,739) (7.4%) Depreciation and amortisation (2,539) (5.7%) (2,482) (3.2%) Operating income 275 0.6% 4,548 5.9% OIBDA(2) 2,814 6.3% 7,030 9.1%
___________________
(1) Includes net sales to external customers and intersegment sales. Intersegment sales amounted to 156 million and 7,903 million in the
years ended 31 December 2016 and 2015, respectively.
(2) OIBDA represents operating income before depreciation and amortisation. OIBDA is not a measure of financial performance under IFRS.
You should not consider it an alternative to net income as a measure of operating performance or to cash flows from operating activities as a
measure of liquidity. Our calculation of OIBDA may be different from the calculation used by other companies and therefore comparability may be limited. We believe that OIBDA provides useful information to investors because it is an indicator of the strength and performance of our
ongoing business operations, including our ability to fund discretionary spending such as capital expenditures, acquisitions of subsidiaries and
other investments and our ability to incur and services debt. While depreciation and amortisation are considered operating costs under IFRS, these expenses primarily represent non-cash current period allocation of costs associated with long-lived assets acquired or constructed in prior
periods.
The following table presents a reconciliation of OIBDA to operating income for the periods indicated:
For the year ended
2016 2015
Amounts in millions of Russian Rubles)
Operating income 275 4,548
Depreciation and amortisation 2,539 2,482
OIBDA 2,814 7,030
Revenues
Revenues at RTI decreased in the year ended 31 December 2016 by 42.3% and amounted to RUB 44,588
million compared to RUB 77,287 million in the year ended 31 December 2015. RTI’s revenue declined
reflecting the disposal of NVision in 2015, as well as lower project volumes on a large defence contract
where work was primarily carried out in 2014 and 2015. In addition, both the Defence Solutions business
unit and the Microelectronics business unit reported lower revenue as customers placed orders later in the
year.
Cost of sales
Cost of sales decreased by RUB 28,362 million, or 47%, from RUB 60,346 million in the year ended 31
December 2015 to RUB 31,984 million in the year ended 31 December 2016.

41
Segment operating income
RTI recorded operating income of RUB 275 million in the year ended 31 December 2016 and RUB 4,548
million in the year ended 31 December 2015. RTI operating income followed revenue trends and
impairment loss recognition for accounts receivable and supply stock.
MTS Bank
MTS Bank provides a broad range of banking services, maintaining a diversified corporate loan portfolio
and playing an active role in the Russian banking market. For the years ended 31 December 2016 and
2015, MTS Bank’s revenues accounted for 2.9% and 3.77%, respectively, of our consolidated revenues
The following table presents the results of operations for MTS Bank for the periods under discussion:
Year ended 31 December
2016
% of revenues
2015
% of
revenues
(Amounts in millions of Russian Rubles, except percentages)
Revenues(1) 20,233 100.0% 25,619 100.0% Cost related to banking activities (15,399) (76.1%) (34,489) (134.6%) Selling, general and administrative expenses (7,384) (36.5%) (7,980) (31.1%) Depreciation and amortisation (663) (3.3%) (689) (2.7%) Operating income/(loss) (3,282) (16.2%) (17,658) (68.9%) OIBDA(2) (2,619) (12.9%) (16,969) (66.2%) ___________________
(1) Includes net sales to external customers and intersegment sales. Intersegment sales amounted to 1,159 million RUB and 462 million RUB in
the years ended 31 December 2016 and 2015, respectively.
(2) OIBDA represents operating income before depreciation and amortisation. OIBDA is not a measure of financial performance under IFRS.
You should not consider it an alternative to net income as a measure of operating performance or to cash flows from operating activities as a measure of liquidity. Our calculation of OIBDA may be different from the calculation used by other companies and therefore comparability may
be limited. We believe that OIBDA provides useful information to investors because it is an indicator of the strength and performance of our
ongoing business operations, including our ability to fund discretionary spending such as capital expenditures, acquisitions of subsidiaries and other investments and our ability to incur and services debt. While depreciation and amortisation are considered operating costs under IFRS,
these expenses primarily represent non-cash current period allocation of costs associated with long-lived assets acquired or constructed in prior
periods
The following table presents a reconciliation of OIBDA to operating income for the periods indicated:
For the year ended
2016 2015
(Amounts in millions of Russian Rubles) Operating loss (3,282) (17,658)
Depreciation and amortisation 663 689
OIBDA (2,619) (16,969)
Revenues
MTS Bank derives a majority of its revenue from interest income.
Revenues decreased by RUB 5,386 million or 21%, from RUB 25,619 million in the year ended 31
December 2015 to RUB 20,233 million in the year ended 31 December 2016. Interest income declined as
a result of a reduction in risk appetite and the size of the loan book in a period of economic contraction, as
well as due to lower interest rates in the Russian market.
Loans to customers and banks (gross), including leases, decreased by RUB 32,828 million, or 24%, from
RUB 135,723 million in the year ended 31 December 2015 to RUB 102,896 million in the year ended 31
December 2016.
Non-interest income decreased by RUB 1,338 million, or 26%, from RUB 5,160 million in the year ended
31 December 2015 to RUB 3,822 million in the year ended 31 December 2016.

42
Cost related to banking activities
Cost related to banking activities reduced by RUB 19,089 million, or 55.3%, from RUB 34,489 million in
the year ended 31 December 2015 to RUB 15,399 million in the year ended 31 December 2016. The decline
in cost was due mainly to a reduction in provision charges and continued improvements in asset quality at
MTS Bank.
Selling, general and administrative expenses
Selling, general and administrative expenses slightly decreased by RUB 596 million, or 7.5%, from RUB
7,980 million in the year ended 31 December 2015 to RUB 7,384 million in the year ended 31 December
2016.
Segment operating income/(loss)
MTS Bank reported operating loss of RUB 3,282 million in the year ended 31 December 2016 whereas in
the year ended 31 December 2015 the operating loss amounted to RUB 17,658 million.
SSTL
For the years ended 31 December 2016 and 2015, SSTL’s revenues accounted for 1.8% and 2%,
respectively, of our consolidated revenues.
The following table presents the results of operations for SSTL for the periods under review:
Year ended 31 December
2016
% of
revenues
2015
% of
revenues
(Amounts in millions of Russian Rubles, except percentages) Revenues(1) 12,466
100.0%
13,965
100.0%
Cost of sales (8,407)
(67.4%)
(9,201)
(65.9%)
Selling, general and administrative expenses (4,655)
(37.3%)
(5,423)
(38.8%)
Impairment of long-lived assets other than
goodwill and provisions for other assets
(260)
(2.1%)
(235)
(1.7%)
Finance income 417
3.3%
335
2.4%
Finance costs (4,366)
(35.0%)
(6,596)
(47.2%)
Depreciation and amortisation (889)
(7.1%)
(832)
(6.0%)
Operating loss (2,347)
(18.8%)
(3,227)
(23.1%)
OIBDA (negative) (2)
(1,458)
(11.7%)
(2,395)
(17.2%)
___________________
(1) Consists of net sales to external customers. SSTL recorded no intersegment sales in the years ended 31 December 2016 and 2015.
(2) OIBDA represents operating income before depreciation and amortisation. OIBDA is not a measure of financial performance under IFRS.
You should not consider it an alternative to net income as a measure of operating performance or to cash flows from operating activities as a
measure of liquidity. Our calculation of OIBDA may be different from the calculation used by other companies and therefore comparability may be limited. We believe that OIBDA provides useful information to investors because it is an indicator of the strength and performance of our
ongoing business operations, including our ability to fund discretionary spending such as capital expenditures, acquisitions of subsidiaries and
other investments and our ability to incur and services debt. While depreciation and amortisation are considered operating costs under IFRS, these expenses primarily represent non-cash current period allocation of costs associated with long-lived assets acquired or constructed in prior periods.
The following table presents a reconciliation of OIBDA to operating income for the periods indicated:
For the year ended
2016 2015
(Amounts in millions of Russian Rubles)
Operating loss (2,347) (3,227)
Depreciation and amortisation 889 832 OIBDA (negative) (1,458) (2,395)

43
Revenues
Revenues at SSTL declined by RUB 1,499 million, or 10.7%, from RUB 13,965 million in the year ended
31 December 2015 to RUB 12,466 million in the year ended 31 December 2016.
Segment operating income
SSTL operating losses decreased by RUB 880 million, or 27.26%, from a loss of RUB 3,227 million in
the year ended 31 December 2015 to a loss of RUB 2,347 million in the year ended 31 December 2016.
In 2016, Sistema and Reliance Communications Ltd (“RCom”) continued to work towards the merger of
SSTL’s telecommunications business with RCom. The transaction has been approved by India’s two
main stock exchanges (NSE and BSE), the Securities and Exchange Board of India (SEBI), the
Competition Commission of India (CCI), and the Bombay and Rajasthan High Courts. All necessary
shareholder and creditor approvals have also been properly secured. As of close of business on 31 March
2017, Sistema and RCom were in discussions with the Department of Telecommunication of India (DoT)
and other regulatory and judicial bodies regarding final conditions of the potential transaction. The
decisions regarding the completion of the transaction are expected to be made based on the timing of the
approval processes and substance of the final conditions to be approved.
Other
Our other operating segments include the following assets: Segezha Group, Sitronics, Kronshtadt Group,
Binnopharm, Medsi, Agroholding Steppe, Sistema Venture Capital, Intourist, Leader-Invest and
Bashkirian Power Grid Company (“BPGC”) and others.
For the years ended 31 December 2016 and 2015, revenues from other operating segments accounted for
15.8% and 12.8%, respectively, of our consolidated revenues. Capital expenditures in other operating
segments totaled RUB 21,667 million and RUB 18,167 million in 2016 and 2015, respectively.
The following table presents the results of operations for other operating segments for the periods under
discussion:
Year ended 31 December
2016
% of
revenues
2015
% of
revenues
(Amounts in millions of Russian Rubles, except percentages)
Revenues(1) 110,190 100.0% 86,851 100.0% Cost of sales (71,677) (65%) (57,247) (65.9%) Selling, general and administrative expenses (16,239) (14.7%) (13,534) (15.6%) Share of the profit or loss of associates and
joint ventures,net 1,047 1% 789 0.9%
Finance income 2,402 2.2% 2,197 2.5% Finance costs (7,126) (6.5%) (4,180) (4.8%) Depreciation and amortisation (8,883) (8.1%) (5,347) (6.2%) Operating income 16,274 14.8% (272) (0.3%) OIBDA(2) 25,157
22.8% 5,075 5.8%
___________________
(1) Includes net sales to external customers and intersegment sales. Intersegment sales amounted to RUB 3,699 million and RUB 5,027 million in the years ended 31 December 2016 and 2015, respectively.
(2) OIBDA represents operating income before depreciation and amortisation. OIBDA is not a measure of financial performance under IFRS.
You should not consider it an alternative to net income as a measure of operating performance or to cash flows from operating activities as a
measure of liquidity. Our calculation of OIBDA may be different from the calculation used by other companies and therefore comparability may
be limited. We believe that OIBDA provides useful information to investors because it is an indicator of the strength and performance of our ongoing business operations, including our ability to fund discretionary spending such as capital expenditures, acquisitions of subsidiaries and
other investments and our ability to incur and services debt. While depreciation and amortisation are considered operating costs under IFRS,

44
these expenses primarily represent non-cash current period allocation of costs associated with long-lived assets acquired or constructed in prior
periods.
The following table presents a reconciliation of OIBDA to operating income for the periods indicated:
For the year ended
2016 2015
(Amounts in millions of Russian Rubles)
Operating income/(loss) 16,274 (272)
Depreciation and amortisation 8,883 5,347 OIBDA 25,157 5,075
Revenues
Revenues of our other operating segments increased by RUB 23,338 million, or 26.9%, from RUB
86,851 million in the year ended 31 December 2015 to RUB 110,190 million in the year ended 31
December 2016 mainly due to acquisitions and organic growth in the agricultural sector, the consolidation
of Kronshtadt and strong results at Segezha Group.
Bashkirian Power Grid Company (BPGC) is a large regional company providing electricity transmission
services between central Russia and the Urals, and power transmission and distribution services to
consumers in the Republic of Bashkortostan. Revenue at BPGC grew by 8.3% for the full year 2016.
Mainly due to indexation of electricity transmission tariffs that came into force on 1 July 2016.
Medsi is one of Russia’s leading national networks of private clinics, providing healthcare services in
Moscow and other Russian regions. In 2016, Medsi increased revenues by 14.4% year-on-year. Revenue
generated from individuals grew by 11%. Revenue generated from insurers (including from Mandatory
Medical Insurance, or MMI) rose by 19%, in part due to a 13% increase in patient visits covered by
insurance.
Revenue from regional clinics grew by 7.6% in 2016 driven by optimisations of the sales strategy.
Binnopharm is a pharmaceuticals company managing one of the largest full-cycle facilities in Russia for the
manufacturing of bio-technology drugs in line with GMP (Good Manufacturing Practice) international
quality standards. Revenue rose by 16.9% year-on-year. Sales of Binnopharm’s own products accounted
for 78% of revenue in 2016, up from 43% a year earlier. Sales of Regevak B vaccine declined from 36%
of total revenue in 2015 to 29% in 2016. In the commercial segment, sales of Binnopharm’s own products
increased from 29% of total revenue in 2015 to 47% in 2016.
Segezha Group is a manufacturer of sack paper and exporter of timber products and ply wood. Revenue at
Segezha Group increased by 28.7% in 2016 as a result of increased production capacity, expansion of
paper sack sales to new markets and consolidation of Lesosibirsk LDK No. 1, which delivered strong
operational and financial performance for the year, contributing RUB 5.7 billion in revenue.
Steppe is a diversified agricultural holding operating in Russian Federation. In 2016, Steppe’s revenue
increased four-fold, primarily driven by both M&A and organic growth.
2016 saw a record harvest of 1.04 million tonnes of grain. The significant increase in the gross harvest
was achieved thanks to the acquisition of additional land as well as implementation of agricultural
technologies and improved execution discipline.
Milk output increased by 20% thanks to a 13% year-on-year expansion of the herd to 3,700 cows and
increased productivity. A landmark event for the dairy segment in 2016 was regulatory approval to export
to European Union markets based on an assessment that Steppe’s milk meets EU standards.
In 2016, Steppe planted 150 hectares of new high-density orchards, which will be fully operational in
2018. Fruit yields increased by 5% in 2016 to 42.1 tonnes per hectare.

45
Total tomato and cucumber production rose by 22% in 2016 to 45,800 tonnes as a result of an increase in
greenhouses area under cultivation and an increase in yields from 31.6 kilograms per square metre in
2015 to 35.1 kilograms per square metre in 2016.
In May 2016, an additional 110,000 hectares of land in the Stavropol and Rostov regions were acquired
and included in the 2016 harvest. The production of grain by new assets increased 65% as compared to
2015. At the end of 2016, Steppe acquired an additional 68,000 hectares of land and is currently
integrating them into its business.
Cost of sales
Cost of sales increased by RUB 14,430 million, or 25.2%, from RUB 57,247 million in the year ended 31
December 2015 to RUB 71,677 million in the year ended 31 December 2016 following the reasons
discussed in revenue section above.
Selling, general and administrative expenses
Selling, general and administrative expenses increased by RUB 2,705 million, or 20%, from RUB 13,534
million in the year ended 31 December 2015 to RUB 16,239 million in the year ended 31 December 2016
due to acquisitions at Segezha Group and Steppe.
Depreciation and amortisation
Depreciation and amortisation increased by RUB 3,536 million, or 66,1%, from RUB 5,347 million in the
year ended 31 December 2015 to RUB 8,883 million in the year ended 31 December 2016 mainly due to
growth in capital expenditures and acquisition.
Segment operating income/(loss)
For the reasons discussed above, our other operating segments, in aggregate, recorded an operating
income of RUB 16,274 million in 2016 as compared to loss RUB 272 million in 2015.

46
Liquidity and Capital Resources
Sistema PJSFC and its subsidiaries use a variety of sources to finance operations, both external and
internal. In addition to net cash provided by operations, short- and long-term borrowings to fund capital
expenditures and strategic investments are used. Short- and long-term funding sources may change with
time, but currently include notes issued in the international and Russian capital markets and credit
facilities with international and Russian banks, denominated both in rubles and foreign currencies.
We expect to repay all long-term debts as they become due from our operating cash flows, including
distributions received from subsidiaries, or through re-financings. See Note 26-29 to our Financial
Statements for a description of our indebtedness.
Dividend policy
When determining the recommended dividend, Sistema's Board of Directors is guided by the dividend
policy approved in April 2016. The policy states that the recommended total dividend for each reporting
year will be, at a minimum, the higher of either an amount equivalent to a dividend yield of 4% per
Sistema ordinary share or RUB 0.67 per Sistema ordinary share.
The Board of Directors’ calculation of the average dividend yield on Sistema’s ordinary shares shall use
the weighted average price of one ordinary share of the Company traded on the Moscow Exchange in the
relevant reporting period: full year or six months.
On the 1 April 2017 Board of Directors recommended that the AGM approve a final dividend for the
2016 financial year of RUB 7.8 billion. As a result, the total amount of the interim and final dividends
paid for 2016 will be RUB 11.5 billion, which is equivalent to a dividend yield of 6% based on the
weighted average price of Sistema’s shares in 2016.
Sistema will seek to distribute dividends twice per year, based on its results for the first nine months and
the full year (previously for the first six months and the full year). Interim dividends paid based on the
financial results for the first nine months of the reporting year will be included in calculations of the total
recommended amount of dividends for the reporting year. To calculate the dividend yield per ordinary
share of Sistema for each reporting year, the Board of Directors will use the weighted average price of
one ordinary share of Sistema on Moscow Exchange for the same reporting year.
Employee share based plans
In 2016 and 2015 the Company’s Board of Directors established two-year motivational programs for
senior and mid-level management. Participants of the programs, upon fulfilment of certain performance
conditions and subject to continuing employment with the Group, are granted ordinary shares in the
Company.
As a result, the Group recognised an expense of RUB 2,522 million and RUB 2,866 million in the
consolidated statements of profit or loss for 2016 and 2015, respectively. The fair value of awards granted
was measured based on the fair value of the Company’s ordinary shares. The awards are equity-settled
and are recognised in additional paid-in capital.

47
Cash Flows
A summary of our cash flows is presented in the table below for the periods indicated:
Year ended 31 December
2016 2015
(Amounts in millions of Russian Rubles)
Cash flows
Net cash provided by operating activities 104,685 156,072
Net cash used in investing activities (64,035) (180,244)
Net cash (used in)/provided by financing activities (90,100) 31,947
Effect of foreign currency translation on cash and cash equivalents (13,135) (3,270)
Impairment of cash and cash equivalents - (1,697)
Net (decrease)/increase in cash and cash equivalents (62,585) 2,808
Net cash provided by operating activities
Net cash provided by operating activities in the reporting year decreased by RUB 51,387 million, or
32.9% from RUB 156,072 million in the year ended December 31, 2015 to RUB 104,685 million in year
ended December 31, 2016. The decrease was mainly caused by changes in working capital by RUB
40,606 million and by the increase in interests paid in 2016 by RUB 11,487 million.
Net cash used in investing activities
Net cash used in investing activities decreased from RUB 180,244 million in the year ended 31 December
2015 to RUB 64,035 million in the year ended 31 December 2016 by RUB 116,209 million, or 64.5%.
The change was resulted mainly from the decrease in the Group’s capital expenditures by RUB 16,345
million, or 11.7%, as well as the cash inflow from the funds where we had the solid placements of long-
term deposits, short-term deposits and other financial assets in 2015. Net proceeds from financial long-
term assets increased by RUB 42,664 million, while net proceeds from financial short-term assets grew
by RUB 71,127 million.
Net cash used in financing activities
In the reporting year, net cash outflow used by the Group in financing activities amounted to RUB 90,100
million as compared to the previous year cash inflow of RUB 31,947 million. Such dynamics is due to
net payment on borrowings of RUB 39,162 million in 2016, whereas in 2015 there was the net proceeds
from borrowings RUB 48,128 million. Above this, there were transactions with non-controlling interests
in 2016 RUB 26, 816 million (in particular, payments to Rosimushchestvo at the amount of RUB 15,718
million and payment for Mikron shares under put options agreement at the amount of RUB 4,800
million). There was the cash inflow of RUB 6,706 million under credit guarantee agreement related to
foreign-currency hedge by MTS in 2015 and proceeds from sale of 23.1% of Detsky mir to the Russia-
China Investment Fund for RUB 9,750 million as well as lower volume of transactions with non-
controlling interests.
Working Capital
Working capital is defined as current assets less current liabilities. As at 31 December 2016, the Group’s
current liabilities exceeded its current assets by RUB 60,976 million. The Group believes that it generates
sufficient operating cash flows and adequate funding is available to fulfil the Group’s short-term
obligations, if needed, including unused credit facilities of RUB 186,542 million and long-term deposits
of RUB 27,274 million available for withdrawal.

48
Capital Requirements
Sistema PJSFC and each of its subsidiaries require funding to finance the following:
Capital expenditures, which consist of purchases of property, plant and equipment and intangible
assets;
Acquisitions;
Repayment of debt;
Changes in working capital;
General corporate activities, including dividends;
Potential payments of obligations under other contractual obligations.
We anticipate that capital expenditures, acquisitions and repayment of long-term debt will represent the
most significant uses of funds for several years to come.
Our capital expenditures in the years ended 31 December 2016 and 2015 were RUB 122,878 million and
RUB 139,223 million, respectively. We expect to continue to finance most of our capital expenditure
needs through our operating cash flows, and to the extent required, additional indebtedness, such as
borrowings or additional capital raising activities.
In addition to our capital expenditures, we spent RUB 26.8 billion and RUB 3.5 billion in the years ended
31 December 2016 and 2015 respectively on acquisitions of non-controlling interests in existing
subsidiaries. See Note and 9 of the Financial Statements for further description of our acquisitions.
As of 31 December 2016 and 2015 short-term debt equaled RUB 83,109 million and RUB 142,657
million respectively. As of 31 December 2016 and 2015, short-term debt accounted for 17% and 26%,
respectively, of our overall debt.
Capital Resources
We plan to finance our capital requirements through operating cash flows and financing activities,
as described above.
Cash
As of 31 December 2016 and 2015 we had cash and cash equivalents of RUB 60,190 million and RUB
122,775 million.
Loans and Borrowings
As of 31 December 2016, our indebtedness consisted mainly of bank loans, corporate bonds and other
financial institutions. Total indebtedness as of 31 December 2016 was RUB 478,126 million, consisting
of RUB 395,017 million in long-term debt, RUB 83,109 million in short-term loans payable. The table
below sets forth our loans from banks and financial institutions as of 31 December 2016.

49
Interest rate
Maturity
(actual at
31 December 31 December 31 December
2016) 2016 2015
USD-denominated:
Calyon, ING Bank N.V,
Nordea Bank AB, Raiffeisen
Zentralbank Osterreich AG
2017-2020
LIBOR 6m+1.15%
25,394 39,449
China Development Bank 2017-2021
LIBOR 6m+3.15%;
1.92%
9,099 21,026
Citibank 2017-2024
LIBOR 6m+0.9%
12,812 17,511
Bank of China 2016
1.91% - 3.83%
- 10,391
VTB 2016-2018
LIBOR 3m+7.5%
- 4,032
Skandinavska Enskilda Banken
AB
2017
LIBOR
6m+0.225% - 1.8%
1,163 3,938
Other
3,323 275
51,791 96,622
EUR-denominated:
Credit Agricole Corporate
Bank and BNP Paribas 2017-2018
EURIBOR
6m+1.65%
876 1,639
VTB 2016-2017
EURIBOR
6m+6.2%
- 1,076
ING Bank 2017-2021
4.30%
9,190
Other
823 1,466
10,889 4,181
RUB-denominated:
Sberbank 2017-2023
8.45%-17.75%
180,161 203,363
VTB 2017-2026
10.20%-19.70%;
CBR+2.02%-
4.80% (12.02%-
14.80%)
37,943 24,753

50
Gazprombank 2017-2022
10.9% - 12.0%
4,819 11,187
Expobank 2017-2019
14.00%-14.50%
3,000 3,500
Alfa Bank 2017-2023
10.50%-13.45%
10,210 4,970
Other
20,451 12,779
256,584 260,552
Other currencies
4,574 5,369
Total bank loans
323,838 366,724

51
As of 31 December 2016 and 2015, the Group’s notes consisted of the following:
31 December
31 December
Currency
Interest rate
2016
2015
MTS International Notes due 2023 USD
5.00%
28,217
33,908
MTS International Notes due 2020 USD
8.63%
18,537
42,238
Sistema International Notes due
2019 USD
6.95%
25,067 32,027
Sistema PJSFC Bonds due 2016 RUB
8.75%
- 13,896
Sistema PJSFC Bonds due 2018 RUB
12.70%
10,000 10,000
Sistema PJSFC Bonds due 2030 RUB
17.00%
- 8,206
Sistema PJSFC Bonds due 2027 RUB
9.90%
9,949 -
Sistema PJSFC Bonds due 2026 RUB
9.80%
6,200 -
Sistema PJSFC Bonds due
September 2025 RUB
12.50%
5,000 5,000
MTS Notes due 2031 RUB
9.40%
9,986 -
MTS Notes due 2023 RUB
8.25%
9,984 9,971
MTS Notes due 2017 RUB
8.70%
9,995 9,637
MTS Notes due 2020 RUB
9.25%
1,448 2,110
MTS Notes due 2016 RUB
8.75%
- 1,788
Sistema PJSFC Bonds due
October 2025 RUB
10.90%
1,700 1,700
Other
2,218 1,274
Total notes
138,301
171,755
The following table presents the aggregate scheduled maturities of debt outstanding as of 31 December
2016:
<1 year
1-2 years
2-3 years
3-4 years
4-5 years
5+ years
Borrowings 83,109 107,592 118,419 70,690 31,334 66,982

52
Commitments and Contingencies
For a detailed discussion of our commitments and contingencies, see Note 38 of our Financial Statements.
Capital commitments – A capital commitment is a contractual obligation to make payment in the future,
mainly in relation to buy assets such as network infrastructure. These amounts are not recorded in the
consolidated statement of financial position since the Group has not yet received goods or services from
suppliers. At 31 December 2016, the Group had capital commitments of RUB 31,815 million (31 December
2015: RUB 31,594 million) relating to the acquisitions of property, plant and equipment.
Operating lease commitments – The Group enters into various agreements to lease space for
telecommunications equipment, transmission channels, mobile towers, retail outlets and offices.
The leases have various terms and renewal rights, none of which is individually significant to the Group.
Future minimum lease payments under non-cancellable operating leases comprise:
Commitments on loans and unused credit facilities – As of 31 December 2016, MTS Bank had RUB
6,891 million of commitments on loans and unused credit facilities available to its customers (31
December 2015: RUB 5,064 million).
Guarantees – At 31 December 2016, MTS Bank guaranteed loans for several companies which totalled
RUB 3,921 million (31 December 2015: RUB 5,423 million), including related parties of RUB 234
million (31 December 2015: RUB 589 million). These guarantees would require payment by the Group in
the event of default on payment by the respective debtor. Such guarantee contracts issued by the Group
are initially measured at their fair values and are subsequently measured at the higher of the amount of the
obligation under the contract, as determined in accordance with IAS 37, and the amount initially
recognised less, where appropriate, cumulative amortisation recognised in accordance with the revenue
recognition policies.
Telecommunication licenses – In 2012, the Federal Service for Supervision in the Area of
Communications, Information Technologies and Mass Media allocated MTS the necessary license and
frequencies to provide LTE telecommunication services in Russia. Under the terms and conditions of the
LTE license, MTS is obligated to fully deploy LTE networks within seven years, commencing from 1
January 2013, and deliver LTE services in each population center with over 50,000 inhabitants in Russia
by 2019. Also, MTS is obligated to invest at least RUB 15 billion annually toward the LTE roll-out until
the network is fully deployed.
In May 2007, the Federal Service for Supervision in the Area of Communications, Information
Technologies and Mass Media awarded MTS a license to provide 3G services in Russia. The 3G license
was granted subject to certain capital and other commitments.
In March 2015, upon winning a tender, MTS-Ukraine, a subsidiary of MTS, has acquired a nationwide
license for the provision of UMTS (3G) telecommunications services. The license with the cost of UAH
2,715 million (RUB 6,015 million at the acquisition date) has been granted for 15 years. In accordance
with the terms of the license MTS-Ukraine is required provide coverage across Ukraine by April 2020.
Payments due in
2017 19,865
2018 12,211
2019 12,671
2020 13,087
2021 16,126
Thereafter 16,748
Total 90,708

53
In accordance with the terms of the license, MTS-Ukraine also concluded agreements on the conversion
of provided frequencies with the Ministry of Defense of Ukraine, Ministry of Internal Affairs of Ukraine
and State Service of Special Communications and Information Protection of Ukraine. As of 31 December
2015, MTS-Ukraine has paid UAH 358 million (RUB 865 million as of the payment date) for the
conversion of frequencies and is liable to pay UAH 267 million (RUB 596 million as of 31 December
2016) adjusted for the rate of inflation in the years 2017-2018.
Management believes that as of 31 December 2016 the Group complied with the conditions of the
aforementioned licenses.
Restriction on transactions with the shares of BPGC – In 2014, in the course of litigation, which the
Group is not a party to, the court imposed restrictions on transactions with the shares of BPGC owned by
the Group. The restrictions do not limit the Group’s voting rights, rights to receive dividends or any other
shareholders rights.
Taxation – Laws and regulations affecting business in the Russian Federation continue to change rapidly.
Management’s interpretation of such legislation as applied to the activity of the Group may be challenged
by the relevant regional and federal authorities. Recent events suggest that the tax authorities are taking a
more assertive position in their interpretation of the legislation and assessments and as a result, it is possible
that transactions and activities that have not been challenged in the past may be challenged. Fiscal periods
generally remain open to tax audit by the authorities in respect of taxes for three calendar years preceding
the year of tax audit. Under certain circumstances reviews may cover longer periods. Management believes
that it has provided adequately for tax liabilities based on its interpretations of tax legislation. However, the
relevant authorities may have different interpretations, and the effects on the financial statements could be
significant.
Where uncertainty exists, the Group has accrued tax liabilities as management’s best estimate of the
probable outflow of resources which will be required to settle such liabilities. As of
31 December 2016, provisions for additional taxes and customs settlements comprised
RUB 1,213 million (31 December 2015: RUB 1,076 million).
The Group also assesses the following contingent liabilities in respect of additional tax settlements:
December 31,
2016
December 31,
2015 Contingent liabilities for additional taxes other than income tax 1,306 419 Contingent liabilities for additional income taxes 3,256 413
In 2015, amendments were introduced into the Russian tax legislation in respect of taxation of profit of
controlled foreign companies. According to these changes, undistributed profits of the Group foreign
subsidiaries, qualifying as controlled foreign companies, should be included in the income tax base of the
controlling entities in particular cases. The management of the Group does not expect any significant
effect of these changes on the consolidated financial statements of the Group.
Legal proceedings – In the ordinary course of business, the Group is a party to various legal proceedings,
and subject to claims, certain of which relate to the developing markets and evolving regulatory
environments in which the Group operates. At 31 December 2016, management estimates the range of
possible losses, if any, in all pending litigations or other legal proceedings being up to RUB 8,722
million.

54
Credit Ratings
Our credit ratings impact our ability to obtain short- and long-term financing, and the cost of such financing.
In determining our credit ratings, the rating agencies consider a number of factors, including our operating
cash flows, total debt outstanding, commitments, interest requirements, liquidity needs and availability of
liquidity. Other factors considered may include our business strategy, corporate governance, the condition of
our industry and our position within the industry. Although we understand that these and other factors are
among those considered by the rating agencies, each agency might calculate and weight each factor
differently.
The credit ratings of PJSFC Sistema, MTS, Detsky mir and MTS-Bank as of 18 April 2017 were as
follows:
Name of issuer Rating Agency Date of Rating Rating Outlook
Sistema S&P 24 July 2015 BB Stable Sistema Fitch 20 May 2016 BB- Stable MTS S&P 21 March 2017 BB+ Stable MTS Fitch 20 May 2016 BB+ Stable Detsky mir S&P 21 March 2017 В+ Stable MTS-Bank Fitch 10 March 2017 B+ Stable
Market Risks
We are exposed to a variety of market risks, including foreign currency risk, interest rate risk, credit risk
and liquidity risk. We actively seek to minimize the potential adverse effects of these risks on our
financial performance, and, in particular, use derivative instruments, including swap, forward and option
contracts to manage foreign currency and interest rate risks. We do not use derivatives for trading
purposes.
Interest Rate Risk
Interest rate risk – Interest rate risk arises from the possibility that changes in interest rates will affect
finance costs. The Group is exposed to interest rate risk because entities in the Group borrow funds at
both fixed and floating interest rates. The risk is managed by the Group by maintaining an appropriate
mix between fixed and floating rate borrowings and by conducting certain hedging activities. For more
information see Notes 32, 33 of our Financial Statements.
As of 31 December 2016, approximately RUB 123,110 million, or 26% of our total indebtedness was
variable interest rate debt, while RUB 355,009 million, or 74% of our total indebtedness was fixed
interest rate debt.
For indebtedness with variable interest rates, the table below presents principal cash flows and related
weighted average interest rates by contractual maturity dates as of 31 December 2016.

55
Indebtedness Currency 2017 2018 2019 2020 2021 Thereafter Total
Annual
interest rate
(Actual
interest rate
at
December
31,
2016)
(amounts in millions of RUB)
Variable debt
Sberbank RUB — 12,000 12,000 12,000 14,497 — 50,497 10.90%
Skandinavska Enskilda
Banken AB USD 821 — — — — — 821 1.54%
Skandinavska Enskilda
Banken AB USD 355 — — — — — 355 3.12%
LBBW EUR 298 — — — — — 298 1.30%
Credit Agricole Corporate
Bank and BNP Paribas EUR 442 442 — — — — 884 1.43%
Citibank USD 1,808 1,808 1,808 1,808 1,808 4,519 13,559 2.22%
Calyon, ING Bank N.V,
Nordea Bank AB, Raiffeisen
Zentralbank Osterreich AG
USD 7,566 7,566 6,055 4,543 — — 25,730 2.47%
Unicredit RUB 1,325 — — — — — 1,325 16%
Unicredit EUR — — — — 527 — 527 3%
Gazprombank RUR — — — — — 819 819 12%
VTB RUR
63 885 1,400 1,391 15,457 19,196 13%
China Development Bank USD — — — — 9,099 — 9,099 10%
Total variable debt
12,615 21,879 20,748 19,751 27,322 20,795 123,110
Credit Risk
Credit risk – Credit risk refers to the risk that a counterparty will default on its contractual obligations
resulting in a financial loss to the Group. The Group is exposed to credit risks on cash and cash
equivalents, deposits, derivatives and certain other financial instruments with financial institutions, loans
and receivables carried at amortised cost and debt securities.
Financial assets with financial institutions – The Group maintains mixture of cash and cash equivalents,
deposits, derivatives and certain other financial instruments with financial institutions. These financial
institutions are located in different geographical regions and the Group’s policy is designed to limit
exposure to any one institution. As part of its risk management processes, the Group performs periodic
evaluations of the relative credit standing of the financial institutions.
Bank loans to customers and interbank loans due from banks – MTS Bank performs daily monitoring of
future expected cash flows on clients’ and banking operations, which is a part of assets/liabilities
management process. The credit risk exposure is monitored on a regular basis to ensure that the credit limits
and credit worthiness guidelines established by the MTS Bank’s risk management policy are not breached.

56
The Group structures the levels of credit risk it undertakes by placing limits on the amount of risk accepted
in relation to one borrower, or group of borrowers, and to geographical segments.
Other loans and receivables carried at amortised cost – Concentrations of credit risk with respect to loans
and trade receivables are limited given that the Group’s customer base is large and unrelated. Management
believes there is no further credit risk provision required in excess of the normal provision for bad and
doubtful receivables.
The carrying amount of our financial assets represents our maximum credit exposure. The following table
sets forth the maximum exposure to credit risk as at the periods indicated:
Year ended 31 December
2016 2015
(Amounts in millions of Russian Rubles) Cash and cash equivalents 60,190 122,775 Short term financial assets 62,588 78,020 Accounts receivable, net 60,888 74,276 Deposits in banks 36,447 121,813 Long-term financial assets 100,023 112,236
Total 320,136 509,120
Liquidity Risk
Liquidity risk is the risk that we will not be able to settle all liabilities as they become due. Our approach
to managing liquidity is to ensure, as far as possible, that we will always have sufficient liquidity to meet
our liabilities when due, under both normal and stressed conditions, without incurring unacceptable losses
or risking damage to our reputation. Our liquidity in the future will primarily depend on our ability to
maintain adequate cash flows from operations to meet our debt obligations as they become due, on our
ability to obtain adequate external financing to meet our committed future capital expenditures and on the
extent to which we will be obligated to make payments under certain judgments and other contractual
obligations. Our operating cash flows could be adversely affected by numerous factors beyond our
control, including but not limited to, fluctuations in exchange rates and inflation, the price of acquisitions,
the change in telecommunications tariffs, taxation, or increased competition. Our ability to obtain external
financing depends on numerous factors, including but not limited to, our financial performance and
creditworthiness as well as our relationships with lenders.

57
5. RISKS
Description of main risk factors
Sistema may face a variety of risks in the course of its business operations. They result from processes
and factors that Sistema has little or no influence on. That said, the Corporation can take measures to
reduce negative consequences of such factors in case a certain risk occurs. This makes efficient
assessment of existing risks, the probability of their occurrence and their efficient management an
important part of Sistema’s strategy.
The Corporation has introduced an integrated enterprise risk management (ERM) system based on
international standards, recommendations and practices of risk management designed to provide a
reasonable guarantee that the strategic goals will be achieved and to ensure that risks will be kept at a
level acceptable to the shareholders and the management of the Corporation.
Sistema’s ERM system
As part of quarterly ERM procedures, Sistema’s risk managers compile separate risk registers for
subsidiaries and a consolidated risk register for the Group, prioritise risks and aggregate them into
portfolios, develop a risk map and analyse its key trends, analyse the impact that material risks have on
the financial performance of specific subsidiaries and Sistema Group as a whole using simulation and
financial modelling methods.
To address the risks listed in the risk register of Sistema Group, the company has developed risk
management (mitigation) and response plans covering specific mitigation measures to be taken. These
plans are modified, adjusted and then approved by Sistema’s Risk Subcommittee.
Risk management reports are submitted for review to the relevant collective governance bodies at least
once a quarter. Each risk management report contains a revaluation of risks, an assessment of the
effectiveness of risk mitigation and response plans, and potential risk areas (areas requiring attention)
identified for future periods.
External risks
Risks related to changes in the political and economic situation in Russia are material to Sistema, because
most of the Corporation’s business is conducted in the Russian Federation. Additionally, many of its
subsidiaries operate in transitional economies, including Ukraine, Armenia, Belarus, Turkmenistan and
India, and therefore are also exposed to material external risks. A significant portion of products produced
by the Group’s companies is sold in the CIS, Southeast Asia, Eastern Europe and North Africa. In case of
any major political turmoil in these regions, the Group’s business in the regions may be discontinued or
put on hold, which may lead to material losses.
Financial risks
Sistema’s business is inextricably connected to the state of the global economy and financial markets. In
particular, it is sensitive to movements in prices of oil, gas, and other commodities that Russia exports.
Weakening of the rouble against the US dollar and euro amid a slump in the oil prices, sanctions, and
increased capital flight from Russia may result in a rise in costs and a decrease in revenues, or impede the
achievement of financial targets and repayment of debt by Sistema subsidiaries.
Any potential downturn or slowdown in Russia’s economic growth can lead to a decrease in household
incomes and consumer demand, which could have significant negative consequences for the results of
operations and the financial position of all Sistema companies.

58
The exit of foreign investors from Russia, the downgrading of the sovereign credit rating by international
rating agencies as well as restrictions introduced for foreign companies in Russia as a result of sanctions
may have a negative impact on Sistema’s joint ventures (partnerships) and new investment projects.
Growing inflation may result in higher expenses and therefore put pressure on profit margins, and also
affect domestic demand for products and services offered by Sistema companies.
If sanctions are maintained and Russian banks’ and businesses’ access to foreign debt capital remains
restricted in the medium term, this may significantly increase the current liquidity deficit in the market
and result in further interest rate increases, making it difficult for Sistema to raise funding for its
operations and to refinance the debt of the Corporation and its portfolio companies.
An unfavourable macroeconomic environment in many countries where Sistema’s assets operate may
make it necessary to re-evaluate goodwill at some of the assets.
Currency controls and restrictions on capital repatriation may adversely affect Sistema’s business by
posing barriers to capital flows and reduce the value of Sistema’s investment in Russia.
Potential bankruptcy of one or several Russian or foreign banks due to restricted access to financing may
result in a reduction in sources of borrowing for the Corporation and portfolio companies and may lead to
direct losses of funds deposited in the accounts of such banks.
Political and social risks
The significant influence of geopolitical risks on the Corporation and its portfolio companies has
persisted over the reporting year as protectionism and economic sanctions are increasingly being used as
tools for achieving geopolitical goals.
The risks of inter-state conflicts remain substantial, both in terms of probability and in terms of potential
effect on various areas of Sistema’s activities. For example, insurance companies may set higher
insurance premiums for Sistema or refuse to insure against specific risks, which may lead to worsening
financial performance.
Introduction of sanctions against Russia or Russian companies may result in disruptions in international
payment systems, which in turn may prevent the Corporation and its portfolio companies from making
settlements and thereby reduce Sistema’s investment appeal.
A potential rise in social unrest in regions where the Corporation operates may threaten its profits.
The most pressing risks for Group’s telecommunications business are geopolitical risks associated with a
deterioration in the situation in Ukraine. The political crisis in Ukraine has led to a significant decrease in
the growth rates of the telecommunications market, and continues to adversely affect the exchange rate of
the national currency.
Legal risks
There is a risk of unpredictable court rulings and administrative decisions being passed with respect to the
business of Sistema Group, which may have an adverse effect on the Group’s business. This risk is
caused by numerous factors, including:
possible discrepancies and ambiguities in: (i) federal and other laws; (ii) bylaws issued by
executive authorities of the states where Sistema Group operates; (iii) regional and local laws,
rules and requirements;

59
gaps in legislation and lack of court and administrative guidelines to the interpretation of some
laws, as well as conflicts between certain court guidelines and rulings;
influence of political, social and other external factors on the judicial system;
potential selective or arbitrary administrative decisions of government authorities.
Gaps in the corporate and securities legislation and regulations in the markets where Sistema operates
may create barriers to raising funds and impair the company’s ability to manage, own and oversee the
activities of portfolio companies.
Lack of clarity about the applicability to Sistema’s business of the Federal Law on the Procedure for
Foreign Investment in Companies of Strategic Importance to National Defence and State Security and the
regulations of the Customs Union of Russia, Belarus and Kazakhstan may have a negative impact on
Sistema’s business due to the fact that the Corporation has foreign shareholders.
There is a risk of amendments to the laws of the countries where Sistema companies operate, due to
potential changes in the laws and regulations governing international trade and investments that may be
introduced by foreign states or international organisations. For instance, Russia’s accession to the World
Trade Organization may result in certain unpredictable legislative and other changes in the markets in
which Sistema’s companies operate.
Since Russian corporate law provides for liability of shareholders for the obligations of its affiliates,
Sistema may incur financial losses related to the liabilities of its portfolio companies.
Minority shareholders of Sistema’s subsidiaries may contest or vote against the Company’s transactions,
which may limit Sistema’s capability to complete investment transactions and restructure businesses.
If the Russian Federal Anti-Monopoly Service concludes that Sistema or one of its material subsidiaries
has violated any of the existing anti-monopoly laws, this may result in serious administrative sanctions
involving losses for the Corporation. The Federal Anti-Monopoly Service may also prevent the
Corporation and its portfolio companies from closing and/or delivering on certain transactions, which
may also limit Sistema’s capacity to do investment deals and restructure businesses.
Taxation
Tax laws, regulations, and practices of the jurisdictions where Sistema’s assets operate are intricate,
opaque and prone to frequent modifications and ambiguous interpretations. If the Corporation’s actions
are interpreted as breach of tax law, this may produce an adverse effect on the business of Sistema Group.
Russian law on transfer pricing may make it necessary to introduce adjustments to price-setting practices
used at Sistema Group’s companies and result in additional tax liabilities related to some transactions.
On 1 January 2015, new rules were introduced relating to the taxation of undistributed profits of
controlled foreign companies, the concept of a beneficiary owner and criteria to be used to establish tax
residency of legal entities. Throughout 2015-2016, these rules were revised several times, with all the
amendments having retroactive effect. As a result of the need to apply new taxation rules, the Group’s
companies may face tax liabilities arising due to the uncertainty around interpretation of tax law and lack
of relevant precedents.
Securities markets
A deterioration of the geopolitical environment, the imposition of sanctions on Russian companies, a
worsening of the macroeconomic environment and capital and investor flight from the Russian market led
to a reduction in valuations of Russian companies in 2014-2016. In view of these circumstances,

60
Sistema’s access to investor funding through securities markets may be restricted further in the event of
the imposition of sectoral sanctions against Russian companies in business segments where Sistema
operates and/or due to investors taking a cautious approach to Russian companies in general. In particular,
Sistema’s ability to raise funding via bond issues may be limited, which is likely to lead to a lack of
working capital and cash available for investment and affect the Corporation’s financial performance.
2. Risks related to Sistema’s activities
Implementation of the business strategy
The Corporation’s strategy aims to develop a balanced and diversified asset portfolio in sectors and
regions where Sistema has expertise and competitive advantages, while attracting leading international
and Russian partners. Despite having a well-formulated strategy, Sistema cannot guarantee full or partial
achievement of its established goals, efficient management of the portfolio companies, or benefits from
new investment opportunities. Sistema’s failure to achieve goals set in the strategy may undermine its
financial results.
The development of Sistema Group companies depends on numerous factors, including receipt of
necessary permits from state authorities, sufficient demand from consumers, successful development of
technologies, efficient risk and cost management, timely completion of R&D and introduction of new
products and services. Weaknesses in any of these areas may have a detrimental effect on the
development of Sistema Group companies and the Corporation’s financial results.
Acquisition, integration, disposal or restructuring of assets
Sistema PJSFC implements its strategy via acquisitions, disposals, and restructuring of assets. New
investment opportunities come with certain risks, including failure to find relevant targets or their not
being available for acquisition, inadequate due diligence of the target company’s operations and/or
financial situation, and potential overvaluation of assets. These risks can also affect Sistema’s financial
performance.
Acquisitions of assets may increase pressure on the cash position and create a need for raising external
funding.
Delays in the implementation of investment deals or failure to close them may obstruct the achievement
of Sistema’s strategic goals and affect its performance, financial position, and investment appeal.
Sistema may struggle with building an efficient system for managing and controlling new assets. The top
risks in this area include:
inability to efficiently integrate operating assets and personnel of the acquired company;
inability to establish and integrate necessary control mechanisms, including those related to
logistics and distribution;
conflicts between shareholders;
hostility and/or unwillingness to cooperate on the part of the management and personnel of the
acquired asset;
loss of customers by the acquired asset.
If any of the above risks materialise, the relevant asset may lose part of its value and/or experience a
deterioration in financial performance.
When disposing of its assets the Corporation may face the following risks:
delays in closing or failure to close the deal due to inability to obtain corporate or state approvals;

61
mistakes in asset valuation;
assuming excessive obligations towards the buyer;
loss of synergies with other assets staying in the portfolio.
If one or several of the specified risks materialise, the Corporation may lose potential profit and thus see
an impact on its financial performance.
Management and key personnel
The implementation of Sistema’s strategy in many respects depends on the efforts and professionalism of
the management team. Failure to hire a sufficiently competent and motivated management team can
jeopardise Sistema’s business, performance, financial position, and development prospects.
Cash flows from subsidiaries and affiliates
The Corporation’s financial performance depends on the ability of Sistema Group companies to generate
cash flows needed to service its financial liabilities, including repayment of debt and interest, and to make
other investment activities in the future. Such cash-generation capacity may be restricted due to
regulatory, tax or any other barriers, which may have an adverse effect on the financial position and
liquidity of the Corporation.
Overdependence on MTS
Sistema’s financial results in many respects depend on the success of its core asset, MTS. Therefore, any
deterioration in the financial performance of MTS may have a negative impact on Sistema’s financials.
Any events damaging to the business of MTS may also negatively influence the current state of Sistema’s
business and its future prospects and worsen financial figures.
Borrowings
Cash flows from portfolio companies may be insufficient to absorb all of the Corporation’s investments
scheduled for a particular time. This can make it necessary to borrow funds and thus slow down the
implementation of Sistema’s strategy.
Loan covenants
Loan and debt securities agreements signed by Sistema and its portfolio companies contain certain
restrictive covenants. These covenants restrict further borrowings, encumbrance of property with pledges,
sale of assets, and transactions with affiliates. They may also restrict certain aspects of Sistema’s
operations, such as financing of capital expenses, or limit its capacity to repay debts and service other
liabilities. Breach of covenants, however inadvertent, may entitle creditors of the Corporation and/or its
portfolio companies to demand early repayment of loans, which is a threat to the Corporation’s financial
performance.
Licenses and permits
Operations of Sistema Group’s companies are regulated by different government bodies and agencies
issuing and renewing licenses, approvals and permits, and also depend on applicable laws, regulations and
standards. Regulating authorities to a large extent rely on their own judgment when interpreting and
implementing legal requirements, issuing and extending licenses, approvals and permits, and monitoring
compliance with such licenses. There is no guarantee that existing licenses and permits, including those
issued to the Group’s companies, will be extended, that new licenses and permits will be issued, or that
the companies will be able to comply with the terms of such licenses. There is no guarantee either that

62
existing or future licenses or permits will not be suspended or revoked on some grounds. Any of these
circumstances can have material negative consequences for Sistema’s business .
Privatised companies
Sistema’s portfolio contains several privatised assets including MGTS, VAO Intourist, BPGC, RTI, and
several other businesses in the technology and agricultural sectors. Some of Sistema’s subsidiaries own
privatised assets. It is also probable that the Corporation and/or its portfolio companies will take part in
privatisations in the future. Since Russia’s privatisation-related legislation remains somewhat unclear and
inconsistent and contradicts some other provisions of law (e.g., there are contradictions between federal
and regional provisions on privatisation), privatisation of companies or assets can potentially be
contested, however selectively.
If the legitimacy of privatisation of a company or an asset is contested and Sistema or its portfolio
company is unable to defend its position in the dispute, Sistema may lose its ownership stakes in the
relevant company or its assets, which may have a material negative impact on the business, financial
situation, performance and growth prospects of the Corporation.
Anti-corruption rules
The operations of Sistema and its portfolio companies are regulated by the anti-corruption laws of
relevant jurisdictions, including Russian law, the UK Bribery Act and/or the US Foreign Corrupt
Practices Act (FCPA). Any investigation into potential violations of the FCPA, UK Bribery Act or other
anti-corruption laws of the US, UK, or other jurisdictions may affect Sistema’s reputation, business,
financial situation and performance .
Competition
All business segments where Sistema operates are open to competition. Telecom, high-tech, banking,
retail, tourism, private healthcare, pharma, property development, forestry and agricultural markets in
Russia and elsewhere are highly competitive. Any inability on the part of Sistema’s companies to
compete efficiently may have a material negative impact on Corporation’s business, performance,
financial situation or growth prospects.
Brand quality and reputation
Developing and maintaining brand awareness for the Group’s companies is crucial to shaping the public
opinion about their existing and future products and services. Sistema believes that company brand
becomes increasingly vital in highly competitive markets. Successful development and improvement of
brand awareness depends in large part on the efficiency of marketing and ability to provide quality
products and services at competitive prices. Effort and money spent on brand development may prove
greater than incomes they yield, which means potential financial losses for the Group companies.
Risk appetite
One of the key principles of risk management in Sistema Group is the use of risk appetite. This approach
implies identifying and monitoring of the Corporation’s target risk profile in accordance with its strategic
goals and in the context of their integration into risk management procedures.
Sistema Group’s risk appetite determines the level of risks acceptable for the shareholders, and includes
the following basic provisions:
The amount of potential losses under the risks accepted by Sistema should not reach a level leading to
the termination of the Group’s operations, including under stressed conditions;

63
The structure of cash flows of Sistema companies should guarantee the timely fulfilment of
obligations to customers in the short and long term;
In its operations, Sistema aims to avoid an increased concentration of risk by counterparties,
industries, and countries/regions;
Sistema’s companies must comply with the requirements of national regulators of their countries of
operation, and the standards and recommendations of international bodies;
Sistema’s companies should maintain an impeccable business reputation and avoid actions that could
undermine it;
Sistema’s companies should maintain and improve their external individual credit ratings issued by
international rating agencies.

64
6. CORPORATE GOVERNANCE SYSTEM
Corporate governance principles
High quality corporate governance and informational transparency are key principles underpinning
Sistema’s investment strategy. The Corporation aims to match the highest international standards of
corporate governance and informational transparency, while supporting effective managerial decision-
making, to increase Sistema’s long-term appeal for investors.
Sistema’s corporate governance system is based on the following principles:
transparency of management processes for investors and partners;
a predictable and progressive dividend policy;
a professional Board of Directors that is actually involved in strategic planning, management and
supervision of business processes;
development of and compliance with investment decision-making procedures;
particular focus by the Board of Directors on related-party transactions and conflicts of interest;
continuous development of corporate governance at Sistema Group companies.
Sistema is guided by these principles in all of its activities, including strategic and financial management,
HR and social policy, preparation of financial statements, control and audit, and risk management. These
principles are paving the way for strengthening the Corporation’s investment case.
In accordance with Russian law and international best practice, the Corporation’s Charter and internal
regulations underpin its corporate governance principles and procedures, as well as the composition,
procedures and powers of its governance and control bodies.
Sistema’s Corporate Governance and Ethics Code sets out the additional commitments of the
Corporation, its senior management and employees regarding social responsibility, transparency and
ethical business principles.
In its corporate governance practices Sistema abides by the Corporate Governance Code recommended by
the Bank of Russia (Letter of the Bank of Russia No. 06-52/2463,10
dated April 10, 2014), the guidelines
set out in the UK Corporate Governance Code11
and Moscow Exchange’s Listing Rules.
In accordance with its Charter, Sistema’s key corporate governance bodies are the:
General Meeting of Shareholders;
Board of Directors;
President;
Management Board.
10 Available here: http://www.cbr.ru/sbrfr_new/files/legislation/letters/2014/Inf_apr_1014.pdf 11 Available here: https://www.frc.org.uk/Our-Work/Publications/Corporate-Governance/UK-Corporate-Governance-Code-2014.pdf

65
6.1. General Meeting of Shareholders
Principles of operation
In line with the Federal Law on Joint-Stock Companies and Sistema’s Charter, the General Meeting of
Shareholders is the Corporation’s supreme governance body. Its activities and authority are governed by
Russian legislation on joint-stock companies, the Corporation’s Charter and the Terms of Reference of
the General Meeting of Shareholders.
All materials for general meetings of shareholders are made available to shareholders in Russian and in
English and are published on Sistema’s website (www.sistema.ru; www.sistema.com). Shareholders are
notified of forthcoming meetings and are sent ballot papers for voting. Over the past four years (2013-
2016) general meetings of shareholders have been held at Sistema’s head office.
Observance of shareholders’ rights
Participation in general meetings of shareholders and voting on agenda items
Sistema aims to fully guarantee shareholders’ right to participate in the running of the Corporation
through participating in general meetings of shareholders and voting on agenda items, as well as the right
to receive a share of profits as dividends.
To secure shareholders’ right to take part in general meetings in accordance with the Corporation’s
Charter, a notice of the general meeting of shareholders and ballot papers are circulated to all
shareholders at least 30 days before the meeting. All materials for the meeting are made available to
shareholders in Russian and in English and are published on Sistema’s website (www.sistema.ru and
www.sistema.com). Notices of general meetings of shareholders, ballot papers and all other materials are
also sent to nominal shareholders in electronic form.
Ballot papers may be completed by shareholders in advance and mailed to Sistema (to the address
specified in the ballot paper) before the meeting. Votes of shareholders who cast their ballots in this way
will be counted during the main vote count. Shareholders are also allowed to vote in electronic form
(provided that their depositary offers this service).
GDR holders may vote on agenda items by proxy vote in accordance with the established procedure via a
depositary bank servicing Sistema’s GDR programme. In 2016, Sistema’s depositary bank was Citibank,
N.A. More information on the depositary bank and voting procedures is available here:
www.citiadr.idmanagedsolutions.com. Votes of GDR holders for whom the depositary bank holds
information are collected by the depositary bank via clearing systems and are included in the general
ballot, along with all votes cast for and against proposed draft resolutions, as well as indicted abstentions.
Shareholders can also attend general meetings in person or participate through a representative and vote
on agenda items directly at the meeting (if the meeting is held with in-person attendance).
Voting results from in-person meetings are announced before the end of the meeting, and are also made
available to shareholders on the Corporation’s website one day after the meeting minutes have been
compiled.
Shareholders’ access to the Corporation’s documentation
An important guarantee of shareholders’ right to participate in the running of the company is the right to
access documents that the Corporation is obliged to keep by the Federal Law on Joint-Stock Companies.
To exercise this right, shareholders can send a written request to the Corporate Secretary asking for access
to the documents they wish to see. After the time for providing the documents is agreed upon, the
documents will be provided to the shareholder. Shareholders granted access to confidential documents
undertake a written non-disclosure obligation, in order to safeguard the rights of all the Corporation’s

66
shareholders. Shareholders who require copies of documents bear the Corporation’s costs (RUB 10 per
page).
Proposing agenda items for the general meeting of shareholders, and nominating candidates to the
Corporation’s governance bodies
Owners of significant stakes (at least 2% of Sistema’s authorised capital) have the right to make proposals
for the agenda of the general meeting of shareholders and to nominate candidates to the Corporation’s
governance and control bodies12
. Proposals for the agenda of the Annual General Meeting of shareholders
(AGM), including any notes attached thereto in accordance with the Terms of Reference of the General
Meeting of Shareholders of Sistema PJSFC and other internal regulations of the Corporation, are accepted
in writing within 100 days after the end of the financial year.13
Candidates nominated by shareholders to
governance and control bodies are provisionally reviewed by the Board’s Nomination, Remuneration and
Corporate Governance Committee.
Results of general meetings of shareholders held in 2016
On 25 June 2016, the AGM:
I. approved the annual report and financial statements for 2015;
II. distributed dividends for the full year 2015 of RUB 6,465,500,000.00, or RUB 0.67 per ordinary
share;
III. elected the Board of Directors and Audit Review Commission;
IV. approved the Corporation’s external auditors;
V. approved the revised Charter and Terms of Reference of the Board of Directors.
The AGM was attended by the shareholders together holding 79% of votes.
Dividend policy
To ensure shareholders’ right to receive a share of the Company’s profits in the form of dividends, the
Corporation announces the amount of dividends recommended by the Board of Directors and the record
date in advance. As a result, shareholders are able to take informed decisions with respect to disposing of
their shares.
To determine the recommended amount of dividends payable for 201514
, the Board of Directors followed
the dividend policy approved in October 2011. Under the policy, the amount of dividends payable was to
be at least 10% of Sistema Group’s net income generated during the previous financial year to
International Financial Reporting Standards and at least 10% of net cash income generated by the
Corporation’s investment transactions over the same period (special dividend).
In 2016, Sistema’s Board of Directors approved a revised dividend policy. In line with the new policy,
total dividends recommended for each reporting year will be, at a minimum, the higher of either an
amount equivalent to a dividend yield of at least 4%, or RUB 0.67 per ordinary share. The Corporation
also set itself the goal of paying dividends twice a year: for the first half of a reporting year and for a full
reporting year. This approach enables Sistema to pay predictable dividends, ensuring transparency of the
procedure for determining the amount of dividend payouts and strengthening the Corporation’s
investment case.
In accordance with the new Dividend Policy, the Board of Directors in August 2016 recommended
payment of an interim dividend for the first half of 2016.
12 Holders of 10 and more % of the Company’s voting shares also have the right to request that an Extraordinary General Meeting of shareholders
(EGM) be convened. 13 In the event an EGM is conducted with its agenda containing an item on election of the Board of Directors, holders of sufficient blocks of shares are entitled to nominate candidates to the Board of Directors. Proposals to this effect must be received by the Company no later than 30
days before the date of such a meeting.

67
On 23 September 2016, an EGM approved payment of RUB 3,667,000,000 in dividends, or RUB 0.38
per ordinary share.
The EGM was attended by shareholders together holding 77.8% of voting rights.
In 2016 the Corporation paid dividends as follows:
1) For FY 2015: RUB 6,465,500,000 or RUB 0.67 per ordinary share (RUB 13.40 per GDR), for a
dividend yield of 3.8%.
2) For 6M 2016: RUB 3,667,000,000 or RUB 0.38 per ordinary share (RUB 7.60 per GDR), for a
dividend yield of 4%.
In April 2017, after the end of the reporting period, the Board of Directors made further amendments to
the Dividend Policy and approved increases of minimum annual dividend yield to 6% from 4% and
minimum dividend per share to RUB 1.19 from RUB 0.67. This revised approach to distribution of
dividends allows the Corporation to increase the total amount of dividends paid, thereby increasing
shareholder returns and strengthening the Corporation’s investment case.

68
6.2 Board of Directors
The Board of Directors is a collective governance body in charge of oversight and strategic management.
Under Sistema’s Charter the Board’s responsibilities include:
supervising the operations of the Corporation in general;
formulating strategic and financial development plans;
determining investment principles and criteria;
assessing the performance of the management team;
setting the principles of corporate governance;
approving transactions in accordance with applicable legislation and the Corporation’s internal
regulations.
Composition of the Board of Directors
The Board of Directors effective as of 31 December 2016 was elected at the Company’s AGM on 25 June
2016. Independent members of the Board of Directors form a majority (55%).
composition of the Board of Directors
from 1 January to 25 June 2016,
(elected on 27 June 2015)
composition of the Board of Directors
from 25 June to 31 December 2016,
(elected on 25 June 2016)
1. 1 Vladimir Evtushenkov
(Chairman)
Vladimir Evtushenkov
(Chairman)
2. Sergey Boev
(Deputy Chairman)
Sergey Boev
(Deputy Chairman)
3. Brian Dickie15
Andrey Dubovskov
4. Andrey Dubovskov Felix Evtushenkov
5. Felix Evtushenkov Patrick Clanwilliam15
6. Dmitry Zubov Robert Kocharyan16
7. Patrick Clanwilliam17
Jeannot Krecké15
8. Robert Kocharyan15
Peter Mandelson15
9. Jeannot Krecké15
Roger Munnings15
10. Peter Mandelson15
Mikhail Shamolin
11. Roger Munnings15
David Iakobachvili15
12. Mikhail Shamolin
13. David Iakobachvili15
In 2015, the general meeting of shareholders approved a reduction in the number of Board members from
13 to 11. The main change from the 2015-2016 corporate year is that Brian Dickie and Dmitry Zubov left
the Board.
Meetings of the Board of Directors
Board meetings are held regularly in compliance with the adopted annual Board work plan, which
developed based on Sistema’s strategic planning and reporting cycle.
In 2016, the Board of Directors of Sistema PJSFC held 13 meetings: 8 scheduled in-person meetings and
5 unscheduled meetings in the form of a letter ballot (an absentee vote). In 2016, the Company’s Board of
Directors considered 101 agenda items, an 11% increase from the previous year:
15 Independent directors meeting the independence criteria of Moscow Exchange’s Listing Rules. 16 In accordance with Moscow Exchange’s Listing Rules the Corporation recognised Robert Kocharyan as independent. Information on this
decision was disclosed on Sistema’s website. 17 Patrick Clanwilliam was nominated to the Board of Directors by a group of minority shareholders.

69
2016 2015
Number of in-person meetings 8 8
Number of absentee votes 5 3
Number of items in accordance with the Board’s work plan 43 40
Actual number of items reviewed by the Board 101 91
Over the reporting period the Board of Directors considered the following key items:
1) Sistema’s development strategy.
2) Sistema’s asset portfolio structure.
3) Sistema Group’s strategic planning cycle.
4) Sistema’s investment policy and priority investment areas in 2016-2017.
5) Development strategy, value creation and monetisation strategy of key portfolio assets in the
following sectors:
telecom;
consumer (retail) including e-commerce;
agricultural;
forest products;
banking;
high-tech;
real estate and development;
healthcare;
pharmaceuticals;
power grids;
hotels.
6) Sistema’s results and performance against budget.
7) Budget planning, approval of Sistema’s consolidated budget management KPIs for 2017.
8) Functional strategies (for financial management and financial planning, investor relations etc).
9) Placement of securities (registration-exempt bonds).
10) Risk and opportunity management.
11) Report of the Internal Control and Audit Department.
12) HR issues, HR management and personnel motivation.
13) Assessment of corporate governance including the self-assessment results of the Board and its
committees.
14) Sistema’s corporate social responsibility.
15) Mandatory corporate procedures, including convening the AGM and developing the Board’s work
plan.
16) Composition of Board Committees and determining the status of Board members.
17) Approval of internal regulations.
18) Approval of transactions, including acquisition of equity stakes.
Most agenda items at Board meetings in 2016 related to strategies of the Corporation and its portfolio
companies, approval of transactions (including equity holdings in Sistema Group companies) and
corporate governance. The Board of Directors focuses on considering new investment projects and
building a portfolio strategy, including asset monetisation. In 2016 the number of items related to
business strategies and investments increased by 25% from 2015.
Preparation for Board meetings and attendance rates
Procedures for Board meetings aim to use the time and experience of Board members efficiently, to
enable them to take important decisions affecting the Corporation’s strategic development. Agenda

70
materials are made available via the Board’s electronic portal at least 10 days before each meeting, to
give members enough time to form an informed opinion on all agenda items. Most agenda items
(including approval of transactions) undergo a mandatory preliminary review at meetings of the Board’s
Committees.
Board members meet with speakers on the agenda items and the Corporation’s management at a business
dinner the evening before each meeting, where they can get clarifications on all agenda matters.
Board meetings usually have a high attendance rate. The average attendance in 2016 was 96%.
Participation of Board members in meetings of the Board of Directors and its Committees in 2016
Board of
Directors
Strategy
Committee
Audit,
Finance and
Risk
Committee
Nomination,
Remuneration
and Corporate
Governance
Committee
Ethics and
Control
Committee
Investor
Relations and
Dividend
Policy
Committee
Attendance
V.
Evtushenkov 12/13
18 12/12 - - - -
S. Boev 13/13 6/12 6/7 3/3 6/7 -
B. Dickie 19
6/6 - - 3/3 3/4 -
A. Dubovskov 13/13 10/12 - - - -
F. Evtushenkov 12/13 2/12 - - 3/7 -
D. Zubov19
6/6 - - 2/3 - -
P. Clanwilliam 13/13 - 6/6 - - 7/7
R. Kocharyan 13/13 6/12 - 6/6 7/7 -
J. Krecké 13/13 - 12/13 - - 7/7
P. Mandelson 11/13 - 4/7 2/3 1/3 -
R. Munnings 13/13 - 13/13 6/6 7/7 7/7
M. Shamolin 13/13 12/12 - - - 0/7
D. Iakobachvili 12/13 5/12 12/13 5/6 - 7/7
Committees of the Board of Directors
Sistema PJSFC has five committees of the Board of Directors:
Strategy Committee;
Audit, Finance and Risk Committee;
Nomination, Remuneration and Corporate Governance Committee;
Ethics and Control Committee;
Investor Relations and Dividend Policy Committee;
The main role of the Committees is to provide assistance to the Board in preparation and adoption of
decisions in specific functional areas, as well as to ensure in-depth review of matters before they are
brought forward for consideration by the Board of Directors. Meetings of the Committees (except the
Strategy Committee) usually take place on the day preceding a full Board meeting.
The Committees of the Board of Directors have broad procedural powers, and have the right (within their
remit) to engage independent external experts and to obtain all necessary information from the executive
18 The first number denotes the number of meetings attended by the Board member, the second number stands for the total number of meetings
the member could have participated in. 19 Member of Sistema’s Board of Directors until 25 June 2016

71
management of the Corporation, to use other resources of the Corporation, and to set tasks for the
management of the Corporation.
Functions of the Board Committees
Name of the Committee Functions of the Committee
Strategy Committee
analysis of strategic issues related to Sistema Group management ;
review of strategic planning methodology;
consideration of M&A transactions and large investment projects.
Audit, Finance and Risk
Committee
preparation and audit of the Corporation’s financial statements;
interaction with the Corporation’s external auditors;
assessment of the risk management system and compliance with
the applicable legal requirements for financial reporting, audit and
planning;
preliminary appraisal of transactions submitted to the Board of
Directors.
Nomination, Remuneration
and Corporate Governance
Committee
preliminary review of candidates:
for the Board of Directors of Sistema PJSFC;
for the Boards of Directors of portfolio companies;
for top management positions at the Corporation and its
portfolio companies;
for the position of the Corporation’s Corporate Secretary;
development of the Corporation’s incentive and remuneration
policies;
improving the corporate governance systems of the Corporation
and its portfolio companies, safeguarding shareholders’ interests
and rights.
Ethics and Control
Committee
corporate security;
monitoring compliance with the requirements of the Corporation’s
Code of Ethics;
corruption prevention system at the companies that make up
Sistema PJSFC.
Investor Relations and
Dividend Policy Committee
maintaining effective relations with the financial community and
government agencies, strengthening Sistema’s investment case;
developing Sistema’s dividend policy, including the development
of recommendations for the Corporation’s Board of Directors with
respect to the amount of dividends to be paid;
protection of the rights and interests of Sistema’s shareholders.
Strategy Committee
The Strategy Committee is an advisory body of the Board of Directors and is responsible for the
mandatory preliminary review of: all Sistema Group merger and acquisition projects with a value
exceeding $100m; all Sistema Group projects related to entering new regions or industries, all Sistema
Group projects with significant government participation.
The status, appointment procedures, powers and decision-making processes of the Strategy Committee
are regulated by the Terms of Reference of the Strategy Committee.
Membership of the Strategy Committee
Name of Board Member Position held
V. Evtushenkov
(Committee Chairman)
Chairman of the Board of Directors of Sistema PJSFC
S. Boev Deputy Chairman of the Board of Directors of Sistema PJSFC
A. Dubovskov Management Board member of MTS, member of Sistema’s Board of
Directors
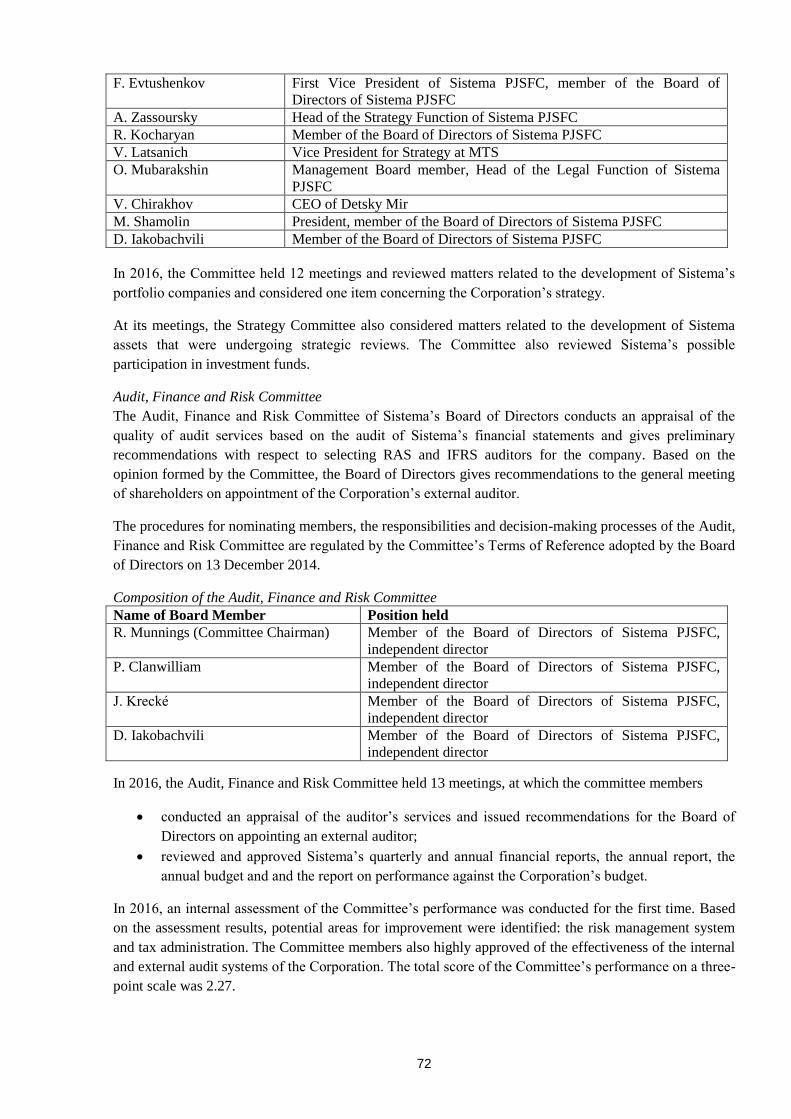
72
F. Evtushenkov First Vice President of Sistema PJSFC, member of the Board of
Directors of Sistema PJSFC
A. Zassoursky Head of the Strategy Function of Sistema PJSFC
R. Kocharyan Member of the Board of Directors of Sistema PJSFC
V. Latsanich Vice President for Strategy at MTS
O. Mubarakshin Management Board member, Head of the Legal Function of Sistema
PJSFC
V. Chirakhov CEO of Detsky Mir
M. Shamolin President, member of the Board of Directors of Sistema PJSFC
D. Iakobachvili Member of the Board of Directors of Sistema PJSFC
In 2016, the Committee held 12 meetings and reviewed matters related to the development of Sistema’s
portfolio companies and considered one item concerning the Corporation’s strategy.
At its meetings, the Strategy Committee also considered matters related to the development of Sistema
assets that were undergoing strategic reviews. The Committee also reviewed Sistema’s possible
participation in investment funds.
Audit, Finance and Risk Committee
The Audit, Finance and Risk Committee of Sistema’s Board of Directors conducts an appraisal of the
quality of audit services based on the audit of Sistema’s financial statements and gives preliminary
recommendations with respect to selecting RAS and IFRS auditors for the company. Based on the
opinion formed by the Committee, the Board of Directors gives recommendations to the general meeting
of shareholders on appointment of the Corporation’s external auditor.
The procedures for nominating members, the responsibilities and decision-making processes of the Audit,
Finance and Risk Committee are regulated by the Committee’s Terms of Reference adopted by the Board
of Directors on 13 December 2014.
Composition of the Audit, Finance and Risk Committee
Name of Board Member Position held
R. Munnings (Committee Chairman) Member of the Board of Directors of Sistema PJSFC,
independent director
P. Clanwilliam Member of the Board of Directors of Sistema PJSFC,
independent director
J. Krecké Member of the Board of Directors of Sistema PJSFC,
independent director
D. Iakobachvili Member of the Board of Directors of Sistema PJSFC,
independent director
In 2016, the Audit, Finance and Risk Committee held 13 meetings, at which the committee members
conducted an appraisal of the auditor’s services and issued recommendations for the Board of
Directors on appointing an external auditor;
reviewed and approved Sistema’s quarterly and annual financial reports, the annual report, the
annual budget and and the report on performance against the Corporation’s budget.
In 2016, an internal assessment of the Committee’s performance was conducted for the first time. Based
on the assessment results, potential areas for improvement were identified: the risk management system
and tax administration. The Committee members also highly approved of the effectiveness of the internal
and external audit systems of the Corporation. The total score of the Committee’s performance on a three-
point scale was 2.27.

73
Nomination, Remuneration and Corporate Governance Committee
The purpose of the Committee is to facilitate the preparation and implementation of the Corporation’s HR
policy and support and develop an efficient corporate governance system that meets international
standards and help improve the quality of decision-making by the Corporation. The Committee conducts
regular monitoring of Sistema Group’s potential HR needs and succession pool.
The Committee operates in accordance with the Terms of Reference of the Nomination, Remuneration
and Corporate Governance Committee adopted by the Board of Directors on 13 December 2014 and
amended on 29 October 2016.
Nomination, Remuneration and Corporate Governance Committee
Name of Board Member Position held
R. Kocharyan (Committee
Chairman)
Member of the Board of Directors of Sistema PJSFC, independent
director
S. Boev Member of the Board of Directors of Sistema PJSFC
P. Mandelson Member of the Board of Directors of Sistema PJSFC, independent
director
R. Munnings Member of the Board of Directors of Sistema PJSFC, independent
director
D. Iakobachvili Member of the Board of Directors of Sistema PJSFC, independent
director
The President of Sistema PJSFC M. Shamolin attends the Committee meetings in the capacity of a
permanent invitee and does not vote on matters submitted to the Committee for consideration.
In 2016, the Nomination, Remuneration and Corporate Governance Committee held six meetings
(including one joint meeting with the Ethics and Control Committee) and reviewed the following items:
development of corporate governance across Sistema Group;
incentive schemes, performance assessments and remuneration systems;
HR processes and preliminary review of candidates for senior management positions at Sistema
PJSFC and nominees for the boards of directors and CEO positions at key portfolio companies;
The Nomination, Remuneration and Corporate Governance Committee of Sistema PJSFC also organises
the self-assessment procedure of the Board of Directors. The assessment looks at ten key criteria in order
to identify those areas in the work of the Board of Directors that are in need of improvement. The
Committee uses the results of self-assessment to make an annual plan aimed at developing Sistema’s
corporate governance systems, which is then submitted to the Board of Directors for approval.
Ethics and Control Committee
The Ethics and Internal Control Committee serves the purpose of forming an efficient system of
economic security, internal control and prevention of fraud and other potentially illegal misconduct. The
Committee abides by the Terms of Reference of the Ethics and Control Committee approved by the
Corporation’s Board of Directors.
Composition of the Ethics and Control Committee
Name of Committee
Member
Position held
S. Boev (Committee
Chairman)
Deputy Chairman of the Board of Directors of Sistema PJSFC
F. Evtushenkov First Vice President of Sistema PJSFC, member of the Board of
Directors of Sistema PJSFC
R. Kocharyan Member of the Board of Directors of Sistema PJSFC, independent
director

74
P. Mandelson Member of the Board of Directors of Sistema PJSFC, independent
director
R. Munnings Member of the Board of Directors of Sistema PJSFC, independent
director
In 2016, the Ethics and Control Committee met seven times and reviewed, inter alia, the following
matters:
performance of the Internal Control and Audit Department in 2015 and work plan for 2017;
a report on risk management at Sistema;
results of an ethics assessment at the Corporation;
methods of preventing and curbing fraud and corruption at Sistema.
Investor Relations and Dividend Policy Committee
The Investor Relations and Dividend Policy Committee aims to strengthen the Corporation’s investment
case; it develops and maintains a transparent and stable dividend policy; it supports effective relations
with the financial community and government agencies.
The Committee abides by the Terms of Reference of the Investor Relations and Dividend Policy
Committee approved by the Board of Directors.
Composition of the Investor Relations and Dividend Policy Committee
Name of Committee
Member
Position held
D. Iakobachvili (Committee
Chairman)
Member of the Board of Directors of Sistema PJSFC, independent
director
P. Clanwilliam Member of the Board of Directors of Sistema PJSFC, independent
director
J. Krecké Member of the Board of Directors of Sistema PJSFC, independent
director
R. Munnings Member of the Board of Directors of Sistema PJSFC, independent
director
M. Shamolin President, member of the Board of Directors of Sistema PJSFC
In 2016, seven meetings of the Investor Relations and Dividend Policy Committee were held, at which,
inter alia, the following matters were considered:
amendments to the Corporation’s dividend policy;
corporate social responsibility and the operations of the Sistema Charitable Foundation;
items related to market analysis and monitoring, the perception of Sistema PJSFC by the
investment community and implementation of measures to increase market capitalisaion.

75
6.3 President
The President of Sistema PJSFC is a permanent chief executive officer whose main tasks include
managing the current operations of the Corporation and dealing with matters outside the remit of the
General Meeting of Shareholders, the Board of Directors, and the Management Board with the aim of
ensuring the Corporation’s profitability and safeguarding the rights and legitimate interests of its
shareholders. The President reports to the Board of Directors and the General Meeting of Shareholders of
Sistema PJSFC.
Mikhail Shamolin has been Sistema’s President since 10 March 2011. On 10 March 2017, the Board of
Directors re-appointed Mikhail Shamolin as President of Sistema PJSFC for a three-year term.
Mikhail Shamolin
President of Sistema
PJSFC,
Chairman of the
Management Board.
Was born in Moscow in 1970.
Graduated from the Moscow Automobile and Road Technical Institute
in 1992, and from the Russian Presidential Academy of Public
Administration in 1993.
In 1996-1997, completed a finance and management course for senior
executives at the Wharton School of Business.
In 1998-2004, worked for McKinsey&Co, an international consultancy
firm.
In 2004-2005, Managing Director for Ferroalloys at Interpipe Corp
(Ukraine).
In 2005-2011, Vice President for Sales and Customer Service, then Vice
President, Head of MTS Russia and President of MTS.
On 10 March 2011, appointed President of Sistema PJSFC. Sistema’s
Board of Directors reappointed Mr Shamolin as President and
Management Board Chairman for a new three-year term twice: on 15
March 2014 and on 10 March 2017.
Member of the Board of Trustees of Sistema Charitable Foundation.

76
6.4 Management Board
Sistema’s Management Board determines methods and means for implementation of the Corporation’s
development strategy, formulates development plans, determines and monitors investment processes,
conducts assessment of personnel performance, and reviews most of the matters that are subsequently
submitted to the Corporation’s Board of Directors.
In 2016, the Management Board conducted 30 meetings and reviewed 82 agenda items in the following
key areas:
1) Preliminary review of the matters to be submitted to the Board of Directors, including:
Sistema’s development strategy;
Sistema’s asset portfolio structure;
Sistema Group’s strategic planning cycle;
development and value creation strategies for Sistema’s key assets;
Sistema’s functional strategies;
performance against budgets and budget planning;
Sistema’s corporate social responsibility;
approval of specific deals.
2) Debt and liquidity management.
3) Risk management and preparation of risk maps.
4) Participation in investment projects.
5) Review of deals requiring no approval from the Board of Directors or the General Meeting of
Shareholders.
In September 2015, upon expiry of the term of the previous Management Board, Sistema’s Board of
Directors formed a new Management Board for another three-year term. Sistema’s current Management
Board comprises 14 members.
Members of the Management Board of Sistema PJSFC as of 31 December 2016
1. Mikhail Shamolin Chairman
2. Elena Vitchak
3. Alexander Gorbunov
4. Felix Evtushenkov
5. Artyom Zassoursky
6. Valentin Korchunov20
7. Leonid Monosov
8. Oleg Mubarakshin
9. Vsevolod Rozanov
10. Ali Uzdenov
11. Mikhail Cherny
12. Evgeny Chuikov
13. Sergey Shishkin
14. Vladimir Shukshin
20 Upon completion of the reporting period in 2017 Elena Vitchak and Valentin Korchunov left the Management Board.

77
Changes to Sistema’s Management Board in 2016
In 2016, the Management Board went through a number of changes:
N. Vasilkov 12 March 2016 Membership terminated.
A. Zassoursky 21 May 2016 Elected to the Management Board, appointed Vice
President, Head of the Strategy Function of Sistema
PJFSC.
After the reporting period, in 2017 the following new members were elected to the Management Board:
A. Guryev (Vice President, Head of HR Department) and A. Sirazutdinov (Vice President, Investment
Portfolio Manager).

78
6.5 The President’s Committees
The following committees chaired by the President contribute to the improvement of managerial decision-
making:
Finance and Investment Committee;
Tender Committee;
HR Committee;
Security Committee;
Internal Control Committee;
Disciplinary Committee.
The President’s Committees are permanent consultative collective bodies tasked with detailed analysis of
current affairs and processes within their remit and with assisting the President in decision-making.
Finance and Investment Committee
The responsibilities of the Finance and Investment Committee include:
review of all of the Corporation’s investment projects and certain projects of portfolio companies
at different stages from project idea to completion;
approval of financial models, business plans, and key performance indicators of investment
projects;
making recommendations regarding the feasibility of projects, exit scenarios and sources of
financing;
analysing the terms of external financing for the Corporation and portfolio companies.
The Committee consists of 10 members. The Chairman of the Committee is the Corporation’s President
Mikhail Shamolin, and the Deputy Chairman is Senior Vice President, Head of the Finance and
Investment Function Vsevolod Rozanov.
In 2016, the Committee met 60 times.
An Expert Council operates under the Finance and Investment Committee and considers all new
investment ideas of the Corporation for acquiring new assets operating in new or multiple industries, as
well as in sectors where Sistema already has a presence.
The Expert Council consists of 11 members: the Expert Council is chaired by Vice President, Head of the
Strategy Function of Sistema PJSFC, A. Zassoursky.
In 2016, the Expert Council met 15 times.
The Finance and Investment Committee also has a Risk Subcommittee responsible for assessing the risks
facing Sistema and its subsidiaries and for monitoring performance against risk management action plans.
The Risk Subcommittee consists of nine members. As of 31 December 2016, the Subcommittee was
chaired by Sistema’s Managing Director for Risks and Procurement N. Nosova.
In 2016, the Risk Subcommittee met 10 times.
Tender Committee
The responsibilities of the Tender Committee include:
organising tenders for goods, works, and services;
ensuring acquisition of goods, works, and services on the best possible terms;

79
ensuring the transparency of purchasing procedures;
facilitating prevention of corruption and other wrongdoing in the area of purchasing.
The Committee consists of 11 members. The Chairman of the Committee is Senior Vice President, Head
of Sistema’s Finance and Investment Function V. Rozanov. The Deputy Chairman is Executive Vice
President for Finance and Economic Affairs A. Kamensky.
In 2016, the Tender Committee met 36 times.
HR Committee
The responsibilities of the HR Committee include:
reviewing and making proposals with regards to the HR policies and internal regulations
at the Corporation and its portfolio companies;
coordinating the activities of HR units of the Corporation and portfolio companies;
assessing candidates for senior executive positions;
assessing the efficiency and performance of the Corporation’s employees.
The Committee consists of nine members. The Chairman of the Committee is the President of Sistema
PJSFC M. Shamolin.
In 2016, the Committee met 15 times.
Security Committee
The Security Committee reviews matters related to implementation of the adopted security policy across
Sistema Group.
The Committee consists of 32 members. The Chairman of the Committee is Vice President, Head of the
Security and IT Department of Sistema PJSFC V. Shukshin.
In 2016, the Committee met four times.
Disciplinary Committee
The Disciplinary Committee reviews matters pertaining to compliance with labour law, internal
regulations and instructions of the company’s governance bodies, and develops recommendations on
whether there are reasons for imposing disciplinary penalties on employees.
The Committee consists of six members. The Chairman of the Committee is the President of Sistema
PJSFC M. Shamolin.
In 2016, the Committee met six times.

80
6.6 Specific characteristics of risk management, internal control and internal audit systems
Risk management
The Sistema PJSFC risk management system uses a two-level approach where risks identified in Sistema
and its portfolio companies are consolidated to assess their impact on Sistema Group as a whole.
The integrated risk management system (ERM) used in the Corporation addresses the following tasks:
identification of risks at all levels of management (from top to line management), which includes
identifying risk owners and creating risk passports;
primary assessment of the materiality of identified risks and their analysis (VaR methodology);
ranging risks by management levels;
assessment of the aggregate influence of material risks on the Corporation’s key financial
indicators (Monte Carlo modelling);
development of plans to mitigate identified risks at all management levels;
regular monitoring of performance against mitigation plans and assessment of their effectiveness;
risk monitoring, quarterly reports on risks facing the Corporation.
The risk management procedures of Sistema PJSFC are carried out by a dedicated risk management unit.
The Corporation’s risks are monitored on a quarterly basis by Sistema’s Management Board and Risk
Subcommittee, which review the effects of mitigation and response measures taken and reassess
persisting and/or new risks.
Sistema’s senior executives make regular reports on risk management in the Corporation to the Audit,
Finance and Risk Committee. The annual report is submitted to the Board of Directors of Sistema PJSFC.
Internal control system
In February 2015, the Board of Directors approved the Policy on the Internal Control System setting out
the key principles of internal control and defining it as a continuous integrated process involving all of the
Corporation’s subdivisions and governance bodies.
The key objectives of the internal control system are:
creating control mechanisms that will ensure the efficiency of business processes and the
implementation of investment projects of the Corporation;
ensuring safety of the Corporation’s assets and efficient use of its resources;
protecting the interests of the Corporation’s shareholders and preventing and resolving conflicts
of interest;
creating conditions for timely preparation and submission of reliable reports and other
information that is legally required to be publicly disclosed;
ensuring the Corporation’s compliance with applicable laws and regulatory requirements.
In accordance with the “three lines of defence” principle the efficiency of the Corporation’s internal
control system is ensured at three levels (in addition to the Board of Directors and the top management of
the Corporation):
Level 1: Heads of subdivisions and employees of the Corporation are responsible for assessing
and managing risks and building an efficient internal control system within their remit;
Level 2: At this level the function is performed by several subdivisions and Committees of the
Corporation. For example:

81
the risk management function and the risk committee are responsible for
developing and monitoring the implementation of an effective risk management
practice;
the Finance and Investment Committee of the Corporation approves and
monitors the implementation of investment projects;
the Discipline Committee reviews matters related to breaches of the Ethics Code
and disciplinary offences;
the Security and IT Department is responsible, among other things, for economic
security, corruption prevention and information security.
Level 3: The Internal Control and Audit Department conducts an independent assessments of the
efficiency of the internal control system, the risk management procedures, and the corporate
governance system.
All of the Corporation’s employees in charge of various control procedures bear responsibility for the
efficiency of such controls and risk management activities as prescribed in their job descriptions and
internal regulations.
Internal audit
The body in charge of internal control at the Corporation and the companies of Sistema Group is the
Internal Control and Audit Department that reports to the Board of Directors (functionally) and Sistema’s
President (administratively). The head of the Department is appointed and dismissed by the President
based on the resolutions passed by the Corporation’s Board of Directors following preliminary approval
by the Board’s Ethics and Control Committee.
The main objectives of the Internal Control and Audit Department are:
helping shareholders and the management improve the internal control system by performing
regular audits of efficiency of the Corporation’s internal control, risk management, and corporate
governance systems;
facilitating the attainment of the Corporation’s strategic goals;
supplying the Corporation’s management and shareholders with objective information on the
existing internal risks and their probability;
enhancing the awareness of the Corporation’s management about the performance of Sistema
Group companies;
monitoring achievement of the goals of shareholders of the Corporation and Sistema Group
companies.
To meet these objectives, the Internal Control and Audit Department carries out the following functions:
performing independent audits of individual operations, processes, and units;
assessing the efficiency of the internal control system;
assessing the efficiency of the risk management system;
assessing the efficiency of the corporate governance system, preventing violations of the law and
the Corporation’s regulations, ensuring observance of professional and ethical standards, and
preparing recommendations for improvement thereof;
developing recommendations to remedy deficiencies identified and monitoring remediation
thereof;

82
examining and evaluating documents provided with regards to specific investment projects for
compliance with current regulations; performing scheduled and unscheduled monitoring of
performance against project targets;
ensuring uninterrupted functioning of the whistleblowing hotline;
administering investigations, including internal ones;
monitoring compliance with the Corporation’s internal regulations;
monitoring and investigating instances potentially qualifying as disciplinary offence and/or
violation of discipline and/or conflict of interest in the Corporation or Sistema Group companies.
The Internal Control and Audit Department interacts closely with the independent auditors, coordinates
audits and offers consultations in the course of preparation of the Department’s annual audit plans with
regard to assessment of the efficiency of internal controls applied to financial statements, as well as
during discussions and assessment of identified risks.
In 2016, the Internal Control and Audit Department conducted 44 scheduled and unscheduled audits to
assess the efficiency of internal control, risk management and corporate governance systems. The audits
performed by the Internal Control and Audit Department did not uncover any weaknesses or risks that
could affect the sustainability of the Corporation’s business.
Regular reports on the results of the Internal Control and Audit Department are reviewed by the Audit,
Finance and Risk Committee and Ethics and Control Committee of the Board of Directors of Sistema
PJSFC, and are also submitted for consideration by the Board of Directors at the end of the year.
Resolution of conflicts of interest
In December 2015, the Board of Directors of Sistema PJSFC approved a revised Code of Ethics that
provides for an ethics assessment procedure: the top managers of the Corporation and Sistema Group’s
subsidiaries are now required to complete ethics and conflict-of-interest declarations.
Before launching an ethics assessment procedure Sistema conducted a training course aimed at
familiarising employees with the revised Code of Ethics and the procedure of completing ethics
declarations.
The results of ethics assessment were reviewed by the President and the Ethics and Control Committee of
Sistema’s Board of Directors. In most cases the declared conflicts of interest were not confirmed and did
not require any resolution measures. However, action plans on conflict resolution were implemented with
respect to several declarants in accordance with best practice in corporate governance.
Ethics assessments makes it possible to identify and manage conflicts of interests in a timely manner, thus
preventing shareholders’ interests from being compromised.
External audit
In compliance with the decision of the Audit, Finance and Risk Committee, the Corporation uses the
following procedures to appoint the independent auditors of the financial statements of Sistema PJSFC.
The Committee performs annual assessments of the quality of audit services received. If the quality of
services provided by the current auditor is deemed insufficient, the Audit Committee organises a tender to
hire a new auditor. If the quality is deemed sufficient, Sistema negotiates the price of services with the
current auditor for the following period. According to the decision of the Audit, Finance and Risk
Committee, a tender for external audit services should be held at least every three years to ensure the
auditor’s impartiality and objectivity.

83
6.7 Development of the corporate governance system in 2016
Independent directors on the Corporation’s Board
In 2016, 11 members were elected to the Corporation’s Board of Directors, six of which qualify as
independent directors or are recognised as independent according to the rules of the Moscow Exchange
and the Russian Corporate Governance Code.
The current Board includes the following independent directors:
Patrick Clanwilliam;
Robert Kocharyan;
Jeannot Krecké;
Peter Mandelson;
Roger Munnings;
David Iakobachvili.
All of the Corporation’s independent directors have vast experience in managing large organisations and
possess strong professional reputations. Independent directors make up a majority on the Board, which
ensures the objectivity of their judgements and freedom from influence by the Corporation’s management
and shareholders when making important decisions.
Dividend policy
In April 2017, after the reporting period was over, the Board of Directors of the Corporation made new
amendments to the Dividend Policy providing for:
an increase in the total amount of dividends for any reporting year to an amount equivalent to an
annual dividend yield of at least 6% or RUB 1.19 per one share of the Corporation;
payment of interim dividends for 9 months of the reporting year.
The revised approach to distribution of dividends allows the Corporation to increase the amount of
dividends paid, thus increasing the shareholder returns on the Corporation’s securities and enhancing the
investment appeal of the Corporation.
Detailed information on the amount of dividends distributed and paid in 2010-2016 is available in the
section of this Annual Report devoted to payment of dividends on the company’s shares.
Top management co-investment programme
In May 2016, the Board of Directors approved a programme allowing Sistema’s senior managers to co-
invest in subsidiaries and /or Sistema PJSFC (hereinafter –”Co-investment Programme”). The Co-
investment Programme aims to increase top management’s motivation to boost the Corporation’s
capitalisation and provides for additional incentives linked to achievement of strong financial results
through originating and implementing projects and efficiently managing the Corporation’s assets,
including asset acquisition, sale, restructuring, capitalisation growth and increasing dividend flows. More
detailed information on the Co-investment Programme is available in Section 8 of this Annual Report.
Assessment of the work of the Board of Directors
The most recent assessment of the Board of Director’s work was performed in May 2016. As a result of
the analysis of the Board’s performance the total score on a 5-point scale was 4.16 (in 2015 the score was
4.02).
The Board of Directors’ performance was assessed on the basis of judgements made by the Board
members themselves.

84
As part of the assessment the Board members completed questionnaires containing the following sections:
(1) membership and structure of the Board of Directors; (2) procedures and organization of the Board of
Directors’ work; (3) organisation of the work of the Board’s Committees; (4) decisions of the Board of
Directors in the area of strategic planning; (5) decisions of the Board of Directors in the area of finance,
financial reporting and risk management; (6) decisions of the Board of Directors in the area of oversight
over executive management and corporate governance.
Moreover, each Board member was requested to specify general strengths and weaknesses of the Board
of Directors and indicate the projects and functional areas to which this Board member is capable of
contributing. The self-assessment results reflect the high effectiveness of the Board of Directors and its
Committees.
In accordance with the assessment results the action plan on improving the corporate governance system
for 2017 envisages increased involvement of professional independent directors in the analysis of
investment projects reviewed by the Board of Directors.
To this end, in the autumn of 2016, the Corporation introduced a procedure for challenging reports on the
items included in the Board’s agenda. In accordance with the procedure the Chairman of the Board of
Directors appoints one or several independent directors as opponents to ensure thorough consideration of
the presented materials. The work of such a group of opponents makes it possible to ensure an in-depth
and constructive discussion of each matter reviewed at the Board of Directors’ meeting.
Corporate governance ratings
In 2016, the Russian Institute of Directors (RID) conducted a repeated assessment of the corporate
governance practices of Sistema PJSFC in accordance with the updated methodology of the National
Corporate Governance Rating (NCGR). Sistema scored 8 on the NCGR scale, denoting “Advanced
corporate governance practice.”
RID assessed Sistema’s corporate governance by four criteria, identifying both strengths and areas in
need of further improvement:
shareholders’ rights,
activities of the governance and control bodies,
disclosure of information,
corporate social responsibility and sustainable development.
Institutional Shareholder Services (ISS) agency, which specialises in giving recommendations to
shareholders on voting at the general meetings of issuers, assigned Sistema a governance quality score of
1, implying the lowest possible risk for investors.
The ISS assessment is based on four components:
composition of the Board of Directors
top management remuneration,
shareholders’ rights,
audit system.
85
7. CORPORATE SOCIAL RESPONSIBILITY
Principles for responsible investment
Sistema’s investments in a number of critical and structurally important sectors of the Russian economy,
as well as the activities of its portfolio companies, have a significant economic, technological, social and
environmental impact on local communities.
The Corporation’s responsible approach to investment and business is based on universally recognised
international and national principles for CSR and sustainable development, as stipulated in the United
Nations Global Compact, ISO 26000 (Guidance on social responsibility), the Russian Union of
Industrialists and Entrepreneurs’ Social Charter of Russian Business and internal corporate documents.21
Key principles of the Corporation’s approach include:
Strict compliance with legislation and the norms of business ethics;
Zero tolerance for and prevention of corruption in all its forms;
Long-term contribution to regional development and support for local communities;
Investment in human capital and stimulation of innovation;
Creation of favourable working conditions and equal opportunities;
Observance of human rights and non-discrimination;
Minimisation of environmental impact;
Balance of stakeholder interests, openness and transparency.
For Sistema, all ten principles of the UN Global Compact covering human rights, labour, the environment
and anti-corruption are equally important. The Corporation shares the UN-backed Principles for
Responsible Investment (PRI), developed by an international group of major institutional investors in
collaboration with experts from the investment industry, intergovernmental organisations and civil
society. It is committed to implementing them in its investment practice by incorporating the risks and
opportunities associated with environmental, social and corporate governance (ESG) issues into both
investment analysis (portfolio strategy and preparation of deals) and development of operating strategies
and investment programmes for assets.
Sistema is interested in the sustainable development of its subsidiaries. The socioeconomic and
environmental performance of these subsidiaries underpins not only the successful creation of shareholder
value for the Corporation, but also the welfare of the state and society, including employees, consumers,
partners, suppliers and local communities.
Compliance with these requirements by Sistema’s new and existing assets is ensured by implementing
high standards of corporate governance and business ethics, as well as unified approaches to HR, risks
and procurement management, anti-corruption, CSR and charitable activities. Subsidiaries are directly
responsible for environmental and occupational safety, health and well-being of employees and
customers, product quality and reliability of services. Decisions are made with the involvement of
Sistema’s representatives in the boards of directors of portfolio companies, and effective implementation
is achieved by recruiting highly qualified management teams, including from the Corporation’s internal
talent pool. In 2016, CSR issues considered by Sistema’s Board of Directors were included in the regular
agendas of the collective corporate governance bodies of all of the Group’s key companies.
Sustainable development activities are regularly monitored in preparation for annual public non-financial
reporting, which details significant aspects of the Corporation’s sustainable development. Sistema
encourages its companies to be integrated into CSR projects, and supports independent disclosure of
21 Code of Ethics, Corporate Governance Code, HR Management Code, Corporate Social Responsibility Policy and Charity Policy .

86
sustainable development information by key assets in accordance with Global Reporting Initiative (GRI)
guidelines.
Sistema was named best in class for corporate transparency among Russia’s largest private companies,
and Segezha Group won the Debut of the Year category in the annual study of public reporting conducted
by the Russian Regional Network on Integrated Reporting to identify best practices for information
disclosure, including the application of national and international standards and guidelines.
Sistema was also among the leaders in two sustainable development indices (Responsibility and
Transparency and Sustainable Development ) prepared by the Russian Union of Industrialists and
Entrepreneurs based on public corporate reporting by Russia’s 100 largest companies.
Contribution to sustainable development
With innovative, infrastructural and systemically important companies in a number of strategic sectors
and an intensive social policy in its regions of operation, Sistema makes a significant contribution
towards achieving priority goals in Russia’s economic, social and environmental development, and also
towards achieving most of the global Sustainable Development Goals (SDGs) of the UN’s 2030 Agenda
for Sustainable Development. Many of the Corporation’s projects operate at the intersection of various
SDGs, while simultaneously addressing urgent domestic objectives including growth of labour
productivity; technological development; import substitution; food security; educational, healthcare,
social and environmental improvements, and raising overall living standards.

87
SDG Sistema’s contribution Key programmes
End poverty in all its
forms everywhere
Reduce income
inequality within and
among countries
Social and charitable projects of
Sistema Charitable Foundation (“SCF”)
and the Group’s companies to support
the underprivileged and create equal
opportunities for all: children, the
elderly and people with special needs.
Taking Care of Veterans, a joint programme of
Sistema, the Moscow City Government and the
Moscow City Council of Veterans.
Generation M, one of Russia’s largest charitable
projects, launched by MTS, combines ideas of
developing children’s creativity and supporting
critically ill children.
Participate!, a charity campaign that collects
goods for children in orphanages and social
boarding schools, disabled children and children
from large families across Russia and Kazakhstan.
End hunger, achieve
food security and
improved nutrition
and promote
sustainable
agriculture
Investments in agriculture: renewal of
agricultural machinery, introduction of
advanced agricultural technologies, and
growth of crop yields and livestock
productivity.
Upgrading Yuzhny Agricultural Complex,
Russia’s biggest greenhouse farm, located in
Karachay-Cherkessia.
Planting new intensive apple orchards in the
Rostov region.
Introducing a modern comprehensive herd
management system – the technological core of a
modern dairy farm.
Ensure healthy lives
and promote well-
being for all at all
ages
Investments in healthcare,
pharmaceuticals, and promotion of
healthy lifestyles and social inclusion.
Taking Care of Veterans, a programme to provide
medical insurance and free spa treatment for
World War II veterans and others (Sistema
Charitable Foundation and Medsi Group).
Be Healthy With Medsi, a programme designed to
raise public awareness of healthy lifestyles.
Setting up an R&D centre and launching a
programme for training medical personnel
(Binnopharm).
Ensure inclusive and
equitable quality
education and
promote lifelong
learning opportunities
for all
Supplementary education programmes
for schoolchildren, college students,
working professionals and senior
citizens.
Lift to the Future, a nationwide programme of
Sistema Charitable Foundation to improve
engineering and technology education.
The Higher School of Management and
Innovation, a faculty co-run by Sistema and
Moscow State University.
Sistema and MTS support a regional network of
special information and education centres called
The Russian Museum: A Virtual Branch.
MTS Group’s projects Children and the Internet,
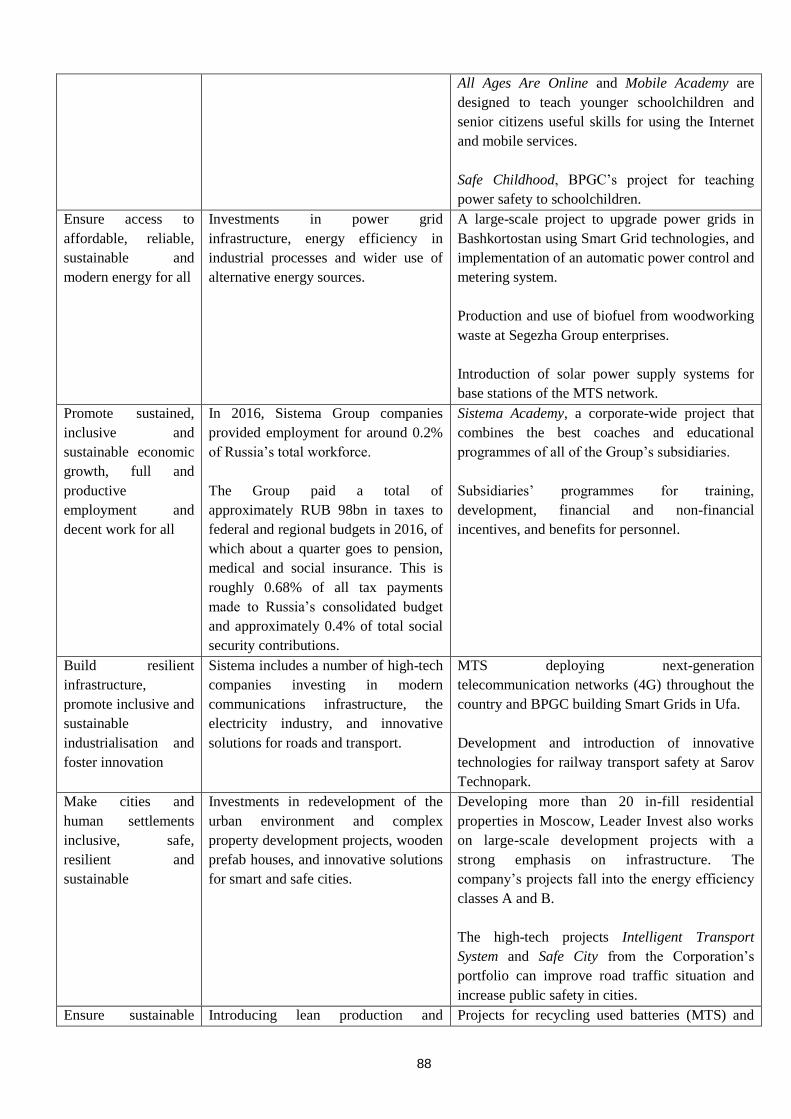
88
All Ages Are Online and Mobile Academy are
designed to teach younger schoolchildren and
senior citizens useful skills for using the Internet
and mobile services.
Safe Childhood, BPGC’s project for teaching
power safety to schoolchildren.
Ensure access to
affordable, reliable,
sustainable and
modern energy for all
Investments in power grid
infrastructure, energy efficiency in
industrial processes and wider use of
alternative energy sources.
A large-scale project to upgrade power grids in
Bashkortostan using Smart Grid technologies, and
implementation of an automatic power control and
metering system.
Production and use of biofuel from woodworking
waste at Segezha Group enterprises.
Introduction of solar power supply systems for
base stations of the MTS network.
Promote sustained,
inclusive and
sustainable economic
growth, full and
productive
employment and
decent work for all
In 2016, Sistema Group companies
provided employment for around 0.2%
of Russia’s total workforce.
The Group paid a total of
approximately RUB 98bn in taxes to
federal and regional budgets in 2016, of
which about a quarter goes to pension,
medical and social insurance. This is
roughly 0.68% of all tax payments
made to Russia’s consolidated budget
and approximately 0.4% of total social
security contributions.
Sistema Academy, a corporate-wide project that
combines the best coaches and educational
programmes of all of the Group’s subsidiaries.
Subsidiaries’ programmes for training,
development, financial and non-financial
incentives, and benefits for personnel.
Build resilient
infrastructure,
promote inclusive and
sustainable
industrialisation and
foster innovation
Sistema includes a number of high-tech
companies investing in modern
communications infrastructure, the
electricity industry, and innovative
solutions for roads and transport.
MTS deploying next-generation
telecommunication networks (4G) throughout the
country and BPGC building Smart Grids in Ufa.
Development and introduction of innovative
technologies for railway transport safety at Sarov
Technopark.
Make cities and
human settlements
inclusive, safe,
resilient and
sustainable
Investments in redevelopment of the
urban environment and complex
property development projects, wooden
prefab houses, and innovative solutions
for smart and safe cities.
Developing more than 20 in-fill residential
properties in Moscow, Leader Invest also works
on large-scale development projects with a
strong emphasis on infrastructure. The
company’s projects fall into the energy efficiency
classes A and B.
The high-tech projects Intelligent Transport
System and Safe City from the Corporation’s
portfolio can improve road traffic situation and
increase public safety in cities.
Ensure sustainable Introducing lean production and Projects for recycling used batteries (MTS) and

89
consumption and
production patterns
promoting sustainable consumption
among customers
switching subscribers to electronic bills (MGTS);
use of Segezha Group’s paper packaging in the
largest retail chains, including Detsky Mir.
Take urgent action to
combat climate
change and its
impacts
Conservation of forests; introduction of
energy-saving and other technologies
that help reduce greenhouse gas
emissions.
Segezha Group reforests approximately 21,000 ha
annually.
Protect, restore and
promote sustainable
use of terrestrial
ecosystems,
sustainably manage
forests, combat
desertification, and
halt and reverse land
degradation and halt
biodiversity loss
Interaction with environmental non-
profits, and responsible forest and land
use.
95% of Segezha Group’s leased forest is FSC-
certified22
.
Sistema supports the non-profit organisation
Far Eastern Leopards, which aims to
preserve and restore the population of
this rare species in the Russian Far East,
as well as projects of the Russian
Geographical Society.
Strengthen the means
of implementation
and revitalise the
global partnership for
sustainable
development
Agreements on social and economic
cooperation with Russian regions, and
projects based on cross-industry social
partnerships with the state and non-
profits.
In 2016, Sistema signed a cooperation agreement
with the Kirov region government, envisaging
joint initiatives to create favourable economic,
investment and social environments in the region.
MTS signed an agreement to develop telecom
infrastructure with the Yamal-Nenets regional
government, while Segezha Group signed
agreements with Karelia and the Kirov region.
The government of Altay and Sistema Charitable
Foundation signed a cooperation agreement
envisaging joint projects in culture, education and
social welfare to develop volunteering, promote
patriotism among young people and encourage
social activity.
Social investments and partnerships
The Corporation makes significant investments in important social projects every year. Total spending on
social and charitable activities in 2016 amounted to almost RUB 1.5bn, of which about one third was
allocated to programmes run by Sistema Charitable Foundation. This foundation, which is financed by the
Group’s companies, is Sistema’s main vehicle for social investment and manages a portfolio of strategic
programmes in three key areas to generate long-term positive effect and meet the interests of all
stakeholders:
Improvement of engineering education;
Social projects and volunteering;
Use of advanced technologies to promote culture and the arts.
The Corporation aims to unlock synergies between the fund and relevant objectives of its subsidiaries’
CSR strategies, and to involve as many portfolio companies as possible in corporate-wide and joint
projects aimed at creating shared value for Sistema and stakeholders.
22 Forest Stewardship council (FSC)

90
Sistema ranked third in a list of leading Russian corporate charity donors in 2016 compiled by Vedomosti
newspaper, the Donors Forum and PwC. The list includes 60 large Russian and international companies
with revenue of more than RUB 100m and charitable activities in Russia.
Sistema was named the leader of corporate transparency among Russia’s largest private companies in the
annual study of public reporting conducted by the Russian Regional Network on Integrated Reporting to
identify best practices for information disclosure, including the application of national and international
standards and guidelines.
Supporting talent and innovation
Sistema Charitable Foundation’s flagship educational programme, Lift to the Future, has been run jointly
with Group companies since 2011, and aims to build an effective system for training highly qualified
engineering personnel capable of solving complex practical issues in knowledge-intensive sectors of the
Russian economy. More than 3,200 children from across Russia have taken part in Lift to the Future
qualifying competitions since its inception, and about half of them have visited temporary engineering
and design schools over the years.
In 2016, three camp-based schools were organised, including the first-ever regional engineering and
design school in Altay. As of the end of the year, Lift to the Future had partnership agreements with 22
Russian universities. In addition, a number of new projects were launched covering the entire spectrum of
technical education, including grants.
Social projects and volunteering
Sistema’s social projects aim to increase quality of life of underprivileged groups by spreading cutting-
edge social technologies and developing volunteering. Since 2015, SCF and Medsi Group have
successfully run the Taking Care of Veterans programme under an agreement signed between Sistema,
the Moscow City Government and the Moscow City Council of Veterans. About 700 programme
participants, including war veterans, have been treated at Medsi clinics in Moscow, while aggregate
investment in the programme has exceeded RUB 70m.
A special role in supporting war veterans, children and other target groups of CSR programmes is played
by the corporate volunteer movement, whose activities are coordinated by Sistema Charitable
Foundation’s Volunteer Centre. In 2016, the Foundation recruited employees of the Group’s main donor
companies and external social partners as volunteers for its projects. The number of businesses regularly
participating in joint volunteer campaigns grew by 62% to 21, including new assets (Concept Group,
Sistema Venture Capital), while the share of the Group’s volunteers participating in joint corporate
programmes amounted to 6.5%. The Volunteer Centre implemented 64 projects in eight regions
(Moscow, Moscow region, St Petersburg, Tula region, Kirov region, Karelia, Altay and Bashkortostan)
for over 15,000 beneficiaries, and secured support from 16 external social partners.
Sistema received the Russian Business Leaders: Dynamics and Responsibility 2016 award from the
Russian Union of Industrialists and Entrepreneurs in the category Development of Cross-Industry
Partnerships in Tackling Social Issues of Russian Regions.
Employees and senior managers of Sistema and its subsidiaries began providing regular support to
specific social projects in 2016. The New Year’s charitable auction (organised for the first time) and
several fundraisers as part of the annual Wishing Tree campaign raised over RUB 11m from Sistema
employees that went to recipients including the Volgograd regional hospice and the Pavlovsky assisted-
living facility in St Petersburg.
A vivid example of a company’s contribution to solving pressing social problems in a region of operation
is Detsky Mir’s long-term project to support underprivileged children. During the traditional charity

91
campaign Participate! in 2016, Detsky Mir customers in 160 cities of Russia and Kazakhstan collected
over three million gifts worth RUB 112m for 550 beneficiaries. The company also opened 79 playrooms
in 30 hospitals and rehabilitation centres in 18 Russian cities. The total number of playrooms opened by
Detsky Mir in numerous cities in the last three years reached 174.
New technologies for promotion of culture and education
Last year was pivotal for the key recipient of Sistema’s donations in the sphere of culture and art, the
State Russian Museum. Sistema signed a 20-year agreement to support the museum in 2003, with annual
financing envisaged at up to RUB 30m. With support from MTS for the development of multimedia
museum technologies, the museum was able to launch an international educational project. More than 200
information and education centres dubbed “virtual branches” of the Russian Museum have opened at
various museums, schools and universities, cultural and scientific centres. In March 2016, the Museum
presented its new website, developed with support from Sistema Charitable Foundation. This marked
another step towards making information more accessible for a broad audience about the museum’s
activities, exhibitions, permanent collection, funds and Russian art in general. On 1 December 2016, on
the sidelines of the St. Petersburg International Cultural Forum, the Russian Museum officially launched
its new platform – a multimedia information centre in the Western pavilion of the Mikhailovsky Castle.
The multimedia centre was almost fully equipped by sponsors, and primarily Sistema. A multimedia
cinema opened here first in 2011 and then became a platform for online lectures in 2013.
Sistema has an in-house centre to develop cutting-edge museum solutions. Kronshtadt Group participated
in the large-scale reconstruction of the Aurora cruiser, where a new multimedia exposition opened in
2016.
MTS has been running Generation M, Russia’s biggest charitable project to promote creativity, for
several years. Using digital tools, the project brings together ideas to develop young talents from across
Russia and support seriously ill children. Since its launch, the project has raised over RUB 15m.
An important place in Sistema Group’s social and educational efforts belongs to projects aimed at making
web and mobile technologies safer and more accessible for all users, from children to the elderly. MTS
has teamed up with employees of Moscow State University’s Psychology Department to develop the
Children and the Internet programme, which includes lessons in online safety for younger schoolchildren,
and an interactive exhibition, workshops and webinars for teachers and parents. Over 340,000 people in
30 regions completed the programme in the last five years. In 2016, exhibitions and lessons on safe and
productive web surfing were organised in libraries, museums and children’s art centres in eight cities:
Krasnoyarsk, Saratov, Kemerovo, Omsk, Orenburg, Orsk, Kurgan and Izhevsk.
Environmental responsibility
Given the scale of its business and the environmental impact of its portfolio companies, Sistema considers
reduction of its overall environmental footprint, including greenhouse gas emissions and resource
consumption, as a priority, and is striving to achieve positive change by introducing environmentally
friendly technologies and promoting green lifestyles. The Corporation’s key environmental initiatives
focus on responsible use, preservation and restoration of forests.
Segezha Group, the biggest forest user in the European part of Russia, promotes sustainable forest use,
which envisages sustainability of resources, forest protection, reforestation, and prevention of forest fires
and illegal felling to ensure that the forest brings maximum value to people as well as to the economy.
Segezha Group works actively with the government on projects to implement new models of intensive
and responsible forest management aimed at facilitating sustainable forest development. Its experience
was used to develop the required legal framework, first of all, for the pilot project of intensive forest use
and reforestation in Karelia.

92
Segezha Group is actively engaged in forest management on leased forest areas in four regions of Russia.
In 2016 alone, it restored about 22,000 ha of forests. Segezha Group’s Russian companies invested some
RUB 85m in environmental projects in 2016, while its foreign subsidiaries contributed EUR 150,000. The
holding has an environmental management system based on ISO 14000, performs internal audits of the
environmental activities of all of its subsidiaries, and undergoes voluntary Forest Stewardship Council
(FSC) certification of its forest resources and supply chains. In 2015, the Group’s largest enterprise,
Segezha Pulp & Paper Mill, confirmed the compliance of its supply chain and controlled timber with FSC
standards until December 2021.
Sistema encourages the introduction of high environmental standards in the timber industry. In June 2016,
Segezha Group and WWF Russia teamed up for a joint initiative to develop an environmental
responsibility ranking for Russian timber companies, which received support from other major players.
Two of Segezha Group’s enterprises – Segezha PPM and Lendery Timber Company – were named
among the most environmentally responsible forest operators in a ranking compiled by the regional
environmental organisation SPOK, which rates forest users based on their stance on preservation and use
of Specially Protected Natural Areas.
Paper packaging manufactured by Segezha Group’s companies is broadly used by leading retail chains as
an eco-friendly alternative to plastic bags. Detsky Mir was the first children’s goods retailer in Russia to
offer its customers eco-friendly bags produced by Segezha Group. The bags appeared at Detsky Mir
stores in Moscow and the Moscow region in December 2015, and six months later the project was rolled
out to the entire chain, with the number of paper bags sold surging five-fold to 30,600. MTS has also been
gradually introducing eco-friendly packaging for SIM cards since 2015. In 2016, 8.5m SIM cards were
packaged into envelopes made of kraft cardboard, which does not contain any synthetic agents and
dissolves easily and naturally.
MGTS, which is part of MTS Group, launched a programme with WWF Russia to preserve Russia’s
forest resources, encouraging Moscow residents to reduce paper consumption by switching to electronic
billing and inviting subscribers to made donations to WWF Russia for reforestation. The number of
MGTS customers who switched to e-bills doubled over the year, which helped the company to reduce its
spending on paper bills by 6.5%. About 1,000 customers made donations for forest preservation, and
MGTS contributed RUB 7 for each rouble donated by subscribers. The funds raised went to protect about
3 million trees in particularly valuable forests in Arkhangelsk.
Sistema companies (RTI, MTS, MTS Bank, MGTS and Segezha) participated in an environmental
campaign organised by FSC Russia to mark International Day of Forests and collected about 2.4 tons of
waste paper for recycling, which saved more than 40 trees, 17,000 litres of water, 9,600 kWh of energy
and prevented the emission of more than 4 tonnes of CO2.

93
Information about fuel and energy consumption
Type of resources Unit of
measurement
Actual resource consumption in 2016
in physical terms in monetary terms,
thousand RUB
Heat power Gcal 1,626 2,612
Electric power kWh 2,311 8,488
Petrol litres 235,141 8,440
A team of professionals
As one of Russia’s biggest employers, Sistema creates jobs with competitive salaries and additional social
guarantees, and offers employees unique opportunities for career growth and to develop new skills. In
2016, the Group employed about 158,000 people in all regions of Russia.23
The Group’s companies
strictly adhere to generally accepted norms and principles of labour relations, including those set out in
World Labour Organisation guidelines and Russian legislation to prevent discrimination, protect
employees’ personal data and observe human rights.24
Sistema sees its main HR task as building strong and highly motivated management teams for its
investment portfolios and assets, and organising efficient transfer of best practices, knowledge and
professionals within the Group.
Sistema Group’s top managers are regularly named as some of Russia’s best managers in the annual
rating compiled by the Managers’ Association and Kommersant Publishing House. In 2016, the number
of the Corporation’s representatives in the list of the Top 1,000 Russian Managers doubled compared to
the previous year. A total of 72 senior executives made it to the list, including 65 senior managers of
Sistema’s portfolio companies – the highest result among the ranking’s participants. Sistema’s President
Mikhail Shamolin was ranked #1 among CEOs of diversified holding companies, and Vsevolod Rozanov,
Senior Vice President and head of the Finance and Investment Function, was declared the best CFO.
In May 2016, Sistema took a new important step towards transforming long-term incentive system for
senior executives with the introduction of a co-investment programme for senior management. The
programme is designed primarily to align the interests of investment portfolio managers with those of
shareholders, in line with best global practices in the investment sector.
Sistema’s management system is based on regular assessment of executives’ efficiency, achievement of
business targets and meeting corporate culture requirements (values, competences, cross-sector and social
skills). In 2016, Sistema conducted assessment using state-of-the-art tools and with active support of the
Corporate Centre’s senior management. At the initial stage, assessment was conducted for 56 executives
of Sistema, including members of the Management Board, and 128 CFOs of the Corporate Centre and
subsidiaries.
23 Including Targin. 24 The Corporation is guided by the Universal Declaration of Human Rights and the United Nations Guiding Principles on Business and Human
Rights.

94
In 2015, Sistema launched the Sistema Academy, a corporate educational project bringing together the
best coaches and educational programmes from its subsidiaries. About 20 Group companies are currently
involved in the project. In 2016, the Sistema Academy introduced new professional clubs that offer
members opportunities for professional development, informal communication and networking.
The Corporation’s employees may receive professional training, including free courses, at the Moscow
State University’s Higher School of Management and Innovation, a joint department between the
University and Sistema that celebrated its 10th anniversary last year. Over these years, the school has
awarded more than 300 master’s degrees, with holders taking up executive positions at leading Russian
and foreign companies. Last year, over 100 holders of master’s degrees, including over 50 employees of
Sistema and its subsidiaries, attended various advanced training courses at the department.
The Corporation not only creates a favourable environment for professional growth and its employees’
development, but also shapes a common corporate culture aimed at teamwork and high achievement.
Sistema also takes its employees’ health very seriously. The biggest annual event bringing together
employees of all Sistema Group companies and their families in support of healthy lifestyles is the
Summer Games, which in 2016 gathered 19 teams and about 4,000 participants and supporters at the
Yantar stadium in Moscow.
The Corporation’s HR efforts result in a high level of personnel engagement and make Group companies
attractive employers. The Corporation conducts an engagement survey once every two years. In 2016, the
survey covered 16 companies (56% of Group staff). The average engagement level grew by 4% since the
last survey (in 2014) to 64%.
In 2016, MTS improved its position in the ranking of Russia’s best employers compiled by HeadHunter
and RBC, moving up one notch to fourth among more than 230 companies and also being named best
employer among telecoms companies. Detsky Mir was named among the most attractive Russian
employers in the AON Best Employers Russia 2016 survey, the results of which were announced at
Vedomosti’s HR Forum. MTS also made it to the top 14 employers of 2016.

SISTEMA PJSFC
AND SUBSIDIARIES Consolidated Financial Statements for 2016
and Independent Auditor’s Report

SISTEMA PJSFC AND SUBSIDIARIES
TABLE OF CONTENTS
Page
STATEMENT OF MANAGEMENT’S RESPONSIBILITIES FOR THE PREPARATION AND APPROVAL OF THE CONSOLIDATED FINANCIAL STATEMENTS FOR 2016 97 INDEPENDENT AUDITOR’S REPORT 98-102 CONSOLIDATED FINANCIAL STATEMENTS FOR 2016:
Consolidated statement of profit or loss 103 Consolidated statement of comprehensive income or loss 104
Consolidated statement of financial position 105-106 Consolidated statement of changes in equity 107
Consolidated statement of cash flows 108-109 Notes to the consolidated financial statements
1. General 110 2. Basis of preparation 110 3. Significant accounting policies, judgements, estimates and assumptions 110 4. Segment information 113 5. Agreement with RCOM 116 6. Investigations into former operations in uzbekistan 116 7. Business combinations 116 8. Discontinued operations 119 9. Capital transactions of subsidiaries 120 10. Revenue 122 11. Impairment of long-lived assets 124 12. Impairment of financial assets 124 13. Income taxes 124 14. Employee benefits expenses 127 15. Property, plant and equipment 128 16. Investment property 130 17. Goodwill 131 18. Other intangible assets 133 19. Investments in associates and joint ventures 135 20. Loans receivable and other financial assets 137 21. Restricted cash 139 22. Inventories 139 23. Accounts receivable 140 24. Equity 141 25. Accumulated other comprehensive income 142 26. Borrowings 142 27. Bank deposits and liabilities 145 28. Other financial liabilities 145 29. Liabilities under put option agreements 146 30. Provisions 147 31. Earnings per share 148 32. Capital and financial risk management 148 33. Hedging activities 151 34. Fair values 153 35. Related party transactions 154 36. Subsidiaries 155 37. Non-cash transactions 157 38. Contingencies and commitments 157 39. Application of new and revised IFRSs 160 40. Events after the reporting date 161

97
SISTEMA PJSFC AND SUBSIDIARIES
STATEMENT OF MANAGEMENT’S RESPONSIBILITIES FOR THE PREPARATION AND APPROVAL OF THE CONSOLIDATED FINANCIAL STATEMENTS FOR THE YEAR ENDED 31 DECEMBER 2016
Management is responsible for the preparation of the consolidated financial statements that present fairly the financial position of Sistema Public Joint Stock Financial Corporation and its subsidiaries (the “Group”) as of 31 December 2016, and the results of its operations, cash flows and changes in equity for 2016, in compliance with International Financial Reporting Standards (“IFRSs”).
In preparing the consolidated financial statements, management is responsible for: Properly selecting and applying accounting policies; Presenting information, including accounting policies, in a manner that provides relevant,
reliable, comparable and understandable information; Providing additional disclosures when compliance with the specific requirements in IFRSs are
insufficient to enable users to understand the impact of particular transactions, other events and
conditions on the Group’s consolidated financial position and financial performance; Making judgements and assumptions that are reasonable and prudent; Stating whether IFRS have been followed, subject to any material departures disclosed and
explained in the consolidated financial statements; and Making an assessment of the Group's ability to continue as a going concern.
Management is also responsible for:
Designing, implementing and maintaining an effective and sound system of internal controls,
throughout the Group; Maintaining adequate accounting records that are sufficient to show and explain the Group's
transactions and disclose with reasonable accuracy at any time the consolidated financial position of the Group, and which enable them to ensure that the consolidated financial statements of the
Group comply with IFRS; Maintaining statutory accounting records in compliance with the Russian legislation and
accounting standards; Taking such steps as are reasonably available to them to safeguard the assets of the Group; and Preventing and detecting fraud and other irregularities.
31 March 2017

98
INDEPENDENT AUDITOR’S REPORT
To Shareholders and the Board of Directors of Sistema Public Joint Stock Financial Corporation
Opinion We have audited the consolidated financial statements of Sistema Public Joint Stock Financial Corporation and its subsidiaries (the “Group”), which comprise the consolidated statement of financial position as at 31 December 2016, and the consolidated statement of profit or loss, consolidated statement of comprehensive income or loss, consolidated statement of changes in equity and consolidated statement of cash flows for the year then
ended, and notes to the consolidated financial statements, including a summary of significant accounting policies. In our opinion, the accompanying consolidated financial statements present fairly, in all material respects, the consolidated financial position of the Group as at 31 December 2016, and its consolidated financial performance and its consolidated cash flows for the
year then ended in accordance with International Financial Reporting Standards (“IFRSs”). Basis for Opinion We conducted our audit in accordance with International Standards on Auditing (“ISAs”). Our responsibilities under those standards are further described in the Auditor’s Responsibilities for the Audit of the Consolidated Financial Statements section of our
report. We are independent of the Group in accordance with the International Ethics Standards Board for Accountants’ Code of Ethics for Professional Accountants (the “IESBA Code”) together with the ethical requirements that are relevant to our audit of the consolidated financial statements in the Russian Federation, and we have fulfilled our other ethical responsibilities in accordance with these requirements and the IESBA Code. We believe that the audit evidence we have obtained is sufficient and appropriate to provide a basis for our opinion.
Key Audit Matters Key audit matters are those matters that, in our professional judgment, were of most significance in our audit of the consolidated financial statements of the current period. These matters were addressed in the context of our audit of the consolidated financial
statements as a whole, and in forming our opinion thereon, and we do not provide a separate opinion on these matters.

99
Why the matter was determined to be a key audit matter
How the matter was addressed in the audit
Impairment of loans to customers of MTS Bank We focused on this area because
management makes complex and subjective judgements over both the timing of recognition of impairment and the estimation of the size of any such impairment. Key areas of risk include: the principal assumptions underlying
the calculation of impairment for portfolios of loans, the operation of the models to make those calculations and application of adjustments to the
results produced by those models; the principal assumptions underlying
the calculation of discounted cash flows for loans for which impairment is assessed on an individual basis;
how impairment events that have not yet resulted in a payment default are identified and measured.
See Note 20 to the consolidated financial statements.
For individually assessed loans we assessed the criteria for determining whether an impairment event had occurred and therefore whether there was a requirement to calculate
impairment provision. Where an impairment indicator had been identified, we examined the forecasts of future cash flows prepared by management to support the calculation of the impairment, challenging the assumptions and comparing estimates to external evidence where available. In addition, we examined a sample of loans, which had not been identified by management as potentially impaired and formed our own judgement as to whether that was appropriate including using all available evidence in respect of the
relevant counterparties.
Where impairment was calculated on a modelled basis, we tested the basis and operation of those models and the data and assumptions used. Our work included the following:
we tested the completeness and
accuracy of the underlying loan information used in the impairment models;
we tested the operation of the models used to calculate the impairment including, in some cases, rebuilding those models independently and comparing the results;
we compared the principal assumptions
made with our industry experience and knowledge;
we considered the potential for impairment to be affected by events which were not captured by management’s models and evaluated how management had responded to these by making further adjustments where appropriate.
Litigation and regulatory claims We focused on this matter because the Group is subject to challenge in respect of a number of legal and regulatory matters, many of which are beyond its control. Consequently, management makes judgements about the probability and amounts of contingent liabilities arising from litigation or regulatory claims or possible claims which are subject to the future outcome of legal or regulatory processes. In
particular, the U.S. Securities and Exchange Commission and the U.S. Department of Justice are currently investigating the Group’s former subsidiary in Uzbekistan. See Notes 6 and 38 to the consolidated financial statements.
We analysed the summary of litigation matters provided by management, evaluated the Group’s assessment of the nature and status of the litigations and claims and discussed significant cases with Group management, including in-house counsel. Where applicable, we also corroborated the Group’s conclusions with respect to the provisions recognized and contingent liabilities disclosed through the assessment of regulatory and legal correspondence and
through communications with the Group’s external legal counsel. We validated completeness and appropriateness of the related disclosures in the consolidated financial statements.

100
Why the matter was determined to be a key audit matter
How the matter was addressed in the audit
Significant one-off transactions In light of its diversified investment strategy, the Group regularly conducts acquisitions,
disposals, debt restructurings and subsidiary equity transactions. We focus on these matters because the appropriate accounting treatment of such transactions is complex and requires exercise of significant judgement. In the current period this includes specifically divestments the Group made during the year, as well as the status of the announced transaction with Reliance Communications
Ltd. (RCOM). See Notes 5 and 8 to the consolidated financial statements.
Our procedures included the following: obtaining and reviewing legal
documents to fully understand the
terms and conditions of each transaction and therefore the associated accounting implications; and
evaluating documentation of management’s positions on how IFRS was applied to the transactions.
For the divestments completed in the year, we reviewed sales and purchase agreements to confirm that control had passed to buyers and recalculated any profit or loss on disposal.
For the transaction with RCOM, where the merger process was ongoing at year end, we considered whether the criteria of IFRS 5, Non-current Assets Held for Sale and Discontinued Operations, had been met. Our work included particular focus on whether the conditions precedent for a sale to complete included conditions outside of management’s control such as regulatory and court approvals.
Capitalisation and assets useful lives of assets We focused on the following matters because management judgement in these areas significantly impacts the carrying value of property, plant and equipment and their depreciation profiles:
the risk that amounts being capitalised
do not meet capitalisation criteria; the risk that the useful economic lives
assigned to assets are inappropriate; and
the risk that constructed assets are not brought into operations on a timely basis.
See Note 15 to the consolidated financial statements.
We evaluated the appropriateness of the Group’s capitalisation policies, assessed the nature of costs incurred in capital projects through testing amounts recorded and assessing whether the costs meet capitalisation criteria, and assessed timeliness of commissioning of assets in the course of construction.
We tested whether the Group’s determination of useful lives is appropriate by considering our knowledge of the business, technological developments and practice in the respective industries.
Other Information Management is responsible for the other information. The other information comprises the information included in the annual report, but does not include the consolidated financial statements and our auditor’s report thereon. The annual report is expected to be made
available to us after the date of this auditor’s report. Our opinion on the consolidated financial statements does not cover the other information and we will not express any form of assurance conclusion thereon.
101
In connection with our audit of the consolidated financial statements, our responsibility is to read the other information identified above when it becomes available and, in doing so,
consider whether the other information is materially inconsistent with the consolidated financial statements or our knowledge obtained in the audit, or otherwise appears to be materially misstated.
When we read the annual report, if we conclude that there is a material misstatement therein, we are required to communicate the matter to those charged with governance. Responsibilities of Management and Those Charged with Governance for the Consolidated Financial Statements
Management is responsible for the preparation and fair presentation of the consolidated financial statements in accordance with IFRSs, and for such internal control as management determines is necessary to enable the preparation of consolidated financial statements that are free from material misstatement, whether due to fraud or error.
In preparing the consolidated financial statements, management is responsible for assessing the Group’s ability to continue as a going concern, disclosing, as applicable,
matters related to going concern and using the going concern basis of accounting unless management either intends to liquidate the Group or to cease operations, or has no realistic alternative but to do so. Those charged with governance are responsible for overseeing the Group’s financial reporting process.
Auditor’s Responsibilities for the Audit of the Consolidated Financial Statements Our objectives are to obtain reasonable assurance about whether the consolidated financial statements as a whole are free from material misstatement, whether due to fraud or error, and to issue an auditor’s report that includes our opinion. Reasonable assurance is a high level of assurance, but is not a guarantee that an audit conducted in accordance
with ISAs will always detect a material misstatement when it exists. Misstatements can arise from fraud or error and are considered material if, individually or in the aggregate, they could reasonably be expected to influence the economic decisions of users taken on the basis of these consolidated financial statements. As part of an audit in accordance with ISAs, we exercise professional judgment and maintain professional skepticism throughout the audit. We also: identify and assess the risks of material misstatement of the consolidated financial
statements, whether due to fraud or error, design and perform audit procedures responsive to those risks, and obtain audit evidence that is sufficient and appropriate to provide a basis for our opinion. The risk of not detecting a material misstatement resulting from fraud is higher than for one resulting from error, as fraud may involve collusion, forgery, intentional omissions, misrepresentations, or the override of internal control;
obtain an understanding of internal control relevant to the audit in order to design audit procedures that are appropriate in the circumstances, but not for the purpose of expressing an opinion on the effectiveness of the Group’s internal control;

The Entity: Sistema Public Joint Stock Financial Corporation
Certificate of state registration № 025.866, issued by the
Moscow Registration Chamber on 16.07.1993
Primary State Registration Number: 1027700003891
Certificate of registration in the Unified State Register № 77 011222220 of 11.11.2002, issued by Moscow
Interdistrict Inspectorate of the Russian Ministry of Taxation
№ 46
Address: 13/1 Mokhovaya st., Moscow, Russia, 125009
Audit Firm: ZAO Deloitte & Touche CIS
Certificate of state registration № 018.482, issued by the
Moscow Registration Chamber on 30.10.1992.
Primary State Registration Number: 1027700425444
Certificate of registration in the Unified State Register № 77 004840299 of 13.11.2002, issued by Moscow
Interdistrict Inspectorate of the Russian Ministry of Taxation
№ 39.
Member of Self-regulated organization of auditors “Russian
Union of auditors” (Association), ORNZ 11603080484.
102
evaluate the appropriateness of accounting policies used and the reasonableness of accounting estimates and related disclosures made by management;
conclude on the appropriateness of management’s use of the going concern basis of accounting and, based on the audit evidence obtained, whether a material uncertainty exists related to events or conditions that may cast significant doubt on
the Group’s ability to continue as a going concern. If we conclude that a material uncertainty exists, we are required to draw attention in our auditor’s report to the related disclosures in the consolidated financial statements or, if such disclosures are inadequate, to modify our opinion. Our conclusions are based on the audit evidence obtained up to the date of our auditor’s report. However, future events or conditions may cause the Group to cease to continue as a going concern;
evaluate the overall presentation, structure and content of the consolidated financial
statements, including the disclosures, and whether the consolidated financial statements represent the underlying transactions and events in a manner that achieves fair presentation; and
obtain sufficient appropriate audit evidence regarding the financial information of the
entities or business activities within the Group to express an opinion on the consolidated financial statements. We are responsible for the direction, supervision and performance of the group audit. We remain solely responsible for our audit opinion.
We communicate with those charged with governance regarding, among other matters, the planned scope and timing of the audit and significant audit findings, including any significant deficiencies in internal control that we identify during our audit. We also provide those charged with governance with a statement that we have complied with relevant ethical requirements regarding independence, and to communicate with them all relationships and other matters that may reasonably be thought to bear on our independence, and where applicable, related safeguards. From the matters communicated with those charged with governance, we determine those matters that were of most significance in the audit of the consolidated financial statements of the current period, which constitute the key audit matters included herein.
Raikhman M. V. Engagement partner 31 March 2017

103
SISTEMA PJSFC AND SUBSIDIARIES
CONSOLIDATED STATEMENT OF PROFIT OR LOSS (In millions of Russian Rubles, except for per share amounts)
Notes 2016 2015
Continuing operations
Revenue 10 697,705 678,821
Cost of sales (349,741) (352,670)
Selling, general and administrative expenses (157,003) (148,232)
Depreciation and amortisation (96,710) (88,670)
Impairment of long-lived assets 11 (2,896) (11,941)
Impairment of financial assets 12 (11,400) (7,220)
Taxes other than income tax (5,574) (4,000)
Share of the profit or loss of associates and joint ventures, net19 3,147 4,377
Gain on acquisitions 7 1,169 -
Other income 6,840 1,918
Other expenses (5,693) (3,995)
Operating income 79,844 68,388
Finance income 9,853 18,451
Finance costs (56,251) (50,496)
Currency exchange gain/(loss) 6,055 (16,249)
Profit before tax 39,501 20,094
Income tax expense 13 (21,575) (18,251)
Profit from continuing operations 17,926 1,843
Discontinued operations
(Loss)/profit from discontinued operations 8 (8,767) 44,531
Profit for the period 9,159 46,374
Profit/(loss) attributable to:
Shareholders of Sistema PJSFC (11,758) 28,800
Non-controlling interests 20,917 17,574
9,159 46,374
Earnings/(losses) per share (basic and diluted), Russian Rubles:
From continuing operations 31 (0.56) (2.11)
From continuing and discontinued operations 31 (1.25) 3.06
The accompanying notes are an integral part of these consolidated financial statements.
31 March 2017

104
SISTEMA PJSFC AND SUBSIDIARIES
CONSOLIDATED STATEMENT OF COMPREHENSIVE INCOME OR LOSS (In millions of Russian Rubles)
Notes 2016 2015
Profit for the period 9,159 46,374
Other comprehensive loss:
Items that may be reclassified subsequently to profit or loss:
Currency translation loss on foreign operations in subsidiaries (11,004) (6,841)
Currency translation loss on foreign operations in associates
and joint ventures (1,553) (1,182)
Net fair value loss on revaluation of available-for-sale
financial instruments (1,199) (3,223)
Items that will not be reclassified subsequently to profit or loss:
Unrecognised actuarial gain 50 86
Other comprehensive loss, net of tax 25 (13,706) (11,160)
Total comprehensive (loss)/income (4,547) 35,214
Attributable to:
Shareholders of Sistema PJSFC (18,431) 21,303
Non-controlling interests 13,884 13,911
(4,547) 35,214
The accompanying notes are an integral part of these consolidated financial statements.
31 March 2017

105
SISTEMA PJSFC AND SUBSIDIARIES
CONSOLIDATED STATEMENT OF FINANCIAL POSITION (In millions of Russian Rubles)
31 December 31 December
Notes 2016 2015
Assets
Non-current assets
Property, plant and equipment 15 408,130 421,522
Investment property 16 22,647 14,085
Goodwill 17 52,224 47,256
Other intangible assets 18 107,716 112,307
Investments in associates and joint ventures 19 19,537 22,219
Deferred tax assets 13 24,185 25,966
Loans receivable and other financial assets 20 100,023 112,236
Deposits in banks 27,274 45,696
Other assets 17,428 15,330
Total non-current assets 779,164 816,617
Current assets
Inventories 22 82,690 76,622
Accounts receivable 23 60,888 74,276
Advances paid and prepaid expenses 16,348 17,544
Current income tax assets 2,580 6,051
Other taxes receivable 18,176 20,993
Loans receivable and other financial assets 20 62,588 78,020
Deposits in banks 9,173 76,117
Restricted cash 21 10,098 -
Cash and cash equivalents 60,190 122,775
Other assets 2,194 2,778
Total current assets 324,925 475,176
Total assets 1,104,089 1,291,793

106
SISTEMA PJSFC AND SUBSIDIARIES
CONSOLIDATED STATEMENT OF FINANCIAL POSITION (CONTINUED) (In millions of Russian Rubles)
31 December 31 December
Notes 2016 2015
Equity and liabilities
Equity
Share capital 24 869 869
Treasury shares 24 (6,575) (4,806)
Additional paid-in capital 87,369 80,778
Retained earnings 91,290 112,921
Accumulated other comprehensive loss 25 (13,752) (7,079)
Equity attributable to shareholders of Sistema 159,201 182,683
Non-controlling interests 57,770 62,914
Total equity 216,971 245,597
Non-current liabilities
Borrowings 26 395,017 414,103
Liabilities under put option agreements 29 2,243 -
Bank deposits and liabilities 27 6,432 7,275
Deferred tax liabilities 13 40,753 41,664
Provisions 30 3,411 4,190
Liability to Rosimushchestvo 29 21,282 -
Other financial liabilities 28 23,337 28,224
Other liabilities 8,742 11,414
Total non-current liabilities 501,217 506,870
Current liabilities
Borrowings 26 83,109 142,657
Liabilities under put option agreements 29 - 65,684
Accounts payable 110,879 136,979
Bank deposits and liabilities 27 99,888 115,529
Advances received 26,069 24,953
Subscriber prepayments 17,900 20,955
Income tax payable 962 831
Other taxes payable 16,391 14,524
Dividends payable 249 210
Provisions 30 10,752 10,151
Liability to Rosimushchestvo 29 11,783 -
Other financial liabilities 28 7,919 6,853
Total current liabilities 385,901 539,326
Total equity and liabilities 1,104,089 1,291,793
The accompanying notes are an integral part of these consolidated financial statements.
31 March 2017

107
SISTEMA PJSFC AND SUBSIDIARIES
CONSOLIDATED STATEMENT OF CHANGES IN EQUITY (In millions of Russian Rubles)
Equity
attributable to Non-
Additional Treasury Retained Currency shareholders
Share capital paid-in capital shares earnings reserve Other of Sistema Total equity
1 January 2015 869 72,202 (6,913) 88,544 (1,800) 2,218 155,120 78,587 233,707
Profit for the period - - - 28,800 - - 28,800 17,574 46,374
Other comprehensive loss, net of tax - - - - (5,732) (1,765) (7,497) (3,663) (11,160)
Total comprehensive income/(loss)
for the period - - - 28,800 (5,732) (1,765) 21,303 13,911 35,214
Settlements under long-term motivation program - (2,564) 2,564 - - - - - -
Accrued compensation cost (Note 14) - 2,866 - - - - 2,866 - 2,866
Purchases of own shares - - (457) - - - (457) - (457)
Capital transactions of subsidiaries (Note 9) - 8,274 - - - - 8,274 (6,452) 1,822
Business combinations and
disposals of subsidiaries (Note 7) - - - - - - - 343 343
Dividends declared by Sistema PJSFC - - - (4,423) - - (4,423) - (4,423)
Dividends declared by subsidiaries - - - - - - - (23,475) (23,475)
31 December 2015 869 80,778 (4,806) 112,921 (7,532) 453 182,683 62,914 245,597
(Loss)/ profit for the period - - - (11,758) - - (11,758) 20,917 9,159
Other comprehensive (loss)/income, net of tax - - - - (4,839) 252 (4,587) (7,033) (11,620)
Total comprehensive income for the period - - - (11,758) (4,839) 252 (16,345) 13,884 (2,461)
Settlements under long-term motivation program - (313) 313 - - - - - -
Accrued compensation cost (Note 14) - 2,522 - - - - 2,522 - 2,522
Purchases of own shares - - (2,082) - - - (2,082) - (2,082)
Capital transactions of subsidiaries (Note 9) - 4,382 - - - - 4,382 9,358 13,740
Business combinations and
disposals of subsidiaries (Note 7) - - - - (2,086) - (2,086) (600) (2,686)
Dividends declared by Sistema PJSFC (Note 24) - - - (9,873) - - (9,873) - (9,873)
Dividends declared by subsidiaries - - - - - - - (27,786) (27,786)
31 December 2016 869 87,369 (6,575) 91,290 (14,457) 705 159,201 57,770 216,971
controlling
interests
Accumulated other
(loss)/income
comprehensive
The accompanying notes are an integral part of these consolidated financial statements.

108
SISTEMA PJSFC AND SUBSIDIARIES
CONSOLIDATED STATEMENT OF CASH FLOWS (In millions of Russian Rubles)
2016 2015
Cash flows from operating activities
Profit for the period 9,159 46,374
9,159 46,374
Adjustments for:
Depreciation and amortisation 100,546 94,915
Share of the profit or loss of associates and joint ventures, net (3,147) (4,377)
Finance income (9,851) (18,526)
Finance costs 57,368 51,174
Income tax expense 21,575 17,944
Currency exchange (gain)/loss (6,035) 16,318
Loss/(profit) from discontinued operations 7,614 (49,029)
Loss on disposal of property, plant and equipment 109 461
Change in fair value of financial instruments through profit or loss (110) (1,076)
Gain on disposal of subsidiaries (60) (1,262)
Amortisation of connection fees (2,287) (2,362)
Impairment loss on loans receivable 6,063 21,788
Dividends received from associates and joint ventures 2,955 3,622
Non-cash compensation to employees 2,522 3,292
Impairment of long-lived assets 2,896 11,941
Impairment of financial assets 11,803 7,327
Other non-cash items 3,152 2,482
204,272 201,006
Movements in working capital:
Bank loans to customers and interbank loans due
from banks 11,253 14,279
Bank deposits and liabilities (16,484) (7,806)
Restricted cash (Note 21) (10,098) -
Financial assets at fair value through profit or loss (2,401) (966)
Accounts receivable 11,224 7,845
Advances paid and prepaid expenses 863 5,814
Other taxes receivable 2,964 (776)
Inventories (8,862) (24,926)
Accounts payable (3,838) 19,050
Subscriber prepayments (435) 2,892
Other taxes payable 2,720 2,805
Advances received and other liabilities (7,358) 1,943
Interest paid (59,791) (48,304)
Income tax paid (19,344) (16,784)
Net cash provided by operating activities 104,685 156,072

109
SISTEMA PJSFC AND SUBSIDIARIES
CONSOLIDATED STATEMENT OF CASH FLOWS (CONTINUED) (In millions of Russian Rubles)
2016 2015
Cash flows from investing activities
Payments for purchases of property, plant and equipment (89,958) (106,561)
Proceeds from sale of property, plant and equipment 4,516 3,682
Proceeds from settlement with Ural-Invest - 10,821
Payments for purchases of intangible assets (32,920) (32,662)
Payments for businesses, net of cash acquired (13,956) (14,421)
Payments for investments in associates and joint ventures (3,235) (3,077)
Proceeds from sale of investments in affiliated companies 6,118 -
Payments for financial assets, long-term (28,212) (56,584)
Proceeds from sale of financial assets, long-term 15,774 1,482
Payments for financial assets, short-term (23,489) (41,425)
Proceeds from sale of financial assets, short-term 95,294 42,103
Cash of discontinued operations (2,576) -
Interest received 10,197 18,283
Other (1,588) (1,885)
Net cash used in investing activities (64,035) (180,244)
Cash flows from financing activities
Proceeds from borrowings 209,963 177,606
Principal payments on borrowings (249,126) (129,478)
Debt issuance costs (428) (1,162)
Acquisition of non-controlling interests in existing subsidiaries (26,816) (3,452)
Payments to purchase treasury shares (2,082) (456)
Proceeds from transactions with non-controlling interests 19,099 9,718
Dividends paid (37,725) (27,535)
Cash (outflow)/inflow under credit guarantee agreement related
to foreign currency hedge (2,985) 6,706
Net cash (used in)/provided by financing activities (90,100) 31,947
Impairment of cash and cash equivalents (Note 38) - (1,697)
Effect of foreign currency translation on cash and
cash equivalents (13,135) (3,270)
Net (decrease)/increase in cash and cash equivalents (62,585) 2,808
Cash and cash equivalents at the beginning of the period 122,775 119,967
Cash and cash equivalents at the end of the period 60,190 122,775 The accompanying notes are an integral part of these consolidated financial statements.

SISTEMA PJSFC AND SUBSIDIARIES
NOTES TO THE CONSOLIDATED FINANCIAL STATEMENTS (Amounts in millions of Russian Rubles, unless otherwise stated)
110
1. GENERAL Sistema Public Joint Stock Financial Corporation (the “Company”, together with its subsidiaries, the “Group”) invests in, and manages a range of companies which operate in various industries,
including telecommunications, retail, high technology, finance, pulp and paper, utilities, pharmaceuticals, healthcare, agriculture and tourism. The Company and the majority of its subsidiaries are incorporated in the Russian Federation (“RF”). The Company’s registered address is 13 Mokhovaya street, 125009, Moscow. The majority shareholder of the Company is Vladimir Evtushenkov. Minority holdings are held by certain top executives and directors of the Company. The shares are listed on the London Stock
Exchange in the form of Global Depositary Receipts (“GDRs”) and on the Moscow Exchange.
2. BASIS OF PREPARATION
These consolidated financial statements have been prepared in accordance with International Financial Reporting Standards (“IFRSs”).
These consolidated financial statements have been prepared on the assumption that the Group is a going concern and will continue in operation for the foreseeable future. As at 31 December 2016, the Group’s current liabilities exceeded its current assets by RUB 60,976 million. The Group believes that it generates sufficient operating cash flows and adequate funding is available to fulfil the Group’s short-term obligations, if needed, including unused credit facilities of RUB
186,542 million and long-term deposits of RUB 27,274 million available for withdrawal. These consolidated financial statements were approved by the Company’s President and CEO and authorised for issue on 31 March 2017.
3. SIGNIFICANT ACCOUNTING POLICIES, JUDGEMENTS, ESTIMATES AND ASSUMPTIONS
This note sets out significant accounting policies that relate to the Group’s consolidated financial statements as a whole and describes the critical accounting judgements that management has identified as having a potentially material impact on the Group’s consolidated financial statements. When an accounting policy is generally applicable to a specific note to the accounts, the policy is described within that note.
Summary of significant accounting policies Basis of consolidation. The consolidated financial statements incorporate the financial statements of the Company, entities controlled by the Company and their subsidiaries. Control is achieved when the Company:
has power over the investee;
is exposed, or has rights, to variable returns from its involvement with the investee; and
has the ability to use its power to affect its returns.
The Company reassesses whether or not it controls an investee if facts and circumstances indicate that there are changes to one or more of the three elements of control listed above.

SISTEMA PJSFC AND SUBSIDIARIES
NOTES TO THE CONSOLIDATED FINANCIAL STATEMENTS (Amounts in millions of Russian Rubles, unless otherwise stated)
111
When the Company has less than a majority of the voting rights of an investee, it has power over the investee when the voting rights are sufficient to give it the practical ability to direct the relevant activities of the investee unilaterally. The Company considers all relevant facts and circumstances in assessing whether or not the Company’s voting rights in an investee are
sufficient to give it power, including: the size of the Company’s holding of voting rights relative to the size and dispersion of
holdings of the other vote holders;
potential voting rights held by the Company, other vote holders or other parties;
rights arising from other contractual arrangements; and
any additional facts and circumstances that indicate that the Company has, or does not
have, the current ability to direct the relevant activities at the time that decisions need to
be made, including voting patterns at previous shareholders’ meetings.
Consolidation of a subsidiary begins when the Company obtains control over the subsidiary and ceases when the Company loses control of the subsidiary. Specifically, income and expenses of a subsidiary acquired or disposed of during the year are included in the consolidated statement of profit or loss from the date the Company gains control until the date when the Company ceases to
control the subsidiary. Profit or loss and each component of other comprehensive income is attributed to the owners of the Company and to the non-controlling interests. Total comprehensive income of subsidiaries is attributed to the owners of the Company and to the non-controlling interests even if this results in the non-controlling interests having a deficit balance.
When necessary, adjustments are made to the financial statements of subsidiaries to bring their accounting policies in line with the Group’s accounting policies. All intragroup assets and
liabilities, equity, income, expenses and cash flows relating to transactions between members of the Group are eliminated in full on consolidation. Non-controlling interests. Non-controlling interests represent the equity in a subsidiary not
attributable, directly or indirectly, to a parent. Non-controlling interests are presented separately in the consolidated statement of profit or loss and within equity in the consolidated statement of financial position, separately from parent shareholders’ equity. Functional currency. Items included in the financial statements of each of the Group’s entities are measured using the currency of the primary economic environment in which the entity operates (functional currency). The functional currency of the Group and the majority of its
subsidiaries operating in Russia is the Russian Ruble (“RUB”). The presentation currency of the consolidated financial statements of the Group is also the Russian Ruble. Critical judgements in applying accounting policies
The following are the critical judgements, apart from those involving estimations, that the Group
has made in the process of applying its accounting policies and that have the most significant effect on the amounts recognised in the consolidated financial statements. Agreement with RCOM. Note 5 describes that the Group signed an agreement with RCOM regarding the demerger of the telecommunication business of SSTL. The Group concluded that as of 31 December 2016 SSTL does not qualify for being reported as held for sale or a discontinued operation because the closing of the transaction is still subject to applicable approvals, which are
not considered perfunctory. Sources of estimation uncertainty In the application of the Group’s accounting policies management is required to make estimates and assumptions about the carrying amounts of assets and liabilities that are not readily
apparent from other sources. The estimates and associated assumptions are based on historical
experience and other factors that are considered to be relevant. Actual results may differ from these estimates.

SISTEMA PJSFC AND SUBSIDIARIES
NOTES TO THE CONSOLIDATED FINANCIAL STATEMENTS (Amounts in millions of Russian Rubles, unless otherwise stated)
112
The estimates and underlying assumptions are reviewed on an ongoing basis. Revisions to accounting estimates are recognised in the period in which the estimate is revised if the revision affects only that period or in the period of the revision and future periods if the revision affects both current and future periods.
Impairment of loans and receivables. The Group regularly reviews its accounts receivable, loans to customers, due from banks and other loans and receivables to assess for impairment. The Group’s allowances for impairment of such assets are established to recognize incurred impairment losses in its portfolio of loans and receivables. The Group considers accounting estimates related to impairment of loans and receivables a key source of estimation uncertainty because (i) they are highly susceptible to change from period to period as the assumptions about
future default rates and valuation of potential losses relating to impaired loans and receivables are based on recent performance experience, and (ii) any significant difference between the Group’s
estimated losses and actual losses could have a material impact on its financial statements in future periods. The Group uses management’s judgement to estimate the amount of any impairment loss in cases where a borrower has financial difficulties and there are few available sources of historical
data relating to similar borrowers. Similarly, the Group estimates changes in future cash flows based on customer performance in the past, on observable data indicating an adverse change in the payment status of borrowers in a group, and national or local economic conditions that correlate with defaults in the group. Management uses estimates based on historical loss experience for assets with similar credit risk characteristics and objective evidence of impairment. The Group uses management’s judgement to adjust observable data for a group of
loans to reflect current circumstances not observed in historical data. Impairment of financial assets in the consolidated financial statements has been determined on the basis of existing economic conditions. The Group is not in a position to predict what changes in
conditions will take place in its markets of operations and what effect such changes might have on
the adequacy of the accounting for impairment of financial assets in future periods. Impairment of long-lived assets. IFRS requires management to perform impairment tests annually for indefinite lived assets and, for finite lived assets, if events or changes in circumstances indicate that their carrying amounts may not be recoverable. Impairment testing
requires management to judge whether the carrying value of assets can be supported by the higher of the fair value of the asset or the net present value of future cash flows that they generate. Calculating the net present value of the future cash flows requires assumptions to be made in respect of highly uncertain matters. Fair value measurements. Some of the Group’s assets and liabilities are measured at fair value for financial reporting purposes. Where the fair value of assets and liabilities recorded in
the statement of financial position cannot be derived from active markets, their fair value is determined using valuation techniques, including discounted cash flow models. The inputs to
these models are taken from observable markets where possible, but when this is not feasible, a degree of judgment is required in establishing fair values. Information about assets and liabilities measured at fair value on recurring basis is disclosed in Note 34. Useful lives of property, plant and equipment and intangible assets. Estimates may change due to technological developments, competition, changes in market conditions and other factors and may result in changes in the estimated useful life and in the amortization or depreciation charges. Technological developments are difficult to predict and management views
on the trends and pace of development may change over time. The estimated useful lives are reviewed at the end of each reporting period, with the effect of any changes in estimate being accounted for on a prospective basis. Provisions and contingencies. The Group is subject to various legal proceedings, disputes, claims and regulatory reviews related to the Group’s business, licenses, tax positions and
investments, where the outcomes are subject to significant uncertainty. Management evaluates, among other factors, the degree of probability of an unfavourable outcome and the ability to
make a reasonable estimate of the amount of loss or related expense. Unanticipated events or changes in these factors may require the Group to increase or decrease the amount recorded or to be recorded for a matter that has not been previously recorded because it was not considered probable. See Notes 30 and 38 for further information.

SISTEMA PJSFC AND SUBSIDIARIES
NOTES TO THE CONSOLIDATED FINANCIAL STATEMENTS (Amounts in millions of Russian Rubles, unless otherwise stated)
113
4. SEGMENT INFORMATION As a diversified holding corporation, the Company invests in a range of businesses, which meet its investment and return criteria. The Company has determined that the chief operating decision
maker (“CODM”) is its Management Board. Information reported to the Management Board for the purpose of resource allocation and the assessment of segment performance is focused on each individual business. No operating segments have been aggregated in arriving at the reportable segments of the Group. The Group’s reportable segments are businesses that offer different products and services and are managed separately. The Group’s reportable segments are Mobile TeleSystems (“MTS”), Detsky mir, RTI, MTS Bank,
Sistema Shyam TeleServices (“SSTL”) and Corporate. MTS is one of the leading telecommunications group in Russia and the CIS, offering mobile and fixed voice, broadband,
internet access, pay TV as well as content and entertainment services in Russia, Ukraine, Armenia and Turkmenistan. Detsky mir is the largest retail chain in the children’s goods market in the Russian Federation and Kazakhstan. Activity of Detsky mir is the sale of children’s clothing and goods through retail and internet stores. RTI is a Russian industrial holding, which develops and manufactures high-tech products and infrastructure solutions in the fields of radio communication
and space technology, threat monitoring and control solutions, microelectronics and system integration. MTS Bank is a universal commercial bank with operations in Russia and Luxembourg. SSTL is a mobile operator in India. Corporate segment comprises the Company and entities, which hold and manage the Company’s interests in its subsidiaries, joint ventures and associates. The Other category includes other operating segments including Segezha Group, Sitronics, Kronshtadt Group, Binnopharm, Medsi, Agroholding Steppe, Sistema Venture Capital,
Intourist, Leader-Invest and Bashkirian Power Grid Company (“BPGC”), none of which meets the quantitative thresholds for determining reportable segments. The results of operations of Targin and Universal Mobile Systems (“UMS”) are reported as
discontinued operations in the accompanying consolidated statements of profit or loss for all periods presented (Note 8). The segment reporting for 2015 was restated accordingly. The consolidated statement of financial position was not retrospectively restated on discontinued
operations and therefore as of 31 December 2015 the statement of financial position captions in the “Other” category include Targin and captions in the MTS category include UMS. The accounting policies of the operating segments are the same as those described in the significant accounting policies. The Group’s CODM evaluates performance of the segments on the basis of operating income and OIBDA. OIBDA is defined as operating income before depreciation and amortisation.

SISTEMA PJSFC AND SUBSIDIARIES
NOTES TO THE CONSOLIDATED FINANCIAL STATEMENTS (Amounts in millions of Russian Rubles, unless otherwise stated)
114
The following is an analysis of the Group’s revenue and results from continuing operations by reportable segment for 2016 and 2015:
The following is an analysis of the Group’s depreciation and amortisation, additions to non-current assets (comprising property, plant and equipment, investment property and other intangible assets) and other non-cash items (comprising impairment of certain long-lived assets and non-current financial assets and gain on acquisition) by reportable segment:
2016 2015 2016 2015 2016 2015
MTS 433,972 425,674 1,720 965 86,227 91,708
Detsky mir 79,532 60,544 15 - 6,620 3,805
RTI 44,433 69,384 156 7,903 275 4,548
MTS Bank 19,074 25,157 1,159 462 (3,282) (17,658)
SSTL 12,466 13,965 - - (2,347) (3,227)
Corporate 1,737 2,272 1,115 1,145 (24,042) (14,392)
Total reportable segments 591,214 596,996 4,165 10,475 63,451 64,784
Other 106,491 81,825 3,699 5,026 16,274 (272)
697,705 678,821 7,864 15,501 79,725 64,512
Inter-segment
eliminations 119 3,876
Operating income 79,844 68,388
Finance income 9,853 18,451
Finance costs (56,251) (50,496)
Currency exchange gain/(loss) 6,055 (16,249)
Profit before tax 39,501 20,094
External Inter-segment Segment operating
income/(loss)revenue revenues
2016 2015 2016 2015 2016 2015
MTS 80,630 99,477 81,582 77,843 2,698 5,216
Detsky mir 1,760 5,352 1,591 954 26 363
RTI 3,091 4,768 2,539 2,482 1,643 431
MTS Bank 1,840 1,145 663 689 6,063 19,207
SSTL - - 889 832 - -
Corporate 6,488 2,476 564 523 8,967 1,273
Other 50,056 36,621 8,882 5,347 962 3,796
143,865 149,839 96,710 88,670 20,359 30,286
Other non-cash items
Additions to Depreciation
non-current assets and amortisation

SISTEMA PJSFC AND SUBSIDIARIES
NOTES TO THE CONSOLIDATED FINANCIAL STATEMENTS (Amounts in millions of Russian Rubles, unless otherwise stated)
115
The following is an analysis of the Group’s segment assets and liabilities by reportable segment:
2016 2015
Segment assets
MTS 559,008 669,331
Detsky mir 44,730 39,199
RTI 74,237 88,462
MTS Bank 166,526 184,971
SSTL 24,045 33,292
Corporate 110,783 201,576
Total reportable segments 979,329 1,216,831
Other 216,590 217,528
Total segment assets 1,195,919 1,434,359
Inter-segment eliminations (91,830) (142,566)
Consolidated total assets 1,104,089 1,291,793
Segment liabilities
MTS 400,618 485,104
Detsky mir 45,185 38,793
RTI 81,152 88,717
MTS Bank 137,047 165,801
SSTL 44,503 75,693
Corporate 154,235 197,005
Total reportable segments 862,740 1,051,113
Other 111,663 123,760
Total segment liabilities 974,403 1,174,873
Inter-segment eliminations (87,285) (128,677)
Consolidated total liabilities 887,118 1,046,196
As of 31 December 2016 and 2015, the amount of investment in MTS Belarus, an associate of MTS, included in its reportable segment assets was RUB 4,303 million and RUB 5,407 million,
respectively. Other associates and joint ventures represent separate operating segments and are reported in the Other category. The Group’s revenue from continuing operations from external customers by location of operations and information about its non-current assets by location of assets are detailed below.
2016 2015 2016 2015
Russia 604,768 595,360 538,799 507,660
India 13,233 13,965 16,571 21,311
Other 79,704 69,496 47,605 73,469
697,705 678,821 602,975 602,440
Non-current assetsexternal customersRevenue from

SISTEMA PJSFC AND SUBSIDIARIES
NOTES TO THE CONSOLIDATED FINANCIAL STATEMENTS (Amounts in millions of Russian Rubles, unless otherwise stated)
116
5. AGREEMENT WITH RCOM In November 2015, the Group signed an agreement with Reliance Communications Ltd. (RCOM) regarding the demerger of the telecommunication business of SSTL. As a result of the
transaction, SSTL will receive and hold a 10% equity stake in RCOM. In addition, RCOM will assume the liability to pay the Department of Telecommunications (DoT) instalments for SSTL’s spectrum. A payment mechanism has been agreed in relation to disputed spectrum contiguity charges claimed by the DoT. During 2016, the transaction was approved by the stock exchanges, the Securities and Exchange Board of India (SEBI), the Competition Commission of India (CCI), and the Bombay and Rajasthan High Courts. The final conditions of the transaction are to be agreed by the DoT.
6. INVESTIGATIONS INTO FORMER OPERATIONS IN UZBEKISTAN In March 2014, MTS received requests for the provision of information from the United States Securities and Exchange Commission (“SEC”) and the United States Department of Justice (“DOJ”) relating to a currently conducted investigation of the Group's former subsidiary in
Uzbekistan. In July 2015, activities related to the MTS former operations in Uzbekistan have been referenced in civil forfeiture complaints (the “Complaints”), filed by the DOJ in the U.S. District Court, Southern District of New York (Manhattan), directed at certain assets of an unnamed Uzbek government official. The Complaints allege among other things that MTS and certain other
parties made corrupt payments to the unnamed Uzbek official to assist their entering and operating in the Uzbekistan telecommunications market. The Complaints are solely directed towards assets held by the unnamed Uzbek official, and none of the Group assets are affected by the Complaints.
The Group continues to cooperate with these investigations. The Group cannot predict the outcome of the investigations, including any fines or penalties that may be imposed, and such
fines or penalties could be significant.
7. BUSINESS COMBINATIONS Acquisitions of businesses are accounted for using the acquisition method, with assets and liabilities of acquired entities being measured at their fair values as of the date of acquisition. Goodwill is determined as the excess of the consideration transferred plus the fair value of any
non-controlling interests in the acquiree at the acquisition date over the fair values of the identifiable net assets acquired. The excess of the fair values of the identifiable net assets acquired over the cost of the business combination plus the fair value of any non-controlling interests in the acquiree at the acquisition date is credited to income (“negative goodwill”).
Non-controlling interests that are present ownership interests and entitle their holders to a proportionate share of the entity’s net assets in the event of liquidation may be initially
measured either at fair value or at the non-controlling interests’ proportionate share of the recognised amounts of the acquiree’s identifiable net assets. The choice of measurement basis is made on a transaction-by-transaction basis. If the initial accounting for a business combination is incomplete by the end of the reporting period in which the acquisition occurs, the Group reports in its consolidated financial statements provisional amounts for the items for which the accounting is incomplete. During the measurement period, which could be up to one year from the acquisition date, the Group
retrospectively adjusts the provisional amounts recognised at the acquisition date to reflect new information obtained about facts and circumstances that existed as of the acquisition date.

SISTEMA PJSFC AND SUBSIDIARIES
NOTES TO THE CONSOLIDATED FINANCIAL STATEMENTS (Amounts in millions of Russian Rubles, unless otherwise stated)
117
Business combinations in 2016 The information on business combinations which took place in 2016 is summarized below:
Principal Date of Interest Acquiring Purchase
Acquiree activity acquisition acquired segment price
Lesosibirsk LDK No. 1 Pulp and paper February 60% Segezha Group 3,085
Agriculture Agriculture April-October 99%-100% Steppe 7,909
Regional Hotel Chain Hotel December 100% Intourist 2,786
Other 810
Total 14,590
The following table summarizes the amounts of the assets acquired and liabilities assumed relating to such acquisitions at the acquisition date:
Lesosibirsk Agriculture Regional
LDK No. 1 businesses Hotel Chain Other
Cash consideration 3,085 7,909 2,786 810
Recognised amounts of identifiable assets
and liabilities assumed:
Property, plant and equipment 6,511 7,168 5,867 3
Other non-current assets 12 106 255 371
Current assets 2,688 2,728 461 218
Deferred tax (liabilities)/assets (128) (1,006) 335 (3)
Borrowings (6,613) (1,511) (3,766) -
Other non-current liabilities - (40) - (69)
Current liabilities (824) (342) (366) (77)
Non-controlling interests (2,015) - - -
Gain on acquisitions - (1,175) - (235)
Goodwill 3,454 1,981 - 602
During the measurement period, the Group recognized impairment of goodwill of Lesosibirsk LDK
No. 1 of RUB 240 million. The excess of the consideration paid over the value of net assets of Lesosibirsk LDK No. 1 was allocated to goodwill, which mainly arised from expected synergies on effective management expertise in wood processing projects, well-functioning business processes, access to resources and availability of raw materials.
The excess of the consideration paid over the value of net assets of agriculture businesses was allocated to goodwill, which mainly arised from expected synergies on economies of scale related to operating and capital expenditures. The Group determined that the gain on acquisition of agriculture businesses was primarily attributable to the sellers’ decision to no longer operate in agriculture sector and their willingness
to sell the related businesses in short run. The initial accounting for the acquisitions of agriculture businesses, Regional Hotel Chain and other acquisitions has only been provisionally determined at the end of the reporting period. At the date of finalisation of these consolidated financial statements, the necessary market valuations and other calculations, including goodwill calculation had not been finalised and the amounts of identifiable assets acquired and liabilities assumed have therefore only been
provisionally determined based on the best estimate of the likely fair values.

SISTEMA PJSFC AND SUBSIDIARIES
NOTES TO THE CONSOLIDATED FINANCIAL STATEMENTS (Amounts in millions of Russian Rubles, unless otherwise stated)
118
Business combinations in 2015 Kronshtadt Group – In October 2015, Sistema acquired 100% of the share capital of Kronshtadt Group, a manufacturer of high-technology products and solutions for the aircraft manufacturing, defence, security and transportation industries, for a total cash consideration of
RUB 5.3 billion, including previously issued loan in the amount of RUB 0.6 billion. The Group saw high growth potential for the Kronshtadt Group business, driven by improving operating efficiency and the successful completion of certain research and development projects. In 2016 the Group finalized valuation of assets of the Kronshtadt Group with the involvement of the independent appraiser and the acquisition date fair value of the assets changed. The following table summarizes consideration paid and the amounts of the assets acquired and liabilities assumed
that were recognised at the acquisition date:
Provisional
amounts
Measurement
period
adjustments
Recognised
amounts
(as adjusted)
Cash consideration 5,342 - 5,342
Recognised amounts of identifiable assets acquired and liabilities assumed:
Current assets 5,031 671 5,702
Property, plant and equipment 1,947 205 2,152
Intangible assets 7,213 (5,937) 1,276
Other non-current assets 728 (209) 519
Current liabilities (7,501) 257 (7,244)
Deferred tax liabilities (1,590) 1,162 (428)
Other non-current liabilities (486) (444) (930)
Goodwill - 4,295 4,295
During the measurement period the Group recognized impairment of goodwill of Kronshtadt Group of RUB 4,295 million (recorded in consolidated statement of profit or loss for 2015). The Group revised their estimate of discounted cash flows as at acquisition date because design and development of unmanned aerial vehicles was at the pre-commercial stage. Other acquisitions – The information on other business combinations which took place in 2015
is summarised below:
Acquiree
Principal
activity
Date of
acquisition
Interest
acquired
Acquiring
segment
Purchase
price
Agriculture businesses Agriculture December 85%-100% Steppe 8,728
Other 1,636
Total 10,364
In 2016 the Group finalized valuation of other assets and the acquisition date fair value of the assets changed. The following table summarises the amounts of the assets acquired and liabilities assumed relating to these acquisitions at the acquisition dates:
Provisional
amounts
Measurement
period
adjustments
Recognised
amounts
(as adjusted)
Cash consideration 10,364 - 10,364
Recognised amounts of identifiable assets acquired and liabilities assumed:
Current assets 3,370 218 3,558
Property, plant and equipment 12,781 (4,960) 7,821
Other non-current assets 357 - 357
Current liabilities (1,792) 89 (1,703)
Deferred tax liabilities (1,458) 772 (686)
Other non-current liabilities (2,575) - (2,575)
Non-controlling interests (343) - (343)
Goodwill 24 3,881 3,905
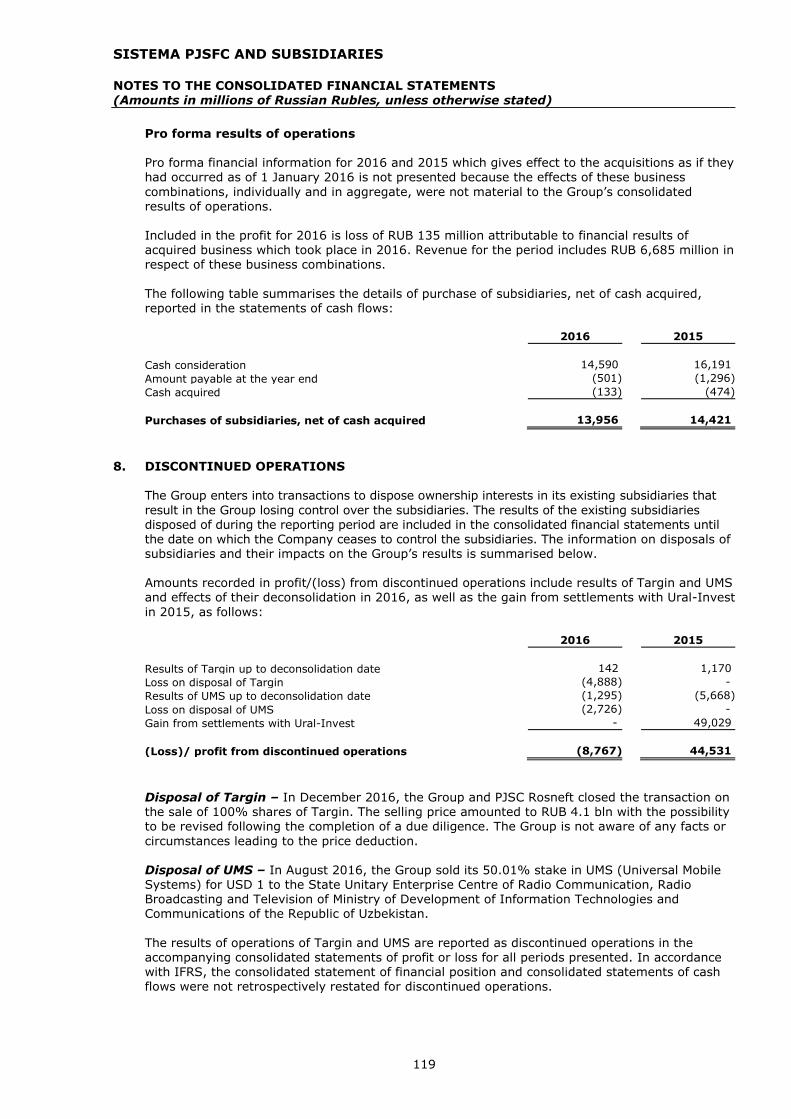
SISTEMA PJSFC AND SUBSIDIARIES
NOTES TO THE CONSOLIDATED FINANCIAL STATEMENTS (Amounts in millions of Russian Rubles, unless otherwise stated)
119
Pro forma results of operations Pro forma financial information for 2016 and 2015 which gives effect to the acquisitions as if they had occurred as of 1 January 2016 is not presented because the effects of these business
combinations, individually and in aggregate, were not material to the Group’s consolidated results of operations. Included in the profit for 2016 is loss of RUB 135 million attributable to financial results of acquired business which took place in 2016. Revenue for the period includes RUB 6,685 million in respect of these business combinations.
The following table summarises the details of purchase of subsidiaries, net of cash acquired, reported in the statements of cash flows:
2016 2015
Cash consideration 14,590 16,191
Amount payable at the year end (501) (1,296)
Cash acquired (133) (474)
Purchases of subsidiaries, net of cash acquired 13,956 14,421
8. DISCONTINUED OPERATIONS The Group enters into transactions to dispose ownership interests in its existing subsidiaries that
result in the Group losing control over the subsidiaries. The results of the existing subsidiaries disposed of during the reporting period are included in the consolidated financial statements until
the date on which the Company ceases to control the subsidiaries. The information on disposals of subsidiaries and their impacts on the Group’s results is summarised below. Amounts recorded in profit/(loss) from discontinued operations include results of Targin and UMS and effects of their deconsolidation in 2016, as well as the gain from settlements with Ural-Invest
in 2015, as follows: 2016 2015
Results of Targin up to deconsolidation date 142 1,170
Loss on disposal of Targin (4,888) -
Results of UMS up to deconsolidation date (1,295) (5,668)
Loss on disposal of UMS (2,726) -
Gain from settlements with Ural-Invest - 49,029
(Loss)/ profit from discontinued operations (8,767) 44,531
Disposal of Targin – In December 2016, the Group and PJSC Rosneft closed the transaction on the sale of 100% shares of Targin. The selling price amounted to RUB 4.1 bln with the possibility to be revised following the completion of a due diligence. The Group is not aware of any facts or
circumstances leading to the price deduction. Disposal of UMS – In August 2016, the Group sold its 50.01% stake in UMS (Universal Mobile Systems) for USD 1 to the State Unitary Enterprise Centre of Radio Communication, Radio Broadcasting and Television of Ministry of Development of Information Technologies and Communications of the Republic of Uzbekistan.
The results of operations of Targin and UMS are reported as discontinued operations in the accompanying consolidated statements of profit or loss for all periods presented. In accordance with IFRS, the consolidated statement of financial position and consolidated statements of cash
flows were not retrospectively restated for discontinued operations.

SISTEMA PJSFC AND SUBSIDIARIES
NOTES TO THE CONSOLIDATED FINANCIAL STATEMENTS (Amounts in millions of Russian Rubles, unless otherwise stated)
120
Gain/(losses) of the disposed subsidiaries included in discontinued operations in the consolidated statements of profit or loss for 2016 and 2015 are as follows: Targin UMS
2016 2015 2016 2015
Revenue 26,666 25,228 5,115 4,610
Expenses (26,365) (23,722) (6,602) (10,939)
Profit/(loss) before tax 301 1,506 (1,487) (6,329)
Income tax (expense)/ benefit (159) (336) 192 661
Results up to disposal date 142 1,170 (1,295) (5,668)
Cash flows from discontinued operations included in the consolidated statements of cash flows are as follows:
Targin UMS
2016 2015 2016 2015
Net cash provided by/(used in) operating activities 2,384 2,344 (544) (1,121)
Net cash used in investing activities (3,562) (2,976) - (1,252)
Net cash provided by financing
activities 1,792 730 1,234 3,492
Net cash inflows 614 98 690 1,119
The loss on disposal of Targin and UMS were measured as follows: Targin UMS
Net assets as at disposal date (8,989) (6,598)
Non-controlling interest - 1,787
Accumulated other comprehensive income - 2,085
Fair value of consideration 4,100 -
Loss on disposal (4,889) (2,726)
9. CAPITAL TRANSACTIONS OF SUBSIDIARIES The Group enters into transactions to acquire or dispose ownership interests in its existing subsidiaries that do not result in the Group losing control over the subsidiaries. Also, the entities of the Group enter into transactions with each other to transfer ownership interests in subsidiaries
within the Group. Such transactions are accounted for as equity transactions. The carrying amounts of the Group’s interests and the non-controlling interests (“NCI”) are adjusted to reflect the changes in their relative interests in the subsidiaries. Any difference between the amount by which the non-controlling interests are adjusted and the fair value of the consideration paid or received is recognised directly in equity in additional paid-in capital (“APIC”) and attributed to shareholders of the Company.

SISTEMA PJSFC AND SUBSIDIARIES
NOTES TO THE CONSOLIDATED FINANCIAL STATEMENTS (Amounts in millions of Russian Rubles, unless otherwise stated)
121
Transactions in 2016 The information on capital transactions of subsidiaries which took place in 2016 and their impacts on the Group’s equity is summarised below:
Acquisition of 15% in RTI – In December 2016, the Group purchased from VTB 15.32% of RTI share capital for a cash consideration of RUB 4.5 billion with a final settlement due in January 2019 including restructuring an option in respect of 2.91% for cash consideration of RUB 0.9 billion. The current Group's ownership interest in RTI is 87%. Disposal of 3.35% in MTS – In 2016 in a series of transactions the Group sold 33,911,737 American Depositary Shares of MTS to a non-affiliated buyer for a consideration of USD 279.3
million (RUB 17.7 billion). As of 31 December 2016, the remaining Group ownership interest in MTS was 50.03%. Additional share issues of Mikron – In February and December 2016, the Group participated in an additional share issues of PJSC Mikron (subsidiary of RTI) for RUB 3.4 billion.
Additional share issues of MTS Bank – In February 2016 and November 2016, the Group participated in additional share issues of MTS Bank for RUB 15.5 billion. Restructuring of Steppe – In October 2016, the Group sold 11.9% of Steppe in exchange for a minority stakes in Steppe’s subsidiaries and cash consideration of RUB 0.5 billion with a final settlement due in October 2019.
Restructuring of Sitronics – In October 2016, the Group purchased 26% of Sitronics CAMS (subsidiary of Sitronics) in an exchange of assets. In May 2016, Sistema Finance S.A. performed
intragroup acquisition from Sitronics 100% of SITRONICS IT BV for cash consideration of RUB 5.7 billion. Disposal of 10% and 3% in RTI – In April 2016, the Group sold 10% of RTI share capital to PJSC Sovcombank for a total cash consideration of RUB 1 billion. In March 2016, the Group also
exchanged 3% in RTI for 1.5% in JSC Concern RTI Systems (subsidiary of RTI). Acquisition of 39% in Lesosibirsk LDK No. 1 – In April 2016, in a series of transactions the Group acquired an additional stake in Lesosibirsk LDK No. 1 for a total cash consideration of RUB 2 billion and increased its stake from 60% to 99%.
Increase/ Increase/
(decrease) of (decrease) of
additional paid- non-controlling
in capital interests
Acquisition of 15% in RTI (4,272) 1,749
Disposal of 3.35% in MTS 12,367 6,023
Additional share issues of Mikron (967) 967
Additional share issues of MTS Bank (1,527) 1,527
Restructuring of Steppe (831) 1,342
Restructuring of Sitronics (818) 183
Disposal of 10% and 3% in RTI 1,714 (714)
Acquisition of 39% of Lesosibirsk LDK No. 1 - (2,091)
Other (1,284) 372
Total impact 4,382 9,358

SISTEMA PJSFC AND SUBSIDIARIES
NOTES TO THE CONSOLIDATED FINANCIAL STATEMENTS (Amounts in millions of Russian Rubles, unless otherwise stated)
122
Transactions in 2015 The information on capital transactions of subsidiaries which took place in 2015 and their impacts on the Group’s equity is summarized below:
Increase/
(decrease) of
additional
paid-in capital
Increase/
(decrease) of
non-controlling
interests
Sale of 23.1% in Detsky mir 9,238 180
Acquisition of 25.02% Medsi (2,643) (3,473)
Intragroup transfer of NVision Group to MTS 4,211 (4,211)
Intragroup transfer of Rent-Nedvizhimost (2,845) 2,845
Other 313 (1,793)
Total impact 8,274 (6,452)
Sale of 23.1% in Detsky mir – In December 2015, the Group sold 23.1% of Detsky mir to the Russia-China Investment Fund (“RCIF”) for a total consideration of RUB 9.75 billion. The remaining Group’s ownership interest in Detsky mir is 75.8%. The Group granted the buyer an option to put
its stake in Detsky mir to the Group at fair value in case of the non-occurrence of prescribed future events. The Group concluded that this puttable instrument should be classified as equity instrument rather than a financial liability because the occurrence of these events is considered under the control of the Group. Acquisition of 25.02% Medsi – In October 2015, the Group acquired additional 25.02% stake in Medsi for RUB 6.1 billion and increased its stake to 100%.
Intragroup transfer of NVision Group to MTS – During 2015, in a series of transactions, the Group’s subsidiaries Sistema Telecoms Assets and RTI sold 100% stake in NVision Group to MTS. Intragroup transfer of Rent-Nedvizhimost – During 2015, in a series of transactions, MTS sold 100% stake in Rent-Nedvizhimost to Business-Nedvizhimost, another subsidiary of Sistema.
10. REVENUE The Group receives its revenue primarily from the sale of goods and rendering services in Russia. Revenue is measured at the fair value of the consideration received or receivable. Revenue is reduced for estimated customer returns, rebates and other similar allowances. Revenues under arrangements specific to the reportable segments of the Group are recognised
as follows. MTS – Revenues derived from wireless, local telephone, long distance, data and video services are recognised when services are provided. This is based upon either usage (minutes of traffic processed, volume of data transmitted) or period of time (monthly subscription fees). Content revenue is presented net of related costs when MTS acts as an agent of the content providers while the gross revenue and related costs are recorded when MTS is a primary obligor in the arrangement. Upfront fees received for connection of new subscribers, installation and activation of wireless, wireline and data transmission services (“connection fees”) are deferred and recognized over the estimated average subscriber life, as follows:
Mobile subscribers 8 months - 7 years Residential wireline voice phone subscribers 15 years Other fixed line subscribers 3-5 years
MTS calculates an average life of mobile subscribers for each region in which it operates and amortises connection fees based on the average life specific to that region.

SISTEMA PJSFC AND SUBSIDIARIES
NOTES TO THE CONSOLIDATED FINANCIAL STATEMENTS (Amounts in millions of Russian Rubles, unless otherwise stated)
123
Incentives provided to customers are usually offered on signing a new contract or as part of a promotional offering. Incentives representing the reduction of the selling price of the service (free minutes and discounts) are recorded in the period to which they relate, when the respective revenue is recognized, as a reduction to both accounts receivable and revenue. MTS Bank – Revenues from interest bearing assets are recognized on an accrual basis using the effective interest method. The effective interest method is a method of calculating the amortised cost of a financial asset or a financial liability (or group of financial assets or financial liabilities) and of allocating the interest income or interest expense over the relevant period. The effective interest rate is the rate that exactly discounts estimated future cash receipts (including all fees on points paid or received that form an integral part of the effective interest rate, transaction costs and other premiums or discounts) through the expected life of the debt
instrument, or (where appropriate) a shorter period, to the net carrying amount on initial
recognition. MTS Bank revenues are included in the rendering of services line below. RTI – When the outcome of a construction contract can be estimated reliably, revenue and costs are recognised by reference to the stage of completion of the contract activity at the end of the reporting period, measured based on the proportion of contract costs incurred for work performed
to date relative to the estimated total contract costs, except where this would not be representative of the stage of completion. Variations in contract work, claims and incentive payments are included to the extent that the amount can be measured reliably and its receipt is considered probable. When the outcome of a construction contract cannot be estimated reliably, contract revenue is recognised to the extent of contract costs incurred that it is probable will be recoverable. Contract costs are recognised as expenses in the period in which they are incurred. When it is probable
that total contract costs will exceed total contract revenue, the expected loss is recognised as an expense immediately.
Revenues from the long-term contracts are recognised using the percentage-of-completion method, measured by the percent of contract costs incurred to-date to estimated total contract costs. The stage of completion of a contract is determined based on the proportion that contract costs incurred for work performed to date bear to the estimated total contract costs.
The following is an analysis of the Group’s revenue from continuing operations:
2016 2015
Rendering of services 456,332 461,955
Sale of goods 209,065 164,472
Construction contracts 32,308 52,394
697,705 678,821
Construction contracts
When contract costs incurred to date plus recognised profits less recognised losses exceed progress billings, the surplus is shown as amounts due from customers for contract work. For contracts where progress billings exceed contract costs incurred to date plus recognised profits less recognised losses, the surplus is shown as the amounts due to customers for contract work. Amounts received before the related work is performed are included in the consolidated
statement of financial position, as a liability for advances received. Amounts billed for work performed but not yet paid by the customer are included in the consolidated statement of financial position under inventories.

SISTEMA PJSFC AND SUBSIDIARIES
NOTES TO THE CONSOLIDATED FINANCIAL STATEMENTS (Amounts in millions of Russian Rubles, unless otherwise stated)
124
The following is an analysis of amounts due from/(to) customers under construction contracts:
2016 2015
Contracts in progress at the end of the year:
Construction costs incurred plus recognised
profits less recognised losses to date 97,726 84,771
Less: progress billings (98,983) (85,195)
(1,257) (424)
Costs and estimated earnings in excess of billings
on uncompleted contracts 8,285 11,427
Billings in excess of costs and estimated earnings
on uncompleted contracts (9,542) (11,851)
(1,257) (424)
11. IMPAIRMENT OF LONG-LIVED ASSETS
Impairment of long-lived assets includes impairment of property, plant and equipment, goodwill and other intangible assets.
2016 2015
Impairment of goodwill (Note 17) 241 8,666
Impairment of other long-lived assets 2,655 3,275
Total impairment of long-lived assets 2,896 11,941
1
12. IMPAIRMENT OF FINANCIAL ASSETS Impairment of financial assets for 2016 and 2015 comprise the following:
2016 2015
Allowance for doubtful accounts 3,773 3,818
Impairment of cash and deposits in banks (Note 38) - 2,129
Impairment of available for sale securities 1,027 1,273
Impairment of loans carried at amortised cost 6,600 -
Total impairment of financial assets 11,400 7,220
Provision for financial assets attributable to MTS Bank is reported in cost of sales.
13. INCOME TAXES The Group measures and records its current income tax payable and its tax bases in its assets and liabilities in accordance with the tax regulations of the countries where the Group and its subsidiaries operate, which may differ from IFRS.
The Group is subject to permanent tax differences due to the non-tax deductibility of certain expenses and certain income being treated as non-taxable for tax purposes. Deferred taxes
reflect the net tax effects of temporary differences between the carrying amounts of assets and liabilities for financial reporting purposes and the amounts used for tax purposes.

SISTEMA PJSFC AND SUBSIDIARIES
NOTES TO THE CONSOLIDATED FINANCIAL STATEMENTS (Amounts in millions of Russian Rubles, unless otherwise stated)
125
Deferred tax assets are not recognized when it is more likely than not that some portion or all of the deferred tax assets will not be realized. In making such determination, the Group considers all available positive and negative evidence, including projected future taxable income, tax planning strategies and recent financial operations. The tax rate used for the reconciliations below is the corporate tax rate of 20% payable by corporate entities in the RF on taxable profits (as defined) under tax law in that jurisdiction. The Group’s income tax expense for 2016 and 2015 comprise the following:
2016 2015
Current income tax expense 23,360 19,739
Deferred income tax benefit (1,785) (1,488)
Total income tax expense recognised in the current year
relating to continuing operations 21,575 18,251 Income tax expense calculated by applying the Russian statutory income tax rate to income from continuing operations before income tax differs from income tax expense recognized in the consolidated statements of profit or loss as a consequence of the following adjustments:
2016 2015
Profit before tax (39,501) (20,094)
Income tax expense calculated at 20% 7,900 4,019
Adjustments due to:
Earnings distribution from subsidiaries and associates 3,454 1,221
Increase of unrecognised deferred tax assets 5,164 10,028
Other non-deductible expenses 5,188 3,384
Settlements with tax authorities 68 335
Different tax rate of subsidiaries (410) (533)
Non-taxable income (869) -
Other 1,080 (203)
Income tax expense 21,575 18,251

SISTEMA PJSFC AND SUBSIDIARIES
NOTES TO THE CONSOLIDATED FINANCIAL STATEMENTS (Amounts in millions of Russian Rubles, unless otherwise stated)
126
The following is the analysis of deferred tax assets/(liabilities) presented in the consolidated statements of financial position:
Recognised
Opening in profit Recognised Acquisitions Closing
2016 balance or loss in OCI /disposals balance
Deferred tax (liabilities)/
assets in relation to:
Accrued expenses and
accounts payable 10,806 (2,376) (131) (196) 8,103
Property, plant and equipment (19,912) (994) (653) (2,630) (24,189)
Intangible assets (9,749) (1,621) 166 572 (10,632)
Deferred connection fees 639 (20) (32) (47) 540
Inventory obsolescence 791 532 - (31) 1,292
Allowance for doubtful accounts
and loans receivable 877 267 (236) 54 962
Deferred revenues - 164 - - 164
Undistributed earnings
of subsidiaries and joint
ventures and assoсiates (7,240) 861 548 - (5,831)
Tax losses carried forward 12,502 1,606 (49) (164) 13,895
Other (4,412) 3,523 374 (358) (873)
Total (15,698) 1,942 (13) (2,800) (16,569)
Recognised
Opening in profit Recognised Acquisitions Closing
2015 balance or loss in OCI /disposals balance
Deferred tax (liabilities)/
assets in relation to:
Accrued expenses and
accounts payable 6,439 4,476 (109) - 10,806
Property, plant and equipment (16,064) (3,609) 261 (500) (19,912)
Intangible assets (10,015) 712 (380) (66) (9,749)
Deferred connection fees 929 (231) (59) - 639
Inventory obsolescence 895 (104) - - 791
Allowance for doubtful accounts
and loans receivable 2,139 (1,262) - - 877
Undistributed earnings
of subsidiaries and joint
ventures and assoсiates (7,000) 64 (304) - (7,240)
Tax losses carried forward 13,417 (1,443) 528 - 12,502
Other (5,171) (680) 590 849 (4,412)
Total (14,431) (2,077) 527 283 (15,698)

SISTEMA PJSFC AND SUBSIDIARIES
NOTES TO THE CONSOLIDATED FINANCIAL STATEMENTS (Amounts in millions of Russian Rubles, unless otherwise stated)
127
As of 31 December 2016 and 2015 the Group reported the following deferred income tax assets and liabilities in the consolidated statements of financial position:
2016 2015
Deferred tax assets 24,185 25,966
Deferred tax liabilities (40,753) (41,664)
Net deferred tax liabilities (16,568) (15,698)
As of 31 December 2016 and 2015 the tax losses carried forward, for which deferred tax assets were recognised, amounted to RUB 69,474 million and RUB 62,509 million, respectively.
Federal law №401-FZ dated 30 November 2016 allowed for the indefinite carry forward of tax losses, whereas this was previously restricted to 10 years. Also the law specified that the tax base for the years 2017-2020 may not be reduced by tax losses carried forward in an amount
exceeding 50% of the base. The following table summarizes temporary differences, for which deferred tax assets were not recognised in the consolidated statements of financial position as of 31 December 2016 and 2015:
Jurisdiction
Carry-forward
period
2016 2015
India 2017-2025 189,505 178,274
Russia infinite 158,301 133,749
Total 347,806 312,023
14. EMPLOYEE BENEFITS EXPENSES
Employee benefits expenses consist of salaries, bonuses and social security contributions. Employee benefits expenses included in cost of sales and selling, general and administrative expenses for 2016 and 2015 comprised RUB 142,099 million and RUB 136,395 million, respectively. Share options granted under the Company’s employee share option plan – In 2016 and
2015 the Company’s Board of Directors established two-year motivational programs for senior and mid-level management. Participants of the programs, upon fulfilment of certain performance conditions and subject to continuing employment with the Group, are granted ordinary shares in the Company. As a result, the Group recognised an expense of RUB 2,522 million and RUB 2,866 million in the
consolidated statements of profit or loss for 2016 and 2015, respectively. The fair value of awards granted was measured based on the fair value of the Company’s ordinary shares. The awards are equity-settled and are recognised in additional paid-in capital.

SISTEMA PJSFC AND SUBSIDIARIES
NOTES TO THE CONSOLIDATED FINANCIAL STATEMENTS (Amounts in millions of Russian Rubles, unless otherwise stated)
128
15. PROPERTY, PLANT AND EQUIPMENT Property, plant and equipment are stated at historical cost. Cost includes major expenditures for improvements and replacements, which extend useful lives of the assets or increase their revenue generating capacity. Repairs and maintenance, including preventive maintenance, are
charged to the consolidated statement of profit or loss as incurred. The cost of major overhauls and replacements, which extend useful lives of the assets or increase their revenue generating capacity, are capitalised to the cost of the assets. Depreciation for property, plant and equipment is computed under the straight-line method utilizing estimated useful lives of the assets as follows:
Buildings 20-50 years
Leasehold improvements the term of the lease Base stations 7 years Other network equipment up to 31 years
Power and utilities up to 35 years
Other up to 15 years Borrowing costs directly attributable to the acquisition, construction or production of qualifying assets, which are assets that necessarily take a substantial period of time to get ready for their intended use or sale, are added to the cost of those assets, until such time as the assets are substantially ready for their intended use or sale. The Group considers a construction period of more than six months to be substantial. Investment income earned on the temporary investment
of specific borrowings pending their expenditure on qualifying assets is deducted from the borrowing costs eligible for capitalisation. All other borrowing costs are recognised in profit or loss in the period in which they are incurred.
Property, plant and equipment, net of accumulated depreciation, as of 31 December 2016 and 2015 consisted of the following:
2016 2015
Carrying amount
Switches, transmission devices, network and base station
equipment
243,349 268,884
Buildings and leasehold improvements 77,169 69,355
Power and utilities 25,206 23,168
Land 18,133 12,382
Other 44,273 47,733
Total 408,130 421,522

SISTEMA PJSFC AND SUBSIDIARIES
NOTES TO THE CONSOLIDATED FINANCIAL STATEMENTS (Amounts in millions of Russian Rubles, unless otherwise stated)
129
Buildings
and
leasehold
improve-
ments Total
Cost
Balance at 1 January 2015 555,259 82 ,686 29 ,696 8 ,810 96 ,694 773,145
A dditions 58,618 5 ,365 4 ,009 - 17 ,611 85 ,603
Disposals (24,254) (1 ,680) (206) (120) (5 ,772) (32,032)
Bus iness
combinations - 5 ,677 - 2 ,685 1 ,611 9 ,973
Rec lass ified to
inves tment property (1 ,059) - - - - (1 ,059)
C urrency trans lation
adjus tment (4 ,392) 2 ,320 - - 501 (1 ,571)
Impairment - (2 ,520) - (115) (669) (3 ,304)
O ther (380) (1 ,793) - 1 ,122 (295) (1 ,346)
Balance at 31 December 2015 583,792 90 ,055 33 ,499 12 ,382 109,681 829,409
A dditions 41,862 7 ,252 4 ,301 87 20 ,427 73 ,929
Disposals (27,291) (2 ,022) (92) - (25,981) (55,386)
Bus iness
combinations - 8 ,758 - 5 ,726 5 ,065 19 ,549
Rec lass ified from
inves tment property - 804 - - - 804
Rec lass ified to
assets held for sale (1 ,557) (564) - - (8) (2 ,129)
C urrency trans lation
adjus tment (19,023) (2 ,444) - (62) (3 ,337) (24,866)
Impairment - (95) - - (502) (597)
O ther (65) (283) - - 164 (184)
Balance at
31 December 2016 577,718 101,461 37,708 18,133 105,509 840,529
and impairment
Balance at 1 January 2015 (288,513) (19,657) (8 ,145) - (56,182) (372,497)
Disposals 21,160 1 ,623 17 - 5 ,068 27 ,868
Rec lass ified to
inves tment property 490 - - - - 490
Deprec iation expense (51,967) (2 ,666) (2 ,203) - (10,869) (67,705)
C urrency trans lation
adjus tment 3,922 - - - 643 4 ,565
O ther - - - - (608) (608)
Balance at 31 December 2015 (314,908) (20,700) (10,331) - (61,948) (407,887)
Disposals 20,222 316 19 - 13 ,690 34 ,247
Rec lass ified to
assets held for sale 846 41 - - 9 896
Deprec iation expense (52,393) (4 ,351) (2 ,190) - (15,102) (74,036)
C urrency trans lation
adjus tment 12,086 587 - - 2 ,124 14 ,797
O ther (222) (185) - - (9) (416)
Balance at
31 December 2016 (334,369) (24,292) (12,502) - (61,236) (432,399)
Accumulated depreciation
Other Land
Power and
utilities
Switches,
transmissio
n devices,
network
and base
station
equipment

SISTEMA PJSFC AND SUBSIDIARIES
NOTES TO THE CONSOLIDATED FINANCIAL STATEMENTS (Amounts in millions of Russian Rubles, unless otherwise stated)
130
16. INVESTMENT PROPERTY Investment property primarily includes apartment buildings, cottages, office and commercial space and business centres owned by the companies of the Group operating in real estate segment,
including Leader-Invest, Business Nedvizhimost and Mosdachtrest. Investment property is stated at cost less accumulated depreciation and impairment losses. Depreciation for investment property is computed under the straight-line method utilising estimated useful lives of the assets of 25 years. Accumulated depreciation as of 31 December 2016 and 2015 amounted to RUB 3,035 million and RUB 2,255 million respectively.
2016 2015
Balance at the beginning of the year 14,085 10,229
Reclassified (to)/from property, plant and equipment (804) 569
Additions 10,902 4,787
Disposals (1,368) (893)
Depreciation expense (256) (607)
Reclassified from inventories 88 -
Balance at the end of the year 22,647 14,085
Included in revenue is investment property rental income for 2016 of RUB 2,608 million (2015: RUB 2,455 million). Operating expenses arising from the investment property that generated rental income during 2016 totalled RUB 377 million (2015: RUB 244 million). In estimating the fair value of the investment property, the Group classified the properties within Level 3 of the fair value hierarchy. As of 31 December 2016 and 2015, the Group determined the
fair values of the investment property at RUB 59,107 million and RUB 51,266 million, respectively. The fair values as of 31 December 2016 and 2015 were determined either based on discounted cash flows or by reference to market values of similar properties in the relevant region. The main inputs to the fair value measurement are the discount rate, revenue growth rates, OIBDA margin and adjustments to market values of similar properties.

SISTEMA PJSFC AND SUBSIDIARIES
NOTES TO THE CONSOLIDATED FINANCIAL STATEMENTS (Amounts in millions of Russian Rubles, unless otherwise stated)
131
17. GOODWILL Goodwill arising on an acquisition of a business is carried at cost as established at the date of acquisition of the business less accumulated impairment losses, if any.
The carrying amounts of goodwill attributable to operating segments are as follows:
The Group performs impairment tests for the goodwill assigned to cash-generating units (CGUs) at least annually and when there are any indications that the carrying amount of the cash-generating unit is impaired. When the carrying amount of the cash-generating unit to which goodwill is allocated exceeds its recoverable amount, goodwill allocated to this cash-generating unit is impaired.
For the purposes of impairment testing, goodwill attributable to the MTS segment is allocated to cash-generating units for the years ended 31 December as follows:
2016 2015
Russia convergent 28,800 28,800
Armenia 3,707 4,456
Moscow fixed line 1,083 1,083
Ukraine 95 129
Unallocated 8,719 8,719
Total 42,404 43,187
Segezha
MTS SSTL RTI Steppe Group Other Total
Balance as of
1 January 2015
Gross amount of goodwill 46,496 16,495 8,323 - - 2,922 74,236
Accumulated impairment
loss (1,466) (16,495) (8,219) - - (2,064) (28,244)
45,030 - 104 - - 858 45,992
Business combinations - - - 3,862 - 4,338 8,200
Impairment (3,516) - - - - (5,150) (8,666)
Currency translation
adjustment 1,673 - - - - 57 1,730
Balance as of
31 December 2015
Gross amount of goodwill 48,169 20,408 8,323 3,862 - 7,317 88,079
Accumulated impairment
loss (4,982) (20,408) (8,219) - - (7,214) (40,823)
43,187 - 104 3,862 - 103 47,256
Business combinations - - - 1,981 3,454 602 6,037
Impairment (241) (241)
Currency translation
adjustment (783) - - - - (45) (828)
Balance as of
31 December 2016
Gross amount of goodwill 47,386 16,578 8,323 5,843 3,454 7,874 89,458
Accumulated impairment
loss (4,982) (16,578) (8,219) - (241) (7,214) (37,234)
42,404 - 104 5,843 3,213 660 52,224

SISTEMA PJSFC AND SUBSIDIARIES
NOTES TO THE CONSOLIDATED FINANCIAL STATEMENTS (Amounts in millions of Russian Rubles, unless otherwise stated)
132
The “Russia convergent” CGU represents mobile and fixed line operations, which encompasses services rendered to customers across regions of Russia, except for “Moscow fixed line”, which represents the results of fixed line operations carried out in Moscow by MGTS, a subsidiary of MTS.
“Armenia” and “Ukraine” represent operations carried out by subsidiaries of MTS in the respective countries. Goodwill allocated to these CGUs has arisen on acquisitions made by MTS. The Group does not allocate goodwill recognised as a result of its purchases of MTS shares by the Group to CGUs as it is monitored for internal management purposes at the level of the MTS segment as a whole. Unallocated amount of goodwill is tested for impairment with the reference to the market capitalisation of MTS.
The recoverable amounts of the CGUs are determined based on their value in use. In assessing value in use, the estimated future cash flows are discounted to present value using a pre-tax
discount rate that reflects current market assessments of the time value of money and the risks specific to the CGU. Future cash flows calculations are based on a five-year operation plan. Estimation of future cash flows requires assumptions to be made in respect of uncertain factors, including management’s
expectations of margins, timing and amount of future capital expenditure, terminal growth rates and appropriate discount rates to reflect the risks involved. During 2016 no impairment charges were recorded in respect of the Group’s goodwill balances. The key assumptions used in the value in use calculations are as follows:
Forecasted OIBDA margin and capital expenditure were primarily derived from internal sources, based on past experience and extended to include management expectations.
The table below presents forecasted OIBDA margin and capital expenditure as a percentage of revenue over the following five years utilised for value in use calculation of related CGUs:
CGU 2016 2015 2016 2015
Russia convergent 34.6%-37.0% 32.3%-34.9% 18.8% 17.6%
Armenia 42.0%-45.0% 44.7%-46.1% 11.9% 12.0%
Moscow fixed line 42.2%-51.0% 48.2%-53.4% 17.5% 15.0%
Ukraine 40.6%-46.5% 35.4%-41.3% 19.9% 24.4%
OIBDA margin as a percentage of revenue
Capital expenditure
The terminal growth rate has been determined based on the nominal gross domestic product rates for the country of operation, adjusted for specific characteristics of the CGUs business. The discount rate is the weighted average cost of capital, being equity and debt, according to the
industry average finance structure. The cost of equity is calculated based on the risk free rate for
long-term bonds issued by the government in the respective market. These rates are adjusted for a risk premium to reflect both the increased risk of investing in equities and the systematic risk of the specific CGU. The cost of debt is defined as the rate effective for borrowings drawn by the Group at or near the date of the impairment test. The table below presents terminal growth rate and pre-tax rates for discounting cash flows in
functional currencies utilized for value in use calculation of related CGUs:
CGU 2016 2015 2016 2015
Russia convergent 1% 1% 15.1% 13.9%
Armenia nil nil 15.5% 17.7%
Moscow fixed line 1% 1% 13.7% 18.4%
Ukraine 3% 3% 21.6% 26.6%
Discount rateTerminal growth rate
Management believes that no reasonably possible change in any of the above key assumptions would cause the carrying value of any cash-generating unit to materially exceed its recoverable amount.

SISTEMA PJSFC AND SUBSIDIARIES
NOTES TO THE CONSOLIDATED FINANCIAL STATEMENTS (Amounts in millions of Russian Rubles, unless otherwise stated)
133
18. OTHER INTANGIBLE ASSETS Other intangible assets are mainly represented by billing and telecommunication software and other software, operating licenses, acquired customer bases and customer relationships.
Intangible assets with finite useful lives that are acquired separately are carried at cost less accumulated amortisation and impairment losses. Intangible assets acquired in a business combination and recognised separately from goodwill are initially recognised at their fair value at the acquisition date (which is regarded as their cost). Subsequent to initial recognition, intangible assets acquired in a business combination are reported at cost less accumulated amortisation and impairment losses, on the same basis as intangible assets that are acquired separately.
All finite-life intangible assets are amortised using the straight-line method utilising estimated
useful lives of the assets as follows:
Operating licenses 3-20 years
Billing and telecommunication software 1-20 years
Radio frequencies 2-15 years
Customer base 1-8 years
Software and other 1-10 years
The estimated useful life and amortisation method are reviewed at the end of each reporting period, with the effect of any changes in estimate being accounted for on a prospective basis. Trademarks with indefinite contractual life are not amortised, but are reviewed, at least annually, for impairment.
Intangible assets other than goodwill as of 31 December 2016 and 2015 consisted of the
following:
2016 2015
Carrying amounts of:
Amortised intangible assets:
Billing and telecommunication software 48,266 40,979
Operating licenses 36,887 43,460
Radio frequencies 4,120 5,065
Acquired customer base 3,306 4,359
Software and other 8,568 11,881
101,147 105,744
Unamortised intangible assets:
Trademarks 6,569 6,563
Total 107,716 112,307

SISTEMA PJSFC AND SUBSIDIARIES NOTES TO THE CONSOLIDATED FINANCIAL STATEMENTS (Amounts in millions of Russian Rubles, unless otherwise stated)
134
Billing and
telecom
software
Operating
licenses
Customer
base
Radio
frequen -
cies
Software and
other
Trade -
marks Total
Cost or valuation
Balance at
1 January 2015 84,923 41,553 13,302 8,294 26,276 6,748 181,096
Additions 19,976 11,705 1,262 1,679 - 34,622
Disposals (18,888) (1) (1,228) (268) (859) - (21,244)
Business combinations - - - - 1,332 - 1,332
Currency translation -
adjustment (372) 7,162 206 - 639 (185) 7,450
Impairment - - - - - - -
Other (212) 38 86 38 366 - 316
Balance at
31 December 2015 85,427 60,457 12,366 9,326 29,433 6,563 203,572
Additions 27,658 3,382 325 245 1,843 - 33,453
Disposals (12,400) (47) (164) (582) (7,665) - (20,858)
Business combinations - 323 - - - - 323
Currency translation -
adjustment (3,763) (9,462) - - (1,227) 6 (14,446)
Other (87) 44 - (40) (43) - (126)
Balance at
31 December 2016 96,835 54,697 12,527 8,949 22,341 6,569 201,918
Accumulated
depreciation and
impairment
Balance at
1 January 2015 (47,171) (13,249) (7,785) (3,317) (11,624) - (83,146)
Disposals 18,528 2 1,228 287 780 - 20,825
Amortisation expense (16,075) (2,279) (692) (1,202) (6,355) - (26,603)
Currency translation
adjustment 866 (1,534) (758) - (289) - (1,715)
Other (596) 63 - (29) (64) - (626)
Balance at
31 December 2015 (44,448) (16,997) (8,007) (4,261) (17,552) - (91,265)
-
Disposals 10,687 2 164 582 5,889 - 17,324
Amortisation expense (17,548) (3,587) (1,378) (1,170) (2,756) - (26,439)
Currency translation
adjustment 2,697 2,779 - - 702 - 6,178
Other 43 (7) - 20 (56) - -
Balance at
31 December 2016 (48,569) (17,810) (9,221) (4,829) (13,773) - (94,202)
MTS operating licenses. In connection with providing telecommunication services, the Group has been issued various GSM operating licenses by the Russian Ministry of Information Technologies and Communications (the «Ministry»). In addition to the licenses received directly from the Ministry, the Group has been granted access to various telecommunication licenses through acquisitions. In foreign subsidiaries, the licenses are granted by the local communication authorities.
Operating licenses contain a number of requirements and conditions specified by legislation. The requirements generally include the targets for start date of service, territorial coverage and expiration date. Management believes that the Group is in compliance with all material terms of its licenses.
The Group’s operating licenses do not provide for automatic renewal. As of 31 December 2016, all expired licenses covering the territories of the Russian Federation were renewed. The cost to renew the licenses was not significant. The weighted-average period until the next renewal of licenses in the Russian Federation is five years.

SISTEMA PJSFC AND SUBSIDIARIES NOTES TO THE CONSOLIDATED FINANCIAL STATEMENTS (Amounts in millions of Russian Rubles, unless otherwise stated)
135
The license for the provision of telecommunication services in Ukraine was renewed in 2013 and is valid until 2026. The license for the provision of telecommunication services in Armenia is valid until 2019. The license for the provision of telecommunication services in Turkmenistan is valid until 2029. SSTL spectrum. SSTL owns 800 MHz technology neutral spectrum in nine telecom circles of India. Liability for the spectrum is payable in equal annual installments during the period from
2016 to 2025 and is included in Other financial liabilities.
19. INVESTMENTS IN ASSOCIATES AND JOINT VENTURES The Group holds interests in several associates, the most significant of which are MTS Belarus,
OZON, and joint ventures represented by real estate projects and SG-trans (disposed in 2016).
All investments in associates and joint ventures are accounted for using the equity method. Investments in associates and joint ventures as of 31 December 2016 and 2015 consisted of the following:
Voting Carrying Voting Carrying
power value power value
MTS Belarus 49.00% 4,303 49.00% 5,407
OZON 21.60% 4,929 21.60% 5,409
SG-trans - - 50.00% 5,580
Real estate projects 48%-50% 4,629 50.00% 1,754
Other 5,676 4,069
Total 19,537 22,219
2016 2015
Sale of SG-trans – In August 2016, the Group sold a 50% stake in SG-trans, a rail freight operator in Russia, to a group of unaffiliated buyers for a total consideration of RUB 6 billion.
In connection with this disposal the Group recognized a gain of RUB 190 million. Investments in real estate projects – In December 2015, the Group established Sistema Capital Partners private equity platform, which invests on behalf of the Group and co-investors in European and domestic high street retail properties. In 2016, the Group invested additional RUB 2,875 million in retail assets in Germany.
The financial position and results of operations of significant associates and joint venture as of and for the years ended 31 December 2016 and 2015 were as follows:

SISTEMA PJSFC AND SUBSIDIARIES NOTES TO THE CONSOLIDATED FINANCIAL STATEMENTS (Amounts in millions of Russian Rubles, unless otherwise stated)
136
Real Real
MTS estates MTS estates
Belarus OZON projects Belarus OZON projects SG-trans
Non-current assets 9,414 3,922 12,162 11,404 2,553 839 28,401
Current assets 6,800 8,073 1,262 6,153 8,629 2,779 5,052
Total assets 16,214 11,995 13,424 17,557 11,182 3,618 33,453
Non-current liabilities - (629) (4,631) (2) (260) - (20,176)
Current liabilities (7,433) (5,413) (412) (6,520) (4,052) (109) (4,888)
Total liabilities (7,433) (6,042) (5,043) (6,522) (4,312) (109) #####
Net assets of investee 8,781 5,953 8,381 11,035 6,870 3,509 8,389
Group’s ownership
interest 49.00% 21.60% 48.00% 49.00% 21.60% 50.00% 50.00%
Fair value adjustment
on the date of obtaining
significant influence - 3,644 606 - 3,925 1,386
Carrying amount of the
Group’s interest 4,303 4,929 4,629 5,407 5,409 1,754 5,580
Total revenues 22,256 15,322 557 20,886 13,222 - 19,438
Total profit/(loss)
for the year 6,356 (1,190) 769 7,054 577 - 714
The Group’s share in -
profit/(loss) 3,114 (257) 369 3,456 125 - 357
Total comprehensive -
income/(loss) 4,064 (1,194) 769 3,944 577 - 714
The Group’s share in
comprehensive income/
(loss) for the year 1,991 (258) 369 1,933 125 - 357
2016 2015
The following is a summary of the aggregated financial information of other associates and joint ventures that are not individually material:
2016 2015
Group’s share of profit/(loss) from continuing operations (78) 439
Group’s share of total comprehensive income/(loss) (78) 439
Aggregate carrying amount of the Group's interests in these
associates and joint ventures 5,676 4,069

SISTEMA PJSFC AND SUBSIDIARIES NOTES TO THE CONSOLIDATED FINANCIAL STATEMENTS (Amounts in millions of Russian Rubles, unless otherwise stated)
137
20. LOANS RECEIVABLE AND OTHER FINANCIAL ASSETS The Group’s financial assets, other than cash and cash equivalents, deposits in banks and accounts receivable shown separately on the face of the statements of financial position, primarily comprise assets of MTS Bank, the Group’s subsidiary engaged in banking activities, and investments of the Corporate segment.
Financial assets are classified into the following specified categories depending on their nature and purpose:
Category Description Accounting policy
Financial assets at fair value through profit or loss (FVTPL)
Financial assets which are either held for trading or are
designated as at FVTPL.
Measured at fair value with changes recognised in profit or
loss. Held-to-maturity (HTM) investments
Non-derivative financial assets with fixed or determinable payments and fixed maturity dates that the Group has the positive intent and ability to hold to maturity.
Measured at amortised cost using the effective interest method less any impairment.
Loans and receivables Non-derivative financial assets
with fixed or determinable payments that are not quoted in an active market.
Measured at amortised cost using the effective interest method less any impairment.
Available-for-sale (AFS) financial assets
Non-derivatives that are either designated as AFS or are not classified within the above categories.
Measured at fair value with changes recognized in other comprehensive income. When the investment is disposed of or is determined to be impaired, the cumulative gain or loss is reclassified to profit or loss.
Financial assets, other than those at FVTPL, are assessed for indicators of impairment at the end of each reporting period. Financial assets are considered to be impaired when there is objective
evidence that, as a result of one or more events that occurred after the initial recognition of the financial asset, the estimated future cash flows of the investment have been affected. For certain categories of financial assets, such as loans and receivables, assets that are assessed not to be impaired individually are assessed for impairment on a collective basis. Objective evidence of impairment for a portfolio of loans and receivables could include the Group’s past experience of collecting payments, an increase in the number of delayed payments in the portfolio, as well as observable changes in national or local economic conditions that correlate with default
loans on receivables. The Group enters into a variety of derivative financial instruments to manage its exposure to interest rate and foreign exchange rate risks, including foreign exchange forward contracts, interest rate swaps and cross currency swaps. Further details of derivative financial instruments are disclosed in Note 32.

SISTEMA PJSFC AND SUBSIDIARIES NOTES TO THE CONSOLIDATED FINANCIAL STATEMENTS (Amounts in millions of Russian Rubles, unless otherwise stated)
138
At 31 December 2016 and 2015, financial assets, other than those shown separately on the face of the statements of financial position, less allowance for impairment losses, comprise:
2016 2015
Financial assets at FVTPL
Debt and equity securities 30,935 28,954
30,935 28,954
Loans and receivables at amortised cost
Bank loans to customers 62,900 78,846
Interbank loans due from banks 3,090 7,966
Other loans and receivables 18,431 37,249
84,421 124,061
AFS financial assets
Debt and equity securities 16,460 12,214
16,460 12,214
HTM financial assets
Debt and equity securities 17,163 -
17,163 -
Hedging instruments at fair value
Interest rate swaps designated as cash flow hedges 13,632 25,027
13,632 25,027
162,611 190,256
Current 62,588 78,020
Non-current 100,023 112,236
162,611 190,256
At 31 December 2016 and 2015, included in the above categories as well as cash and cash equivalents, financial assets attributable to the Group’s banking activities (MTS Bank and its subsidiaries) comprise:
2016 2015
Cash and cash equivalents 28,895 46,536
Bank loans to customers 99,556 125,522
Interbank loans due from banks 3,339 8,200
Financial assets at FVTPL 18,430 20,581
AFS financial assets 8,166 6,765
HTM financial assets 17,163 -
Other 713 2,261
Less: allowance for loan losses (36,905) (46,910)
139,357 162,955

SISTEMA PJSFC AND SUBSIDIARIES NOTES TO THE CONSOLIDATED FINANCIAL STATEMENTS (Amounts in millions of Russian Rubles, unless otherwise stated)
139
The movement in the allowance for loan losses during 2016 and 2015 was as follows:
2016 2015
Allowance for loan losses, beginning of the year 46,910 31,558
Additions charged to the results of operations 6,063 21,788
Write-off of loan loss provisions (14,883) (7,627)
Currency translation adjustment (1,185) 1,191
Allowance for loan losses, end of the year 36,905 46,910
The analysis of bank loans to customers by sector is presented below:
Analysis by sector
2016 2015
Individuals 44,157 59,570
Manufacturing 17,277 20,579
Real estate 9,809 12,294
Trade 9,454 7,411
Transport and communication 6,407 6,884
Food production 1,598 6,406
Finance lease 2,865 5,441
Finance sector 2,844 1,243
Culture and art 886 1,252
Other 4,259 4,442
Total bank loans to customers 99,556 125,522
Loans to individuals comprise the following:
2016 2015
Credit cards 17,451 20,664
Mortgage loans 14,671 20,829
Consumer loans 11,020 16,749
Other 1,015 1,328
44,157 59,570
Less allowance for loan losses (12,979) (21,459)
Total loans to individuals 31,178 38,111
21. RESTRICTED CASH According to the amendments to the law “On State Defense Orders”, cash received under state defense orders has to be held on special accounts and its spending is restricted to activities related to these orders. As of 31 December 2016, RTI has RUB 10,098 million of cash on special
accounts which was presented as restricted cash within current assets.
22. INVENTORIES Inventories mainly include goods for resale of Detsky mir and the retail network of MTS and costs in excess of billings of RTI.
Inventories are stated at the lower of cost or market value. Inventories are accounted for using
the weighted-average cost method. Inventory should be accounted further at the lower of net realisable value and carrying amount. The Group periodically assesses its inventories for obsolete or slow-moving stock.

SISTEMA PJSFC AND SUBSIDIARIES NOTES TO THE CONSOLIDATED FINANCIAL STATEMENTS (Amounts in millions of Russian Rubles, unless otherwise stated)
140
The cost of raw materials includes the cost of purchase, customs duties, transportation and handling costs. Work-in-progress and finished goods are stated at production cost which includes direct production expenses and manufacturing overheads. Costs and estimated earnings in excess of billings on uncompleted contracts include the accumulated costs of projects contracted with third parties, net of related progress billings. Inventories as of 31 December 2016 and 2015 consisted of the following:
2016 2015
Detsky mir finished goods and goods for resale 25,328 17,772
MTS finished goods and goods for resale 16,276 16,054
Work-in-progress 15,916 15,607
Other finished goods and goods for resale 9,929 5,505
Raw materials and spare parts 6,956 10,257
Costs and estimated earnings in excess of billings on
uncompleted contracts 8,285 11,427
Total 82,690 76,622
The cost of inventories recognised as an expense during the year in respect of continuing operations was RUB 125,690 million (2015: RUB 81,701 million). The cost of inventories recognised as an expense includes RUB 3,423 million (2015: RUB 2,222 million) in respect of write-downs of inventory to net realisable value, and has been reduced by RUB 611 million (2015: RUB 878 million) in respect of the reversal of such write-downs.
23. ACCOUNTS RECEIVABLE
Accounts receivable include amounts owed by the customers to the Group. Accounts receivable are stated at their net realizable value after deducting a provision for doubtful accounts. Such provision reflects either specific cases of delinquencies or defaults or
estimates based on evidence of collectability. Accounts receivable, net of provision for doubtful accounts, as of 31 December 2016 and 2015 consisted of the following:
2016 2015
Accounts receivable 69,579 84,273
Allowance for doubtful accounts (8,691) (9,997)
Total 60,888 74,276
Below is the age analysis of receivables that are past due but not impaired:
2016 2015
60-90 days 3,621 2,894
91-120 days 2,480 2,737
Total 6,101 5,631

SISTEMA PJSFC AND SUBSIDIARIES NOTES TO THE CONSOLIDATED FINANCIAL STATEMENTS (Amounts in millions of Russian Rubles, unless otherwise stated)
141
Movement in the allowance for doubtful accounts is as follows:
2016 2015
Balance at the beginning of the year (9,997) (9,510)
Allowance for doubtful accounts (3,303) (3,301)
Amounts written off during the year as uncollectible 3,421 4,137
Disposal of subsidiaries 343 -
Currency translation gains/(losses) 845 (1,323)
Balance at the end of the year (8,691) (9,997)
24. EQUITY Share capital – As of 31 December 2016 and 2015, the Company had 9,650,000,000 voting
common shares with a par value of RUB 0.09 issued, of which 9,397,374,298 and 9,484,639,435 shares were outstanding, respectively. Treasury shares – Movement of treasury shares during 2016 and 2015 years was as follows:
2016 2015
Balance at the beginning of the year 165,360,565 214,097,404
Purchase of own shares 98,250,000 27,800,000
Settlements under long-term motivation program (10,984,863) (76,536,839)
Balance at the end of the year 252,625,702 165,360,565
Dividends – Dividends declared to the holders of the Company’s ordinary shares are included in the financial statements in the period in which the dividends are approved for distribution by the shareholders. On 25 June 2016, an annual general meeting of shareholders approved the total dividend payment of RUB 6,470 million for 2015 year (including dividends on treasury shares of RUB
173 million), representing RUB 0.67 per ordinary share or RUB 13.4 per GDR. On 22 September 2016, an extraordinary general meeting of shareholders approved an interim dividend payment of RUB 3,667 million for the six months of 2016 year (including dividends on treasury shares of RUB 91 million), representing RUB 0.38 per ordinary share or RUB 7.6 per GDR.

SISTEMA PJSFC AND SUBSIDIARIES NOTES TO THE CONSOLIDATED FINANCIAL STATEMENTS (Amounts in millions of Russian Rubles, unless otherwise stated)
142
25. ACCUMULATED OTHER COMPREHENSIVE INCOME Components of accumulated other comprehensive income balance, net of taxes, as of 31 December 2016 and 2015:
2016 2015
Accumulated currency translation loss (21,745) (9,237)
Unrealised gain on financial instruments (153) 1,045
Unrecognised actuarial loss (34) (34)
Total accumulated other comprehensive loss (21,932) (8,226)
Less: amounts attributable to non-controlling interests 8,180 1,147
Total accumulated other comprehensive loss
attributable to Sistema PJSFC (13,752) (7,079)
26. BORROWINGS
The Group’s borrowings primarily comprise bank loans and corporate bonds. The Group enters into variable-to-fixed interest rate swap agreements to manage exposure to changes in variable
interest rates related to a portion of its obligations, as well as into cross-currency interest-rate swap agreements to mitigate the impact of both, interest rate and exchange rate fluctuations, for a certain portion of its USD- and Euro-denominated borrowings. Borrowings are initially recognised at fair value less transaction costs and subsequently
measured at amortised cost using the effective interest method.
Finance costs in profit or loss consist of interest expense for financial liabilities not classified as at FVTPL. In 2016, finance costs did not include borrowing costs that were included in the cost of qualifying assets in amount of RUB 388 million (2015: RUB 885 million). At 31 December 2016 and 2015, the Group’s borrowings comprised:
2016 2015
Bank loans 323,838 366,724
Corporate bonds 138,301 171,755
Finance lease obligations 14,361 16,085
Other 1,626 2,196
478,126 556,760
Current 83,109 142,657
Non-current 395,017 414,103

SISTEMA PJSFC AND SUBSIDIARIES NOTES TO THE CONSOLIDATED FINANCIAL STATEMENTS (Amounts in millions of Russian Rubles, unless otherwise stated)
143
Bank loans – As of 31 December 2016 and 2015, the Group’s loans from banks and financial institutions consisted of the following:
Interest rate
(actual at 31 December 31 December 31 December
2016) 2016 2015
USD-denominated:Calyon, ING Bank N.V,
Nordea Bank AB,
Raiffeisen Zentralbank
2017-2020 LIBOR
6m+1.15%
25,394 39,449
China Development Bank 2017-2021 LIBOR
6m+3.15%;
1.92%
9,099 21,026
Citibank 2017-2024 LIBOR 6m+0.9% 12,812 17,511 Bank of China 2016 1.91% - 3.83% - 10,391 VTB 2016-2018 LIBOR 3m+7.5% - 4,032
Skandinavska Enskilda
Banken AB
2017 LIBOR
6m+0.225% -
1.8%
1,163 3,938
Other 3,323 275
51,791 96,622
EUR-denominated: Credit Agricole
Corporate Bank and BNP 2017-2018
EURIBOR
6m+1.65%876 1,639
VTB 2016-2017EURIBOR
6m+6.2%
- 1,076
ING Bank 2017-2021 4.30% 9,190
Other 823 1,466
10,889 4,181
RUB-denominated:Sberbank 2017-2023 8.45%-17.75% 180,161 203,363 VTB 2017-2026 10.20%-19.70%;
CBR+2.02%-
4.80% (12.02%-
14.80%)
37,943 24,753
Gazprombank 2017-2022 10.9% - 12.0% 4,819 11,187 Expobank 2017-2019 14.00%-14.50% 3,000 3,500 Alfa Bank 2017-2023 10.50%-13.45% 10,210 4,970 Other 20,451 12,779
256,584 260,552
Other currencies 4,574 5,369
Total bank loans 323,838 366,724
Maturity

SISTEMA PJSFC AND SUBSIDIARIES NOTES TO THE CONSOLIDATED FINANCIAL STATEMENTS (Amounts in millions of Russian Rubles, unless otherwise stated)
144
Notes – As of 31 December 2016 and 2015, the Group’s notes consisted of the following:
The Group has an unconditional obligation to repurchase certain notes at par value if claimed by
the noteholders subsequent to the announcement of the sequential coupon. Such notes are disclosed maturing in the reporting period when the demand for repurchase could be submitted, irrespective of the Group’s expectations about the intentions of the noteholders. The dates of the announcement for each particular note issue are as follows:
MTS Notes due 2020 MTS Notes due 2023 MTS Notes due 2031
November 2017 March 2018 August 2018
Sistema PJSFC Bonds due September 2025 October 2018 Sistema PJSFC Bonds due October 2025 November 2019 Sistema PJSFC Bonds due 2027 February 2020 Sistema PJSFC Bonds due 2026 November 2020
Covenants – Loans and notes payable by the Group are subject to various restrictive covenants, including, but not limited to compliance with certain financial ratios, limitations on dispositions of
assets and transactions within the Group and retention of principal telecom licenses. As of 31 December 2016 and 2015, the Group had RUB 2,404 million and RUB 10,222 million, respectively of RUB-denominated long-term debt which was presented within current liabilities in the
consolidated statements of financial position because of non-compliance with certain financial ratios by the Group’s subsidiaries. Assets pledged as security – As of 31 December 2016 and 2015 land and buildings with carrying amounts of RUB 34,746 million and RUB 26,962 million, respectively, have been pledged to secure borrowings of the Group. The freehold land and buildings have been pledged as security for bank loans under a mortgage. The Group is not allowed to pledge these assets as security for
other borrowings or to sell them to another entity. As of 31 December 2016 and 2015, other assets including inventories and deposits with carrying amounts of RUB 4,200 million, RUB 2,635 million respectively have been pledged to secure borrowings of the Group. 87% shares of RTI have been pledged to secure borrowings of the Group. In addition, the Group’s obligations under finance leases as of 31 December 2016 and 2015 are secured by the lessors’ title to the leased assets, which have a carrying amount of RUB 10,785 million and RUB 9,037 million, respectively.
31 December 31 December
Currency Interest rate 2016 2015
MTS International Notes due
2023 USD 5.00% 28,217 33,908
MTS International Notes due
2020 USD 8.63% 18,537 42,238
Sistema International Notes due
2019 USD 6.95% 25,067 32,027
Sistema PJSFC Bonds due RUB 8.75% - 13,896
Sistema PJSFC Bonds due RUB 12.70% 10,000 10,000
Sistema PJSFC Bonds due RUB 17.00% - 8,206
Sistema PJSFC Bonds due RUB 9.90% 9,949 -
Sistema PJSFC Bonds due RUB 9.80% 6,200 -
Sistema PJSFC Bonds due
September 2025 RUB 12.50% 5,000 5,000
MTS Notes due 2031 RUB 9.40% 9,986 -
MTS Notes due 2023 RUB 8.25% 9,984 9,971
MTS Notes due 2017 RUB 8.70% 9,995 9,637
MTS Notes due 2020 RUB 9.25% 1,448 2,110
MTS Notes due 2016 RUB 8.75% - 1,788
Sistema PJSFC Bonds due
October 2025 RUB 10.90% 1,700 1,700
Other 2,218 1,274
Total notes 138,301 171,755

SISTEMA PJSFC AND SUBSIDIARIES NOTES TO THE CONSOLIDATED FINANCIAL STATEMENTS (Amounts in millions of Russian Rubles, unless otherwise stated)
145
27. BANK DEPOSITS AND LIABILITIES Liabilities of MTS Bank primarily consist of customer accounts and deposits. These liabilities are initially measured at fair value, net of transaction costs. Liabilities are subsequently measured at amortised cost using the effective interest method and classified based on their contractual maturity.
Bank deposits and liabilities as of 31 December 2016 and 2015 consisted of the following:
2016 2015
Customer accounts 100,974 109,719
Subordinated debt and bonds - 7,600
Debt securities issued 2,030 2,587
Other liabilities 3,316 2,898
106,320 122,804
Less: amounts maturing within one year (99,888) (115,529)
Total bank deposits and liabilities, net of the current
portion 6,432 7,275
28. OTHER FINANCIAL LIABILITIES
Other financial liabilities as of 31 December 2016 and 2015 consisted of the following:
2016 2015
SSTL payable for 800 MHz spectrum (Note 18) 19,126 25,693
Liabilities to Rosnano for Mikron's shares (Note 29) 3,300 -
Payable for RTI shares (Note 9) 2,975 -
Credit guarantee agreement related to foreign currency hedge 2,907 6,853
Interest rate and cross-currency swaps not designated
as hedging instruments 1,734 1,855
MTS liabilities related to hedging activities 531 676
Other 683 -
Current 7,919 6,853
Non-current 23,337 28,224
Total other financial liabilities 31,256 35,077

SISTEMA PJSFC AND SUBSIDIARIES NOTES TO THE CONSOLIDATED FINANCIAL STATEMENTS (Amounts in millions of Russian Rubles, unless otherwise stated)
146
29. LIABILITIES UNDER PUT OPTION AGREEMENTS From time to time, to optimise the structure of business acquisitions and to defer payment of the purchase price or to attract a co-investor into the business, the Group enters into put option agreements to acquire the non-controlling interests in its subsidiaries. If put options issued by the Group over the equity of subsidiary companies are settled by exchange of an amount of cash or another financial asset dependent on valuation of a fixed number of shares in the subsidiary, the potential cash payments are recognised as financial
liabilities at fair value, and are reclassified from equity. Such liabilities are subsequently measured at fair value; the remeasurement is recorded in profit or loss. In the event that the option expires unexercised, the liability is derecognised with a corresponding adjustment to equity. As of 31 December 2016 and 2015, liabilities recorded by the Group in relation to such put
options comprised:
31 December 31 December
2016 2015
MTS Armenia 20.00% December 2018 2,243 2,925
SSTL 17.14% - 54,808
Mikron 20.42% - 7,050
Other - 901
Total 2,243 65,684
Current - 65,684
Non-current 2,243 -
SubsidiaryUnderlying
interest
Earliest
demand date
SSTL – As of 31 December 2015 the Russian Government, represented by the Federal Agency for State Property Management ("Rosimushchestvo"), had a put option to sell 17.14% stake in SSTL to Sistema for the higher of USD 777 million or market value as of 26 March 2016 determined by an independent valuator. In June 2016, the Group has signed an agreement with the Russian Government, represented by Rosimushchestvo, whereby the Group acquired 17.14%
of the shares of SSTL for USD 777 million (RUB 47,130 million as of 31 December 2016). The liability is due to be repaid in instalments in 2016-2020. Ownership rights for the shares will be transferred to the Group in proportion to the repaid liability balance subject to certain conditions. As of 31 December 2016 the beneficial ownership of SSTL has not changed and the Group repaid part of the liability amounting to RUB 15,718 million in 2016. The Group presented the current / non-current portions of the liability in separate lines in the consolidated statement of financial position as of 31 December 2016. Mikron – In October 2016, the Group has signed an agreement with RUSNANO on restructuring
an option agreement with respect to 20.42% of shares of Mikron for RUB 8,100 million. The liability will be repaid in instalments in 2016-2017. Ownership rights for the shares will be transferred to the Group in 2017. The Group presented the outstanding liability of RUB 3,300 million in other financial liabilities in the consolidated statement of financial position as of 31 December 2016.

SISTEMA PJSFC AND SUBSIDIARIES NOTES TO THE CONSOLIDATED FINANCIAL STATEMENTS (Amounts in millions of Russian Rubles, unless otherwise stated)
147
30. PROVISIONS Provisions primarily consist of provisions related to employees’ bonuses and other rewards, decommissioning and restoration obligations. The provision for employee benefits represents annual compensation and share-based compensation. Provisions are recognised when the Group has a present obligation (legal or constructive) as a result of past event, it is probable that the Group will be required to settle that obligation and a reliable estimate can be made of the amount of obligation. Provisions are measured at the
management’s best estimate of the expenditure required to settle the obligation at the reporting date and are discounted to present value where the effect is material. Provisions as of 31 December 2016 and 2015 consisted of the following:
2016 2015
Employees’ bonuses and other rewards 10,348 9,920
Provisions for decomissioning 1,192 1,459
Tax provisions other than for income tax 457 525
Other 2,166 2,437
Total 14,163 14,341
Current 10,752 10,151
Non-current 3,411 4,190
Employees’
bonuses and
other
rewards
Provisions
for decomis-
sioning
Tax
provisions
other than
income tax Other Total
Balance at 1 January (7,459) (1,640) (2,974) (2,122) (14,195)
Additional provisions
recognized (11,707) (107) (481) (756) (13,051)
Acquisitions (456) - (15) (186) (657)
Payments 8,810 - 24 622 9,456
Unwinding of discount and
effect of changes in the
discount rate 87 256 - (1) 342
Unused amounts reversed 846 25 2,951 6 3,828
Currency translation
adjustment (41) 7 (30) - (64)
Balance at
31 December 2015 (9,920) (1,459) (525) (2,437) (14,341)
Additional provisions
recognized (16,169) (1) (1,055) (1,330) (18,555)
Payments 14,408 - 374 764 15,546
Unwinding of discount and -
effect of changes in the -
discount rate (12) (142) - - (154)
Unused amounts reversed 1,102 393 739 462 2,696
Disposed 91 - - 375 466
Currency translation
adjustment 152 17 10 - 179
Balance at
31 December 2016 (10,348) (1,192) (457) (2,166) (14,163)

SISTEMA PJSFC AND SUBSIDIARIES NOTES TO THE CONSOLIDATED FINANCIAL STATEMENTS (Amounts in millions of Russian Rubles, unless otherwise stated)
148
31. EARNINGS/(LOSSES) PER SHARE Earnings per share is the amount of profit for the year attributable to ordinary shares of the Company divided by the weighted average number of ordinary shares outstanding during the year. The earnings and weighted average number of ordinary shares used in the calculation of basic
and diluted earnings per share are as follows:
2016 2015
Profit/(loss) for the year from discontinued operations
attributable to shareholders of Sistema PJSFC (6,433) 48,697
Loss for the year from continuing operations
attributable to shareholders of Sistema (5,325) (19,897)
(Losses)/earnings used in the calculation of basic and
diluted earnings per share (11,758) 28,800
Weighted average number of ordinary shares for the purposes
of basic and diluted earnings per share 9,439,069,910 9,420,045,036
(Losses)/earningsper share – basic and diluted (1.25) 3.06
From continuing operations (0.56) (2.11)
From discontinued operations (0.68) 5.17 The following potential ordinary shares and the impact of the related expense are together anti-dilutive and are therefore excluded from the weighted average number of ordinary shares for the
purpose of calculation of diluted earnings per share.
2016 2015
Share options granted under the Company’s employee share
option plan 102,204,780 129,112,727
32. CAPITAL AND FINANCIAL RISK MANAGEMENT Capital risk management – The Group manages its capital to ensure that entities of the Group
will be able to continue as a going concern while maximising the return to the shareholders through the optimisation of the debt and equity balance.
The capital structure of the Group consists of net borrowings (borrowings offset by cash and cash equivalents) and equity of the Group. The Group’s policy is to maintain a strong capital base so as to maintain investor, creditor and
market confidence and to sustain future development of the business. The Group manages its capital structure and makes adjustments to it, in light of changes in economic conditions. The Group may sell assets to reduce debt, maintain or adjust the capital structure. The Board of Directors monitors the net borrowings to OIBDA ratio. Since these are not IFRS measures, the Group’s definition of OIBDA and net borrowings may differ from that of other companies. The Group’s net borrowings to OIBDA ratio was as follows:
2016 2015
Net borrowings 417,936 433,985
OIBDA 176,554 157,058
Net borrowings to OIBDA ratio 2.36 2.65

SISTEMA PJSFC AND SUBSIDIARIES NOTES TO THE CONSOLIDATED FINANCIAL STATEMENTS (Amounts in millions of Russian Rubles, unless otherwise stated)
149
The Group is subject to certain externally imposed capital requirements and restrictions that are incorporated into the management of capital: MTS Bank – The CBR requires that banks comply with the minimum capital adequacy ratio of 8% calculated on the basis of statutory standalone financial statements. MTS Bank met the requirements established by the CBR. As of 31 December 2016 and 2015, MTS Bank’s capital adequacy ratio was 21.3% and 18.3%, respectively.
Limitations on cash distribution – There were certain limitations on cash distribution in Ukraine (Note 38) and India as of 31 December 2016. Cash balances in Ukraine and India were as follows:
2016 2015
Ukraine 3,142 6,612
India 1,145 3,064
Financial risk management objectives – The Board of Directors has overall responsibility for the establishment and ongoing management of the Group’s risk management framework and the implementation and operation of the Board’s policies are handled by the Management Board.
The Management Board monitors and manages the financial risks relating to the operations of the Group through internal risk reports which analyse exposures by degree and magnitude of risks. These risks include market risk (including foreign currency risk, interest rate risk and other price risk), liquidity risk and credit risk.
Foreign currency risk – Foreign currency risk is the risk that the financial results of the Group will be adversely impacted by changes in exchange rates to which the Group is exposed. The
Group undertakes certain transactions denominated in foreign currencies and is primarily exposed to the US Dollar and Euro. The Group manages its net exposure to foreign exchange risk by balancing both financial assets and financial liabilities denominated in Russian Ruble, US Dollar and Euro and by conducting
certain hedging activities (Note 33). The carrying amounts of the Group’s foreign currency denominated monetary assets and monetary liabilities (excluding hedged items) at the year end are as follows.
2016 2015 2016 2015
US Dollar 198,930 266,186 77,349 161,805
Euro 24,529 21,848 35,542 56,542
AssetsLiabilities
The table below details the Group’s sensitivity to the strengthening of the US Dollar and Euro against the Russian Ruble by 20%. This analysis assumes that all other variables, in particular interest rates, remain constant. This analysis is based on foreign currency exchange rate variances that the Group considered to be reasonably possible at the end of the reporting period. The analysis was applied to monetary items at the year end denominated in the respective currencies.
31 December
2016
31 December
2015
Profit or loss before tax 17,035 6,048
The effect of a corresponding strengthening of the Russian Ruble against the US Dollar and EUR is equal and opposite.

SISTEMA PJSFC AND SUBSIDIARIES NOTES TO THE CONSOLIDATED FINANCIAL STATEMENTS (Amounts in millions of Russian Rubles, unless otherwise stated)
150
Interest rate risk – Interest rate risk arises from the possibility that changes in interest rates will affect finance costs. The Group is exposed to interest rate risk because entities in the Group borrow funds at both fixed and floating interest rates. The risk is managed by the Group by maintaining an appropriate mix between fixed and floating rate borrowings and by conducting certain hedging activities (Note 33). The table below details the Group’s annualised sensitivity to a change of floating LIBOR rate by
1% which would impact its operations. The analysis was applied to borrowings (excluding hedged items) based on the assumption that amount of the liability outstanding at the date of statements of financial position was outstanding for the whole period. 2016 2015
Profit or loss before tax 231 572
Fixed rate loan agreements often stipulate creditor’s right to increase interest rates under certain circumstances, including increase of the key rate of the Central Bank of Russia. Therefore, in addition to the effect from changes in floating interest rates, the Group is also exposed to interest rate risk arising from these agreements.
Other price risks – Price risk is the risk that the value of a financial instrument will fluctuate as a result of changes in market prices. These changes may be caused by factors specific to the individual security or its issuer or factors affecting all securities traded in the market. The sensitivity analysis below has been determined based on the exposure to price risks at the end of the reporting period. Sensitivity analysis was prepared on pre-tax basis. If prices of securities as of the year end had been 10% higher/lower:
31 December 31 December
2016 2015
Profit before tax increase/decrease 3,094 2,895
OCI increase/decrease 817 1,057 Liquidity risk – Liquidity risk is the risk that the Group will not be able to settle all its liabilities as they fall due. The Group’s liquidity position is monitored and managed at the level of operating segments. The Group manages liquidity risk by continuously monitoring forecasted and actual cash flows, by
matching the maturity profiles of financial assets and liabilities and by maintaining available credit facilities. At 31 December 2016, the schedule of repayments of undiscounted financial liabilities of the
Group for the next five years and thereafter was as follows:
<1 year 1-2 years 2-3 years 3-4 years 4-5 years 5+ years
Borrowings 83,109 107,592 118,419 70,690 31,334 66,982
Liabilities under put
option agreements - 2 ,243 - - - -
A ccounts payable 110,879 - - - - -
Bank depos its and
liabilities 99,888 4 ,297 712 288 25 1 ,110
Liability to Ros imushchestvo 11,783 7 ,070 7 ,070 7 ,142 - -
O ther financ ial liabilities 7,919 6 ,093 1 ,612 2 ,267 1 ,943 11,422
Total f inancial liabilities 313,578 127,295 127,813 80,387 33,302 79,514

SISTEMA PJSFC AND SUBSIDIARIES NOTES TO THE CONSOLIDATED FINANCIAL STATEMENTS (Amounts in millions of Russian Rubles, unless otherwise stated)
151
At 31 December 2016, the schedule of repayments of undiscounted financial liabilities of the Corporate segment for the next five years and thereafter was as follows:
<1 year 1-2 years 2-3 years 3-4 years 4-5 years 5+ years
Borrowings 2,548 29,340 40,012 19,438 5,687 -
Accounts payable 7,824 - - - - -
Liability to Rosimushchestvo 11,783 7,070 7,070 7,142 - -
Other financial liabilities 3,170 2,975 - - - 515
Total financial liabilities 25,325 39,385 47,082 26,580 5,687 515
For day to day liquidity requirements the Group had unused credit facilities of RUB 186,542
million as of 31 December 2016, including RUB 87,131 million related to Corporate segment. Credit risk – Credit risk refers to the risk that a counterparty will default on its contractual obligations resulting in a financial loss to the Group. The Group is exposed to credit risks on cash
and cash equivalents, deposits, derivatives and certain other financial instruments with financial institutions, loans and receivables carried at amortised cost and debt securities. Financial assets with financial institutions – The Group maintains mixture of cash and cash equivalents, deposits, derivatives and certain other financial instruments with financial institutions. These financial institutions are located in different geographical regions and the Group’s policy is designed to limit exposure to any one institution. As part of its risk management processes, the
Group performs periodic evaluations of the relative credit standing of the financial institutions. Bank loans to customers and interbank loans due from banks – MTS Bank performs daily monitoring of future expected cash flows on clients’ and banking operations, which is a part of
assets/liabilities management process. The credit risk exposure is monitored on a regular basis to ensure that the credit limits and credit worthiness guidelines established by the MTS Bank’s risk
management policy are not breached. The Group structures the levels of credit risk it undertakes by placing limits on the amount of risk accepted in relation to one borrower, or group of borrowers, and to geographical segments. Other loans and receivables carried at amortised cost – Concentrations of credit risk with respect to loans and trade receivables are limited given that the Group’s customer base is large and unrelated. Management believes there is no further credit risk provision required in excess of the
normal provision for bad and doubtful receivables.
33. HEDGING ACTIVITIES The Group uses derivative instruments, including interest rate and foreign currency swaps, to
manage foreign currency and interest rate risk exposures. The Group measures derivatives at
fair value and recognizes them either other current or other non-current financial assets or liabilities in the consolidated statement of financial position. Cash flows from derivatives are classified according to their nature. The Group reviews related fair value hierarchy classifications on a quarterly basis. The fair value measurement of the Group’s derivative instruments is based on the observable yield curves for similar instruments. The Group designates derivatives as either fair value hedges or cash flow hedges in case the
required criteria are met. Fair value hedges – Changes in the fair value of derivatives that are designated and qualify as fair value hedges are recognized in profit or loss immediately together with any changes in the fair value of the hedged asset or liability that is attributed to the hedged risk. Cash flow hedges – The effective portion of changes in the fair value of derivatives that are
designated and qualify as cash flow hedges are recognized in other comprehensive income. The gain or loss relating to the ineffective portion is recognized immediately in profit or loss.
Gains or losses accumulated in other comprehensive income are immediately reclassified into consolidated statement of profit and loss when related hedged transactions affect earnings.

SISTEMA PJSFC AND SUBSIDIARIES NOTES TO THE CONSOLIDATED FINANCIAL STATEMENTS (Amounts in millions of Russian Rubles, unless otherwise stated)
152
For derivatives that do not meet the conditions for hedge accounting, gains and losses from changes in the fair value are recorded immediately in profit or loss. Assets and liabilities related to multiple derivative contracts with one counterparty are not offset by the Group. Cross-currency interest rate swap agreements – The Group has entered into several cross-
currency swap agreements. The contracts are designated to manage the exposure to changes in currency exchange rate. The contracts assumed periodic exchange of principal and interest payments from RUB-denominated amounts to USD- and Euro- denominated amounts at a specified rate. The rate was determined by the market spot rate upon issuance. Cross-currency interest rate swap contracts mature in 2019-2020.
In aggregate the Group entered into cross-currency interest rate swap agreements designated to manage the exposure to changes in currency exchange rate for 19% of the Group’s bank loans denominated in USD and EUR outstanding as of 31 December 2016 (2015: 19%). The notional amounts related to currency derivative instruments amounted to RUB 25,885 million, RUB 40,049 million as of 31 December 2016 and 2015, respectively.
Variable-to-fixed interest rate swap agreements – The Group’s bank loans denominated in USD and EUR bear primarily floating interest rates. To eliminate the exposure to changes in variable interest rates related to its debt obligations, the Group enters into variable-to-fixed interest rate swap agreements, so that interest rate swap matches the exact maturity dates of the underlying debt allowing for highly-effective cash flow hedges. In aggregate, the Group entered into variable-to-fixed interest rate swap agreements designated to manage the exposure of changes in variable interest rates related to 21% of the Group’s bank loans with variable rates
outstanding as of 31 December 2016 (2015: 26%).
Fixed-to-variable interest rate swap agreements – The Group’s notes and bank loans denominated in Russian Rubles bear primarily fixed interest rates. To eliminate the exposure to changes in fair value of debt obligations, the Group enters into fixed-to-variable interest rate swap agreements. In aggregate the Group entered into fixed-to-variable interest rate swap agreements
designated to manage the exposure to changes in value of the debt related to 7% of the Group’s notes and bank loans with fixed rates outstanding as of 31 December 2016 (2015: 7%). The notional amounts related to interest rate derivative instruments amounted to RUB 49,451 million, RUB 67,338 million as of 31 December 2016 and 2015, respectively.

SISTEMA PJSFC AND SUBSIDIARIES NOTES TO THE CONSOLIDATED FINANCIAL STATEMENTS (Amounts in millions of Russian Rubles, unless otherwise stated)
153
34. FAIR VALUES The following fair value hierarchy table presents information regarding Group’s financial assets and liabilities measured at fair value on a recurring basis at 31 December 2016 and 2015. Fair value measurements are categorised into Level 1, 2 or 3 based on the degree to which the inputs to the fair value measurements are observable and the significance of the inputs to the fair value measurement in its entirety. Level 1 classification comprises financial instruments where fair value is determined by unadjusted quoted prices in active markets for identical assets or liabilities that the Group can access at the measurement date; Level 2 – from inputs, other than quoted prices included within Level 1, that are observable for the asset or liability,
either directly or indirectly; Level 3 – from unobservable inputs.
Level 1 Level 2 Level 3 Total Level 1 Level 2 Level 3 Total
Financial assets
Financial assets at FVTPL 30,935 - - 30,935 28,954 - - 28,954
AFS securities 8,166 - 8,294 16,460 10,571 - 1,643 12,214
Hedging instruments at fair value - 13,632 - 13,632 - 25,027 - 25,027
39,101 13,632 8,294 61,027 39,525 25,027 1,643 66,195
Financial liabilities
Derivative instruments - (2,407) - (2,407) - (2,531) - (2,531)
Contingent considerations - - (3) (3) - - (115) (115)
Liabilities under put option agreements- - (2,243) (2,243) - - (2,925) (2,925)
- (2,407) (2,246) (4,653) - (2,531) (3,040) (5,571)
31 December 2016 31 December 2015
The fair value of financial assets and liabilities categorised into Level 3 is primarily measured using the discounted cash flows technique. The unobservable inputs to the models include assumptions regarding the future financial performance of the investee, its risk profile, and economic assumptions regarding the industry and jurisdiction in which the investee operates.

SISTEMA PJSFC AND SUBSIDIARIES NOTES TO THE CONSOLIDATED FINANCIAL STATEMENTS (Amounts in millions of Russian Rubles, unless otherwise stated)
154
There were no changes made during the year to valuation methods or the processes to determine classification and no transfers were made between the levels in the fair value hierarchy. The carrying value of the Group’s financial instruments accounted for at amortised cost approximates their fair value due to their short-term nature and market interest rates, except for borrowings and bank deposits and liabilities as disclosed in the table below:
Carrying Fair value Carrying Fair value
Financial assets
HTM financial assets 17,163 11,955 - -
Financial liabilities
Borrowings 478,126 483,858 556,760 546,492
Bank deposits and liabilities 106,320 106,276 122,804 121,945
31 December 2016 31 December 2015
The table below presents information regarding reconciliation of Level 3 fair value measurements
as of 31 December 2016 and 2015.
Liabilities under
put option
agreements
Other financial
assets
Other financial
liabilities Total
Balance at 1 January 2015 (3,192) 193 (99) (3,098)
Total gains/(losses):
- in profit or loss 1,014 - - 1,014
- in other comprehensive income (747) - (747)
Purchases 1,450 1,450
Disposals/settlements - - (16) (16)
Balance at 31 December 2015 (2,925) 1,643 (115) (1,397)
Total gains/(losses):
- in profit or loss 199 - - 199
- in other comprehensive income 483 - - 483
Purchases - 6,651 112 6,763
Balance at 31 December 2016 (2,243) 8,294 (3) (6,048)
During 2016, no unrealised gain relating to financial assets that are measured at fair value at the end of each reporting period has been recognised (2015: a gain of RUB 922 million). Such fair value gains or losses are included in other income.
35. RELATED PARTY TRANSACTIONS
The Group has a number of related parties including its controlling shareholder and entities under common control, associates and joint ventures, and key management personnel.
Trading transactions – The Group’s trading transactions with related parties that are not members of the Group comprise sales and purchases of goods and services in the normal course of business. During the year ended 31 December 2016, sales to related parties comprised RUB 638 million (2015: RUB 1,770 million), purchases from related parties comprised RUB 2,741 million (2015: 737 million). As of 31 December 2016, trade balances receivable from and payable to related parties comprised RUB 3,627 million and RUB 1,199 million, respectively (31 December 2015: RUB 2,253 million and RUB 1,233 million).

SISTEMA PJSFC AND SUBSIDIARIES NOTES TO THE CONSOLIDATED FINANCIAL STATEMENTS (Amounts in millions of Russian Rubles, unless otherwise stated)
155
Financial transactions – The Group’s financial transactions with related parties primarily comprise loans, deposits and other debt instruments issued to or by the Group entities. At 31 December 2016 and 2015, amounts owed by or to related parties under such arrangements are as follows:
31 December 31 December 31 December 31 December
2016 2015 2016 2015
Controlling shareholder
entities under common
control 2,936 5,561 37,034 42,331
Key management - - 2,868 2,988
Other related parties 1,838 1,244 1,169 1,572
Amounts owed by related
parties
Amounts owed to related
parties
Finance costs related to such transactions with related parties and recognized in the consolidated statement of profit or loss in 2016 amounted to RUB 3,199 million (2015: 3,048 million). Investing transactions – In 2016, the Group incurred capital expenditures of RUB 747 million
from an entity under common control. Compensation of key management personnel – In 2016 and 2015, the aggregate
compensation for key management personnel, being the members of the Company’s Board of Directors and Management Board, was as follows:
2016 2015
Short-term benefits 3,643 3,364
Share-based payments 1,100 1,251
Total 4,743 4,615
36. SUBSIDIARIES Details of the Group’s most material direct subsidiaries at the end of the year are as follows:
Significant entities Short name Principal activity 2016 2015
Mobile TeleSystems PJSC (Note 9) MTS Telecommunications 50.03% 53.47%
Sistema Shyam TeleServices Limited SSTL Telecommunications 56.68% 56.68%
MTS Bank PJSC MTS Bank Banking 86.66% 87.11%
RTI OJSC (Note 9) RTI Technology 87.00% 84.68%
Detsky mir PJSC Detsky mir Retail trading 72.63% 75.82%
Medsi JSC Medsi Healthcare services 100% 100%
Targin JSC (Note 8) Targin Oilfield services disposed 100%
Bashkirian Power Grid Company JSC BPGC Energy transmission 90.96%(1) 90.96%(1)
Segezha Group LLC Segezha Group Pulp and paper 100% 100%
Leader-Invest JSC Leader-Invest Real estate 100% 100%
Agroholding Steppe JSC (Note 9) Steppe Agriculture 88.13% 100%
Beneficial ownership
as of 31 December
(1) Voting interests as of 31 December 2016 and 2015 – 93%.

SISTEMA PJSFC AND SUBSIDIARIES NOTES TO THE CONSOLIDATED FINANCIAL STATEMENTS (Amounts in millions of Russian Rubles, unless otherwise stated)
156
The table below shows details of non-wholly owned subsidiaries of the Group that have material non-controlling interests:
Name of Principal place of
subsidiary business 2016 2015 2016 2015
MTS Russ ia 23,097 23,029 67,301 72,293
SSTL India (1,791) (2,758) (28,953) (29,076)
Profit / (loss) allocated to
non-controlling interests interests
Accumulated non-controlling
Summarised financial information in respect of each of the Group’s subsidiaries that has material non-controlling interests is set out below. The summarised financial information below represents amounts before intragroup eliminations.
MTS SSTL MTS SSTL
Current assets 90,188 4,425 159,017 7,586
Non-current assets 453,413 20,303 494,361 26,389
Total assets 543,601 24,728 653,378 33,975
Current liabilities 126,584 14,673 157,910 34,395
Non-current liabilities 274,034 29,830 327,097 41,297
Total liabilities 400,618 44,503 485,007 75,692
Equity attributable to
shareholders of Sistema 70,968 (9,178) 87,822 (12,641)
Non-controlling interests 72,014 (28,953) 80,549 (29,076)
Revenue 435,692 12,466 431,232 13,965
Expenses (387,242) (19,268) (383,828) (24,445)
Profit/ (loss) for the year 48,450 (6,802) 47,404 (10,480)
Profit/(loss) attributable to
shareholders of Sistema 25,353 (5,012) 26,460 (7,722)
Profit/(loss) attributable to
the non-controlling interests 23,097 (1,791) 20,944 (2,758)
Other comprehensive
income/(loss) attributable to
shareholders of Sistema (8,861) 5,356 (1,231) (7,588)
Other comprehensive
income/(loss) attributable to
the non-controlling interests (8,946) 1,913 (441) (2,710)
Other comprehensive
(loss)/income for the year (17,807) 7,269 (1,672) (10,298)
Total comprehensive
income/(loss) attributable to
shareholders of Sistema 16,492 344 25,229 (15,309)
Total comprehensive
income/(loss) attributable to
the non-controlling interests 14,151 123 20,503 (5,469)
Total comprehensive
income/(loss) for the year 30,643 467 45,732 (20,778)
Dividends paid to
non-controlling interests 25,415 - 23,241
Net cash inflow (outflow) - -
from operating activities 130,565 (8,947) 144,088 (2,395)
Net cash outflow from
investing activities (57,302) (137) (145,356) (53)
Net cash (outflow)/inflow
from financing activities (83,038) 7,165 (27,595) 4,154
Net cash (outflow)/inflow (9,775) (1,919) (28,863) 1,706
2016 2015

SISTEMA PJSFC AND SUBSIDIARIES NOTES TO THE CONSOLIDATED FINANCIAL STATEMENTS (Amounts in millions of Russian Rubles, unless otherwise stated)
157
As disclosed in Note 29, the Group wrote the put option over its 17.14% share in SSTL which was exercised in 2016. As a result, 74% of SSTL loss is allocated to owners of the Company. The Company also purchased redeemable preference shares of SSTL. These factors resulted in the difference between accumulated non-controlling interests of SSTL and SSTL net assets multiplied by beneficial ownership.
37. NON-CASH TRANSACTIONS The Group entered into the following non-cash investing and financing activities which are not reflected in the consolidated statements of cash flows:
2016 2015
Financial instruments received under the settlement agreement with
Ural-Invest (Note 8) - 37,964
Equipment and licenses acquired under capital leases 505 513
Amounts owed for capital expenditures 15,285 28,538
Payables related to business acquisitions 501 1,296
Payables related to purchases of non-controlling interests
in subsidiaries 6,186 3,057
38. CONTINGENCIES AND COMMITMENTS In addition to contingencies described in Note 6, the Group has the following contingencies and commitments.
Capital commitments – A capital commitment is a contractual obligation to make payment in the future, mainly in relation to buy assets such as network infrastructure. These amounts are not
recorded in the consolidated statement of financial position since the Group has not yet received goods or services from suppliers. At 31 December 2016, the Group had capital commitments of RUB 31,815 million (31 December 2015: RUB 31,594 million) relating to the acquisitions of property, plant and equipment. Operating lease commitments – The Group enters into various agreements to lease space for telecommunications equipment, transmission channels, mobile towers, retail outlets and offices.
The leases have various terms and renewal rights, none of which is individually significant to the Group. Future minimum lease payments under non-cancellable operating leases comprise: Payments due in
2017 19,865
2018 12,211
2019 12,671
2020 13,087
2021 16,126
Thereafter 16,748
Total 90,708
Commitments on loans and unused credit facilities – As of 31 December 2016, MTS Bank had RUB 6,891 million of commitments on loans and unused credit facilities available to its
customers (31 December 2015: RUB 5,064 million). Guarantees – At 31 December 2016, MTS Bank guaranteed loans for several companies which totalled RUB 3,921 million (31 December 2015: RUB 5,423 million), including related parties of
RUB 234 million (31 December 2015: RUB 589 million). These guarantees would require payment by the Group in the event of default on payment by the respective debtor. Such guarantee contracts issued by the Group are initially measured at their fair values and are subsequently measured at the higher of the amount of the obligation under the contract, as
determined in accordance with IAS 37, and the amount initially recognised less, where appropriate, cumulative amortisation recognised in accordance with the revenue recognition policies.

SISTEMA PJSFC AND SUBSIDIARIES NOTES TO THE CONSOLIDATED FINANCIAL STATEMENTS (Amounts in millions of Russian Rubles, unless otherwise stated)
158
Telecommunication licenses – In 2012, the Federal Service for Supervision in the Area of Communications, Information Technologies and Mass Media allocated MTS the necessary license and frequencies to provide LTE telecommunication services in Russia. Under the terms and conditions of the LTE license, MTS is obligated to fully deploy LTE networks within seven years, commencing from 1 January 2013, and deliver LTE services in each population center with over 50,000 inhabitants in Russia by 2019. Also, MTS is obligated to invest at least RUB 15 billion annually toward the LTE roll-out until the network is fully deployed.
In May 2007, the Federal Service for Supervision in the Area of Communications, Information Technologies and Mass Media awarded MTS a license to provide 3G services in Russia. The 3G license was granted subject to certain capital and other commitments. In March 2015, upon winning a tender, MTS-Ukraine, a subsidiary of MTS, has acquired a
nationwide license for the provision of UMTS (3G) telecommunications services. The license with
the cost of UAH 2,715 million (RUB 6,015 million at the acquisition date) has been granted for 15 years. In accordance with the terms of the license MTS-Ukraine is required provide coverage across Ukraine by April 2020. In accordance with the terms of the license, MTS-Ukraine also concluded agreements on the conversion of provided frequencies with the Ministry of Defense of Ukraine, Ministry of Internal Affairs of Ukraine and State Service of Special Communications and Information Protection of
Ukraine. As of 31 December 2015, MTS-Ukraine has paid UAH 358 million (RUB 865 million as of the payment date) for the conversion of frequencies and is liable to pay UAH 267 million (RUB 596 million as of 31 December 2016) adjusted for the rate of inflation in the years 2017-2018. Management believes that as of December 31, 2016 the Group complied with the conditions of the aforementioned licenses.
Restriction on transactions with the shares of BPGC – In 2014, in the course of litigation, which the Group is not a party to, the court imposed restrictions on transactions with the shares of BPGC owned by the Group. The restrictions do not limit the Group’s voting rights, rights to receive dividends or any other shareholders rights. Taxation – Laws and regulations affecting business in the Russian Federation continue to change
rapidly. Management’s interpretation of such legislation as applied to the activity of the Group may be challenged by the relevant regional and federal authorities. Recent events suggest that the tax authorities are taking a more assertive position in their interpretation of the legislation and assessments and as a result, it is possible that transactions and activities that have not been challenged in the past may be challenged. Fiscal periods generally remain open to tax audit by the authorities in respect of taxes for three calendar years preceding the year of tax audit. Under certain circumstances reviews may cover longer periods. Management believes that it has provided
adequately for tax liabilities based on its interpretations of tax legislation. However, the relevant authorities may have different interpretations, and the effects on the financial statements could be significant. Where uncertainty exists, the Group has accrued tax liabilities as management’s best estimate of the probable outflow of resources which will be required to settle such liabilities. As of 31 December 2016, provisions for additional taxes and customs settlements comprised
RUB 1,213 million (31 December 2015: RUB 1,076 million). The Group also assesses the following contingent liabilities in respect of additional tax settlements:
December 31,
2016
December 31,
2015
Contingent liabilities for additional taxes other than income tax 1,306 419
Contingent liabilities for additional income taxes 3,256 413

SISTEMA PJSFC AND SUBSIDIARIES NOTES TO THE CONSOLIDATED FINANCIAL STATEMENTS (Amounts in millions of Russian Rubles, unless otherwise stated)
159
In 2015, amendments were introduced into the Russian tax legislation in respect of taxation of profit of controlled foreign companies. According to these changes, undistributed profits of the Group foreign subsidiaries, qualifying as controlled foreign companies, should be included in the income tax base of the controlling entities in particular cases. The management of the Group does not expect any significant effect of these changes on the consolidated financial statements of the Group. Potential adverse effects of economic instability and sanctions in Russia – Starting from
2014, sanctions have been imposed in several packages by the U.S. and the E.U. on certain Russian officials, businessmen and companies. This led to reduced access of the Russian businesses to international capital markets. The impact of further economic and political developments on future operations and financial
position of the Group might be significant. Political and economic crisis in Ukraine – During 2014, a deterioration in the political environment of Ukraine has led to general instability, economic deterioration and armed conflict in eastern Ukraine. The deterioration has further exacerbated the country’s already weak macroeconomic trends, which have led to reduced credit ratings, significant depreciation of its national currency and increased inflation. During 2014, the Ukrainian Parliament adopted a law allowing for the imposition of sanctions against countries, persons and companies deemed by the Ukrainian government to threaten Ukrainian national interests, national security, sovereignty or
the territorial integrity of Ukraine. The National Bank of Ukraine (“NBU”) passed a decree prohibiting Ukrainian companies to pay dividends to foreign investors. The decree was extended for a few times and its edition effective as of 31 December 2016 allows payment of dividends for the years 2014-2015, subject to certain restrictions. These circumstances, combined with continued political and economic instability in the country, could result in further negative impact
on the Group’s business including our financial position and results of operations. Such risks especially apply to funds deposited in Ukrainian banks, whose liquidity is affected by
the economic downturn. During 2015, the Group created an additional reserve of RUB 1,698 million for cash balances deposited in distressed Ukrainian banks which was included in Impairment of financial assets line in the accompanying consolidated statement of profit or loss. Also, in 2015 the Group entered into a factoring agreement in respect of cash balances deposited in bank Kyivska Rus (reserved in full amount as of 31 December 2016), under which the factor is
obliged to reimburse the Group for 45% of the cash balance. As of 31 December 2016, the Group did not account for any asset under this agreement, as no transfer of funds was made. As of 31 December 2016, the Group’s held RUB 3,617 million in current accounts and deposits in Ukrainian banks.
Anti-terror law – On 7 July 2016, a series of anti-terror laws (also known as “Yarovaya-Ozerov packet of laws”) was enacted. The laws provide for mandatory storage of recorded phone
conversations, text messages of subscribers, images, sounds, video and other types of messages by telecommunications operators for certain periods of time. These requirements become effective starting 1 July 2018. Compliance with laws may require construction of additional storage, processing and indexing centers and significant increase in the Group capital expenditures. This may adversely impact Group’s financial indicators. The requirements of the series of anti-terror laws are in the process of clarification and in-depth
development. The Group will estimate the possible impact of the anti-terror laws on the Group’s consolidated financial statements, including additional provisions, when the requirements and any obligations are sufficiently specified. Legal proceedings – In the ordinary course of business, the Group is a party to various legal
proceedings, and subject to claims, certain of which relate to the developing markets and
evolving regulatory environments in which the Group operates. At 31 December 2016, management estimates the range of possible losses, if any, in all pending litigations or other legal proceedings being up to RUB 8,722 million.

SISTEMA PJSFC AND SUBSIDIARIES NOTES TO THE CONSOLIDATED FINANCIAL STATEMENTS (Amounts in millions of Russian Rubles, unless otherwise stated)
160
39. APPLICATION OF NEW AND REVISED IFRSS Standards, interpretations and amendments adopted on 1 January 2016 None of the standards, interpretations and amendments adopted by the Group on 1 January 2016 had a significant effect on the Group’s consolidated financial statements.
New and revised IFRSs in issue but not yet effective The Group has not early adopted any of the new or revised IFRSs that have been issued but are not yet effective. Significant new standards or amendments include:
IFRS 9, Financial Instruments – The standard is effective for annual periods beginning on or
after 1 January 2018, with earlier application permitted. Depending on the chosen approach to applying IFRS 9, the transition can involve one or more than one date of initial application for different requirements. IFRS 9 governs the classification and measurement of financial assets and liabilities, derecognition, impairment and hedge accounting matters. Particularly, in relation to the impairment of financial assets, IFRS 9 requires an expected credit loss model, as opposed to an incurred credit loss model under IAS 39. The expected credit loss model requires an entity to account for expected credit losses and changes in those expected credit losses at each
reporting date to reflect changes in credit risk since initial recognition. The Group anticipates that the adoption of IFRS 9 may have an impact on amounts reported in respect of the Group’s financial assets and financial liabilities primarily related to MTS Bank and Corporate reporting segments. However, it is not practicable to provide a reasonable estimate of its effect until a detailed review has been completed. IFRS 15, Revenue from Contracts with Customers – This standard, effective for annual
periods beginning on or after 1 January 2018 (earlier application permitted), provides a single, principle-based five-step model for determination and recognition of revenue to be applied to all contracts with customers. It supersedes the existing standards IAS 18, Revenue, and IAS 11, Construction Contracts, and related interpretations. The impact on the Group’s consolidated financial statements following implementation of the new
standard will include future capitalisation and recognition of the expenses for sales commissions (customer acquisition costs) over the estimated customer retention period (MTS reporting segment). The Group is continuing to analyse the effects of the new standard implementation, though a reliable estimate of the quantitative effects will only be possible once the analysis has been completed.
IFRS 16, Leases – The standard provides a single lessee accounting model, requiring lessees to recognise assets and liabilities for all leases, with certain exemptions, and to present the rights and obligations associated with these leases in the statement of financial position. Therefore, upon adoption of this standard, lessees will no longer be required to make a distinction between finance and operating lease. For all leases, a lessee will recognise a lease liability in its statement of financial position for an obligation to make future lease payments. At the same time, a lessee
will capitalise a right of use to the underlying asset. IFRS 16 is effective for annual reporting periods beginning on or after 1 January 2019 (earlier application is permitted, if IFRS 15 has also been applied). The Group is currently evaluating the impact of these amendments on the consolidated financial statements, though a reliable estimate of the quantitative effects is not possible at the present time.
The Group does not expect that future adoption of other new or revised IFRSs that have been issued but are not yet effective will have a material impact on the Group’s consolidated financial
statements.

SISTEMA PJSFC AND SUBSIDIARIES NOTES TO THE CONSOLIDATED FINANCIAL STATEMENTS (Amounts in millions of Russian Rubles, unless otherwise stated)
161
40. EVENTS AFTER THE REPORTING DATE For the purpose of the accompanying consolidated financial statements, subsequent events have been evaluated through 31 March 2017. Initial public offering of Detsky mir – In February 2017, Detsky mir completed an initial public offering on Moscow Exchange. The IPO price was set at RUB 85 per share. The Company
sold 151,301,256 shares via the offering, the remaining Group ownership interest in Detsky mir is 52.1%. MTS shares tender offer – Under the MTS tender offer to repurchase its ordinary shares (including shares represented by ADSs), MTS purchased a total of 16,022,364 shares at a price
per share of RUB 290, for a total cost of RUB 4.6 billion from non-controlling shareholders.
Simultaneously, MTS purchased 16,038,892 shares from Sistema Finance S.A. for an aggregate purchase price of RUB 4.7 billion.


