Thomas F. Jenkins, Marianne E. Walsh, Philip G. Thorne, August 1998 Paul H. Miyares, Thomas A. Ranney, Clarence L. Grant and John R. Esparza Site Characterization for Explosives Contamination at a Military Firing Range Impact Area SPECIAL REPORT 98-9
Transcript
Thomas F. Jenkins, Marianne E. Walsh, Philip G. Thorne, August 1998Paul H. Miyares, Thomas A. Ranney, Clarence L. Grantand John R. Esparza
Site Characterization for ExplosivesContamination at a MilitaryFiring Range Impact Area
SPEC
IAL
REP
OR
T
98
-9
Abstract: A study was conducted at the inland firingranges at Fort Ord to determine the current levels ofexplosives residues and to recommend appropriate fu-ture site characterization techniques. A set of 280 soilsamples was collected from depths ranging from 0–15 cm to 105–120 cm from anti-tank ranges 44 and48. Sampling locations were selected on the basis ofthe locations of current and former targets, and includedan area away from specific targets and a backgroundarea, not affected by local detonations. HMX was theexplosives residue present at the highest concentra-
How to get copies of CRREL technical publications:
Department of Defense personnel and contractors may order reports through the Defense Technical Information Center:DTIC-BR SUITE 09448725 JOHN J KINGMAN RDFT BELVOIR VA 22060-6218Telephone 1 800 225 3842E-mail [email protected]
All others may order reports through the National Technical Information Service:NTIS5285 PORT ROYAL RDSPRINGFIELD VA 22161Telephone 1 703 487 4650
1 703 487 4639 (TDD for the hearing-impaired)E-mail [email protected] http://www.fedworld.gov/ntis/ntishome.html
A complete list of all CRREL technical publications is available from:USACRREL (CECRL-LP)72 LYME RDHANOVER NH 03755-1290Telephone 1 603 646 4338E-mail [email protected]
For information on all aspects of the Cold Regions Research and Engineering Laboratory, visit our World Wide Web site:http://www.crrel.usace.army.mil
tion. Much lower concentrations of RDX, TNT, and twoisomers of aminodinitrotoluene were also detected. Ex-plosives residues were largely confined to surface soilsnear tank targets. A major problem for site characteriza-tion was found to be the large spatial heterogeneitypresent. Composite samples very effectively provided rep-resentative samples for 5- × 5-m size grids. A colorimet-ric on-site method gave reliable results for HMX, relativeto SW846 Method 8330. No currently available on-sitemethod for RDX was found to be adequate in the pres-ence of much higher concentrations of HMX.
Special Report 98-9
Thomas F. Jenkins, Marianne E. Walsh, Philip G. Thorne, August 1998Paul H. Miyares, Thomas A. Ranney, Clarence L. Grant,and John R. Esparza
Prepared for
OFFICE OF THE CHIEF OF ENGINEERS
Approved for public release; distribution is unlimited.
Site Characterization for ExplosivesContamination at a MilitaryFiring Range Impact Area
US Army Corpsof Engineers®
Cold Regions Research &Engineering Laboratory
ii
PREFACE
This report was prepared by Dr. Thomas F. Jenkins, Research Chemist, MarianneE. Walsh, Chemical Engineer, Philip G. Thorne, Research Physical Scientist, Geo-logical Sciences Division, Dr. Paul H. Miyares, Research Chemist, Geochemical Sci-ences Division, Research and Engineering Directorate, U.S. Army Cold RegionsResearch and Engineering Laboratory, Thomas A. Ranney, Science and TechnologyCorporation, Hanover, New Hampshire, Dr. Clarence L. Grant, Professor Emeri-tus, Chemistry Department, University of New Hampshire, Durham, and John R.Esparza, Chemist, U.S. Army Engineer District, Sacramanto. Funding for this workwas provide by the U.S. Army Engineer District, Sacramento, John Esparza, ProjectMonitor and the U.S. Army Environmental Center, Martin H. Stutz, Project Moni-tor.
The authors gratefully acknowledge the assistance provided by A.R. Smith, Sac-ramento District, and personnel from CMS Corporation, Monterey, California, inproviding clearance for the possible presence of unexploded ordnance (UXO) andfor collecting soil samples from explosives contaminated areas. The authors alsoacknowledge Dr. Ramzi J. Mahmood, California State University at Sacramento,David Eisen, Sacramento District, Alan Hewitt, CRREL, and Martin H. Stutz, U.S.Army Environmental Center, Aberdeen Proving Ground, Maryland, for their tech-nical review of this report. In addition, the authors acknowledge Jane G. Mason,CRREL, for assistance in preparation of the figures presented in this report, andMark Hardenberg, CRREL, for editorial assistance in the final preparation of thisreport.
This publication reflects the personal views of the authors and does not suggestor reflect the policy, practices, programs, or doctrine of the U.S. Army or Govern-ment of the United States. The contents of this report are not to be used for adver-tising or promotional purposes. Citation of brand names does not constitute anofficial endorsement or approval of the use of such commercial products.
Experimental methods ............................................................................................... 5Sampling design ................................................................................................. 5Soil sample collection ......................................................................................... 7Homogenization and subsampling for discrete soil samples ...................... 7Preparation of discrete samples used to assess the effect of sample
size on heterogeneity .................................................................................. 8Preparation of composite samples ................................................................... 8Collection and analysis of dust samples ......................................................... 8Soil sample extraction and HPLC analysis ..................................................... 8Extraction time assessment and evaluation of on-site methods
for RDX and HMX ...................................................................................... 9Results and discussion ............................................................................................... 9
Overview of explosives detected in the various sampling areas ................. 9Depth of contamination ..................................................................................... 9Areal distribution of contaminants .................................................................. 11Spatial heterogeneity .......................................................................................... 15Evaluation of various on-site methods for use with soils from
the inland ranges ........................................................................................ 17Composite preparation ...................................................................................... 19
Summary and conclusions ........................................................................................ 20Literature cited ............................................................................................................ 24Appendix A: Guide for preliminary testing of munitions-contaminated
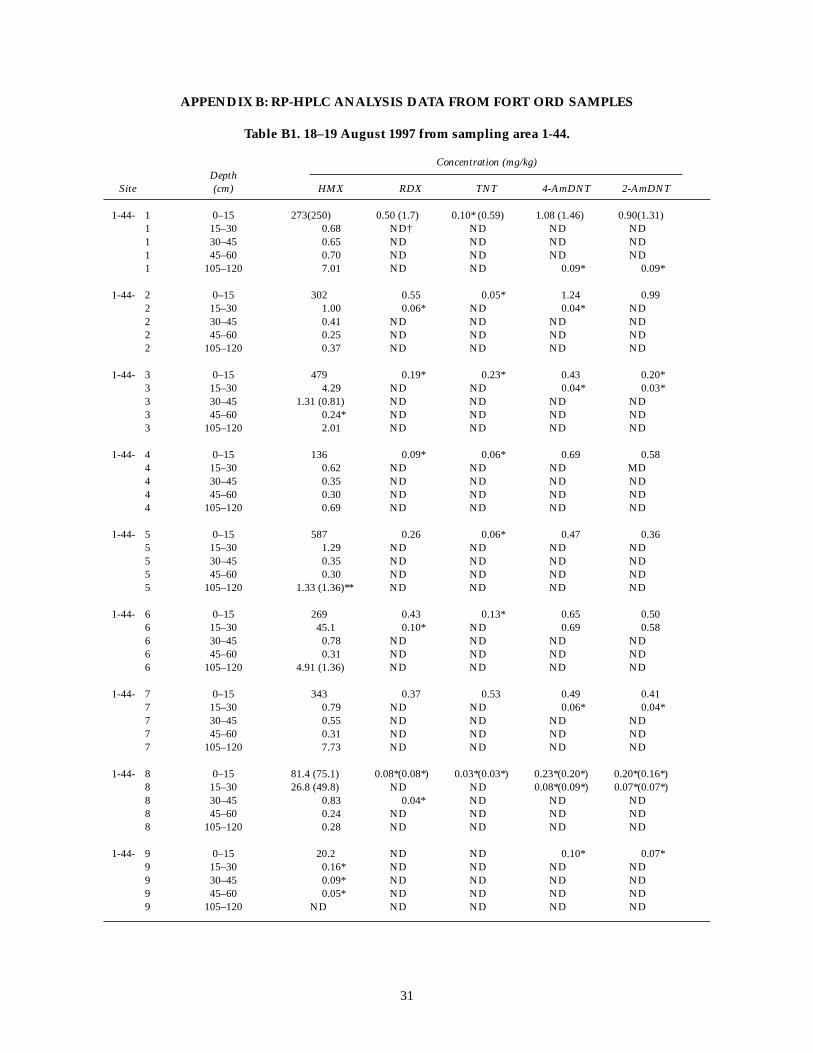
sites—preparation for sampling plan .............................................................. 27Appendix B: RP-HPLC analysis data from Fort Ord samples ............................. 33Abstract ........................................................................................................................ 41
ILLUSTRATIONS
Figure1. Structures of explosives detected at the Fort Ord inland firing ranges .... 22. Ford Ord ............................................................................................................. 33. HMX concentrations (mg/kg) in soil at Canadian Force Base-Valcartier
firing range, relative to placement of tank targets ................................. 4
iv
Page
4. 66-mm M72 LAW rocket .................................................................................. 55. Sampling grids for area 1-44 ........................................................................... 66. Locations of sampling points within a grid .................................................. 67. Concentration (mg/kg) of explosives residues as a function of depth
for grid A, sampling location 1-44 ............................................................ 128. Areal distribution of explosives residues (mg/kg) in surface soils
for sampling location 1-44 ......................................................................... 149. Correlation of HMX concentration estimates from the colorimetric
on-site method with those from RP-HPLC analysis of the sameacetone extracts ........................................................................................... 19
10. Log-normal distribution of HMX for discrete soil samples from gridA, sampling location 1-44 .......................................................................... 22
11. Concentration of HMX in surface soils at Fort Ord samplinglocation 1-44 and CFB-Valcartier as a function of distancefrom targets .................................................................................................. 22
12. Proposed concentric ring sampling plan for target areas ........................... 23
TABLES
Table1. Water quality criteria for selected explosives ............................................... 42. Concentrations of HMX by SW-846 Method 8330 at firing range 44 ........ 103. Concentrations of RDX, TNT, 4-AmDNT, and 2-AmDNT by SW-846
Method 8330 in surface soils at firing range 44 ...................................... 114. Concentrations of HMX and RDX by SW-846 Method 8330 at firing
range 48 ........................................................................................................ 135. Analytical results for sample size/heterogeneity study using surface
soils ............................................................................................................... 166. Analysis of airborne dust from Fort Ord and CFB-Valcartier soils ........... 177. HMX concentrations from extraction time study using acetone ............... 188. Assessment of on-site methods for RDX and HMX in Fort Ord
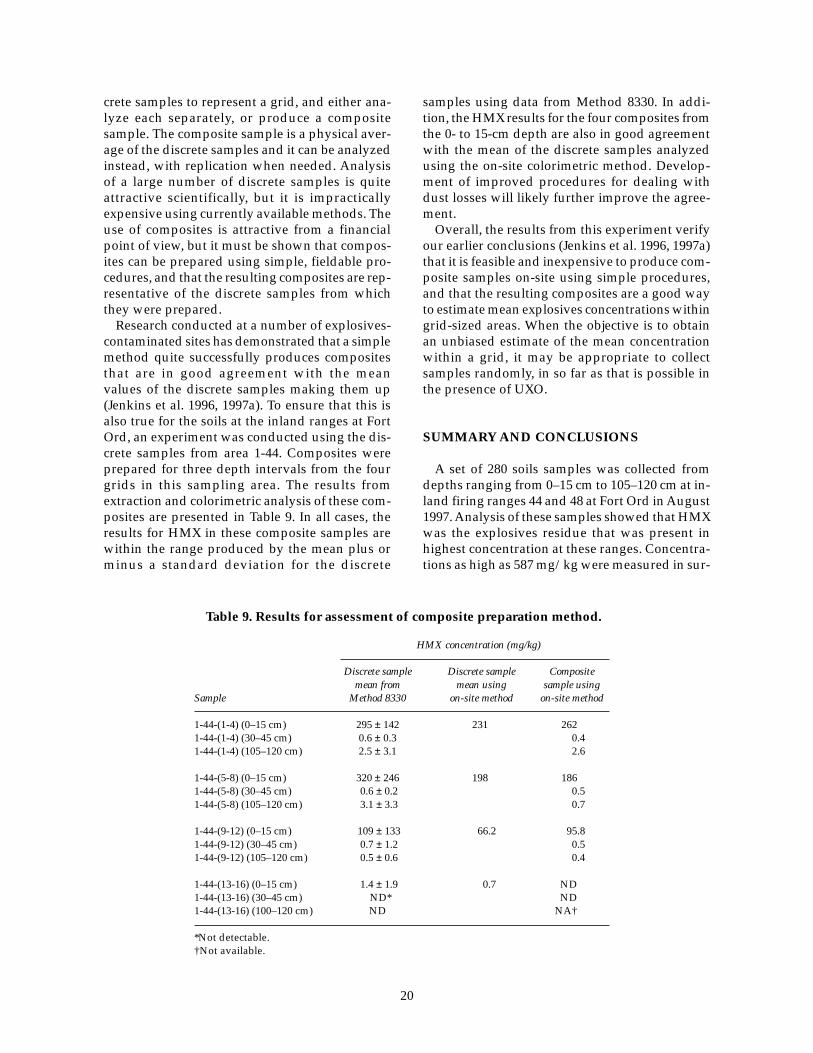
soil samples ................................................................................................. 189. Results for assessment of composite preparation method ......................... 20
Site Characterization for ExplosivesContamination at a Military
Firing Range Impact Area
THOMAS F. JENKINS, MARIANNE E. WALSH, PHILIP G. THORNE,PAUL H. MIYARES, THOMAS A. RANNEY, CLARENCE L. GRANT,
AND JOHN R. ESPARZA
INTRODUCTION
BackgroundA study conducted in 1994 by the Army revealed
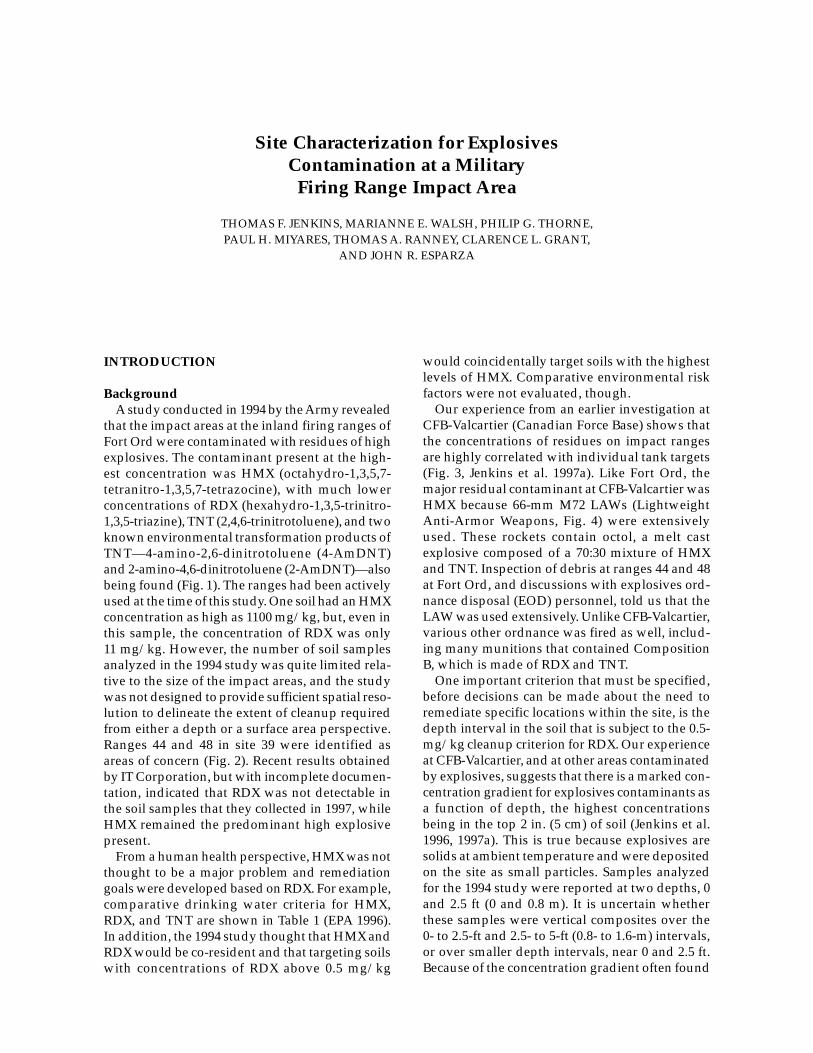
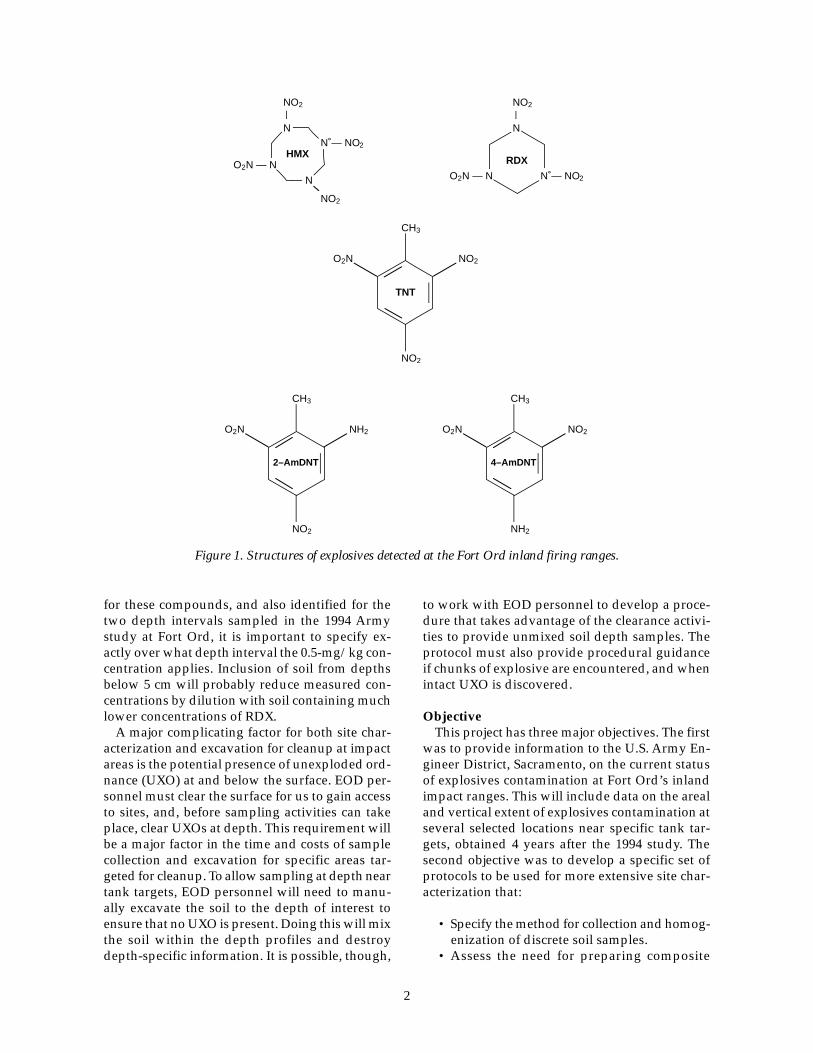
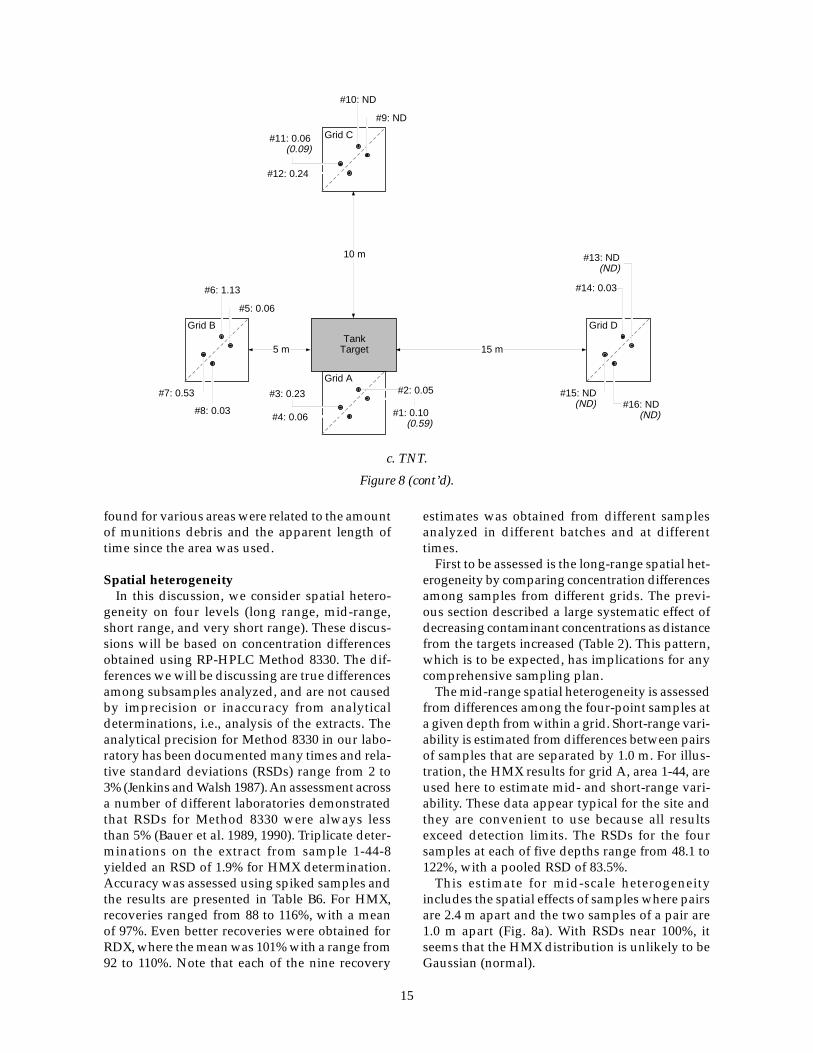
that the impact areas at the inland firing ranges ofFort Ord were contaminated with residues of highexplosives. The contaminant present at the high-est concentration was HMX (octahydro-1,3,5,7-tetranitro-1,3,5,7-tetrazocine), with much lowerconcentrations of RDX (hexahydro-1,3,5-trinitro-1,3,5-triazine), TNT (2,4,6-trinitrotoluene), and twoknown environmental transformation products ofTNT—4-amino-2,6-dinitrotoluene (4-AmDNT)and 2-amino-4,6-dinitrotoluene (2-AmDNT)—alsobeing found (Fig. 1). The ranges had been activelyused at the time of this study. One soil had an HMXconcentration as high as 1100 mg/kg, but, even inthis sample, the concentration of RDX was only11 mg/kg. However, the number of soil samplesanalyzed in the 1994 study was quite limited rela-tive to the size of the impact areas, and the studywas not designed to provide sufficient spatial reso-lution to delineate the extent of cleanup requiredfrom either a depth or a surface area perspective.Ranges 44 and 48 in site 39 were identified asareas of concern (Fig. 2). Recent results obtainedby IT Corporation, but with incomplete documen-tation, indicated that RDX was not detectable inthe soil samples that they collected in 1997, whileHMX remained the predominant high explosivepresent.
From a human health perspective, HMX was notthought to be a major problem and remediationgoals were developed based on RDX. For example,comparative drinking water criteria for HMX,RDX, and TNT are shown in Table 1 (EPA 1996).In addition, the 1994 study thought that HMX andRDX would be co-resident and that targeting soilswith concentrations of RDX above 0.5 mg/kg
would coincidentally target soils with the highestlevels of HMX. Comparative environmental riskfactors were not evaluated, though.
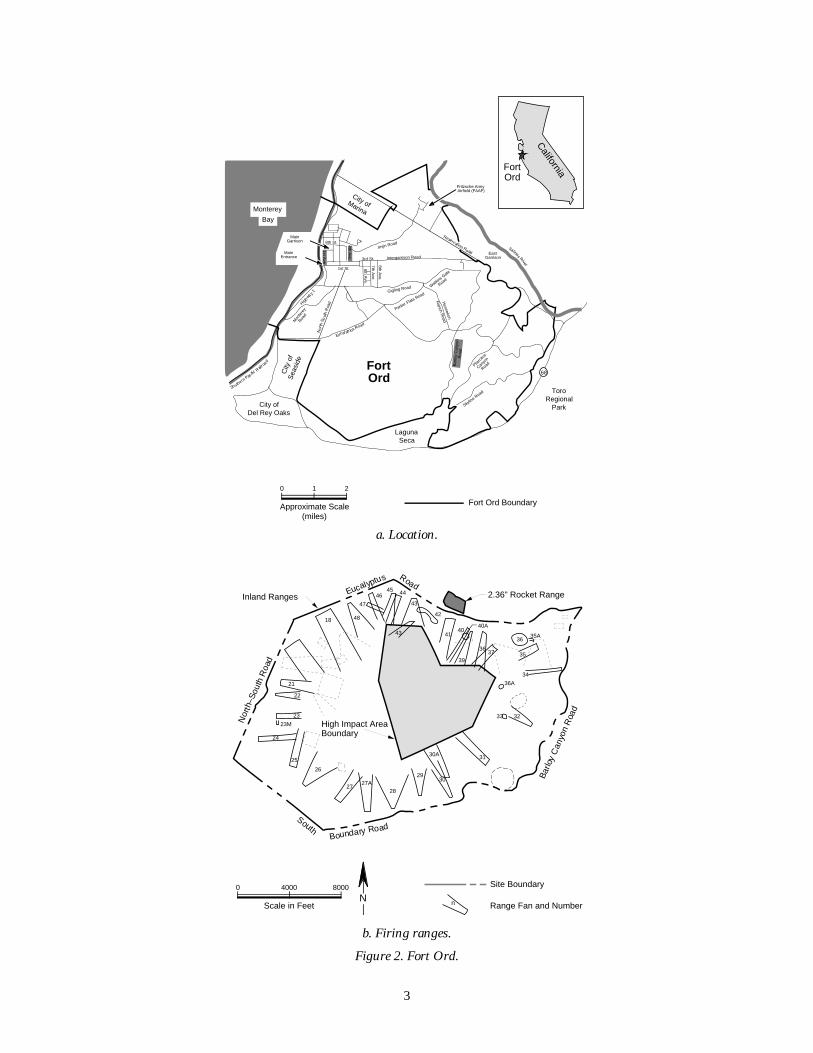
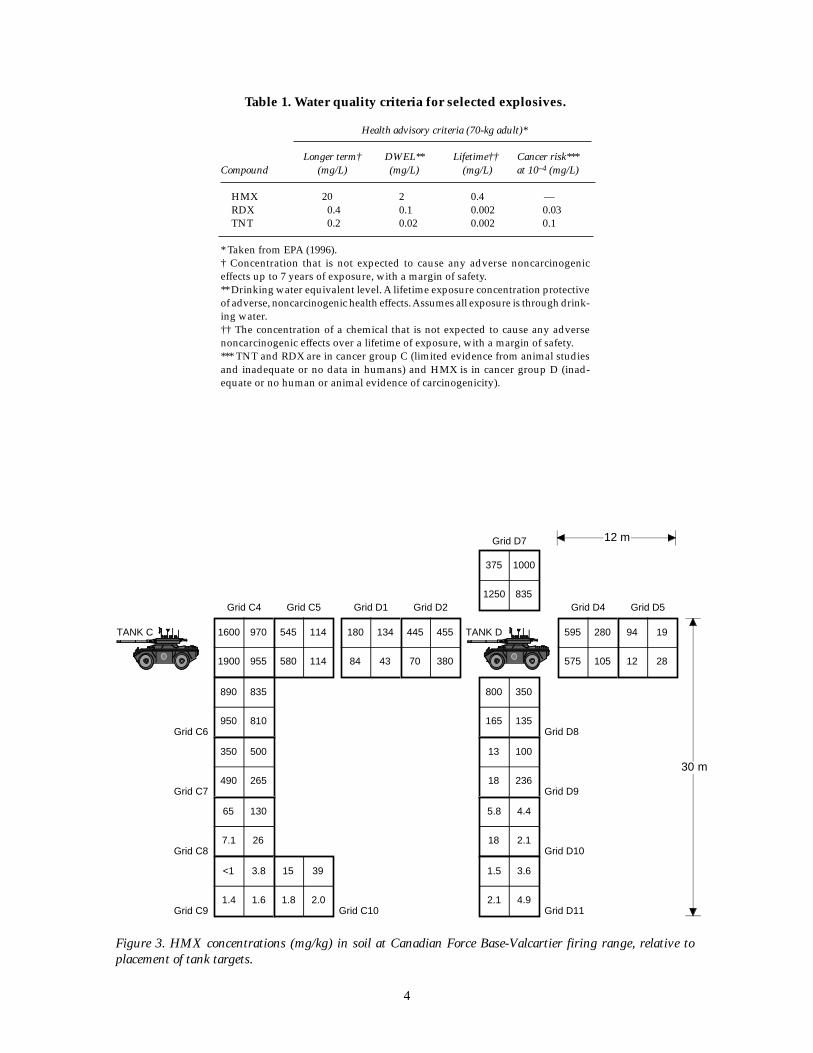
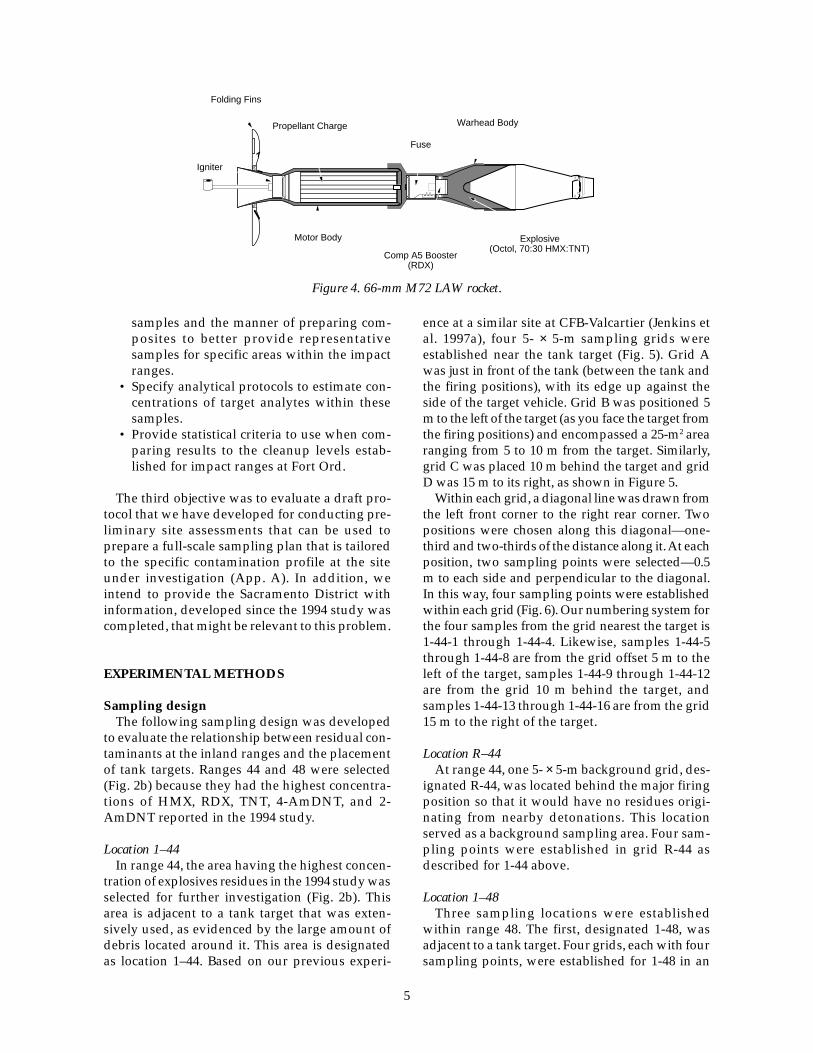
Our experience from an earlier investigation atCFB-Valcartier (Canadian Force Base) shows thatthe concentrations of residues on impact rangesare highly correlated with individual tank targets(Fig. 3, Jenkins et al. 1997a). Like Fort Ord, themajor residual contaminant at CFB-Valcartier wasHMX because 66-mm M72 LAWs (LightweightAnti-Armor Weapons, Fig. 4) were extensivelyused. These rockets contain octol, a melt castexplosive composed of a 70:30 mixture of HMXand TNT. Inspection of debris at ranges 44 and 48at Fort Ord, and discussions with explosives ord-nance disposal (EOD) personnel, told us that theLAW was used extensively. Unlike CFB-Valcartier,various other ordnance was fired as well, includ-ing many munitions that contained CompositionB, which is made of RDX and TNT.
One important criterion that must be specified,before decisions can be made about the need toremediate specific locations within the site, is thedepth interval in the soil that is subject to the 0.5-mg/kg cleanup criterion for RDX. Our experienceat CFB-Valcartier, and at other areas contaminatedby explosives, suggests that there is a marked con-centration gradient for explosives contaminants asa function of depth, the highest concentrationsbeing in the top 2 in. (5 cm) of soil (Jenkins et al.1996, 1997a). This is true because explosives aresolids at ambient temperature and were depositedon the site as small particles. Samples analyzedfor the 1994 study were reported at two depths, 0and 2.5 ft (0 and 0.8 m). It is uncertain whetherthese samples were vertical composites over the0- to 2.5-ft and 2.5- to 5-ft (0.8- to 1.6-m) intervals,or over smaller depth intervals, near 0 and 2.5 ft.Because of the concentration gradient often found
2
for these compounds, and also identified for thetwo depth intervals sampled in the 1994 Armystudy at Fort Ord, it is important to specify ex-actly over what depth interval the 0.5-mg/kg con-centration applies. Inclusion of soil from depthsbelow 5 cm will probably reduce measured con-centrations by dilution with soil containing muchlower concentrations of RDX.
A major complicating factor for both site char-acterization and excavation for cleanup at impactareas is the potential presence of unexploded ord-nance (UXO) at and below the surface. EOD per-sonnel must clear the surface for us to gain accessto sites, and, before sampling activities can takeplace, clear UXOs at depth. This requirement willbe a major factor in the time and costs of samplecollection and excavation for specific areas tar-geted for cleanup. To allow sampling at depth neartank targets, EOD personnel will need to manu-ally excavate the soil to the depth of interest toensure that no UXO is present. Doing this will mixthe soil within the depth profiles and destroydepth-specific information. It is possible, though,
to work with EOD personnel to develop a proce-dure that takes advantage of the clearance activi-ties to provide unmixed soil depth samples. Theprotocol must also provide procedural guidanceif chunks of explosive are encountered, and whenintact UXO is discovered.
ObjectiveThis project has three major objectives. The first
was to provide information to the U.S. Army En-gineer District, Sacramento, on the current statusof explosives contamination at Fort Ord’s inlandimpact ranges. This will include data on the arealand vertical extent of explosives contamination atseveral selected locations near specific tank tar-gets, obtained 4 years after the 1994 study. Thesecond objective was to develop a specific set ofprotocols to be used for more extensive site char-acterization that:
• Specify the method for collection and homog-enization of discrete soil samples.
• Assess the need for preparing composite
CH3
O2N NO2
TNT
NO2
2–AmDNT
CH3
O2N NH2
NO2
4–AmDNT
CH3
O2N NO2
NH2
Figure 1. Structures of explosives detected at the Fort Ord inland firing ranges.
N
NO2
N — NO2
O2N — N
N
NO2
HMX
N — NO2O2N — N
RDX
N
NO2
3
0 1 2
Approximate Scale(miles)
Fort Ord Boundary
FortOrd
California
Southern Pac
ific R
ailroa
d
ToroRegional
Park
FortOrd
1st St.
8th Ave.
7th Ave.
3rd St. Intergarrison Road
Imjin Road
Watki
ns Gate
Road
Ranch R
oad
LagunaSeca
City ofDel Rey Oaks
City
of
Sea
side
City ofMarina
Parker Flats Road
Highwa
y 1
Pilarci
tos
Canyo
n
Road
Skylin
e Road
Fritzsche ArmyAirfield (FAAF)
EastGarrison
Gigling Road
Bar
loy
Can
yon
Roa
d
6th Ave.
Hennekon
Mon
tere
yRoa
d
Eucal yp tus Road
Nor
th S
out
h R
oad
Reservation Road
1st Ave.
4th Ave.
8th St.Salinas River
68
MainGarrison
MainEntrance
Monterey
Bay
0 4000 8000
Scale in Feet
Site Boundary
n Range Fan and NumberN
21
22
23
23M
24
25
26
2727A
28
2930
30A 31
32
36A
33
34
3536
3739
4041
3635A
43
42
444546
47
48
43
18
Eucalyptus RoadInland Ranges 2.36” Rocket Range
Nor
th–S
outh
Roa
d
High Impact AreaBoundary
SouthBoundary Road
Barlo
y C
anyo
n R
oad
40A
Figure 2. Fort Ord.
a. Location.
b. Firing ranges.
4
Table 1. Water quality criteria for selected explosives.
Health advisory criteria (70-kg adult)*
Longer term† DWEL** Lifetime†† Cancer risk***Compound (mg/L) (mg/L) (mg/L) at 10–4 (mg/L)
* Taken from EPA (1996).† Concentration that is not expected to cause any adverse noncarcinogeniceffects up to 7 years of exposure, with a margin of safety.** Drinking water equivalent level. A lifetime exposure concentration protectiveof adverse, noncarcinogenic health effects. Assumes all exposure is through drink-ing water.†† The concentration of a chemical that is not expected to cause any adversenoncarcinogenic effects over a lifetime of exposure, with a margin of safety.*** TNT and RDX are in cancer group C (limited evidence from animal studiesand inadequate or no data in humans) and HMX is in cancer group D (inad-equate or no human or animal evidence of carcinogenicity).
Grid C4 Grid C5 Grid D1 Grid D2 Grid D4 Grid D5
Grid D10
Grid D7
1600 970
1900 955
545 114
580 114
180 134
84 43
445 455
70 380
595 280
575 105
94 19
12 28
375 1000
1250 835
800 350
165 135
13 100
18 236
5.8 4.4
18 2.1
1.5 3.6
2.1 4.9Grid D11
Grid D9
Grid D8
Grid C8
890 835
950 810
350 500
490 265
65 130
7.1 26
<1 3.8
1.4 1.6
Grid C7
Grid C6
Grid C9 Grid C10
15 39
1.8 2.0
TANK C TANK D
12 m
30 m
Figure 3. HMX concentrations (mg/kg) in soil at Canadian Force Base-Valcartier firing range, relative toplacement of tank targets.
5
samples and the manner of preparing com-posites to better provide representativesamples for specific areas within the impactranges.
• Specify analytical protocols to estimate con-centrations of target analytes within thesesamples.
• Provide statistical criteria to use when com-paring results to the cleanup levels estab-lished for impact ranges at Fort Ord.
The third objective was to evaluate a draft pro-tocol that we have developed for conducting pre-liminary site assessments that can be used toprepare a full-scale sampling plan that is tailoredto the specific contamination profile at the siteunder investigation (App. A). In addition, weintend to provide the Sacramento District withinformation, developed since the 1994 study wascompleted, that might be relevant to this problem.
EXPERIMENTAL METHODS
Sampling designThe following sampling design was developed
to evaluate the relationship between residual con-taminants at the inland ranges and the placementof tank targets. Ranges 44 and 48 were selected(Fig. 2b) because they had the highest concentra-tions of HMX, RDX, TNT, 4-AmDNT, and 2-AmDNT reported in the 1994 study.
Location 1–44In range 44, the area having the highest concen-
tration of explosives residues in the 1994 study wasselected for further investigation (Fig. 2b). Thisarea is adjacent to a tank target that was exten-sively used, as evidenced by the large amount ofdebris located around it. This area is designatedas location 1–44. Based on our previous experi-
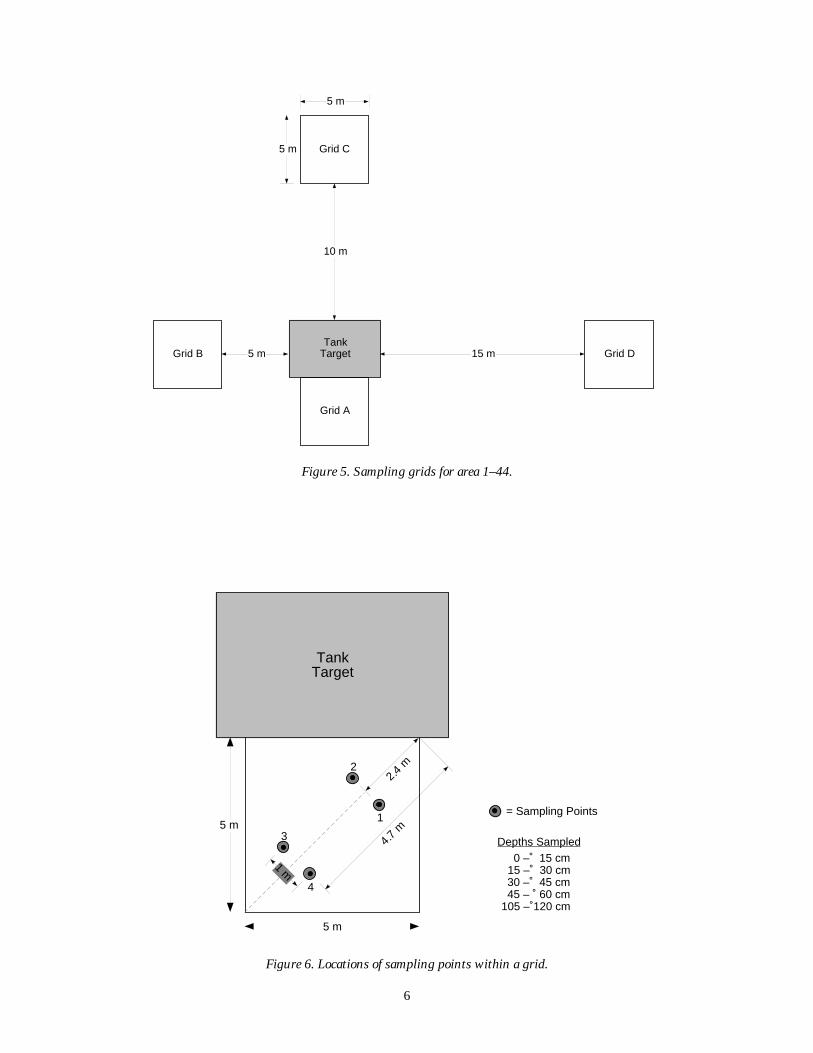
ence at a similar site at CFB-Valcartier (Jenkins etal. 1997a), four 5- × 5-m sampling grids wereestablished near the tank target (Fig. 5). Grid Awas just in front of the tank (between the tank andthe firing positions), with its edge up against theside of the target vehicle. Grid B was positioned 5m to the left of the target (as you face the target fromthe firing positions) and encompassed a 25-m2 arearanging from 5 to 10 m from the target. Similarly,grid C was placed 10 m behind the target and gridD was 15 m to its right, as shown in Figure 5.
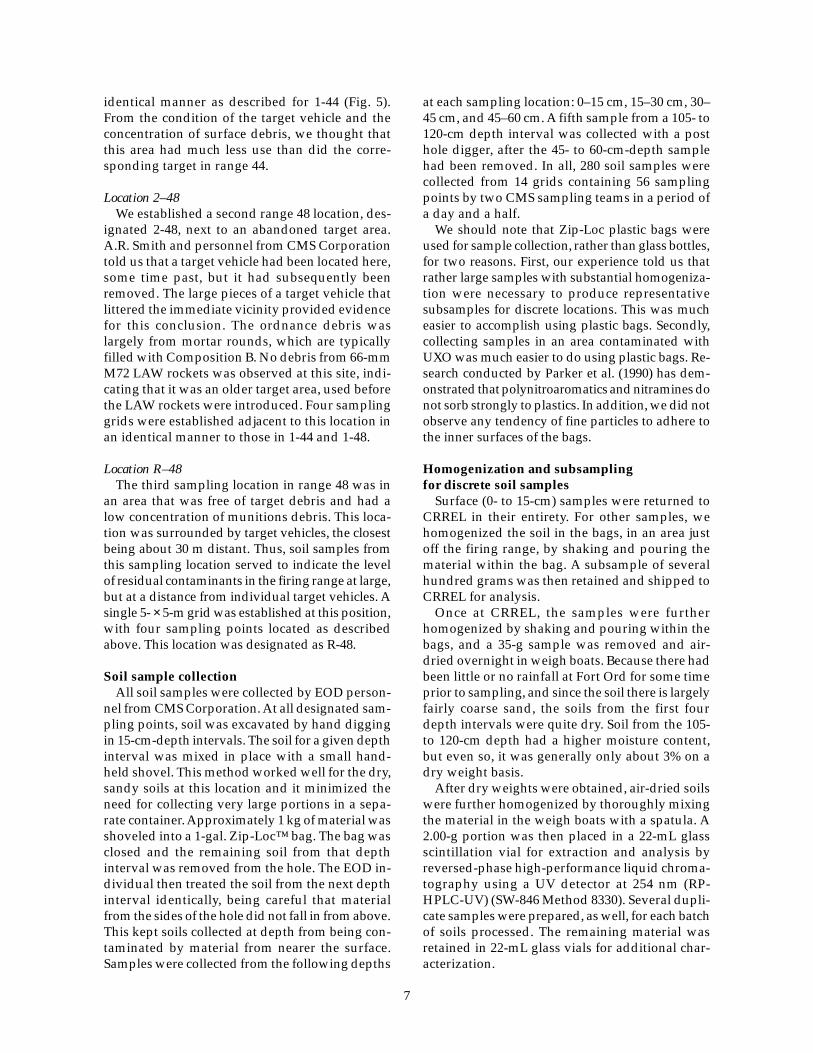
Within each grid, a diagonal line was drawn fromthe left front corner to the right rear corner. Twopositions were chosen along this diagonal—one-third and two-thirds of the distance along it. At eachposition, two sampling points were selected—0.5m to each side and perpendicular to the diagonal.In this way, four sampling points were establishedwithin each grid (Fig. 6). Our numbering system forthe four samples from the grid nearest the target is1-44-1 through 1-44-4. Likewise, samples 1-44-5through 1-44-8 are from the grid offset 5 m to theleft of the target, samples 1-44-9 through 1-44-12are from the grid 10 m behind the target, andsamples 1-44-13 through 1-44-16 are from the grid15 m to the right of the target.
Location R–44At range 44, one 5- × 5-m background grid, des-
ignated R-44, was located behind the major firingposition so that it would have no residues origi-nating from nearby detonations. This locationserved as a background sampling area. Four sam-pling points were established in grid R-44 asdescribed for 1-44 above.
Location 1–48Three sampling locations were established
within range 48. The first, designated 1-48, wasadjacent to a tank target. Four grids, each with foursampling points, were established for 1-48 in an
– – –
Propellant Charge
Fuse
Warhead Body
Folding Fins
Igniter
Motor Body Explosive(Octol, 70:30 HMX:TNT)
Comp A5 Booster(RDX)
Figure 4. 66-mm M72 LAW rocket.
6
TankTarget
10 m
15 m5 mGrid B
Grid C
Grid A
Grid D
5 m
5 m
TankTarget
5 m
5 m
= Sampling Points
Depths Sampled 0 – 15 cm 15 – 30 cm 30 – 45 cm 45 – 60 cm 105 – 120 cm
2.4 m
4.7 m
1 m
1
2
3
4
Figure 6. Locations of sampling points within a grid.
Figure 5. Sampling grids for area 1–44.
7
identical manner as described for 1-44 (Fig. 5).From the condition of the target vehicle and theconcentration of surface debris, we thought thatthis area had much less use than did the corre-sponding target in range 44.
Location 2–48We established a second range 48 location, des-
ignated 2-48, next to an abandoned target area.A.R. Smith and personnel from CMS Corporationtold us that a target vehicle had been located here,some time past, but it had subsequently beenremoved. The large pieces of a target vehicle thatlittered the immediate vicinity provided evidencefor this conclusion. The ordnance debris waslargely from mortar rounds, which are typicallyfilled with Composition B. No debris from 66-mmM72 LAW rockets was observed at this site, indi-cating that it was an older target area, used beforethe LAW rockets were introduced. Four samplinggrids were established adjacent to this location inan identical manner to those in 1-44 and 1-48.
Location R–48The third sampling location in range 48 was in
an area that was free of target debris and had alow concentration of munitions debris. This loca-tion was surrounded by target vehicles, the closestbeing about 30 m distant. Thus, soil samples fromthis sampling location served to indicate the levelof residual contaminants in the firing range at large,but at a distance from individual target vehicles. Asingle 5- × 5-m grid was established at this position,with four sampling points located as describedabove. This location was designated as R-48.
Soil sample collectionAll soil samples were collected by EOD person-
nel from CMS Corporation. At all designated sam-pling points, soil was excavated by hand diggingin 15-cm-depth intervals. The soil for a given depthinterval was mixed in place with a small hand-held shovel. This method worked well for the dry,sandy soils at this location and it minimized theneed for collecting very large portions in a sepa-rate container. Approximately 1 kg of material wasshoveled into a 1-gal. Zip-Loc™ bag. The bag wasclosed and the remaining soil from that depthinterval was removed from the hole. The EOD in-dividual then treated the soil from the next depthinterval identically, being careful that materialfrom the sides of the hole did not fall in from above.This kept soils collected at depth from being con-taminated by material from nearer the surface.Samples were collected from the following depths
at each sampling location: 0–15 cm, 15–30 cm, 30–45 cm, and 45–60 cm. A fifth sample from a 105- to120-cm depth interval was collected with a posthole digger, after the 45- to 60-cm-depth samplehad been removed. In all, 280 soil samples werecollected from 14 grids containing 56 samplingpoints by two CMS sampling teams in a period ofa day and a half.
We should note that Zip-Loc plastic bags wereused for sample collection, rather than glass bottles,for two reasons. First, our experience told us thatrather large samples with substantial homogeniza-tion were necessary to produce representativesubsamples for discrete locations. This was mucheasier to accomplish using plastic bags. Secondly,collecting samples in an area contaminated withUXO was much easier to do using plastic bags. Re-search conducted by Parker et al. (1990) has dem-onstrated that polynitroaromatics and nitramines donot sorb strongly to plastics. In addition, we did notobserve any tendency of fine particles to adhere tothe inner surfaces of the bags.
Homogenization and subsamplingfor discrete soil samples
Surface (0- to 15-cm) samples were returned toCRREL in their entirety. For other samples, wehomogenized the soil in the bags, in an area justoff the firing range, by shaking and pouring thematerial within the bag. A subsample of severalhundred grams was then retained and shipped toCRREL for analysis.
Once at CRREL, the samples were furtherhomogenized by shaking and pouring within thebags, and a 35-g sample was removed and air-dried overnight in weigh boats. Because there hadbeen little or no rainfall at Fort Ord for some timeprior to sampling, and since the soil there is largelyfairly coarse sand, the soils from the first fourdepth intervals were quite dry. Soil from the 105-to 120-cm depth had a higher moisture content,but even so, it was generally only about 3% on adry weight basis.
After dry weights were obtained, air-dried soilswere further homogenized by thoroughly mixingthe material in the weigh boats with a spatula. A2.00-g portion was then placed in a 22-mL glassscintillation vial for extraction and analysis byreversed-phase high-performance liquid chroma-tography using a UV detector at 254 nm (RP-HPLC-UV) (SW-846 Method 8330). Several dupli-cate samples were prepared, as well, for each batchof soils processed. The remaining material wasretained in 22-mL glass vials for additional char-acterization.
8
Preparation of discrete samples used to assessthe effect of sample size on heterogeneity
The samples used for this study were from the0- to 15-cm depth of 1-44-8 and 1-44-11. Eachsample’s material was placed in an aluminum panand coned and quartered, as described elsewhere(Jenkins et al. 1996). Approximately 100 g of soilwas removed from each quarter to prepare a400-g sample, which was placed in another pan.
The material in the second pan was again mixedthoroughly and a set of five replicate 20-g portionsand five replicate 7.5-g portions were weighed intoindividual 125-mL Nalgene bottles. The remain-der of the material was split in half. From one half,five 2.0-g and five 0.5-g portions were weighedinto individual glass vials. The other half wasground with a mortar and pestle and five 2-g por-tions were weighed into individual glass vials.
All of these samples were extracted with aceto-nitrile and analyzed using the laboratory HPLCmethod described below. The volume of acetoni-trile/soil weight ratio was 100 mL for 20-gsamples, 40 mL for 7.5-g samples, 10 mL for 2-gsamples, and 3 mL for 0.5-g samples.
Preparation of composite samplesDepth-based composite samples were prepared
from the 0- to 15-cm, 30- to 45-cm, and 105- to 120-cm depths for samples from the four grids in area1-44. For a given depth for each of the four dis-crete samples within a grid, 100-g portions of thesoil from the plastic bag were weighed into an alu-minum pan and the material was mixed, coned,and quartered. A 5-g portion was taken from eachquarter and combined to form a 20-g composite.
For comparison, a discrete 20-g sample wastaken for each of the 16 discrete surface (0- to 15-cm) samples from area 1-44. The 12 compositesand 16 discrete surface samples were extractedwith acetone for 10 minutes and the extracts wereanalyzed using a colorimetric on-site method, asdescribed below.
Collection and analysis of dust samplesThe soils from Fort Ord produced a large
amount of fine dust when they were homogenizedand subsampled. A sample of this airborne dustwas collected on a filter as follows. A pre-weighed0.45-µm Nuclepore filter was placed in a filter cas-sette and a vacuum hose was attached. The soilsample in a plastic bag was shaken vigorously andthe dust was allowed to settle for about 10 sec-onds. Then, the filter cassette was placed in the
mouth of the bag and air was drawn through ituntil the filter became visually darkened (approxi-mately 10 seconds). The filter was removed andreweighed to establish the mass of dust of collected(about 100 mg). The filter was then folded andplaced in a 22-mL scintillation vial and extractedwith acetonitrile as described below for soilsamples. Two samples were tested: one was a com-posite sample from grid A (0- to 15-cm depth)1-44, and the other was a surface composite fromCFB-Valcartier.
Soil sample extraction and HPLC analysis(SW-846 Method 8330)
A 10.0-mL aliquot of acetonitrile was added toeach vial containing a 2.00-g portion of air-driedsoil. In batches of 25, these samples were shakenmanually to disperse the material and then placedin an ultrasonic bath for 18 hours (EPA 1994). Thebath was maintained at room temperature withcooling water throughout. In each sample batch,one was selected to serve as an extraction andanalysis control sample. A separate portion of thissample was spiked with a multi-analyte solutionand processed along with the unfortified samples.On a dry soil basis, the spiked concentration forHMX, RDX, DNB, TNB, NB, TNT, 2-AmDNT, and2,4-DNT was approximately 0.5 mg/kg.
Following sonication, the samples were allowedto settle for at least 15 minutes. A 5.00-mL aliquotwas removed via a glass volumetric pipette andmixed with a 5.00-mL portion of aqueous CaCl2(4 mg/L). The solution was shaken and allowedto stand for at least 15 minutes to allow floccula-tion and settling. A portion of this solution wasthen filtered through a Millex SR filter. The result-ing sample extract was maintained at 4°C in thedark.
All soil extracts were analyzed by RP-HPLC-UVas described in SW846 Method 8330. We did theinitial analysis on an LC-18 column (Supelco) inbatches, using eluent composed of 1:1 methanol/water at a flow rate of 1.5 mL/min. Calibrationstandards and spiked control samples were runwith each batch to ensure that the analysis was incontrol. Chromatograms were individuallyinspected and target analytes identified. Sampleswhere a potential target analyte was detected werereanalyzed on an LC-CN (Supelco) column asspecified in SW846 Method 8330 to confirmanalyte identities. We report quantitative resultsfrom peak height measurements on the LC-CNcolumn because only five analytes were detected
9
(HMX, RDX, TNT, 4-AmDNT, and 2-AmDNT) andmuch better resolution for these target analyteswas obtained on the LC-CN column as comparedto the LC-18.
Extraction time assessment and evaluation ofon-site methods for RDX and HMX
An initial experiment was conducted to deter-mine the effect of various extraction times onrecovery of HMX for soil samples from Fort Ord.Three discrete samples from location 1-44-1 wereselected for this evaluation: one from the 0- to 15-cm depth, one from the 30- to 45-cm depth, andone from the 105- to 120-cm depth. A 20-g portionof each was placed in individual plastic extractionbottles and 100 mL of acetone (3% water) wasadded. The samples were shaken manually for 3minutes, and, after approximately 1 minute of set-tling, we removed a 2-mL aliquot and filtered itthrough a 0.5-µm Millex SR filter. The bottles werethen given an additional 7 minutes of shakingand another 2-mL aliquot was removed ina similar manner. We then shook the bottlesfor an additional 20 minutes, and removed a2-mL aliquot, which was processed as above.Thus, three aliquots representing 3-, 10-, and30-minute shaking periods were collected fromeach soil. These samples were diluted 1:5with reagent grade water and analyzed byRP-HPLC-UV on an LC-CN column as describedabove.
In a second experiment, we selected a set of 11soil samples to assess the usefulness of the twocommercially available on-site RDX methods foranalysis of the soil samples. For each soil selected,a 20-g portion of field-moist soil was placed in aplastic bottle and 100 mL of acetone (3% water)was added. The bottles were shaken periodicallyover 30 minutes and the soil particles were allowedto settle for at least 15 minutes. A 50-mL aliquotwas then withdrawn with a Plastipak syringe andfiltered through a Millex SR filter. The resultingacetone extract was analyzed by three methods:1) RP-HPLC using the LC-CN column, 2) a colori-metric method available from EnSys (now Strate-gic Diagnostics Corp.) (Jenkins and Walsh 1992),and 3) a DTECH enzyme immunoassay methodfrom Strategic Diagnostics.
For HPLC analysis, each acetone extract wasdiluted 1:5 with deionized water prior to injection.This was done to ensure that the solvent strengthof the injected sample was lower than the eluentto maintain adequate peak shape.
RESULTS AND DISCUSSION
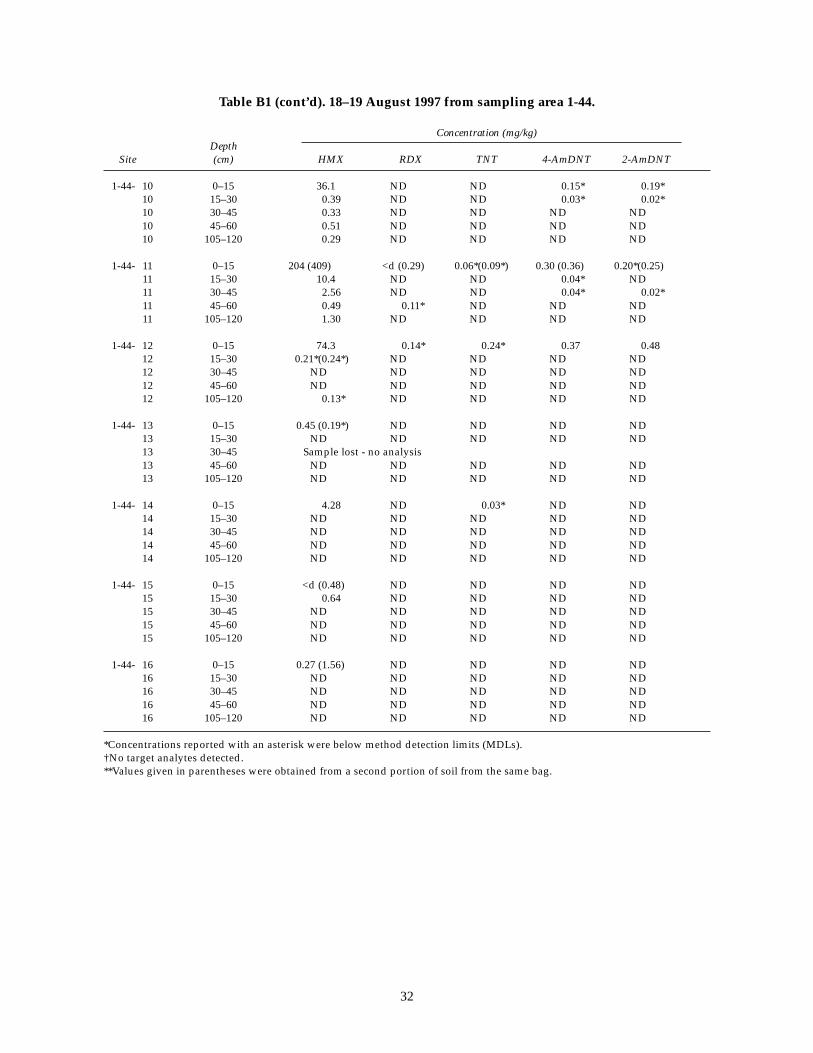
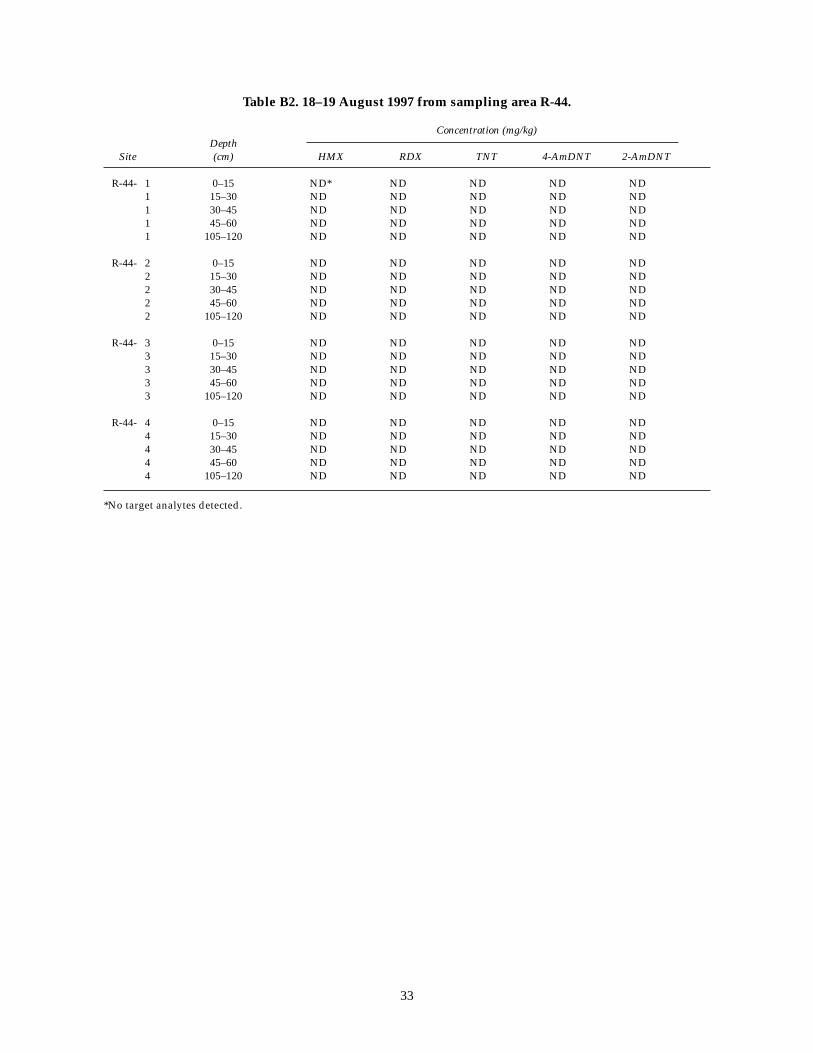
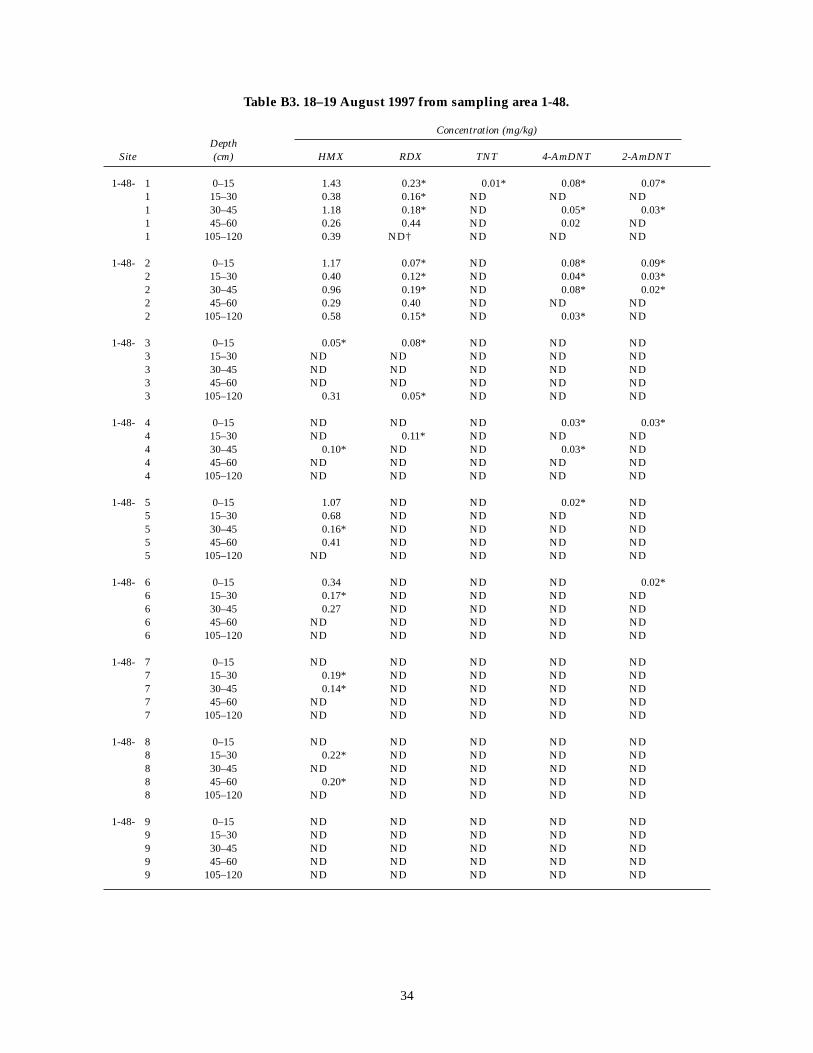
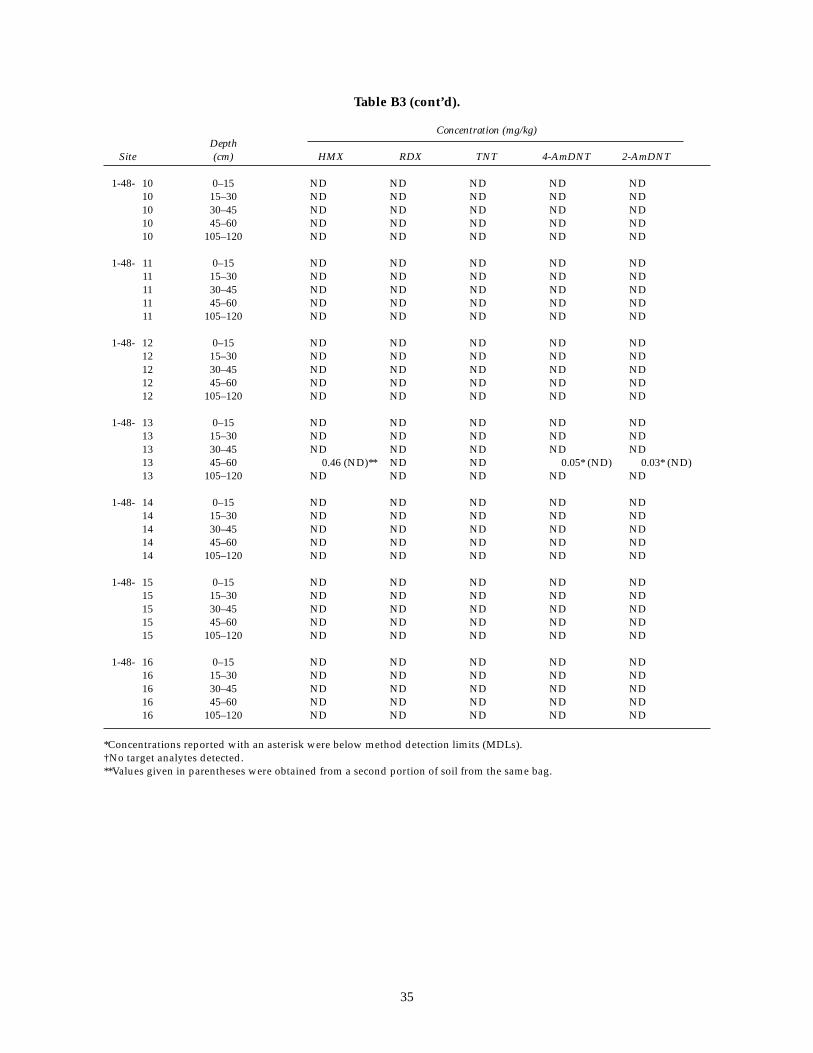
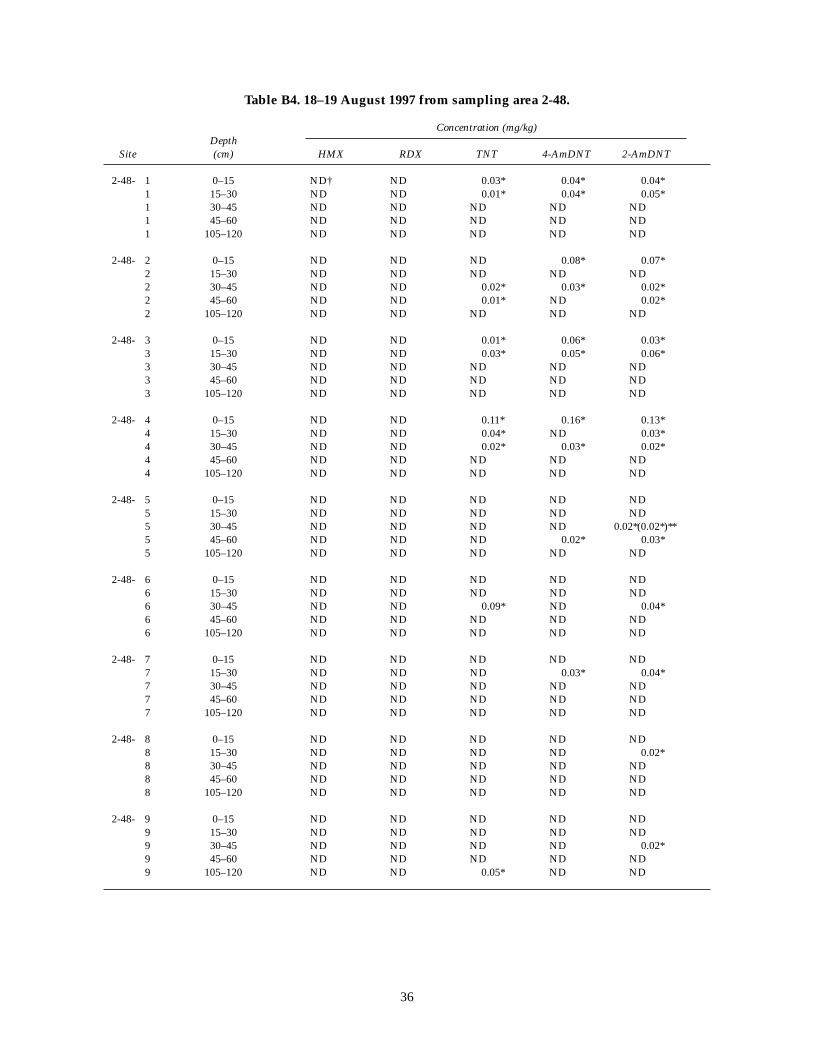
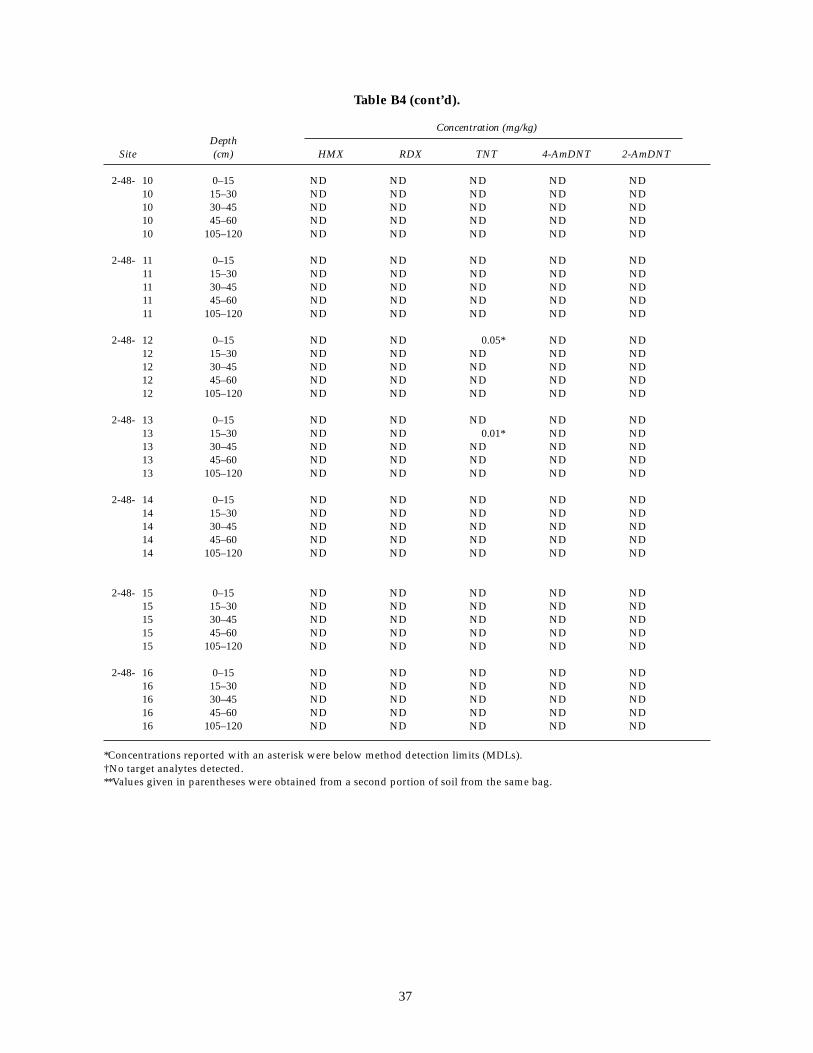
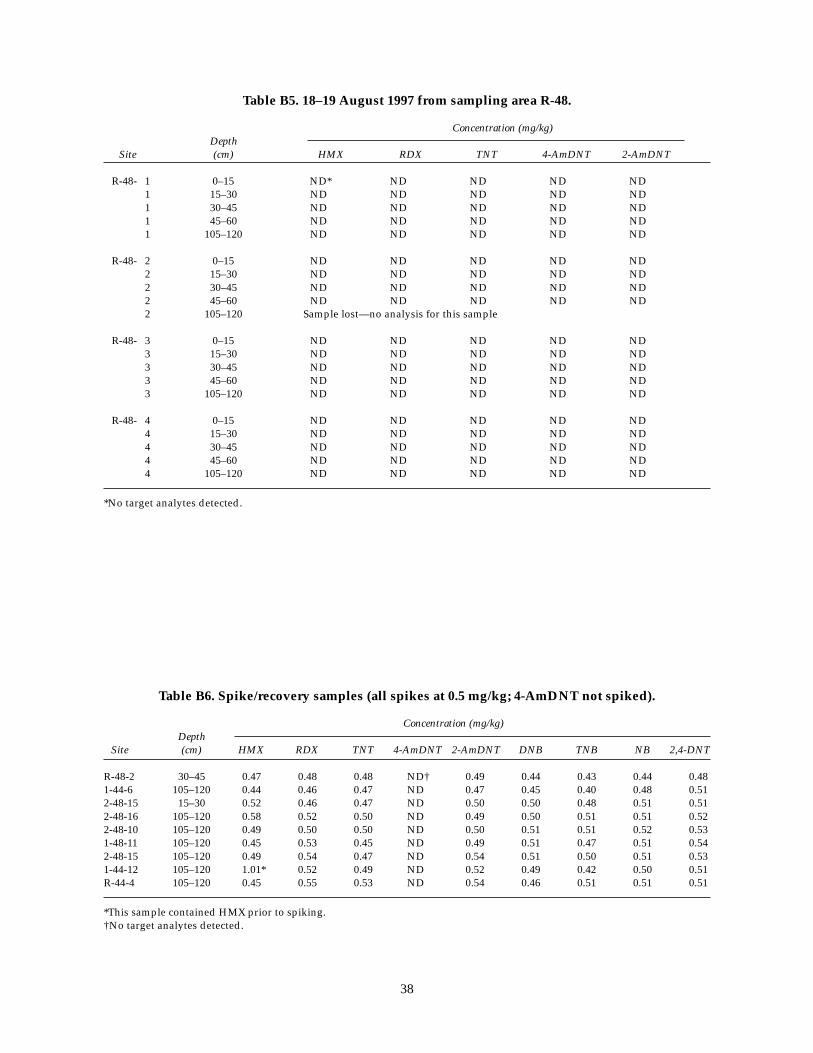
Analytical results for RP-HPLC analysis of allsoil samples are presented in Appendix B. TableB1 provides the results for sampling location 1-44. Likewise, Tables B2–B5 give results for sam-pling locations R–44, 1–48, 2–48, and R–48, respec-tively. Table B6 presents the results for spikedsamples analyzed to assess recovery of targetanalytes.
Overview of explosives detectedin the various sampling areas
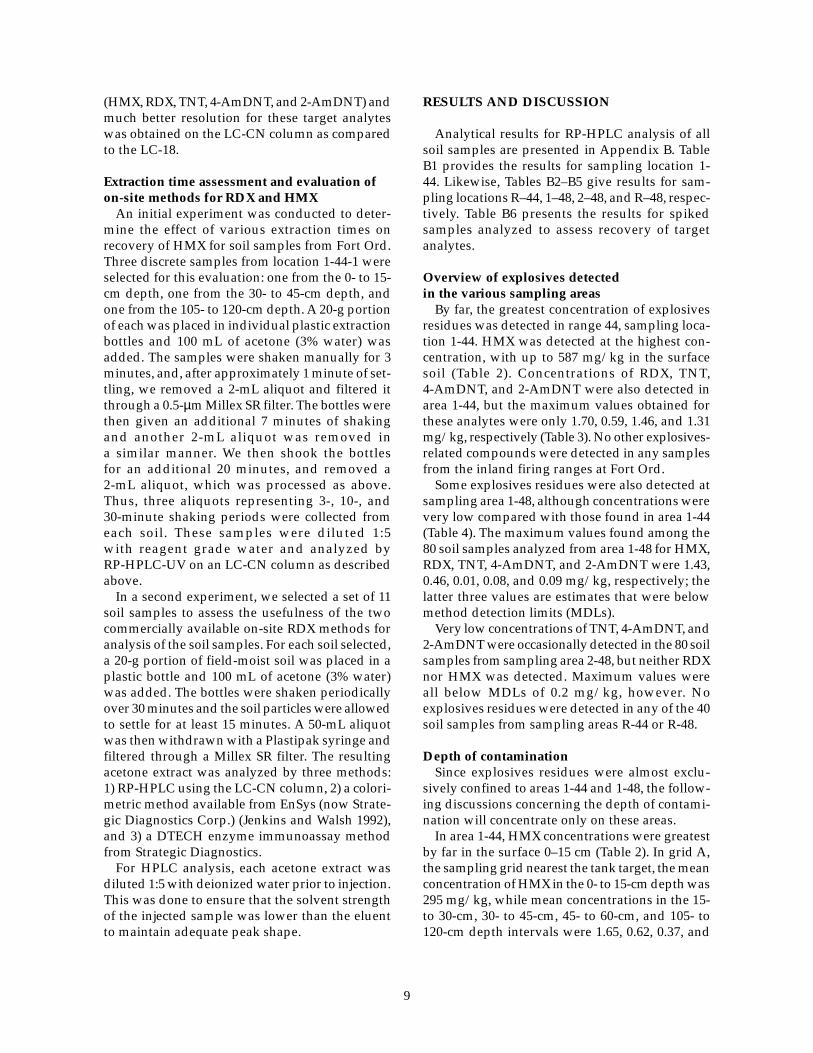
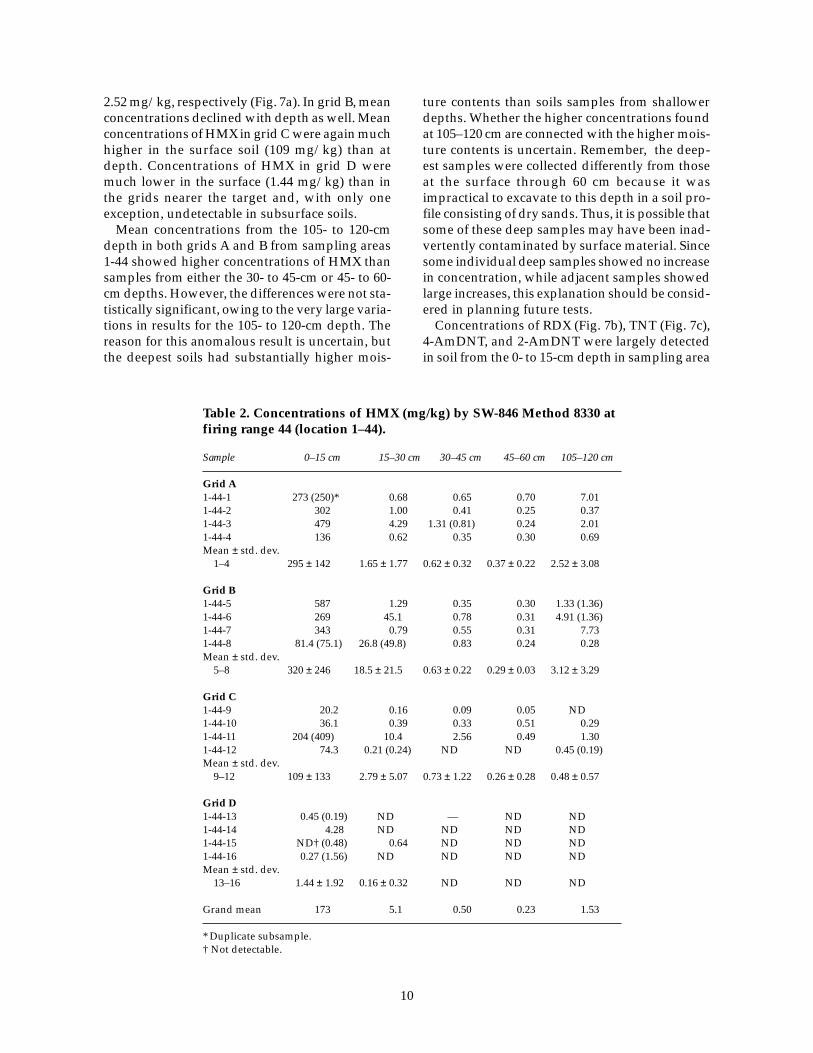
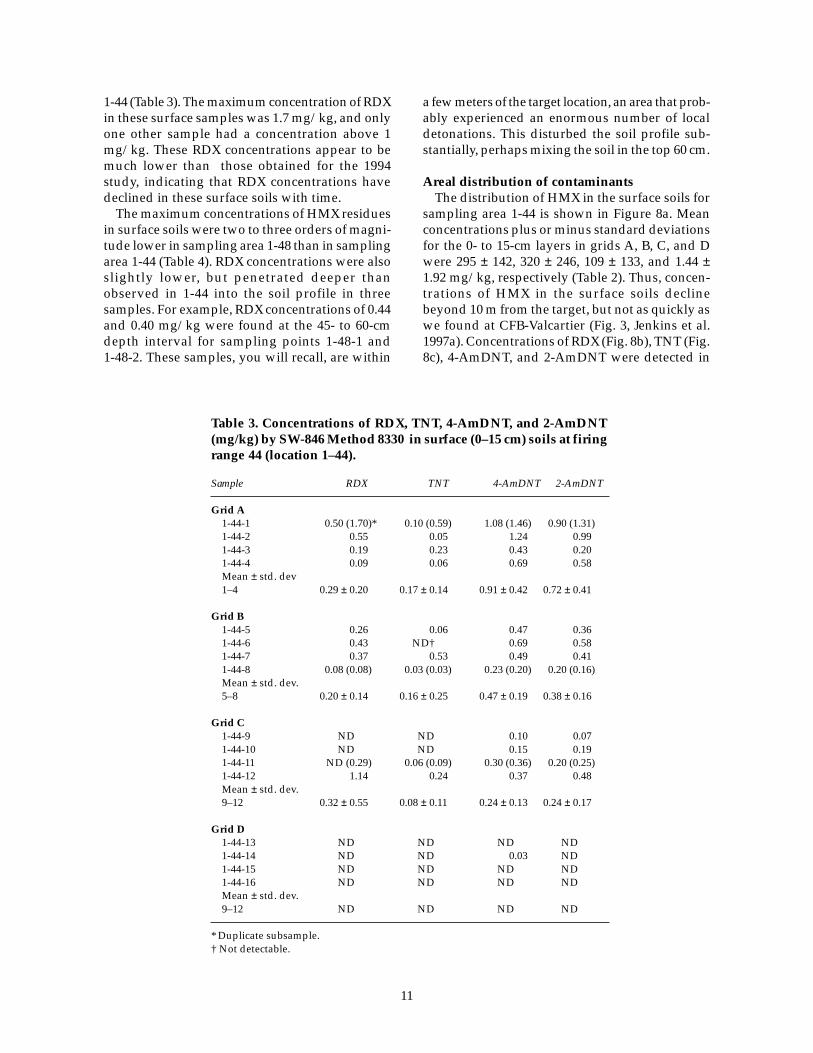
By far, the greatest concentration of explosivesresidues was detected in range 44, sampling loca-tion 1-44. HMX was detected at the highest con-centration, with up to 587 mg/kg in the surfacesoil (Table 2). Concentrations of RDX, TNT,4-AmDNT, and 2-AmDNT were also detected inarea 1-44, but the maximum values obtained forthese analytes were only 1.70, 0.59, 1.46, and 1.31mg/kg, respectively (Table 3). No other explosives-related compounds were detected in any samplesfrom the inland firing ranges at Fort Ord.
Some explosives residues were also detected atsampling area 1-48, although concentrations werevery low compared with those found in area 1-44(Table 4). The maximum values found among the80 soil samples analyzed from area 1-48 for HMX,RDX, TNT, 4-AmDNT, and 2-AmDNT were 1.43,0.46, 0.01, 0.08, and 0.09 mg/kg, respectively; thelatter three values are estimates that were belowmethod detection limits (MDLs).
Very low concentrations of TNT, 4-AmDNT, and2-AmDNT were occasionally detected in the 80 soilsamples from sampling area 2-48, but neither RDXnor HMX was detected. Maximum values wereall below MDLs of 0.2 mg/kg, however. Noexplosives residues were detected in any of the 40soil samples from sampling areas R-44 or R-48.
Depth of contaminationSince explosives residues were almost exclu-
sively confined to areas 1-44 and 1-48, the follow-ing discussions concerning the depth of contami-nation will concentrate only on these areas.
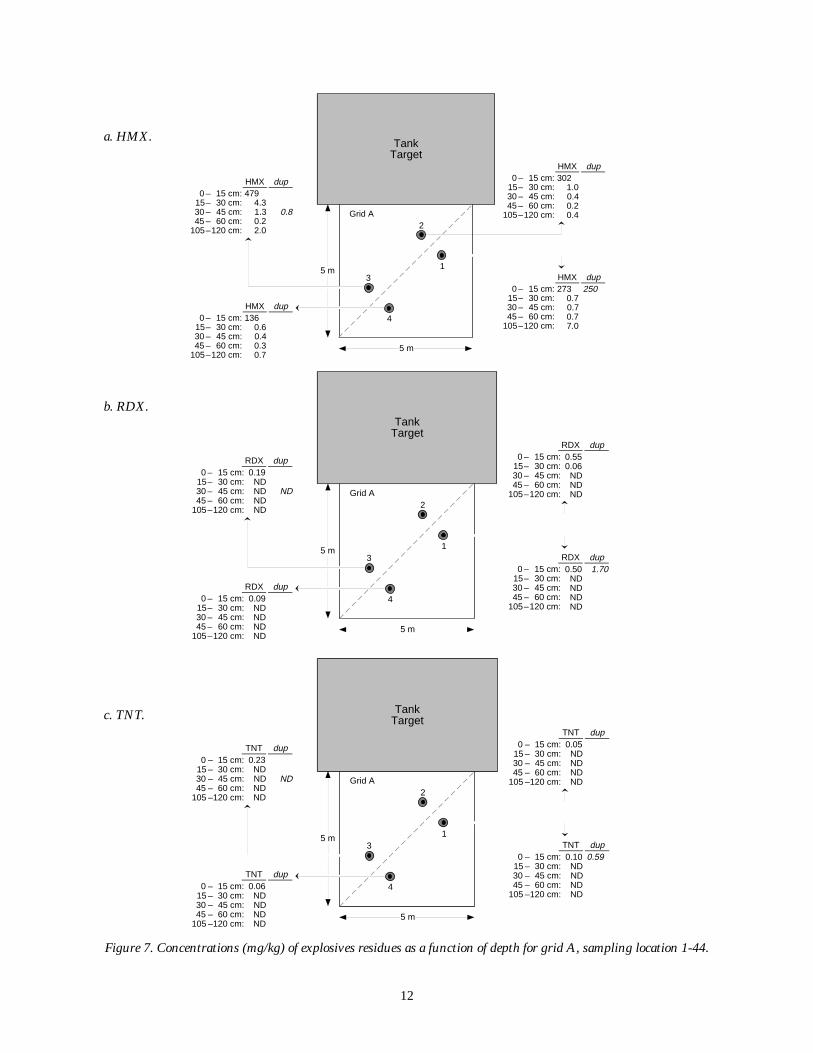
In area 1-44, HMX concentrations were greatestby far in the surface 0–15 cm (Table 2). In grid A,the sampling grid nearest the tank target, the meanconcentration of HMX in the 0- to 15-cm depth was295 mg/kg, while mean concentrations in the 15-to 30-cm, 30- to 45-cm, 45- to 60-cm, and 105- to120-cm depth intervals were 1.65, 0.62, 0.37, and
10
2.52 mg/kg, respectively (Fig. 7a). In grid B, meanconcentrations declined with depth as well. Meanconcentrations of HMX in grid C were again muchhigher in the surface soil (109 mg/kg) than atdepth. Concentrations of HMX in grid D weremuch lower in the surface (1.44 mg/kg) than inthe grids nearer the target and, with only oneexception, undetectable in subsurface soils.
Mean concentrations from the 105- to 120-cmdepth in both grids A and B from sampling areas1-44 showed higher concentrations of HMX thansamples from either the 30- to 45-cm or 45- to 60-cm depths. However, the differences were not sta-tistically significant, owing to the very large varia-tions in results for the 105- to 120-cm depth. Thereason for this anomalous result is uncertain, butthe deepest soils had substantially higher mois-
ture contents than soils samples from shallowerdepths. Whether the higher concentrations foundat 105–120 cm are connected with the higher mois-ture contents is uncertain. Remember, the deep-est samples were collected differently from thoseat the surface through 60 cm because it wasimpractical to excavate to this depth in a soil pro-file consisting of dry sands. Thus, it is possible thatsome of these deep samples may have been inad-vertently contaminated by surface material. Sincesome individual deep samples showed no increasein concentration, while adjacent samples showedlarge increases, this explanation should be consid-ered in planning future tests.
Concentrations of RDX (Fig. 7b), TNT (Fig. 7c),4-AmDNT, and 2-AmDNT were largely detectedin soil from the 0- to 15-cm depth in sampling area
Table 2. Concentrations of HMX (mg/kg) by SW-846 Method 8330 atfiring range 44 (location 1–44).
Sample 0–15 cm 15–30 cm 30–45 cm 45–60 cm 105–120 cm
1-44 (Table 3). The maximum concentration of RDXin these surface samples was 1.7 mg/kg, and onlyone other sample had a concentration above 1mg/kg. These RDX concentrations appear to bemuch lower than those obtained for the 1994study, indicating that RDX concentrations havedeclined in these surface soils with time.
The maximum concentrations of HMX residuesin surface soils were two to three orders of magni-tude lower in sampling area 1-48 than in samplingarea 1-44 (Table 4). RDX concentrations were alsoslightly lower, but penetrated deeper thanobserved in 1-44 into the soil profile in threesamples. For example, RDX concentrations of 0.44and 0.40 mg/kg were found at the 45- to 60-cmdepth interval for sampling points 1-48-1 and1-48-2. These samples, you will recall, are within
a few meters of the target location, an area that prob-ably experienced an enormous number of localdetonations. This disturbed the soil profile sub-stantially, perhaps mixing the soil in the top 60 cm.
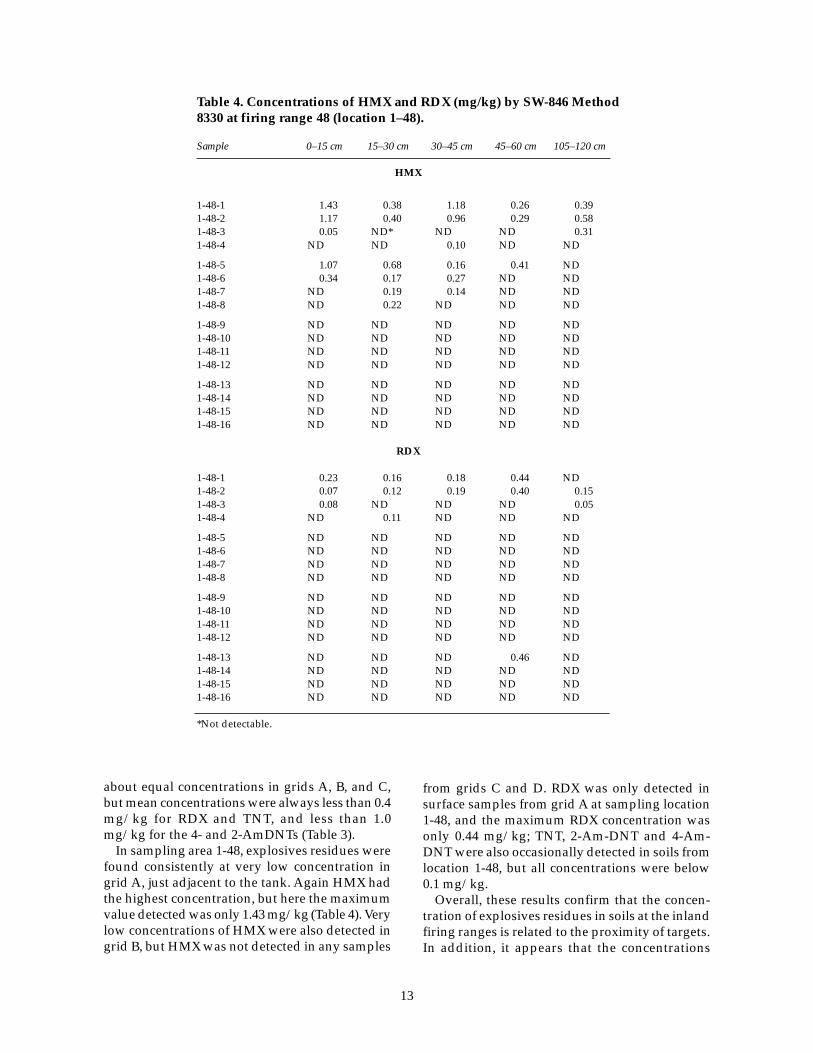
Areal distribution of contaminantsThe distribution of HMX in the surface soils for
sampling area 1-44 is shown in Figure 8a. Meanconcentrations plus or minus standard deviationsfor the 0- to 15-cm layers in grids A, B, C, and Dwere 295 ± 142, 320 ± 246, 109 ± 133, and 1.44 ±1.92 mg/kg, respectively (Table 2). Thus, concen-trations of HMX in the surface soils declinebeyond 10 m from the target, but not as quickly aswe found at CFB-Valcartier (Fig. 3, Jenkins et al.1997a). Concentrations of RDX (Fig. 8b), TNT (Fig.8c), 4-AmDNT, and 2-AmDNT were detected in
Table 3. Concentrations of RDX, TNT, 4-AmDNT, and 2-AmDNT(mg/kg) by SW-846 Method 8330 in surface (0–15 cm) soils at firingrange 44 (location 1–44).
Figure 7. Concentrations (mg/kg) of explosives residues as a function of depth for grid A, sampling location 1-44.
b. RDX.
a. HMX.
c. TNT.
13
about equal concentrations in grids A, B, and C,but mean concentrations were always less than 0.4mg/kg for RDX and TNT, and less than 1.0mg/kg for the 4- and 2-AmDNTs (Table 3).
In sampling area 1-48, explosives residues werefound consistently at very low concentration ingrid A, just adjacent to the tank. Again HMX hadthe highest concentration, but here the maximumvalue detected was only 1.43 mg/kg (Table 4). Verylow concentrations of HMX were also detected ingrid B, but HMX was not detected in any samples
from grids C and D. RDX was only detected insurface samples from grid A at sampling location1-48, and the maximum RDX concentration wasonly 0.44 mg/kg; TNT, 2-Am-DNT and 4-Am-DNT were also occasionally detected in soils fromlocation 1-48, but all concentrations were below0.1 mg/kg.
Overall, these results confirm that the concen-tration of explosives residues in soils at the inlandfiring ranges is related to the proximity of targets.In addition, it appears that the concentrations
Table 4. Concentrations of HMX and RDX (mg/kg) by SW-846 Method8330 at firing range 48 (location 1–48).
Sample 0–15 cm 15–30 cm 30–45 cm 45–60 cm 105–120 cm
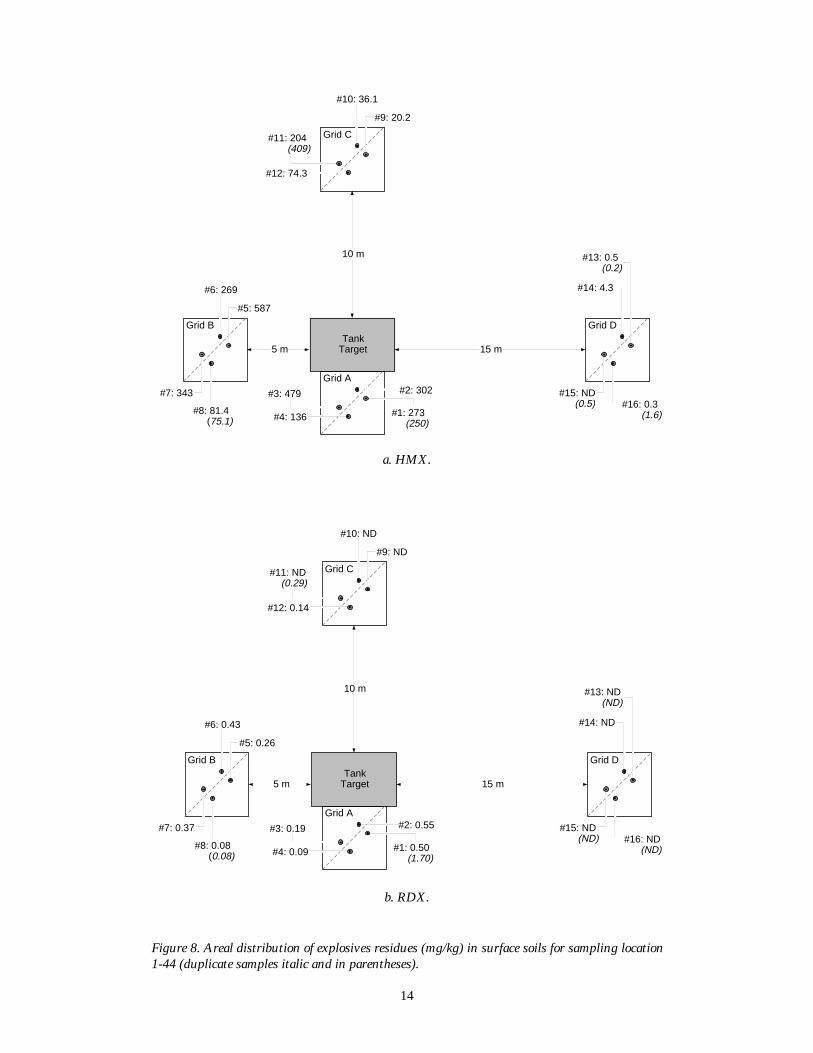
Figure 8. Areal distribution of explosives residues (mg/kg) in surface soils for sampling location1-44 (duplicate samples italic and in parentheses).
b. RDX.
a. HMX.
15
found for various areas were related to the amountof munitions debris and the apparent length oftime since the area was used.
Spatial heterogeneityIn this discussion, we consider spatial hetero-
geneity on four levels (long range, mid-range,short range, and very short range). These discus-sions will be based on concentration differencesobtained using RP-HPLC Method 8330. The dif-ferences we will be discussing are true differencesamong subsamples analyzed, and are not causedby imprecision or inaccuracy from analyticaldeterminations, i.e., analysis of the extracts. Theanalytical precision for Method 8330 in our labo-ratory has been documented many times and rela-tive standard deviations (RSDs) range from 2 to3% (Jenkins and Walsh 1987). An assessment acrossa number of different laboratories demonstratedthat RSDs for Method 8330 were always lessthan 5% (Bauer et al. 1989, 1990). Triplicate deter-minations on the extract from sample 1-44-8yielded an RSD of 1.9% for HMX determination.Accuracy was assessed using spiked samples andthe results are presented in Table B6. For HMX,recoveries ranged from 88 to 116%, with a meanof 97%. Even better recoveries were obtained forRDX, where the mean was 101% with a range from92 to 110%. Note that each of the nine recovery
estimates was obtained from different samplesanalyzed in different batches and at differenttimes.
First to be assessed is the long-range spatial het-erogeneity by comparing concentration differencesamong samples from different grids. The previ-ous section described a large systematic effect ofdecreasing contaminant concentrations as distancefrom the targets increased (Table 2). This pattern,which is to be expected, has implications for anycomprehensive sampling plan.
The mid-range spatial heterogeneity is assessedfrom differences among the four-point samples ata given depth from within a grid. Short-range vari-ability is estimated from differences between pairsof samples that are separated by 1.0 m. For illus-tration, the HMX results for grid A, area 1-44, areused here to estimate mid- and short-range vari-ability. These data appear typical for the site andthey are convenient to use because all resultsexceed detection limits. The RSDs for the foursamples at each of five depths range from 48.1 to122%, with a pooled RSD of 83.5%.
This estimate for mid-scale heterogeneityincludes the spatial effects of samples where pairsare 2.4 m apart and the two samples of a pair are1.0 m apart (Fig. 8a). With RSDs near 100%, itseems that the HMX distribution is unlikely to beGaussian (normal).
TankTarget
10 m
15 m5 m
Grid B
#5: 0.06
#6: 1.13
#7: 0.53
#8: 0.03
Grid C
#9: ND
#10: ND
#11: 0.06 (0.09)
#12: 0.24
Grid A
#3: 0.23
#4: 0.06 #1: 0.10 (0.59)
#2: 0.05
Grid D
#13: ND (ND)
#15: ND (ND) #16: ND
(ND)
#14: 0.03
c. TNT.
Figure 8 (cont’d).
16
Short-range heterogeneity is estimated using theRSDs from the 10 pairs (two pairs at each depth)separated by 1.0 m. These RSDs range from 7.3 to127%, with a pooled RSD of 71.8%. Although weexpect RSDs to increase as concentrations decrease(Horowitz 1982), that pattern is not apparent forthese samples. What is clear is that close-lyingsamples can produce widely disparate results, andour ability to estimate mean concentration for agrid using a single discrete sample is very poor.While the concentrations of RDX, TNT, 4-AmDNT,and 2-AmDNT are quite low relative to HMX atsampling location 1-44, the magnitude of the stan-dard deviations are similar to their means, andhence our ability to estimate mean concentrationsfrom a single discrete sample for these compoundsis also very poor (Table 3).
In sampling area 1-48, there are an insufficientnumber of cases where measured values wereabove MDLs to obtain good estimates of standarddeviations (Table 4). Even so, inspection of the datatells us that HMX and RDX concentrations for thefour discrete samples at the same depth for a givengrid are so disparate, that, here again, it would beimpossible to obtain good estimates of mean con-centrations from analysis of single discretesamples.
Finally, the very-short-range heterogeneity isexamined using the 12 sets of duplicate samplesfrom location 1-44, coupled with the results from
the sample size study. Here, we are looking at ourability to obtain replicate analytical-sizesubsamples from a carefully homogenized bulksample. Each subsample goes through the entireextraction and HPLC analysis procedure. TheRSDs for HMX for the 12 duplicates ranged from1.6 to 99.7%, with a pooled RSD of 55.4%. In thiscase, RSDs do appear to vary with concentration,although the pattern is not completely consistent.For samples with concentrations above 10 mg/kg,the pooled RSD is 32%, compared to 74% forsamples with concentrations below 10 mg/kg.Over all, these RSDs are considerably larger thanthose we have observed for similarly processedsamples at other explosives sites, which rangedfrom 4.5 to 13.5% (Jenkins et al. 1996).
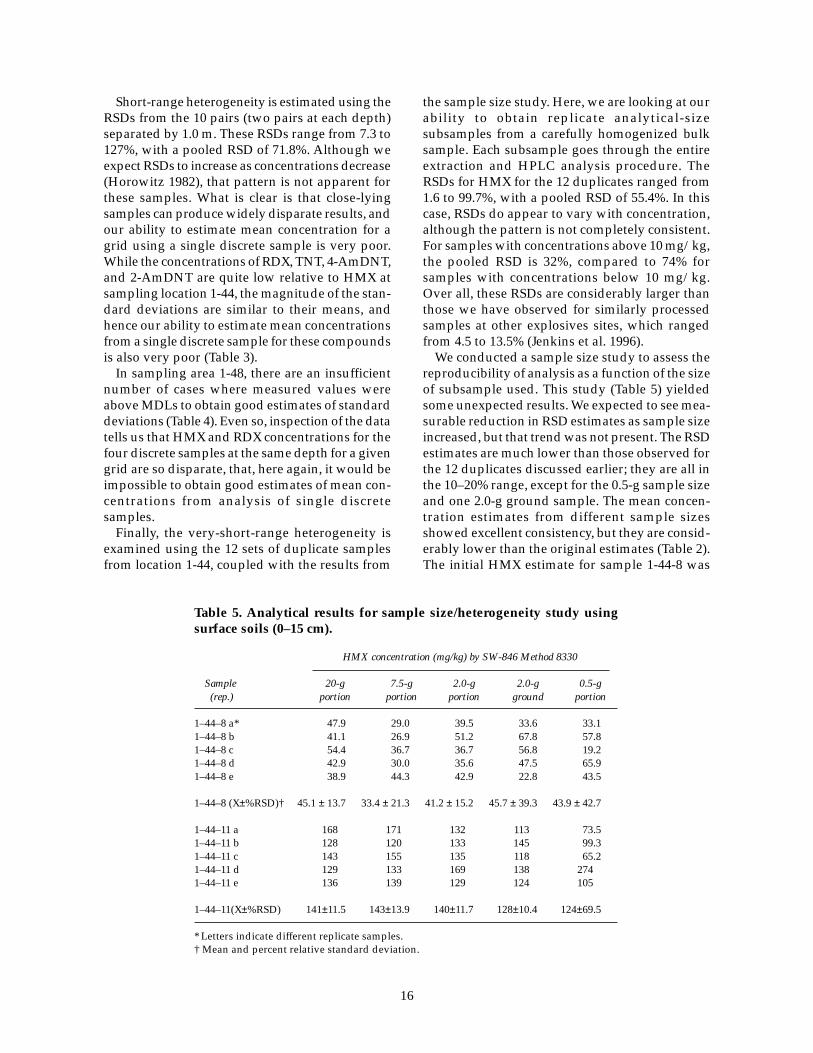
We conducted a sample size study to assess thereproducibility of analysis as a function of the sizeof subsample used. This study (Table 5) yieldedsome unexpected results. We expected to see mea-surable reduction in RSD estimates as sample sizeincreased, but that trend was not present. The RSDestimates are much lower than those observed forthe 12 duplicates discussed earlier; they are all inthe 10–20% range, except for the 0.5-g sample sizeand one 2.0-g ground sample. The mean concen-tration estimates from different sample sizesshowed excellent consistency, but they are consid-erably lower than the original estimates (Table 2).The initial HMX estimate for sample 1-44-8 was
Table 5. Analytical results for sample size/heterogeneity study usingsurface soils (0–15 cm).
* Letters indicate different replicate samples.† Mean and percent relative standard deviation.
17
78.3 mg/kg (mean of duplicates), while the latersample size study gave a mean estimate of 41.8mg/kg. A similar comparison for sample 1-44-11yields 307 vs. 135 mg/kg.
Below, we suggest possible explanations forthese inconsistencies. First, the RSDs from thesample size study might be expected to fall on thelow side because the two samples used have mid-range concentrations where reproducibility shouldbe optimal. Further, all the subsampling and analy-sis for this study were done over a short time, i.e.,all five replicates were removed at one time. Thisinvariably improves reproducibility, often greatly.With respect to decreases in concentration esti-mates, we acknowledge that there is a wide rangein both the original values and the sample sizestudy values. Referring to Table 5 and excludingthe 0.5-g samples, we note that the other 20 analy-ses for sample 1-44-8 range from 113 to 171mg/kg, compared with values of 204 and 409mg/kg for the original analyses. The probabilityof both of the original analyses being substantiallyhigher than any of the 20 later analyses is unlikelyto be explained as a random occurrence. Further-more, exactly the same pattern holds true forsample 1-44-11. In addition, data to be presentedlater in this report (see Table 9) show this samepattern for four additional samples. Consequently,we feel confident that a real concentration decreasehas been demonstrated for the later analyses.
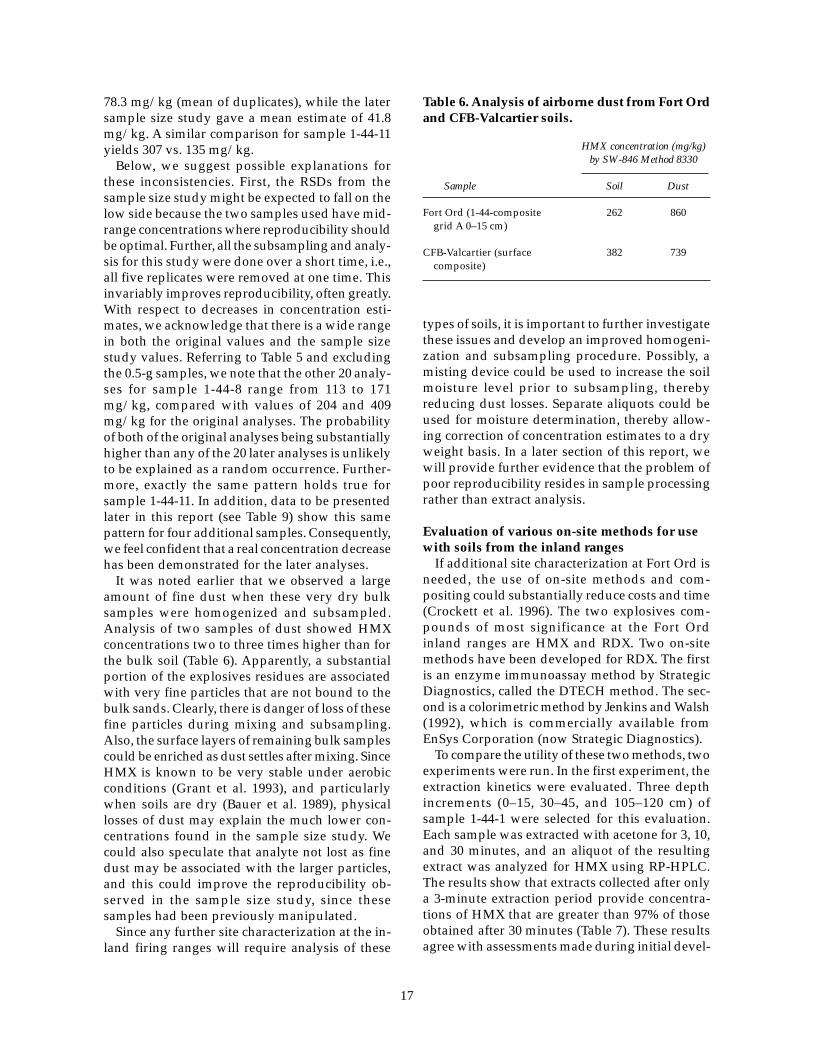
It was noted earlier that we observed a largeamount of fine dust when these very dry bulksamples were homogenized and subsampled.Analysis of two samples of dust showed HMXconcentrations two to three times higher than forthe bulk soil (Table 6). Apparently, a substantialportion of the explosives residues are associatedwith very fine particles that are not bound to thebulk sands. Clearly, there is danger of loss of thesefine particles during mixing and subsampling.Also, the surface layers of remaining bulk samplescould be enriched as dust settles after mixing. SinceHMX is known to be very stable under aerobicconditions (Grant et al. 1993), and particularlywhen soils are dry (Bauer et al. 1989), physicallosses of dust may explain the much lower con-centrations found in the sample size study. Wecould also speculate that analyte not lost as finedust may be associated with the larger particles,and this could improve the reproducibility ob-served in the sample size study, since thesesamples had been previously manipulated.
Since any further site characterization at the in-land firing ranges will require analysis of these
types of soils, it is important to further investigatethese issues and develop an improved homogeni-zation and subsampling procedure. Possibly, amisting device could be used to increase the soilmoisture level prior to subsampling, therebyreducing dust losses. Separate aliquots could beused for moisture determination, thereby allow-ing correction of concentration estimates to a dryweight basis. In a later section of this report, wewill provide further evidence that the problem ofpoor reproducibility resides in sample processingrather than extract analysis.
Evaluation of various on-site methods for usewith soils from the inland ranges
If additional site characterization at Fort Ord isneeded, the use of on-site methods and com-positing could substantially reduce costs and time(Crockett et al. 1996). The two explosives com-pounds of most significance at the Fort Ordinland ranges are HMX and RDX. Two on-sitemethods have been developed for RDX. The firstis an enzyme immunoassay method by StrategicDiagnostics, called the DTECH method. The sec-ond is a colorimetric method by Jenkins and Walsh(1992), which is commercially available fromEnSys Corporation (now Strategic Diagnostics).
To compare the utility of these two methods, twoexperiments were run. In the first experiment, theextraction kinetics were evaluated. Three depthincrements (0–15, 30–45, and 105–120 cm) ofsample 1-44-1 were selected for this evaluation.Each sample was extracted with acetone for 3, 10,and 30 minutes, and an aliquot of the resultingextract was analyzed for HMX using RP-HPLC.The results show that extracts collected after onlya 3-minute extraction period provide concentra-tions of HMX that are greater than 97% of thoseobtained after 30 minutes (Table 7). These resultsagree with assessments made during initial devel-
Table 6. Analysis of airborne dust from Fort Ordand CFB-Valcartier soils.
HMX concentration (mg/kg)by SW-846 Method 8330
Sample Soil Dust
Fort Ord (1-44-composite 262 860grid A 0–15 cm)
CFB-Valcartier (surface 382 739composite)
18
opment of this method (Jenkins and Walsh 1992).The fast extraction kinetics with acetone for soilsfrom the inland ranges will make the use of on-sitemethods for site characterization very convenient,and analytical turn-around times will be short.
In a second experiment, a set of 11 soil sampleswas selected on the basis of results from analysisby SW846 Method 8330. We selected these samplesto encompass a range of HMX concentrations. A20-g portion of each soil was extracted withacetone by manually shaking periodically over 30minutes. Aliquots of each acetone extract wereanalyzed by three methods: 1) HPLC using theconfirmation separation of Method 8330, 2)DTECH’s on-site enzyme immunoassay method,and 3) the on-site colorimetric method. Becauseour research at CFB-Valcartier demonstrated thatthe colorimetric method would respond to bothHMX and RDX (Jenkins et al. 1997a), and because
the concentrations of HMX predominated in thesesoils, the colorimetric method was calibrated witha solution containing a known concentration ofHMX.
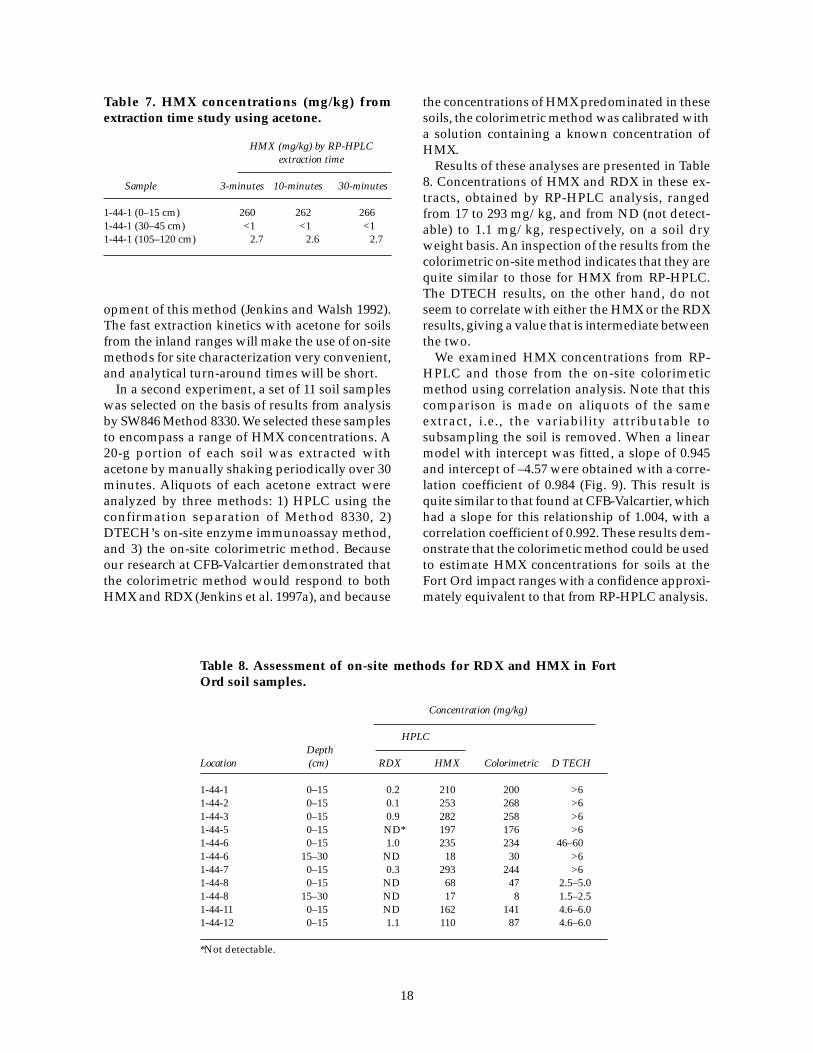
Results of these analyses are presented in Table8. Concentrations of HMX and RDX in these ex-tracts, obtained by RP-HPLC analysis, rangedfrom 17 to 293 mg/kg, and from ND (not detect-able) to 1.1 mg/kg, respectively, on a soil dryweight basis. An inspection of the results from thecolorimetric on-site method indicates that they arequite similar to those for HMX from RP-HPLC.The DTECH results, on the other hand, do notseem to correlate with either the HMX or the RDXresults, giving a value that is intermediate betweenthe two.
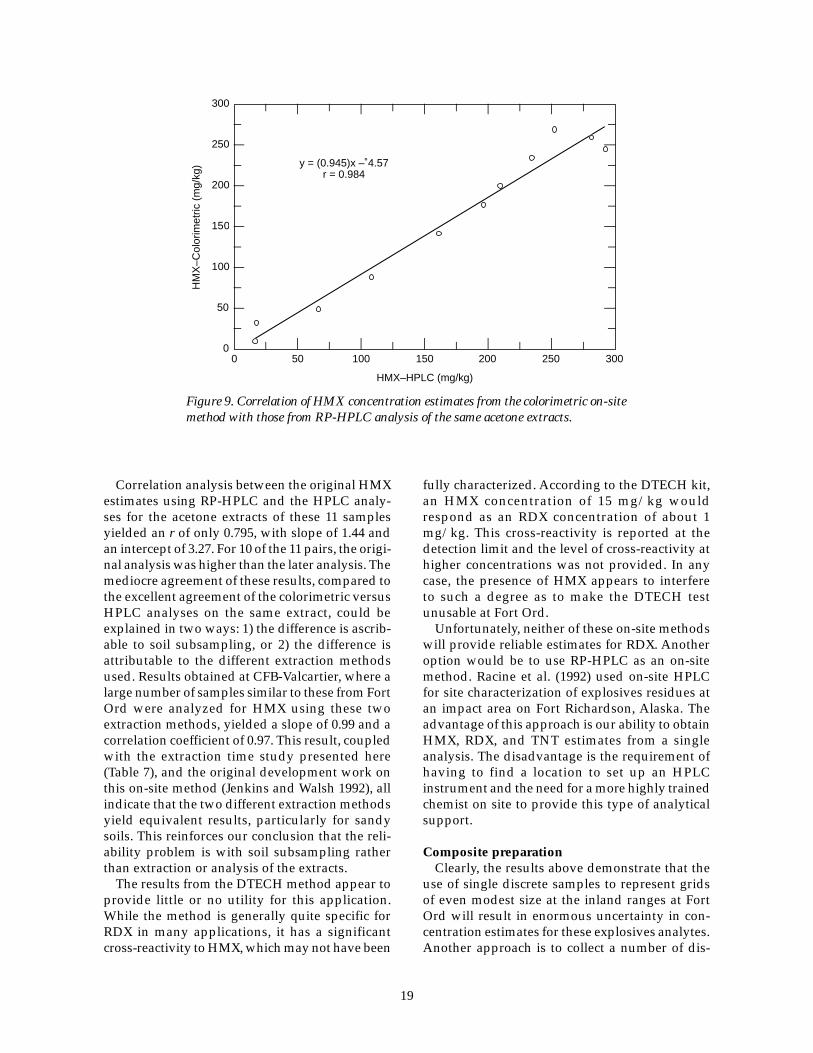
We examined HMX concentrations from RP-HPLC and those from the on-site colorimeticmethod using correlation analysis. Note that thiscomparison is made on aliquots of the sameextract, i.e., the variability attributable tosubsampling the soil is removed. When a linearmodel with intercept was fitted, a slope of 0.945and intercept of –4.57 were obtained with a corre-lation coefficient of 0.984 (Fig. 9). This result isquite similar to that found at CFB-Valcartier, whichhad a slope for this relationship of 1.004, with acorrelation coefficient of 0.992. These results dem-onstrate that the colorimetic method could be usedto estimate HMX concentrations for soils at theFort Ord impact ranges with a confidence approxi-mately equivalent to that from RP-HPLC analysis.
Table 7. HMX concentrations (mg/kg) fromextraction time study using acetone.
Correlation analysis between the original HMXestimates using RP-HPLC and the HPLC analy-ses for the acetone extracts of these 11 samplesyielded an r of only 0.795, with slope of 1.44 andan intercept of 3.27. For 10 of the 11 pairs, the origi-nal analysis was higher than the later analysis. Themediocre agreement of these results, compared tothe excellent agreement of the colorimetric versusHPLC analyses on the same extract, could beexplained in two ways: 1) the difference is ascrib-able to soil subsampling, or 2) the difference isattributable to the different extraction methodsused. Results obtained at CFB-Valcartier, where alarge number of samples similar to these from FortOrd were analyzed for HMX using these twoextraction methods, yielded a slope of 0.99 and acorrelation coefficient of 0.97. This result, coupledwith the extraction time study presented here(Table 7), and the original development work onthis on-site method (Jenkins and Walsh 1992), allindicate that the two different extraction methodsyield equivalent results, particularly for sandysoils. This reinforces our conclusion that the reli-ability problem is with soil subsampling ratherthan extraction or analysis of the extracts.
The results from the DTECH method appear toprovide little or no utility for this application.While the method is generally quite specific forRDX in many applications, it has a significantcross-reactivity to HMX, which may not have been
fully characterized. According to the DTECH kit,an HMX concentration of 15 mg/kg wouldrespond as an RDX concentration of about 1mg/kg. This cross-reactivity is reported at thedetection limit and the level of cross-reactivity athigher concentrations was not provided. In anycase, the presence of HMX appears to interfereto such a degree as to make the DTECH testunusable at Fort Ord.
Unfortunately, neither of these on-site methodswill provide reliable estimates for RDX. Anotheroption would be to use RP-HPLC as an on-sitemethod. Racine et al. (1992) used on-site HPLCfor site characterization of explosives residues atan impact area on Fort Richardson, Alaska. Theadvantage of this approach is our ability to obtainHMX, RDX, and TNT estimates from a singleanalysis. The disadvantage is the requirement ofhaving to find a location to set up an HPLCinstrument and the need for a more highly trainedchemist on site to provide this type of analyticalsupport.
Composite preparationClearly, the results above demonstrate that the
use of single discrete samples to represent gridsof even modest size at the inland ranges at FortOrd will result in enormous uncertainty in con-centration estimates for these explosives analytes.Another approach is to collect a number of dis-
50 100 150 200 250 3000
HM
X–C
olor
imet
ric (
mg/
kg)
HMX–HPLC (mg/kg)
300
250
200
150
100
50
0
y = (0.945)x – 4.57r = 0.984
Figure 9. Correlation of HMX concentration estimates from the colorimetric on-sitemethod with those from RP-HPLC analysis of the same acetone extracts.
crete samples to represent a grid, and either ana-lyze each separately, or produce a compositesample. The composite sample is a physical aver-age of the discrete samples and it can be analyzedinstead, with replication when needed. Analysisof a large number of discrete samples is quiteattractive scientifically, but it is impracticallyexpensive using currently available methods. Theuse of composites is attractive from a financialpoint of view, but it must be shown that compos-ites can be prepared using simple, fieldable pro-cedures, and that the resulting composites are rep-resentative of the discrete samples from whichthey were prepared.
Research conducted at a number of explosives-contaminated sites has demonstrated that a simplemethod quite successfully produces compositesthat are in good agreement with the meanvalues of the discrete samples making them up(Jenkins et al. 1996, 1997a). To ensure that this isalso true for the soils at the inland ranges at FortOrd, an experiment was conducted using the dis-crete samples from area 1-44. Composites wereprepared for three depth intervals from the fourgrids in this sampling area. The results fromextraction and colorimetric analysis of these com-posites are presented in Table 9. In all cases, theresults for HMX in these composite samples arewithin the range produced by the mean plus orminus a standard deviation for the discrete
samples using data from Method 8330. In addi-tion, the HMX results for the four composites fromthe 0- to 15-cm depth are also in good agreementwith the mean of the discrete samples analyzedusing the on-site colorimetric method. Develop-ment of improved procedures for dealing withdust losses will likely further improve the agree-ment.
Overall, the results from this experiment verifyour earlier conclusions (Jenkins et al. 1996, 1997a)that it is feasible and inexpensive to produce com-posite samples on-site using simple procedures,and that the resulting composites are a good wayto estimate mean explosives concentrations withingrid-sized areas. When the objective is to obtainan unbiased estimate of the mean concentrationwithin a grid, it may be appropriate to collectsamples randomly, in so far as that is possible inthe presence of UXO.
SUMMARY AND CONCLUSIONS
A set of 280 soils samples was collected fromdepths ranging from 0–15 cm to 105–120 cm at in-land firing ranges 44 and 48 at Fort Ord in August1997. Analysis of these samples showed that HMXwas the explosives residue that was present inhighest concentration at these ranges. Concentra-tions as high as 587 mg/kg were measured in sur-
Table 9. Results for assessment of composite preparation method.
HMX concentration (mg/kg)
Discrete sample Discrete sample Compositemean from mean using sample using
face soils (0–15 cm) in a heavily blasted area inrange 44. An enormous amount of debris from useof LAW rockets was found at this location, and itis the LAW rocket that is the source of these HMXresidues. This is attributable, at least in part, tothe high percentage of these rockets that do notdetonate on impact, sometimes spilling the explo-sives on the soil surface.* It is not possible to as-sess whether HMX concentrations have declinedsubstantially in these soils since the 1994 study,because there were so few samples analyzed at thislocation, and the exact locations of the samplingpoints are not known. Concentrations of HMX insubsurface soils were much lower than in the sur-face, but in a few locations, concentrations above10 mg/kg were measured in soil at the 15- to 30-cm depth. In fact, at several sampling locations inthe grid next to the target, concentrations above 5mg/kg were observed in soil from the 105- to 120-cm depth. It is uncertain whether the HMX at thisdepth had leached in aqueous solution in down-ward percolating water, or had migrated throughthis coarse-grained soil as very fine particles. It ispossible that the soils had been physically dis-turbed to this depth by the tremendous numberof large explosions that took place over manyyears. It is also possible that, in the process ofobtaining these deep samples, they were contami-nated by surface soils with a high HMX concen-tration.
Concentrations of RDX in the inland ranges arebarely detectable in most locations. The detectablelevels are largely confined to the surface 0–15 cmat range 44. Concentrations only exceeded the 0.5-mg/kg action level at the most heavily impactedarea in range 44, and there only in the grid locatedwithin 5 m of the target. Concentrations of RDXhave clearly declined in these surface soils sincethe 1994 study. Natural attenuation of RDX in thesurface soils will undoubtedly continue, and, evenif no remedial actions are taken, RDX will be un-detectable in surface soils within several years. Ourexperience tells us that RDX neither biodegradesnor degrades chemically under aerobic conditions(Grant et al. 1995). Thus, it is likely that the RDXhas migrated with downward percolating waterto deep into the soil profile. Once dissolved inwater, RDX is known to migrate rapidly in soils.
Like RDX, the analytes TNT, 4-AmDNT, and 2-
AmDNT were detected in soils at the inlandranges, but measurable concentrations were al-ways low and confined to the surface soils. In mostinstances, the concentrations of the two aminotransformation products exceeded that of TNT.Since these three compounds are more sorptive tosoils than is RDX, these low concentrations willpersist in the surface soils longer than RDX, eventhough soils at the inland ranges are largely coarsesands and have little retentive capacity.
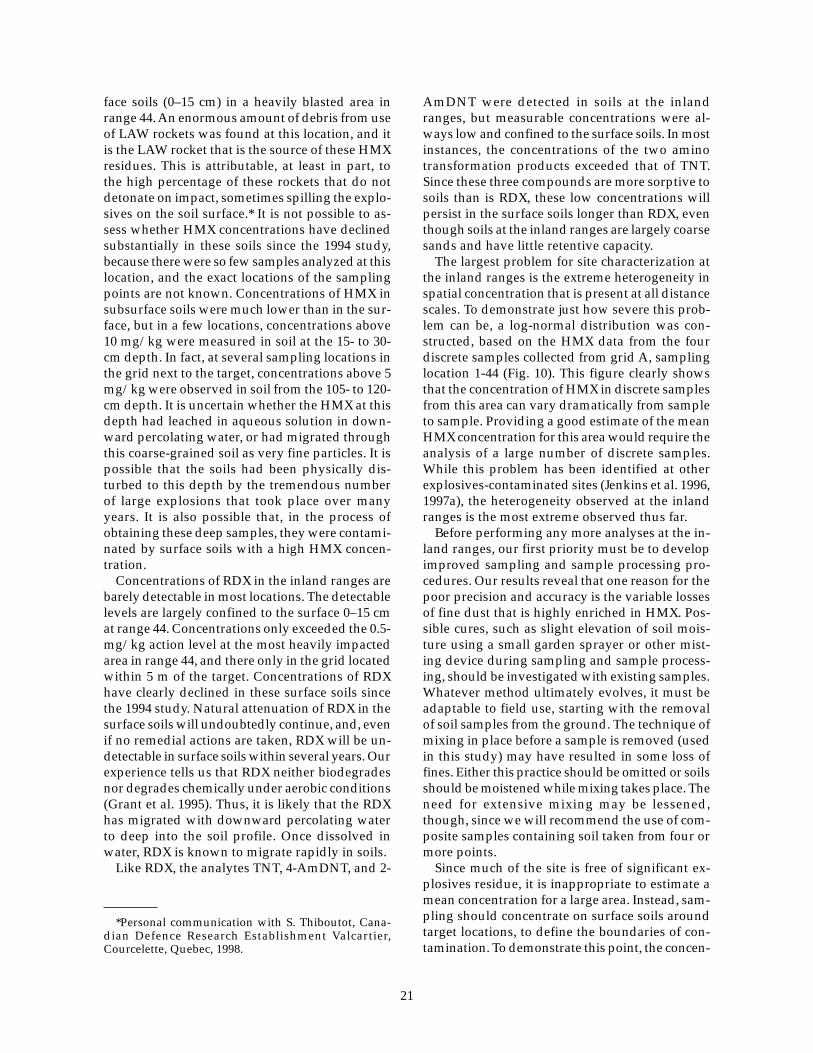
The largest problem for site characterization atthe inland ranges is the extreme heterogeneity inspatial concentration that is present at all distancescales. To demonstrate just how severe this prob-lem can be, a log-normal distribution was con-structed, based on the HMX data from the fourdiscrete samples collected from grid A, samplinglocation 1-44 (Fig. 10). This figure clearly showsthat the concentration of HMX in discrete samplesfrom this area can vary dramatically from sampleto sample. Providing a good estimate of the meanHMX concentration for this area would require theanalysis of a large number of discrete samples.While this problem has been identified at otherexplosives-contaminated sites (Jenkins et al. 1996,1997a), the heterogeneity observed at the inlandranges is the most extreme observed thus far.
Before performing any more analyses at the in-land ranges, our first priority must be to developimproved sampling and sample processing pro-cedures. Our results reveal that one reason for thepoor precision and accuracy is the variable lossesof fine dust that is highly enriched in HMX. Pos-sible cures, such as slight elevation of soil mois-ture using a small garden sprayer or other mist-ing device during sampling and sample process-ing, should be investigated with existing samples.Whatever method ultimately evolves, it must beadaptable to field use, starting with the removalof soil samples from the ground. The technique ofmixing in place before a sample is removed (usedin this study) may have resulted in some loss offines. Either this practice should be omitted or soilsshould be moistened while mixing takes place. Theneed for extensive mixing may be lessened,though, since we will recommend the use of com-posite samples containing soil taken from four ormore points.
Since much of the site is free of significant ex-plosives residue, it is inappropriate to estimate amean concentration for a large area. Instead, sam-pling should concentrate on surface soils aroundtarget locations, to define the boundaries of con-tamination. To demonstrate this point, the concen-
*Personal communication with S. Thiboutot, Cana-dian Defence Research Establishment Valcartier,Courcelette, Quebec, 1998.
22
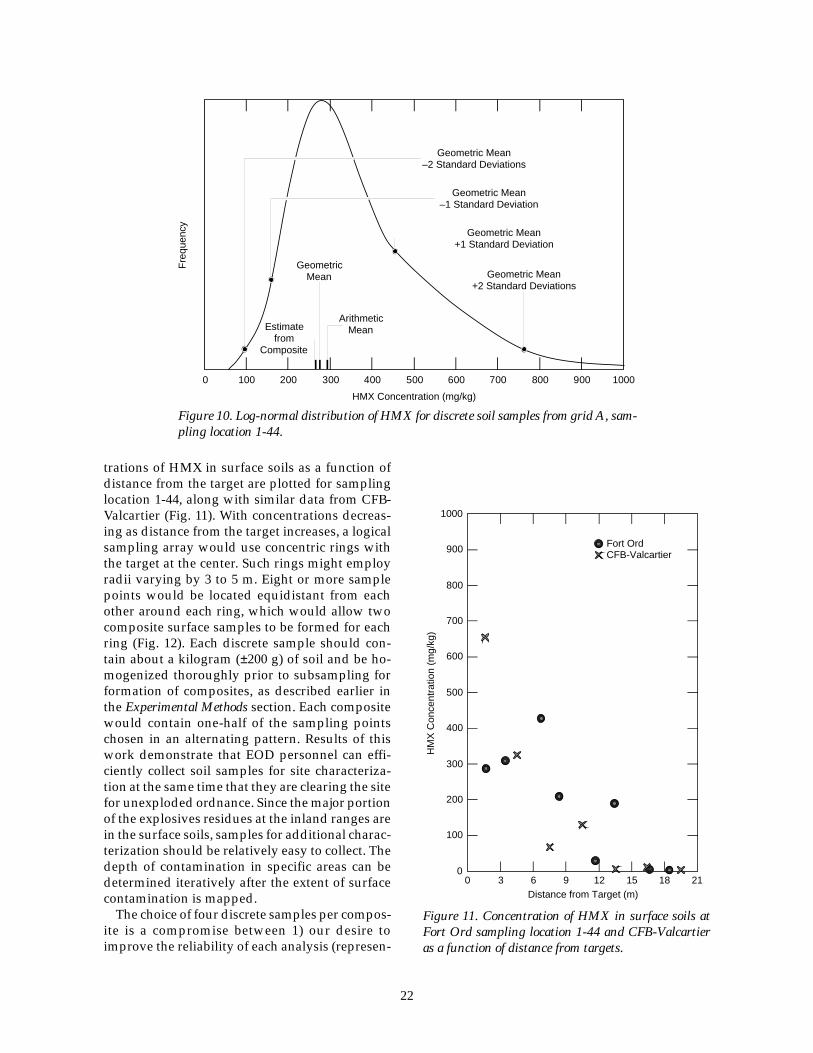
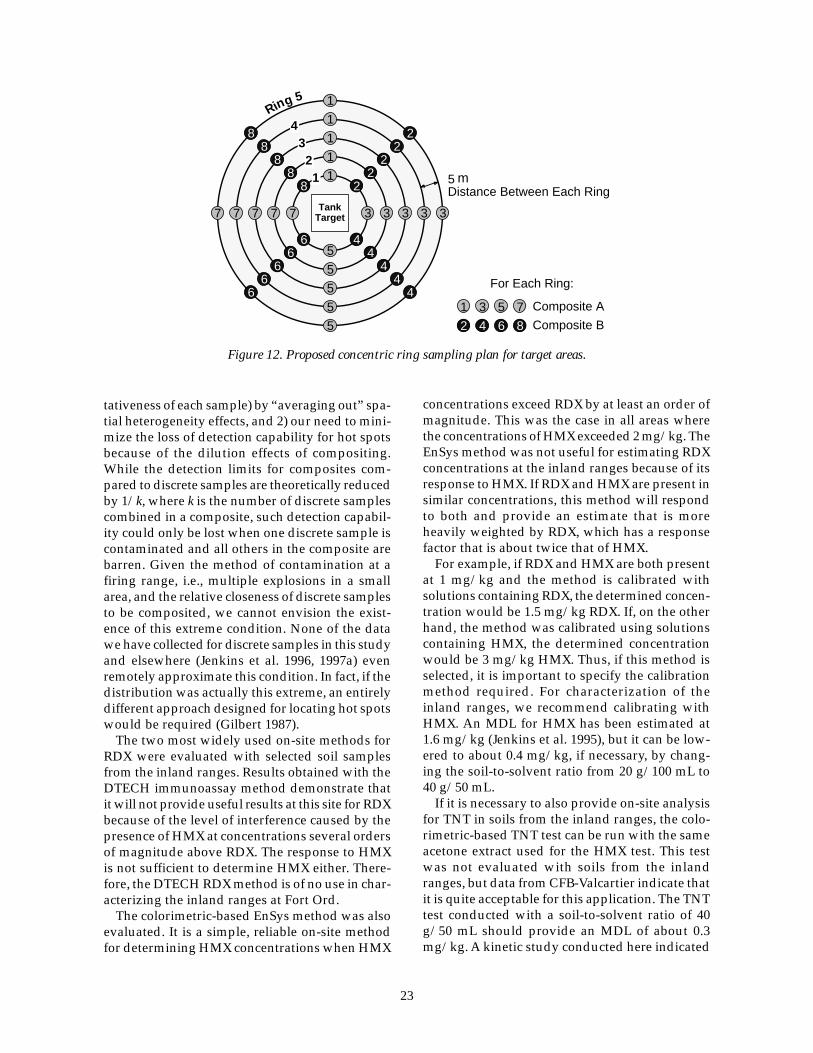
trations of HMX in surface soils as a function ofdistance from the target are plotted for samplinglocation 1-44, along with similar data from CFB-Valcartier (Fig. 11). With concentrations decreas-ing as distance from the target increases, a logicalsampling array would use concentric rings withthe target at the center. Such rings might employradii varying by 3 to 5 m. Eight or more samplepoints would be located equidistant from eachother around each ring, which would allow twocomposite surface samples to be formed for eachring (Fig. 12). Each discrete sample should con-tain about a kilogram (±200 g) of soil and be ho-mogenized thoroughly prior to subsampling forformation of composites, as described earlier inthe Experimental Methods section. Each compositewould contain one-half of the sampling pointschosen in an alternating pattern. Results of thiswork demonstrate that EOD personnel can effi-ciently collect soil samples for site characteriza-tion at the same time that they are clearing the sitefor unexploded ordnance. Since the major portionof the explosives residues at the inland ranges arein the surface soils, samples for additional charac-terization should be relatively easy to collect. Thedepth of contamination in specific areas can bedetermined iteratively after the extent of surfacecontamination is mapped.
The choice of four discrete samples per compos-ite is a compromise between 1) our desire toimprove the reliability of each analysis (represen-
100 200 300 400 500 600 700 800 900 10000
Fre
quen
cy
HMX Concentration (mg/kg)
Geometric Mean–1 Standard Deviation
Geometric Mean+2 Standard Deviations
ArithmeticMean
Geometric Mean+1 Standard Deviation
Geometric Mean–2 Standard Deviations
Estimatefrom
Composite
GeometricMean
1000
900
800
700
600
500
400
300
200
100
00 3 6 9 12 15 18 21
Distance from Target (m)
HM
X C
once
ntra
tion
(mg/
kg)
Fort OrdCFB-Valcartier
Figure 10. Log-normal distribution of HMX for discrete soil samples from grid A, sam-pling location 1-44.
Figure 11. Concentration of HMX in surface soils atFort Ord sampling location 1-44 and CFB-Valcartieras a function of distance from targets.
23
tativeness of each sample) by “averaging out” spa-tial heterogeneity effects, and 2) our need to mini-mize the loss of detection capability for hot spotsbecause of the dilution effects of compositing.While the detection limits for composites com-pared to discrete samples are theoretically reducedby 1/k, where k is the number of discrete samplescombined in a composite, such detection capabil-ity could only be lost when one discrete sample iscontaminated and all others in the composite arebarren. Given the method of contamination at afiring range, i.e., multiple explosions in a smallarea, and the relative closeness of discrete samplesto be composited, we cannot envision the exist-ence of this extreme condition. None of the datawe have collected for discrete samples in this studyand elsewhere (Jenkins et al. 1996, 1997a) evenremotely approximate this condition. In fact, if thedistribution was actually this extreme, an entirelydifferent approach designed for locating hot spotswould be required (Gilbert 1987).
The two most widely used on-site methods forRDX were evaluated with selected soil samplesfrom the inland ranges. Results obtained with theDTECH immunoassay method demonstrate thatit will not provide useful results at this site for RDXbecause of the level of interference caused by thepresence of HMX at concentrations several ordersof magnitude above RDX. The response to HMXis not sufficient to determine HMX either. There-fore, the DTECH RDX method is of no use in char-acterizing the inland ranges at Fort Ord.
The colorimetric-based EnSys method was alsoevaluated. It is a simple, reliable on-site methodfor determining HMX concentrations when HMX
concentrations exceed RDX by at least an order ofmagnitude. This was the case in all areas wherethe concentrations of HMX exceeded 2 mg/kg. TheEnSys method was not useful for estimating RDXconcentrations at the inland ranges because of itsresponse to HMX. If RDX and HMX are present insimilar concentrations, this method will respondto both and provide an estimate that is moreheavily weighted by RDX, which has a responsefactor that is about twice that of HMX.
For example, if RDX and HMX are both presentat 1 mg/kg and the method is calibrated withsolutions containing RDX, the determined concen-tration would be 1.5 mg/kg RDX. If, on the otherhand, the method was calibrated using solutionscontaining HMX, the determined concentrationwould be 3 mg/kg HMX. Thus, if this method isselected, it is important to specify the calibrationmethod required. For characterization of theinland ranges, we recommend calibrating withHMX. An MDL for HMX has been estimated at1.6 mg/kg (Jenkins et al. 1995), but it can be low-ered to about 0.4 mg/kg, if necessary, by chang-ing the soil-to-solvent ratio from 20 g/100 mL to40 g/50 mL.
If it is necessary to also provide on-site analysisfor TNT in soils from the inland ranges, the colo-rimetric-based TNT test can be run with the sameacetone extract used for the HMX test. This testwas not evaluated with soils from the inlandranges, but data from CFB-Valcartier indicate thatit is quite acceptable for this application. The TNTtest conducted with a soil-to-solvent ratio of 40g/50 mL should provide an MDL of about 0.3mg/kg. A kinetic study conducted here indicated
Figure 12. Proposed concentric ring sampling plan for target areas.
1 3 75 Composite A
42 6 8 Composite B
For Each Ring:
Ring 5 1
1
1
1
1
5
5
5
5
5
3 3 3 3 377777
22
22
2
44
44
4
6
66
66
88
8
88
TankTarget
4321 5 cm
Distance Between Each Ringm
24
that a 3-minute extraction time was adequate forthe sandy soils present at the inland ranges. Thisstudy was conducted with the standard 20-g/100-mL soil-to-solvent ratio and should be tested withthe 40-g/50-mL ratio if that is selected. Our expe-rience says that a 3-minute extraction time will beadequate.
No currently available on-site method will pro-vide reliable estimates for RDX in soils from theinland ranges at Fort Ord (Crockett et al. 1996).Use of HPLC, the method of choice for laboratoryanalysis of explosives, in a mobile laboratory orin an expedient laboratory set up at Fort Ord,would provide estimates for RDX as well as HMX,TNT, 2-AmDNT, and 4-AmDNT. If HPLC isselected, either for on-site or off-site use, we rec-ommend the LC-CN column for obtaining quan-titative results. This method can use the sameacetone extracts of the on-site methods, but theymust be diluted 1:4 with water prior to injection.Usually, an LC-18 column is used for quantitationand the LC-CN column is used for confirmationonly in Method 8330, but for the five analytespresent at the inland ranges, the LC-CN providesbetter resolution and more reliable quantitation.
Given the demonstrated reliability and fast turn-around time of the on-site colorimetric method forHMX, duplicate analyses should be conductedusing this method on each composite after theyare formed for the first rings. Sampling and analy-sis would continue for increasingly distant ringsuntil two successive rings yield results having allfour composite analyses below the action level. Ifdesired, an upper 95 or 99% confidence limit couldbe calculated for the mean of the four results.When the upper confidence limit is still above theaction level, a further ring could be sampled anda new upper confidence limit calculated using thesix results. While the distribution of results fromdiscrete sample analysis at the inland ranges tendsto be log-normal, we do not expect that the distri-bution of composites from within a ring will devi-ate greatly from a normal distribution. Conse-quently, we believe it would be appropriate to usenormal distribution statistics in this regard. If thedata indicate otherwise, log-normal distributionscould be used.
We tried to follow a draft protocol (App. A) forconducting preliminary site assessments whereinwe optimized the information available from rela-tively few measurements. This plan worked quitewell, although it was not possible to follow everyaspect of the protocol. For example, the depthstudy should be done with composite samples
from different depths rather than from discretesamples. Thus, we conducted more analyses thanwere envisioned in the original plan. Nonetheless,depth profile data were acquired. The compositingprocedure was validated using the data in Table9. A reference method of analysis (EPA Method8330) was compared with an on-site colorimetricmethod and RP-HPLC analysis of the extracts usedfor the colorimetric analysis. The geometric lay-out of grids and the sample positions within eachgrid allowed us to evaluate spatial heterogeneityover various distances as intended in the draft pro-tocol.
To determine an action level for the inlandranges, it is necessary to specify the depth inter-val over which the action level applies. This isparticularly important for impact ranges that havea significant concentration gradient with depth,such as we have demonstrated both at the inlandranges at Fort Ord and at CFB-Valcartier. Our sur-face samples were vertical composites from 0–15cm, and this interval may be a reasonable choicefor an environmental risk-based criterion.
LITERATURE CITED
Bauer, C.F., T.F. Jenkins, S.M. Koza, P.W .Schumacher, P.H. Miyares, and M.E. Walsh (1989)Development of an analytical method for thedetermination of explosives residues in soil: PartIII. Collaborative test results and final performanceevaluation. USA Cold Regions Research andEngineering Laboratory, Special Report 89-9.Bauer, C.F., S.M. Koza, and T.F. Jenkins (1990)Liquid chromatographic method for determina-tion of explosives residues in soil: Collaborativestudy. Journal of the Association of Official AnalyticalChemists, 73: 541–552.Crockett, A.B., H.D. Craig, T.F. Jenkins, and W.E.Sisk (1996) Field sampling and selecting on-siteanalytical methods for explosives in soil. EPA Fed-eral Facilities Forum Issue Report 540/R-97/501.EPA (1994) Nitroaromatics and nitramines byHPLC. Second Update SW846 Method 8330, Sep-tember, 1994.EPA (1996) Drinking water regulations and healthadvisories. U.S. Environmental Protection AgencyOffice of Water Report EPA 822-B-96-002.Gilbert, R.O. (1987) Statistical Methods for Environ-mental Pollution Monitoring. New York: VanNostrand Reinhold.Gore, S.D., and G.P. Patil (1994) Identifyingextremely large values using composite sample
25
data. Environmental and Ecological Statistics, 1: 227–245.Grant, C.L., T.F. Jenkins, and S.M Golden (1993)Experimental assessment of analytical holdingtimes for nitroaromatic and nitramine explosivesin soil. USA Cold Regions Research and Engineer-ing Laboratory, Special Report 93-11.Grant, C.L., T.F. Jenkins, K.F. Myers, and E.F.McCormick (1995) Comparison of fortification vs.field contamination for holding time estimates ofsoils containing explosives residues. Journal ofEnvironmental Toxicology and Chemistry, 14: 1865–1874.Horowitz, W. (1982) Evaluation of analyticalmethods used for regulation of food and drugs.Analytical Chemistry, 54: 67A–76A.Jenkins, T.F., and M.E. Walsh (1987) Developmentof an analytical method for explosives residues insoil. USA Cold Regions Research and Engineer-ing Laboratory, Special Report 87-7.Jenkins, T.F., and M.E. Walsh (1992) Developmentof field screening methods for TNT, 2, 4-DNT, andRDX in soil. Talanta, 39: 419–428.Jenkins, T.F., M.E. Walsh, P.W. Schumacher, andP.G. Thorne (1995) Development of colorimetricfield screening methods for munitions compoundsin soil. In Proceedings of Environmental Monitoringand Hazardous Waste Site Remediation Symposium,19–21 June, Munich, Germany.Jenkins, T.F., C.L. Grant, G.S. Brar, P.G. Thorne,T.A. Ranney, and P.W. Schumacher (1996) Assess-
ment of sampling error associated with collectionand analysis of soil samples at explosives contami-nated sites. USA Cold Regions Research andEngineering Laboratory, Special Report 96-15.Jenkins, T.F., M.E. Walsh, P.G. Thorne, S.Thiboutot, G. Ampleman, T.A. Ranney, and C.L.Grant (1997a) Assessment of sampling error asso-ciated with the collection and analysis of soilsamples at a firing range contaminated with HMX.USA Cold Regions Research and EngineeringLaboratory, Special Report 97-22.Jenkins, T.F., C.L. Grant, G.S. Brar, P.G. Thorne,P.W . Schumacher, and T.A. Ranney (1997b)Assessment of sampling error associated with thecollection and analysis of soil samples at explo-sives contaminated sites. Field Analytical Chemis-try and Technology, 1: 151–163.Parker, L.V., A.D. Hewitt, and T.F. Jenkins (1990)Influence of casing materials on trace chemicalsin well water. Ground Water Monitoring Review, 10:146–156 (Spring).Racine, C.H., M.E. Walsh, C.M. Collins, D.J.Calkins, B.D. Roebuck, and L. Reitsma (1992)Waterfowl mortality in Eagle River Flats, Alaska:The role of munitions residues. USA Cold RegionsResearch and Engineering Laboratory, CRRELReport 92-5.Steinberg, S.M., J.J. Pignatello, and B.L. Sawhney(1987) Persistence of 1,2-dibromoethane in soils:Entrapment in interparticle micropores. Environ-mental Science and Technology, 21: 1201–1208.
26
APPENDIX A: GUIDE FOR PRELIMINARY TESTING OF MUNITIONS-CONTAMINATED SITES—PREPARATION FOR SAMPLING PLAN
IntroductionNo single approach to site characterization will be appropriate for all places con-
taminated by munitions. This guide for preliminary testing is intended for siteswhere widely dispersed contamination is thought or known to be present. In con-trast, a modified approach would probably be appropriate for a site having highlylocalized “hot spots,” although a recent report suggests that both objectives cansometimes be attained with a single plan (Gore and Patil 1994). It is quite likely thatsome elements of this proposed guide will be unsuitable at some sites, while othersites may require elements not included here. For this reason, an experienced teamshould conduct these tests and interpret the results, and consider any other perti-nent input, such as budget information. Recommendations for a full-scale sam-pling plan will follow. A “cookbook” approach to this problem will never beadequate. However, a plan recommendation must be practical and within the scopeof what can be expected of commercial samplers.
The bulk of explosives contamination generally resides in near-surface soils, themost commonly encountered explosives being solids at environmental tempera-tures. They were most often released as particulates, which tends to exacerbate thesampling problem owing to heterogeneity of distribution. These particles have lowsolubility and, from a kinetics point of view, dissolve very slowly in aqueous solu-tion. Of course, some dissolution does occur and, at manufacturing sites, a portionof the contaminants enters the soil in aqueous solution. In any case, there is abun-dant evidence that high concentrations of these compounds and their biodegrada-tion products can persist in near-surface soils for decades (Steinberg et al. 1987,Grant et al. 1995). Although this document emphasizes shallow contamination, it isclear that in some cases contamination can be found at considerable depth.
The purpose of this protocol is to efficiently and economically obtain resultsessential for developing an optimal, full-scale sampling plan. Our recent studieshave demonstrated the efficacy of homogenizing samples and making compositeson site, followed by rapid on-site analysis (Jenkins et al. 1997b). This approachoffers the major advantages of samples being representative and results being timely,thereby lending itself to iterative followup during the same sampling event. Theseguidelines assume the use of this technology in both the preliminary and full-scalestudies.
Preliminary study plan
1. Dividing a site into potential remediation unitsSufficient historical information on the contaminants present must be known.
Otherwise, a few laboratory analyses will be required before proceeding. Manyinstallations have several potentially contaminated sites, such as a disposal lagoon,a burning ground, an impact area, or a load line. Each of these sites can be subdi-vided into potential remediation units that are more internally homogeneous thanthe site as a whole. Typical reasons for subdividing a site into units are:
• Differing exposure histories with respect to time, munitions composition,method of contamination, and level of contamination.
27
• Differing soil conditions such as texture, moisture, slope, and vegetation.• Prior surveys or any prior remedial treatments, or both.• Practical constraints, such as size.
Therefore, a site should be logically divided into units where each is sufficientlyuniform to suggest a single remediation approach and to justify characterizationby a mean concentration of contaminants present. At any given site, remediationunits may vary widely in size but, for illustration in this document, we willdescribe a unit that is 50 × 100 m (see Fig. 6, main text). Clearly, the division of a siteinto units is a judgment and revisions may be needed as preliminary data becomeavailable.
2. Sampling locationsWhen at least four potentially contaminated sections (potential remediation units)
are present, four sample cores (0–46 cm [0–18 in.]) should be taken from each (for atotal of 16). If there are fewer than four units, the number of cores should be pro-portionately increased. With more than six units, the number of cores can possiblybe decreased when there is great similarity among the units. However, this may beimpractical if units have widely different characteristics.
Cores are taken in pairs, 1 m apart, with each unit having two pairs. These pairsare located at one-quarter and three-quarters of the distance along a diagonalthrough the unit (BD in Fig. 6). This is a good arrangement if results show extremedisparity between the means of the pairs. Then two additional sample pairs can betaken later on the other diagonal (AC in Fig. 6). This forms a 2n factorial pattern.Cores of 5.6-cm diameter, or other appropriate size, are taken to a depth of 46 cmand divided into 0- to 15-, 15- to 31-, and 31- to 46-cm segments. Individual seg-ments are placed in separate containers, such as Zip-Loc bags, and carefullyhomogenized by hand. Depending on the results from these initial samples, deepersoil cores may or may not be necessary.
3. CompositingBefore subsampling, a discrete sample is placed in an aluminum pie plate, or
other suitable container, where rocks, roots, and other debris are removed. Afterfurther stirring and mixing, and coning and quartering (or equivalent), remove a40-g portion. The four discrete samples for a given depth and unit are combinedand thoroughly homogenized to form one composite for each depth in each unit (aminimum of 12 composites). Note that this assumes the action level of concentra-tion being at least four times higher than the quantitation limit of the analysismethod. Any failure to meet this criterion will require using fewer discrete samplesin each composite if we wish to retain the capability for detecting “hot spots” forsurgical excavation.
4. Subsampling for analysisOn-site analytical methods require the extraction of 20-g subsamples. To obtain
these subsamples, transfer each bulk sample (discrete or composite) to a pie plateand mix again before subsampling. A good way to do this is to cone and quarterand then use a scoop to remove approximately 5 g of soil from each quarter.
28
5. Determining extraction timeSince the minimum adequate extraction time will vary for different sites, this is
the first parameter to be determined. One subsample from each depth of the unitwith the heaviest soil or highest organic content is extracted for 3, 10, and 30 min-utes and the extracts are analyzed by on-site methods. Select the shortest time toproduce adequate extraction of the heaviest soil for all further analyses. If differentsoil types are present on the site, either horizontally or vertically, and only a fewsoils require long extraction times, the samples might be split into two groups, butthis does complicate the logistics.
6. Determining depth of contaminationOne subsample from each composite is analyzed by the on-site methods. The
results of these analyses will tell us how deeply each unit is contaminated by thevarious explosives analytes. If analyte concentrations in the 0- to 15-cm portion ofthe cores are much higher than at the lower depths, as is often the case, these sur-face samples may be suitable for characterizing the horizontal extent of contamina-tion within units. Use of surface samples is always best, when appropriate, since itis the easiest and most economical way to obtain representative samples by com-bining several aliquots of soil from within a defined area. We call such samples“area integrated.” If there is no consistent difference in the three depths, or if con-centrations in the composites from the 15- to 31-cm depth are as high as or higherthan in the surface 15 cm, it will be necessary to collect deeper samples to docu-ment the depth of contamination. Deeper samples make composite sampling moretime-consuming and expensive than when surface samples are used.
7. Validating on-site analysesAliquots of one extract from each section (or more if desired) are used for com-
prehensive laboratory analyses. When there are no local laboratories and theextract cannot be transported, it will be necessary to do the laboratory analyses onseparate soil subsamples, obtained as described in section 4. In any case, prior ar-rangements should be made to ensure that these results are quickly generated asthey are required to identify interferences and misidentifications that wouldinvalidate on-site results.
A spike recovery study should also be done for each analyte of interest on at leastone extract from each unit using the on-site methods. Although a single spike con-centration is acceptable, a better procedure would be one spike addition and onematrix dilution (assuming the concentration is at least twice the quantitation limit)to more fully characterize the linearity of analyte response.
8. Validating compositing procedureSubsamples (20 g) from all discrete samples at one selected depth are analyzed
by on-site methods. When it appears that the 0- to 5-cm samples will be used forcharacterization, they should be used here. This would be a minimum of 16 sampleswhen there are four or fewer units. Means of the concentrations for the four dis-crete samples used to make up a composite can be compared to the compositeconcentration determined earlier. Relative differences will tend to be greater forconcentrations close to the lower quantitation limit. In general, agreement should
29
be within a factor of 1.5 and differences greater than a factor of 2 should promptfurther inquiry into the method used to prepare the composites.
9. Short- and long-range spatial heterogeneityThe results required in section 8 provide at least eight pairs of samples separated
by 1 m. This will yield eight estimates of the relative standard deviation (RSD)associated with short-range heterogeneity. When these estimates are all less than100%, which would represent reasonably good homogeneity for munitions resi-dues, they can be pooled to give an overall RSD. It would not be unusual for pairsof core samples to have RSD values greater than 100% because they represent suchsmall volumes (Jenkins et al. 1997b). If one unit or one pair within a unit gives anRSD estimate that is much larger than the others, and the concentrations are mod-erate or high, reanalysis of new subsamples may be appropriate. When reanalysisconfirms an atypical result, that area may require more intensive sampling than theother sections. However, when concentrations are low relative to quantitation lev-els, larger RSDs are common and reanalysis is probably not necessary. Further-more, when “area integrated” samples are employed, the heterogeneity will begreatly reduced, usually by a factor of 10 or more, depending on how many aliquotsare included.
This same set of analyses also yields information on long-range spatial heteroge-neity. The means of pairs within a unit can be compared and the unit means shouldalso be compared. Such results might lead to changes in unit assignment or theymay call for further preliminary samples as noted in section 2 above.
Concluding remarksThe array of results described above can be used to help plan grid layouts and
compositing strategies for a comprehensive sampling plan. Although we can notassume a one-to-one correspondence of RSDs from core samples to larger surfacesamples, the preliminary results are essential for choosing sampling depths andextraction times, and for validating on-site compositing and analysis procedures.Obviously, this preliminary plan is not a trivial exercise but, measured against thecost of conducting a poorly designed full-scale sampling plan with costly off-siteanalysis, we believe the expense is entirely justified and represents a cost-effectiveapproach. Such preliminary data should result in a full-scale plan that requires thefewest possible analyses to produce reliable results. Further, the savings in analysiscosts and the timeliness of having results available offer tremendous advantages.
Specific guidance for compositing can only be given after data quality objectivesare specified for a site. For example, if concentration distribution within a unit isrequired, compositing would be done within grids. These data might be used tochange remediation unit boundaries. It would also be feasible to study unitssequentially because of the fast turnaround with on-site analysis. In contrast, veri-fication of the effectiveness of remediation might dictate that only a mean andupper confidence limit is needed for each unit.
Consider the example cited earlier of a 50- × 100-m remediation unit. Supposethe preliminary study indicated the use of surface (0- to 5-cm) samples. The RSDestimates for core samples separated by 1 m averaged 80%. If we use area inte-grated composite samples containing 16 aliquots, we would expect the RSD for thecomposite to be about 20%
80 16%/( ). This assumes that analytical error is small
compared to sampling error, a condition we have found in our studies (Jenkins etal. 1997b). This also assumes perfect mixing of the 16 aliquots, which we know is
30
not possible. However, if 20- × 20-cm samples are taken from the 0- to 5-cm depth(via a scoop or shovel), the larger volume compared to a 5.6-cm-diameter core samplemight cancel the effect of imperfect mixing.
Let’s divide the unit into eight 25- × 25-m grids and then divide each grid intosixteen 6.25- × 6.25-m subgrids. One 20- × 20-cm aliquot from each subgrid wouldbe formed into a single pile, homogenized as described earlier (section 5), and arepresentative 200- to 400-g area-integrated sample would be carefully collected.Duplicate 20-g subsamples would be analyzed on-site to yield eight mean concen-tration estimates. If greater precision and accuracy are required, duplicate samplescould be collected from the pile.
When the objective is to produce a mean and upper confidence limit for an entireremediation unit, compositing could go as follows. Two 20- × 20-cm aliquots wouldbe collected from each of the eight grids, and sampled as described above. Repli-cate composites, each containing 16 aliquots, could be prepared and 20-g subsamplesanalyzed. The number of composites required will vary with the precision speci-fied for the mean. Aliquot locations within subgrids could be made randomly orsystematically.
From the above discussion, it should be clear that each site will require decisionsthat are based on the preliminary study and coupled to data quality objectives. Asresults accumulate, the transition from preliminary study to full-scale samplingshould become more efficient and reliable.
31
APPENDIX B: RP-HPLC ANALYSIS DATA FROM FORT ORD SAMPLES
Table B1. 18–19 August 1997 from sampling area 1-44.
*Concentrations reported with an asterisk were below method detection limits (MDLs).†No target analytes detected.**Values given in parentheses were obtained from a second portion of soil from the same bag.
33
Table B2. 18–19 August 1997 from sampling area R-44.
*Concentrations reported with an asterisk were below method detection limits (MDLs).†No target analytes detected.**Values given in parentheses were obtained from a second portion of soil from the same bag.
36
Table B4. 18–19 August 1997 from sampling area 2-48.
*Concentrations reported with an asterisk were below method detection limits (MDLs).†No target analytes detected.**Values given in parentheses were obtained from a second portion of soil from the same bag.
Table B6. Spike/recovery samples (all spikes at 0.5 mg/kg; 4-AmDNT not spiked).
Concentration (mg/kg)Depth
Site (cm) HMX RDX TNT 4-AmDNT 2-AmDNT DNB TNB NB 2,4-DNT
Public reporting burden for this collection of information is estimated to average 1 hour per response, including the time for reviewing instructions, searching existing data sources, gathering andmaintaining the data needed, and completing and reviewing the collection of information. Send comments regarding this burden estimate or any other aspect of this collection of information,including suggestion for reducing this burden, to Washington Headquarters Services, Directorate for Information Operations and Reports, 1215 Jefferson Davis Highway, Suite 1204, Arlington,VA 22202-4302, and to the Office of Management and Budget, Paperwork Reduction Project (0704-0188), Washington, DC 20503.
August 1998
Site Characterization for Explosives Contamination at a MilitaryFiring Range Impact Area
Thomas F. Jenkins, Marianne E. Walsh, Philip G. Thorne, Paul H. Miyares,Thomas A. Ranney, Clarence L. Grant, and John R. Esparza
U.S. Army Cold Regions Research and Engineering Laboratory72 Lyme RoadHanover, New Hampshire 03755
Special Report 98-9
Approved for public release; distribution is unlimited.Available from NTIS, Springfield, Virginia 22161
SFIM-A-EC-ET-CR-98025U.S. Army Engineer District U.S. Army Environmental CenterSacramento, California Aberdeen Proving Ground,
Maryland
46
UNCLASSIFIED UNCLASSIFIED UNCLASSIFIED UL
Anti-tank range Firing range SamplingCompositing HMX SoilExplosives Impact area Spatial heterogeneity
A study was conducted at the inland firing ranges at Fort Ord to determine the current levels of explosives resi-dues and to recommend appropriate future site characterization techniques. A set of 280 soil samples was collectedfrom depths ranging from 0–15 cm to 105–120 cm from anti-tank ranges 44 and 48. Sampling locations were se-lected on the basis of the locations of current and former targets, and included an area away from specific targetsand a background area, not affected by local detonations. HMX was the explosives residue present at the highestconcentration. Much lower concentrations of RDX, TNT, and two isomers of aminodinitrotoluene were also de-tected. Explosives residues were largely confined to surface soils near tank targets. A major problem for site char-acterization was found to be the large spatial heterogeneity present. Composite samples very effectively providedrepresentative samples for 5- × 5-m size grids. A colorimetric on-site method gave reliable results for HMX, relativeto SW846 Method 8330. No currently available on-site method for RDX was found to be adequate in the presenceof much higher concentrations of HMX.
For conversion of SI units to non-SI units of measurement, consult ASTM Standard E380-93, Standard Practice for Use of the InternationalSystem of Units, published by the American Society for Testing and Materials, 100 Barr Harbor Drive, West Conshohocken, PA 19428-2959.