1 - Mayne, Brown, Vinson, Schneider, & Finke ASCE Geotechnical Special Publication (GSP) No. 93 - National Geotechnical Experimentation Sites (NGES), Ed. by Jean Benoit & Alan Lutenegger, ASCE, Reston/VA, April 2000, pp. 160-185. SITE CHARACTERIZATION OF PIEDMONT RESIDUAL SOILS AT THE NGES, OPELIKA, ALABAMA Paul W. Mayne 1 , M. ASCE, Dan Brown 2 , M. ASCE, James Vinson 3 , A.M. ASCE, James A. Schneider 4 , A.M. ASCE, and Kimberly A. Finke 5 , A.M. ASCE Abstract The National Geotechnical Experimentation Site at Opelika, Alabama is underlain by residual silts and sands derived from the weathering of schist and gneiss of the Piedmont Geologic Province. Site characterization by in-situ tests has included an extensive series of cone and piezocone penetrometer soundings supplemented with standard penetration, flat plate dilatometer, pre-bored and full-displacement pressuremeter, and borehole shear. Geophysical surveys have been completed by crosshole, surface wave, and downhole tests. Complementary laboratory testing on split-barrel drive samples and continuous geoprobe samples have consisted of index, moisture, plasticity, gradation, & hydrometer analyses. Undisturbed tube samples have been subjected to triaxial, resonant column, permeability, and oedometer loading. Piedmont residual soils are unusual in that they exhibit behavioral facets characteristic of both clay and sand, thus creating a dichotomy in practice in selecting undrained versus drained soil parameters for analysis. 1. Assoc. Professor, School of Civil & Environmental Engrg, Georgia Institute of Technology, Atlanta, GA 30332-0355 (Email: [email protected]). 2. Assoc. Professor, Dept. of Civil Engineering, Harbert Engrg. Center, Auburn Univ., Auburn, AL 36849-5337 (Email: [email protected]). 3. Geotechnical Engineer, Soil Testing Engineers Inc., 4100 Louisiana Ave., Lake Charles, LA. 70607. 4. Staff Engineer, GeoSyntec Consultants, 1100 Hearn Drive, Suite 200, Atlanta, GA 30342-1523. (Email: [email protected]). 5. Geotechnical Engineer, URS Greiner Woodward Clyde, Stanford Place 3, Suite 1000, 4582 S. Ulster St., Denver, CO 80237. (Email: [email protected]).
Transcript
1 - Mayne, Brown, Vinson, Schneider, & Finke
ASCE Geotechnical Special Publication (GSP) No. 93 - National GeotechnicalExperimentation Sites (NGES), Ed. by Jean Benoit & Alan Lutenegger, ASCE,Reston/VA, April 2000, pp. 160-185.
SITE CHARACTERIZATION OF PIEDMONT RESIDUAL SOILS AT THE NGES, OPELIKA, ALABAMA
Paul W. Mayne1, M. ASCE, Dan Brown2, M. ASCE, James Vinson3, A.M. ASCE,James A. Schneider4, A.M. ASCE, and Kimberly A. Finke5, A.M. ASCE
Abstract
The National Geotechnical Experimentation Site at Opelika, Alabama is underlainby residual silts and sands derived from the weathering of schist and gneiss of thePiedmont Geologic Province. Site characterization by in-situ tests has included anextensive series of cone and piezocone penetrometer soundings supplemented withstandard penetration, flat plate dilatometer, pre-bored and full-displacementpressuremeter, and borehole shear. Geophysical surveys have been completed bycrosshole, surface wave, and downhole tests. Complementary laboratory testing onsplit-barrel drive samples and continuous geoprobe samples have consisted of index,moisture, plasticity, gradation, & hydrometer analyses. Undisturbed tube sampleshave been subjected to triaxial, resonant column, permeability, and oedometerloading. Piedmont residual soils are unusual in that they exhibit behavioral facetscharacteristic of both clay and sand, thus creating a dichotomy in practice inselecting undrained versus drained soil parameters for analysis.
1. Assoc. Professor, School of Civil & Environmental Engrg, Georgia Institute of Technology, Atlanta, GA 30332-0355 (Email: [email protected]).2. Assoc. Professor, Dept. of Civil Engineering, Harbert Engrg. Center, Auburn Univ., Auburn, AL 36849-5337 (Email: [email protected]).3. Geotechnical Engineer, Soil Testing Engineers Inc., 4100 Louisiana Ave., Lake Charles, LA. 70607.4. Staff Engineer, GeoSyntec Consultants, 1100 Hearn Drive, Suite 200, Atlanta,GA 30342-1523. (Email: [email protected]).5. Geotechnical Engineer, URS Greiner Woodward Clyde, Stanford Place 3, Suite 1000, 4582 S. Ulster St., Denver, CO 80237. (Email: [email protected]).
2 - Mayne, Brown, Vinson, Schneider, & Finke
Geologic Setting
Piedmont residuum serves as the foundation bearing soils for several major cities inthe eastern United States, including Atlanta/GA, Columbia/SC, Charlotte/NC,Raleigh/NC, and Gaithersburg/MD, as well as western suburbs of Philadelphia/PA,Washington/DC, Wilmington/DE, Baltimore/MD, and Richmond/VA. Due to theimportance of this geology with respect to geotechnical practice in the Atlanticregion, the Opelika Test Site was established at the southern end of the PiedmontProvince, as shown by Figure 1. The exposed surface extent of the Piedmontgeologic province is 1200 kilometers long and up to 200 kilometers wide, appearingas a lenticular formation running parallel with the Atlantic Coast. At the Fall Line,the Piedmont actually dips easterly and underlies the extensive sediments of theAtlantic Coastal Plain. The name Piedmont means �foot of the mountains�,reflecting a highly eroded geomorphological state since rolling terrain is the now theremnant of what once were mountains. The original Paleozoic rocks were primarilyof metamorphic and igneous origin, including predominances of schist, gneiss, andgranite, although localized regions contain slate, phyllite, greenstone, and diabase.The rocks of the Piedmont have decomposed mechanically and chemically inplaceto form residuum and saprolite.
Figure 1. Surface Extent of Piedmont Geology and Opelika NGES Location.
3 - Mayne, Brown, Vinson, Schneider, & Finke
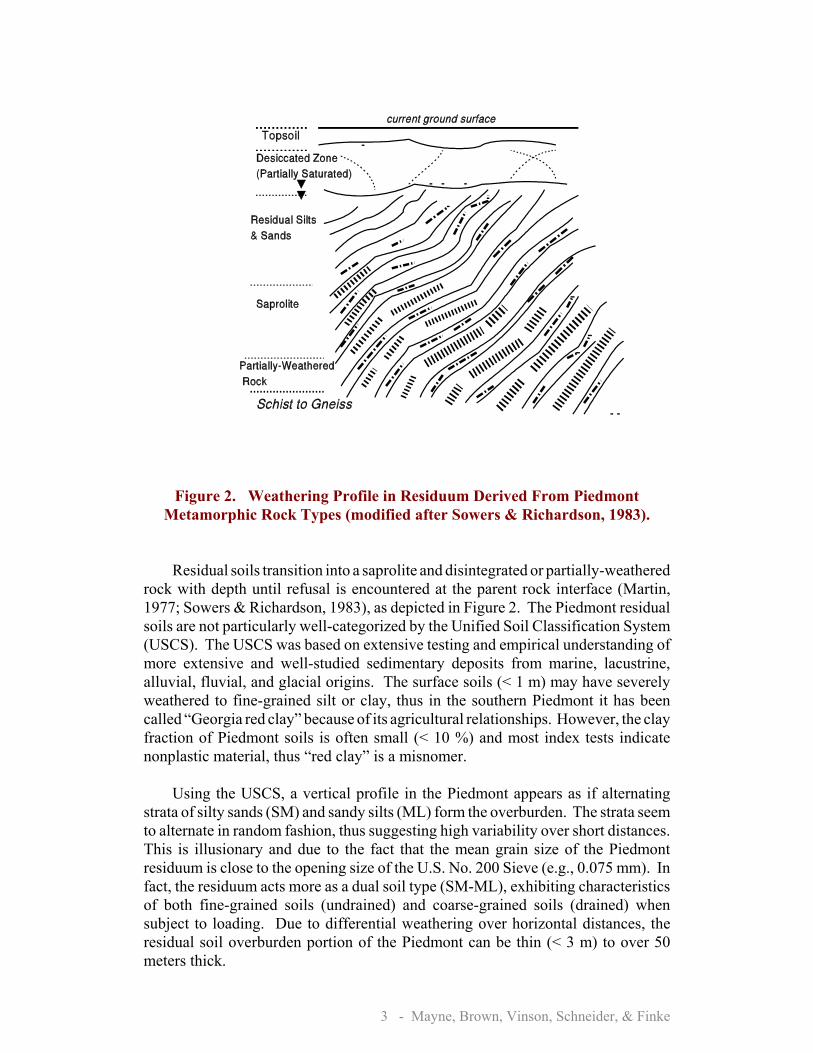
Figure 2. Weathering Profile in Residuum Derived From PiedmontMetamorphic Rock Types (modified after Sowers & Richardson, 1983).
Residual soils transition into a saprolite and disintegrated or partially-weatheredrock with depth until refusal is encountered at the parent rock interface (Martin,1977; Sowers & Richardson, 1983), as depicted in Figure 2. The Piedmont residualsoils are not particularly well-categorized by the Unified Soil Classification System(USCS). The USCS was based on extensive testing and empirical understanding ofmore extensive and well-studied sedimentary deposits from marine, lacustrine,alluvial, fluvial, and glacial origins. The surface soils (< 1 m) may have severelyweathered to fine-grained silt or clay, thus in the southern Piedmont it has beencalled �Georgia red clay� because of its agricultural relationships. However, the clayfraction of Piedmont soils is often small (< 10 %) and most index tests indicatenonplastic material, thus �red clay� is a misnomer.
Using the USCS, a vertical profile in the Piedmont appears as if alternatingstrata of silty sands (SM) and sandy silts (ML) form the overburden. The strata seemto alternate in random fashion, thus suggesting high variability over short distances.This is illusionary and due to the fact that the mean grain size of the Piedmontresiduum is close to the opening size of the U.S. No. 200 Sieve (e.g., 0.075 mm). Infact, the residuum acts more as a dual soil type (SM-ML), exhibiting characteristicsof both fine-grained soils (undrained) and coarse-grained soils (drained) whensubject to loading. Due to differential weathering over horizontal distances, theresidual soil overburden portion of the Piedmont can be thin (< 3 m) to over 50meters thick.
4 - Mayne, Brown, Vinson, Schneider, & Finke
Opelika Test Site
A national geotechnical experimentation site (NGES) was established near thesmall village community of Spring Villa, south of I-85 and east of Opelika, Alabama(Vinson, 1997). The site is contained within the southern Piedmont geology andlocated at the northeastern edge of the Opelika NGES property. The subsurfacematerials are composed of silty to sandy residual soils that grade eventually withdepth into partially-weathered schist and gneiss. The water table lies about 2 to 3 mdeep with the upper vadose zone above the phreatic surface appearing desiccated andcrustal due to past groundwater fluctuations.
The Opelika NGES was established by the Alabama DOT as a 130-hectare tract(320 acres) for research projects related to bridge pier foundations and pavementsubgrades. The original property consisted of forested rolling terrain. The site ismanaged by Auburn University and includes a deep soils site (discussed herein) atthe south end of the property which is in use for full-scale load tests on deepfoundations under axial and lateral static and dynamic loading. Ongoing researchat the site includes construction of a racetrack for subgrade evaluations andperformance of deep foundations in weathered rocks. At the soil test portion of theNGES, a variety of laboratory and field tests have been performed to characterize thePiedmont residuum, as discussed subsequently.
SPT and Index Results
A summary of standard penetration test (SPT) resistances from four soil testborings using hollow stem augers is presented in Figure 3a. Below a crustal zoneevident in the upper 3 meters, the recorded N-values increase from about 8blows/300 mm at z = 3 m to 14 blows/300 mm at the termination depths z = 15 m.Similar results with N-values increasing with depth were obtained at an earlier testsite in Piedmont soils in Atlanta (Harris & Mayne, 1994).
A summary of mean grain size (D50) from mechanical and hydrometer analysesis shown in Figure 3b. In certain specimens, the gradation tests were stopped at thepercent fines content (No. 200 sieve), so that the D50 was not determined for severalof the fine-grained samples. In any event, it can be seen that the mean grain size ofthe Piedmont soils is near the USCS cutoff of 0.075 mm (U.S. No. 200 sieve), thusborderline in its classification as sandy silt to silty sand. Companion lab tests gavea mean liquid limit of 46% and mean plasticity index of 8%, although a number ofspecimens were nonplastic (Brown & Vinson, 1998). Thus, the Piedmont residualsoils are better described by dual symbols (SM-ML).
Geophysical Surveys
Crosshole and surface wave measurements were performed at the Opelika NGES toprofile the shear wave velocity with depth. Two crosshole arrays were installed at
5 - Mayne, Brown, Vinson, Schneider, & Finke
0
2
4
6
8
10
12
14
16
Dep
th (m
eter
s)
0 5 10 15 20 N-Value (blows/0.3 m)
B1
B3
B4
B6
Mean
0
2
4
6
8
10
12
14
16
Dep
th (m
eter
s)
0.01 0.1 1 Mean Grain Size (mm)
B-1
B-2
B-3
B-4
B-5
B-6
B-7
B-8
GP
Fine Coarse
Figure 3. Summary Profiles of (a) SPT Resistances and (b) Mean Grain Sizes.
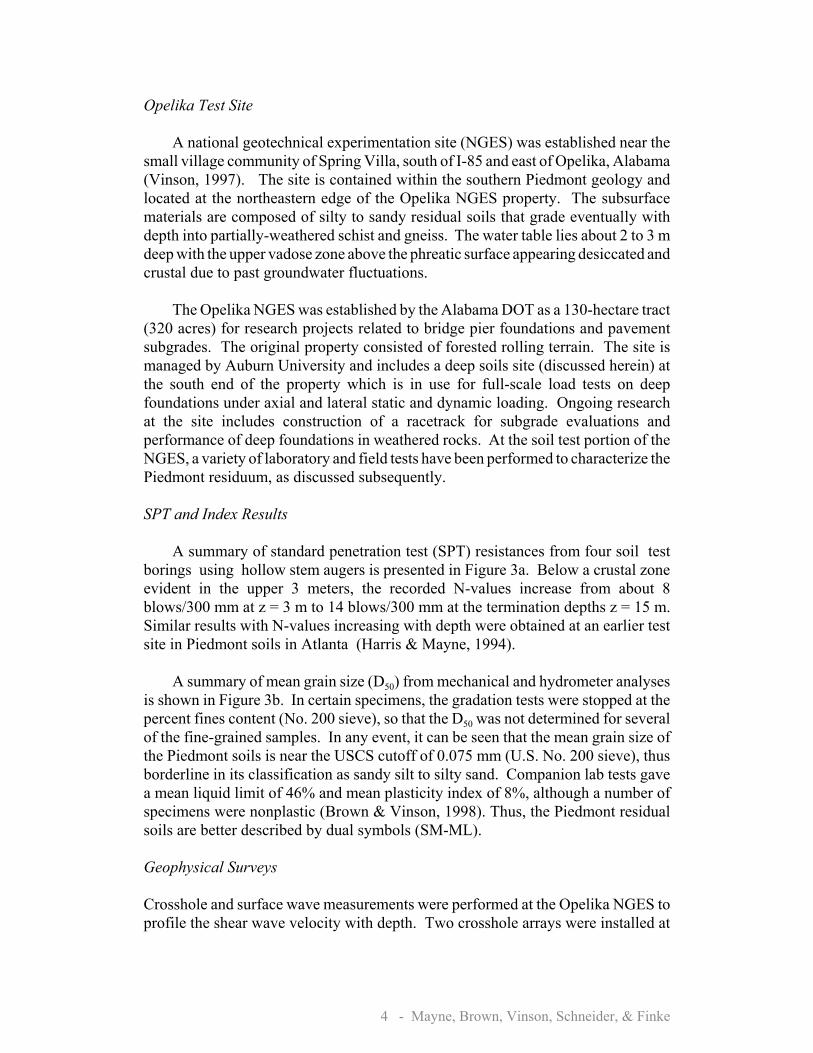
the site with each set comprised of three PVC-cased boreholes to 15 meters depth.The boreholes in each array were about 3 meters apart. The casing was grouted afterplacement using a cement-bentonite mixture and an inclinometer was used todetermine the vertical alignment of each borehole (Brown & Vinson, 1998). Adownhole hammer was used as a source in one outer borehole with receivergeophones placed at the same level in the middle and farthest borehole to allow bothdirect source-to-receiver, as well as interval receiver-receiver, determinations ofshear wave velocity (Vs), per ASTM D-4428. Results from both crosshole serieswere similar (Kates, 1996) with the profile from one of the tests (CHT-2) presentedin Figure 4. Generally, in the upper 11 meters at the NGES, the Vs is rather constantat 200± m/s.
The method of spectral analysis of surface waves (SASW) was performed usinga two-channel HP-spectrum analyzer and paired set of geophones that was movedat the surface to obtain the dispersion curve at the site. Details of the test method,data collection, and inversion processing are given by Rix (1998). The measuredsurface waves (or Rayleigh waves) are a special type of shear wave that occursbecause of the boundary condition formed by the plane of the ground surface.Results from the
6 - Mayne, Brown, Vinson, Schneider, & Finke
Figure 4. Results of Crosshole and Surface Wave Measurements at Opelika.
SASW are also presented in Figure 4 and show to be in general agreement with thecrosshole tests below the desiccated region. Subsequently, results from downholeVs measurements taken during seismic cone and seismic dilatometer tests arepresented, as well as laboratory resonant column tests on recovered samples, with alltests indicating comparable results (Mayne, 1999).
Cone Penetration Tests
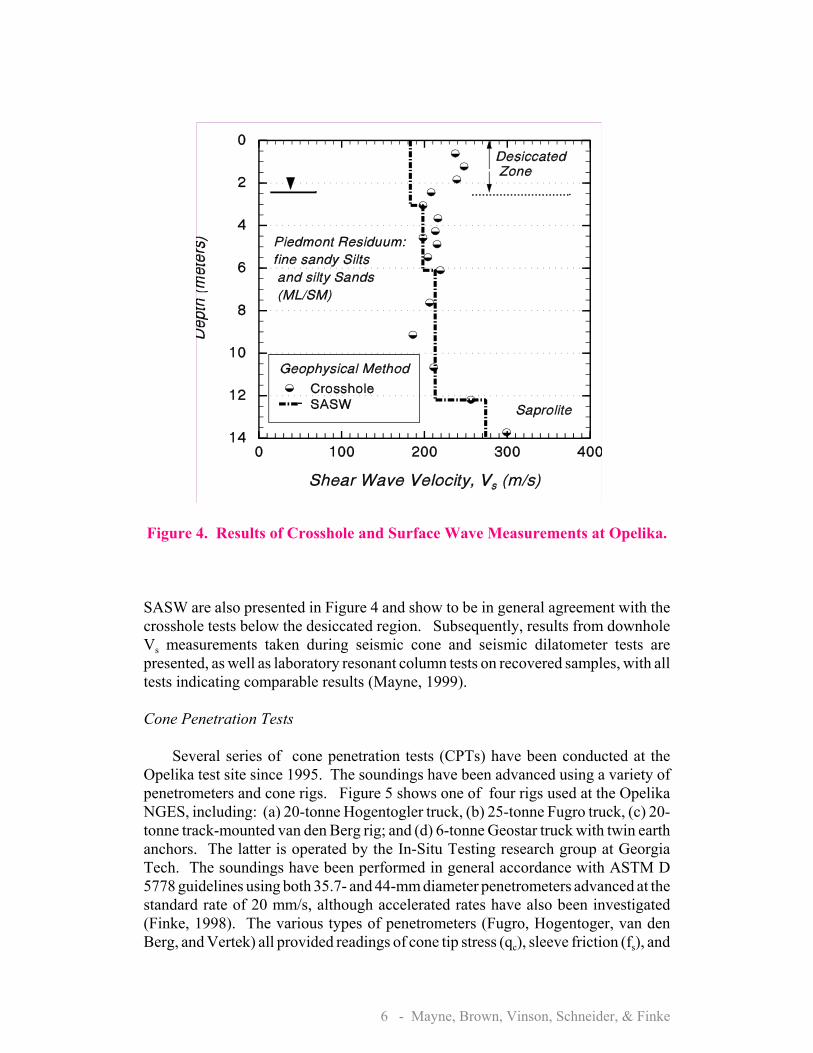
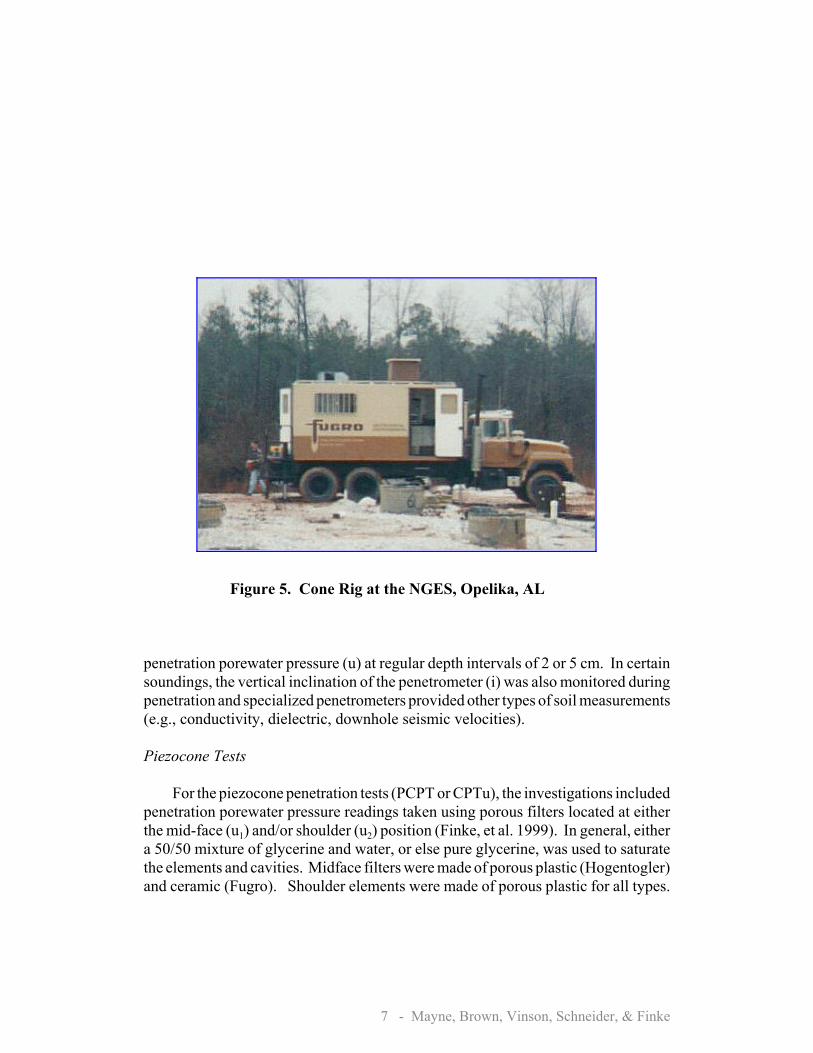
Several series of cone penetration tests (CPTs) have been conducted at theOpelika test site since 1995. The soundings have been advanced using a variety ofpenetrometers and cone rigs. Figure 5 shows one of four rigs used at the OpelikaNGES, including: (a) 20-tonne Hogentogler truck, (b) 25-tonne Fugro truck, (c) 20-tonne track-mounted van den Berg rig; and (d) 6-tonne Geostar truck with twin earthanchors. The latter is operated by the In-Situ Testing research group at GeorgiaTech. The soundings have been performed in general accordance with ASTM D5778 guidelines using both 35.7- and 44-mm diameter penetrometers advanced at thestandard rate of 20 mm/s, although accelerated rates have also been investigated(Finke, 1998). The various types of penetrometers (Fugro, Hogentoger, van denBerg, and Vertek) all provided readings of cone tip stress (qc), sleeve friction (fs), and
7 - Mayne, Brown, Vinson, Schneider, & Finke
Figure 5. Cone Rig at the NGES, Opelika, AL
penetration porewater pressure (u) at regular depth intervals of 2 or 5 cm. In certainsoundings, the vertical inclination of the penetrometer (i) was also monitored duringpenetration and specialized penetrometers provided other types of soil measurements(e.g., conductivity, dielectric, downhole seismic velocities).
Piezocone Tests
For the piezocone penetration tests (PCPT or CPTu), the investigations includedpenetration porewater pressure readings taken using porous filters located at eitherthe mid-face (u1) and/or shoulder (u2) position (Finke, et al. 1999). In general, eithera 50/50 mixture of glycerine and water, or else pure glycerine, was used to saturatethe elements and cavities. Midface filters were made of porous plastic (Hogentogler)and ceramic (Fugro). Shoulder elements were made of porous plastic for all types.
8 - Mayne, Brown, Vinson, Schneider, & Finke
0
2
4
6
8
10
0 2 4 6 8
qT (MPa)D
epth
(m)
0
2
4
6
8
10
0 200 400
fS (kPa)
F-1(u1)F-2(u2)
0
2
4
6
8
10
0 500 1000
u1 (kPa)
0
2
4
6
8
10
-200 0 200 400
u2 (kPa)
uo
Figure 6. Piezocone Test Results from Two Sister Soundings Showing Both Midface (u1) and Shoulder (u2) Porous Filter Responses.
Results from a paired set of 15-cm2 soundings side-by-side with the two typesof pore pressure elements are shown in Figure 6. The tip stresses have beencorrected as per recommended practice (Campanella & Robertson, 1988; Lunne, etal. 1997), although the correction from qc to qt is not significant in these residual soils(Finke, et al. 1999). The cone tip stresses measure about 2.5 < qt < 3.5 MPa in theupper 10 meters. Corresponding sleeve frictions are between 150 < fs < 250 kPa.For penetration porewater pressures, dramatically different responses are evidentwith the midface readings high and positive (400 < u1 < 800 kPa) and the shoulderelement readings negative and near cavitation (u2 . -90 kPa). This phenomenon ofpositive u1 with negative u2 response has been previously observed as characteristicof fissured overconsolidated clays (Mayne, et al. 1990; Lunne, et al. 1997).
The Piedmont residuum has relict features and qualities of the parent rock,including remnant bonding of the intact rock itself, as well as the discontinuities,jointing, cracks, and fissures of the rock mass (Sowers, 1994). It is postulated that,
9 - Mayne, Brown, Vinson, Schneider, & Finke
-200
-100
0
100
200
300
400
500
600
Pore
wat
er P
ress
ure
(kPa
)
1 10 100 1000 Time (seconds)
5.59 m
6.57 m
7.47 m
8.38 m
10.45 m
13.53 m
Midface u1
Shoulder u2
u2u1
uo
Value at Penetration
Depth
since the midface u1 filter lies within a zone of high compression located directlybeneath the cone tip, this response is positive because it is dominated by thedestructuration of the residual intact bonding of the original relict rock continuum.In contrast, the shoulder u2 readings are negative because they reflect shear-inducedpore pressures and remnant discontinuities within the matrix (St. John, et al. 1969).Thus, the u1 readings reflect the destructuration of intact bonds and the u2 readingsare indicative of the fissures, fractures, and jointing of the original rock mass (Finke& Mayne, 1999).
In the vadose zone above the groundwater table, the penetration porewaterpressures at midface have been observed to be either positive or �zero-ish�, while atthe shoulder, the values can be positive, zero, or negative. It is believed that thesereflect the transient capillary conditions due to the current degree of partial or fullsaturation in the residual fine-grained soils which depends on the humidity,infiltration, and prior rainfall activities around the actual time of testing.
Porewater Pressure Dissipations
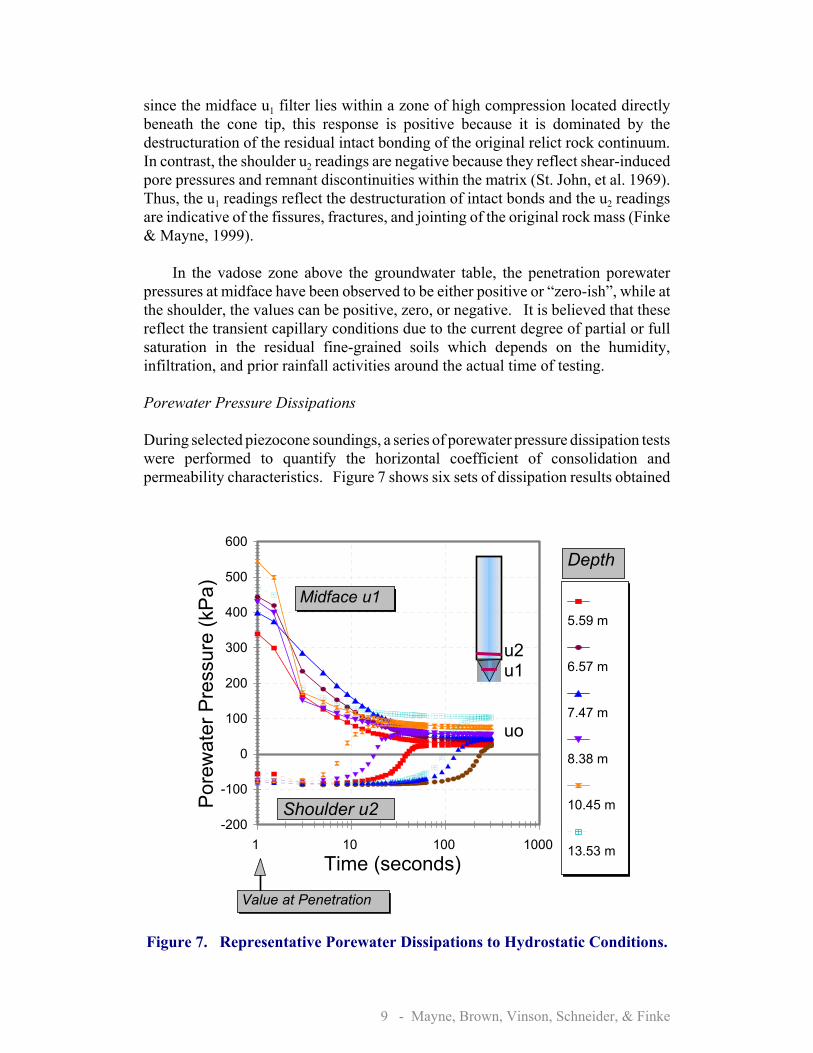
During selected piezocone soundings, a series of porewater pressure dissipation testswere performed to quantify the horizontal coefficient of consolidation andpermeability characteristics. Figure 7 shows six sets of dissipation results obtained
Figure 7. Representative Porewater Dissipations to Hydrostatic Conditions.
10 - Mayne, Brown, Vinson, Schneider, & Finke
0
2
4
6
8
10
12
14
16
Dept
h (m
eter
s)
-100 0 100 200 300 400Porewater Pressure (kPa)
u1 dissipation
u2 dissipation
u1 duringpenetration
u2 duringpenetration
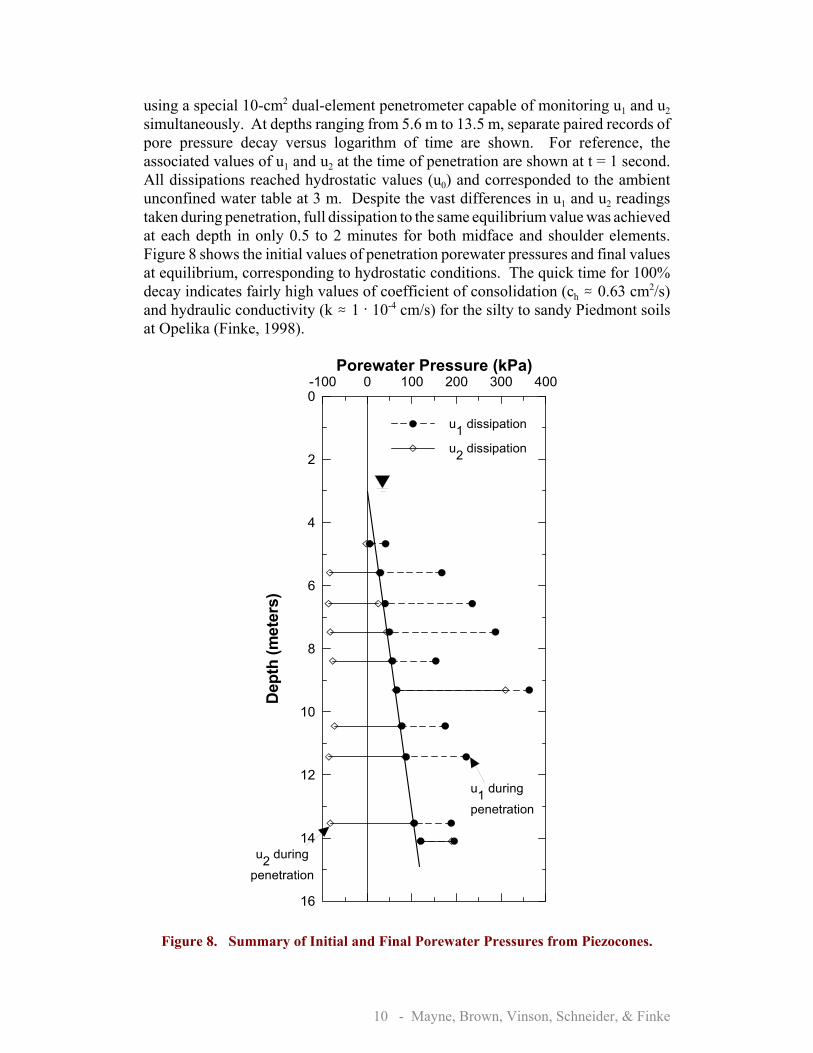
using a special 10-cm2 dual-element penetrometer capable of monitoring u1 and u2simultaneously. At depths ranging from 5.6 m to 13.5 m, separate paired records ofpore pressure decay versus logarithm of time are shown. For reference, theassociated values of u1 and u2 at the time of penetration are shown at t = 1 second.All dissipations reached hydrostatic values (u0) and corresponded to the ambientunconfined water table at 3 m. Despite the vast differences in u1 and u2 readingstaken during penetration, full dissipation to the same equilibrium value was achievedat each depth in only 0.5 to 2 minutes for both midface and shoulder elements.Figure 8 shows the initial values of penetration porewater pressures and final valuesat equilibrium, corresponding to hydrostatic conditions. The quick time for 100%decay indicates fairly high values of coefficient of consolidation (ch . 0.63 cm2/s)and hydraulic conductivity (k . 1 A 10-4 cm/s) for the silty to sandy Piedmont soilsat Opelika (Finke, 1998).
Figure 8. Summary of Initial and Final Porewater Pressures from Piezocones.
11 - Mayne, Brown, Vinson, Schneider, & Finke
0
2
4
6
8
10
12
0 2 4 6 8qt (MPa)
Dep
th (m
eter
s)
0
2
4
6
8
10
12
0 100 200 300fs (kPa)
0
2
4
6
8
10
12
-100 0 100 200u2 (kPa)
0
2
4
6
8
10
12
0 200 400Vs (m/s)
SCPTuSDMTCrossholeSASW
uo
Seismic Cone Tests
Several CPTs have been performed at the Opelika NGES using a seismicpenetrometer that includes a single horizontal geophone (velocity transducer) withinthe upper section of the probe. Using a horizontally-struck plank that is orientedparallel with the geophone axis, a vertically-propagating horizontally-polarized shearwave can be monitored at one-meter depth intervals, usually corresponding to thesuccessive addition of cone rods. The source is usually located one to two metersfrom the axis of the vertical sounding. This downhole geophysical techniqueprovides a pseudo-interval determination of Vs with depth (Campanella, 1994).Striking the plank from the left and then from the right produces two separate wavesthat are mirrored images. These can be superimposed to accentuate the arrival timeof the shear wave on the oscilloscope screen and provide a better delineation duringinterpretation.
Figure 9 presents the results of a seismic piezocone penetration test (SCPTu)which conveniently provides four independent readings with depth from a singlesounding (qt, fs, ub, and Vs). The downhole Vs were relatively constant at 200 ± 50m/s in the upper 12 meters and compare well with the values obtained from theaforementioned CHT and SASW surveys(Schneider et al. 1999).
Figure 9. Representative Seismic Piezocone Sounding at Opelika, Alabama.
12 - Mayne, Brown, Vinson, Schneider, & Finke
0
2
4
6
8
10
12
Dep
th (m
eter
s)
0 5 10 Contact
po (bars)0
2
4
6
8
10
12 0 5 10 15
Expansion
p1 (bars)
0
2
4
6
8
10
12 0 200 400
Shear Wave
SDMT-AU1
SDMT-AU2
CHT-SR2
DMT-99
Vs (m/s)
Flat Plate Dilatometer Tests
The flat plate dilatometer test (DMT) provides measurements of contact pressure(po) and expansion pressure (p1) at regular intervals of either 20-cm or 30-cm withdepth. These readings are used to evaluate the stratigraphy and strength propertiesof the soils. At Opelika, both the regular blade unit and a special modified systemoutfitted with a geophone in the rod coupler have been used (Martin & Mayne,1998). Results from one regular DMT and two seismic dilatometer tests (SDMT) aregiven in Figure 10. The apparent crustal and desiccated zone is evident in the upperthree meters in all three measurements (po, p1, Vs). Beneath this, the readings areseen to increase slightly with depth. The shear wave data can be used to provide aninitial stiffness, represented by the small-strain shear modulus, G0 = D(Vs)2, whereD = total mass density of the soil. The DMT pressures can be used to evaluate thesoil strength. Thus, it is possible to construct an entire stress-strain-strength curveat each depth from the results of the SDMT, as discussed elsewhere (Mayne,Schneider, & Martin, 1999).
Figure 10. Results from Seismic Flat Plate Dilatometer Tests at Opelika NGES.
Dissipation tests can also be performed using the flat plate dilatometer(Lutenegger, 1988). A special series of DMT dissipations tests have been carriedout at Opelika using the A-readings (unpublished). The latter indicate the A-readings decay to about 90% of their penetration value after 2 minutes. A separateseries of DMTs has been performed whereby the A and B readings were recorded 2-minutes after the blade was installed.
13 - Mayne, Brown, Vinson, Schneider, & Finke
0
200
400
600
800
1000
Expa
nsio
n Pr
essu
re, P
(kPa
)
0 200 400 600 Corrected Volume, V (cc)
B2 at 8 m B5 at 8 m B2 at 10 m B5 at 10 m
Pressuremeter Tests
Menard pre-bored type pressuremeter tests (PMT) were conducted at the NGESusing a monocell �Texam�-type probe. The hole was pre-formed by first pushing a71-mm diameter thin-walled Shelby tube sample at the bottom of the borehole, priorto placement of the pressuremeter. A total of 16 PMTs were completed (Brown &Vinson, 1998). Sample results for the expansion pressure versus measured volumecurves are given in Figure 11 from two boreholes at two test depths. Details on theassessment of total horizontal stress (Po), elastic modulus (Epmt), strength, and limitpressure (PL) are discussed in Vinson (1997).
Figure 11. Representative Results from Pre-Bored Type Pressuremeter Tests.
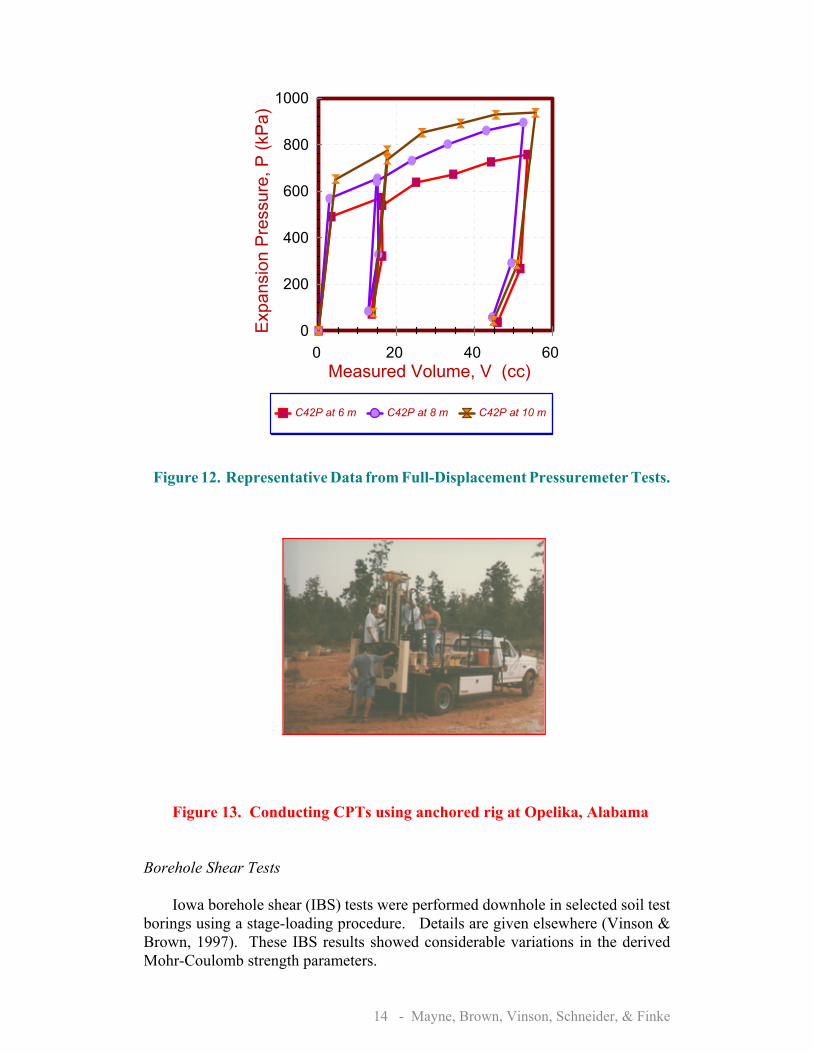
Full-displacement type pressuremeter tests (FDPMT) were also conducted atOpelika using a 35.7-mm diameter Pencel probe having a 60/ apexed-tip at its frontend. This probe is pushed directly into place, thus an assessment of in-situ lateralstress state is not obtainable. However, the test is considerably quicker than regularPMTs that took two days to complete, compared with a total of 29 FDPMTs whichwere completed in only 6 hours work. Selected results at three test depths areshown in Figure 12, including an unload-reload cycle to better define some pseudo-elastic stiffness of the Piedmont residual soils.
14 - Mayne, Brown, Vinson, Schneider, & Finke
0
200
400
600
800
1000
Expa
nsio
n Pr
essu
re, P
(kPa
)
0 20 40 60 Measured Volume, V (cc)
C42P at 6 m C42P at 8 m C42P at 10 m
Figure 12. Representative Data from Full-Displacement Pressuremeter Tests.
Figure 13. Conducting CPTs using anchored rig at Opelika, Alabama
Borehole Shear Tests
Iowa borehole shear (IBS) tests were performed downhole in selected soil testborings using a stage-loading procedure. Details are given elsewhere (Vinson &Brown, 1997). These IBS results showed considerable variations in the derivedMohr-Coulomb strength parameters.
In addition to drive samples, thin-walled Shelby tube samples were readilyobtainable in the Piedmont residual silts and sands. At the Opelika NGES, severalsets of tube samples have been retrieved and subjected to a varied assortment of tests,including: unit weight determinations, one-dimensional consolidation, permeability,drained & undrained triaxial shear, and resonant column.
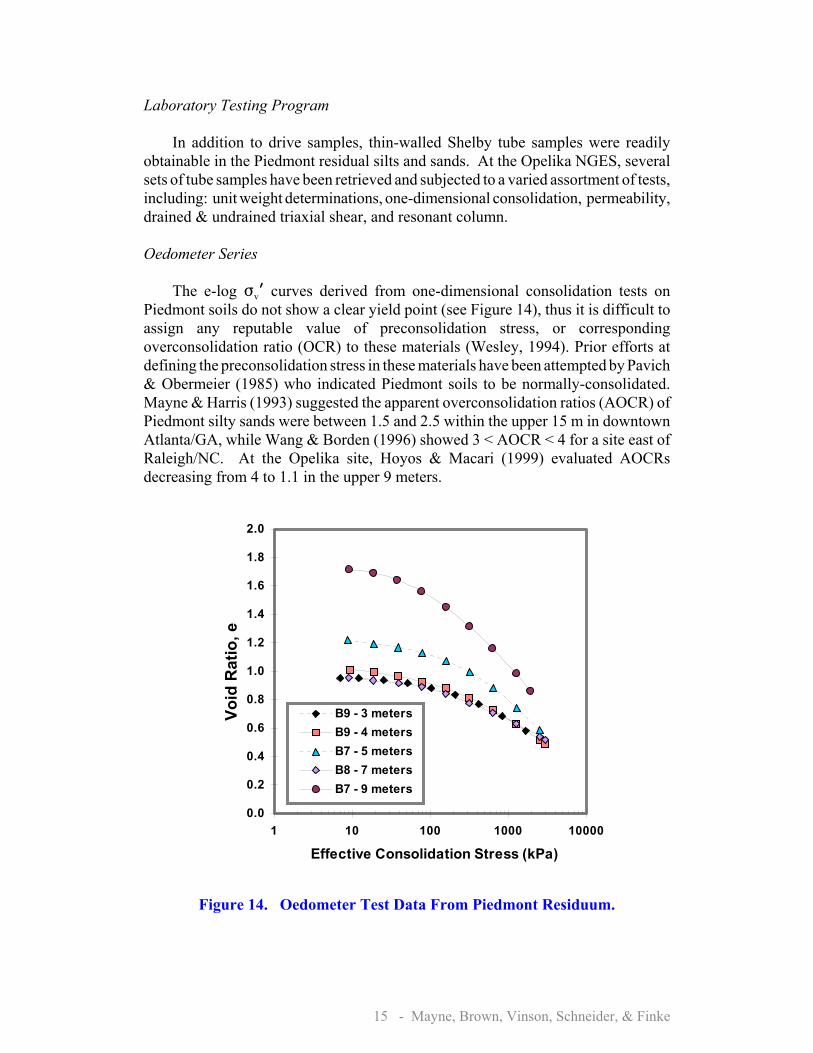
Oedometer Series
The e-log Fvr curves derived from one-dimensional consolidation tests onPiedmont soils do not show a clear yield point (see Figure 14), thus it is difficult toassign any reputable value of preconsolidation stress, or correspondingoverconsolidation ratio (OCR) to these materials (Wesley, 1994). Prior efforts atdefining the preconsolidation stress in these materials have been attempted by Pavich& Obermeier (1985) who indicated Piedmont soils to be normally-consolidated.Mayne & Harris (1993) suggested the apparent overconsolidation ratios (AOCR) ofPiedmont silty sands were between 1.5 and 2.5 within the upper 15 m in downtownAtlanta/GA, while Wang & Borden (1996) showed 3 < AOCR < 4 for a site east ofRaleigh/NC. At the Opelika site, Hoyos & Macari (1999) evaluated AOCRsdecreasing from 4 to 1.1 in the upper 9 meters.
Figure 14. Oedometer Test Data From Piedmont Residuum.
16 - Mayne, Brown, Vinson, Schneider, & Finke
Since these geomaterials have formed inplace from the debonding of theunderlying parent rock, the mechanism is one that is opposite of the traditionalmaximum applied prestressing associated with increased overburden and subsequenterosion or glaciation (e.g. loading-unloading). The Piedmont soils are very old andit is likely that any any preconsolidation effects can likely be attributed to morerecent desiccation and groundwater fluctuations that have occurred since the primarydebonding events. Expected OCRs due to these latter mechanisms are in the rangeof 1.5 to 4.
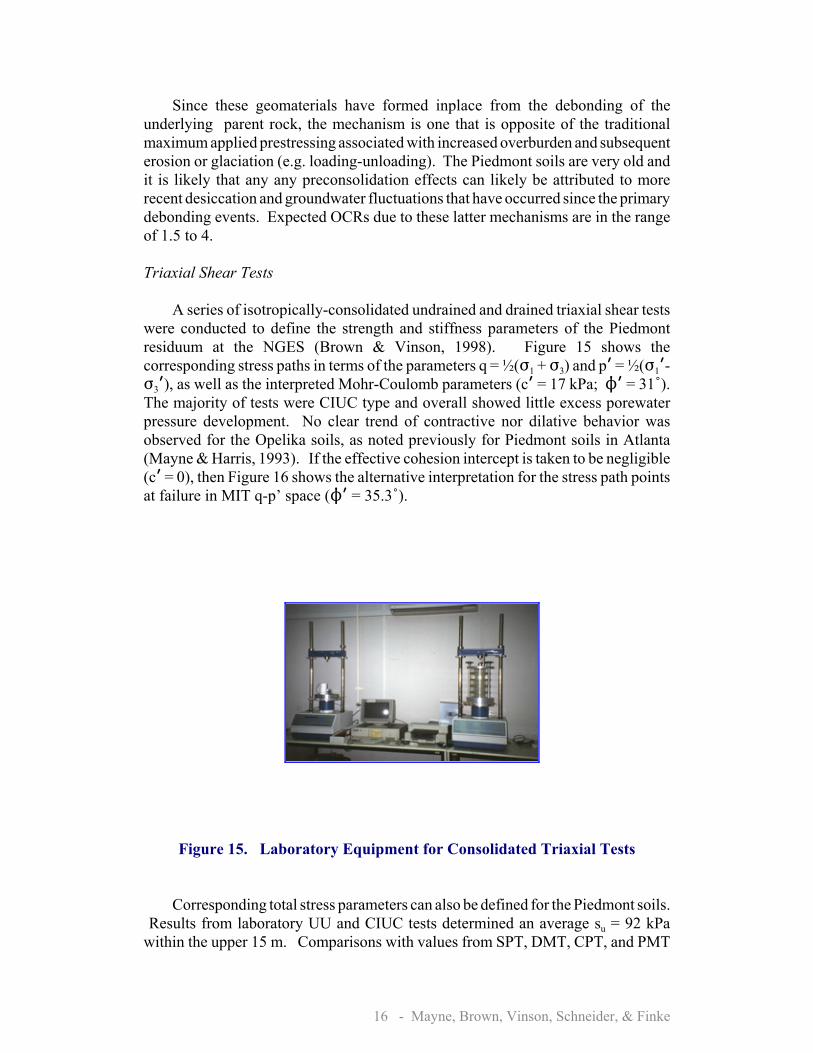
Triaxial Shear Tests
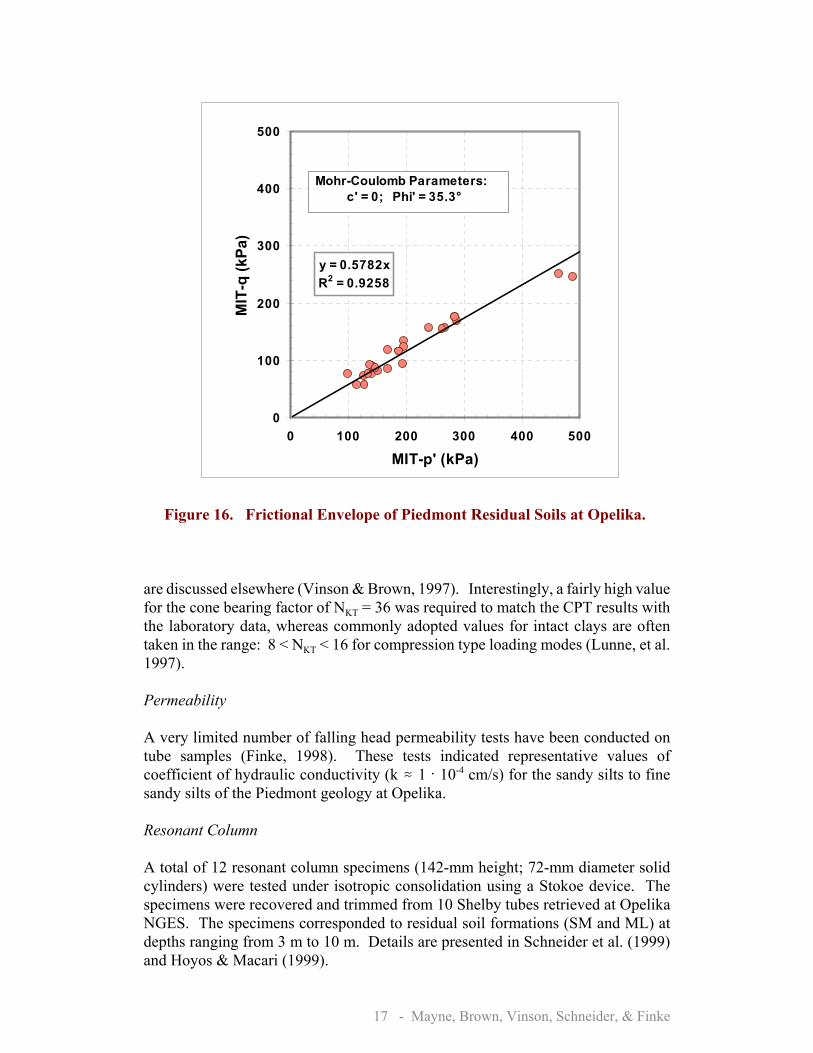
A series of isotropically-consolidated undrained and drained triaxial shear testswere conducted to define the strength and stiffness parameters of the Piedmontresiduum at the NGES (Brown & Vinson, 1998). Figure 15 shows thecorresponding stress paths in terms of the parameters q = ½(F1 + F3) and pr = ½(F1r-F3r), as well as the interpreted Mohr-Coulomb parameters (cr = 17 kPa; Nr = 31/).The majority of tests were CIUC type and overall showed little excess porewaterpressure development. No clear trend of contractive nor dilative behavior wasobserved for the Opelika soils, as noted previously for Piedmont soils in Atlanta(Mayne & Harris, 1993). If the effective cohesion intercept is taken to be negligible(cr = 0), then Figure 16 shows the alternative interpretation for the stress path pointsat failure in MIT q-p� space (Nr = 35.3/).
Figure 15. Laboratory Equipment for Consolidated Triaxial Tests
Corresponding total stress parameters can also be defined for the Piedmont soils. Results from laboratory UU and CIUC tests determined an average su = 92 kPawithin the upper 15 m. Comparisons with values from SPT, DMT, CPT, and PMT
17 - Mayne, Brown, Vinson, Schneider, & Finke
y = 0.5782xR2 = 0.9258
0
100
200
300
400
500
0 100 200 300 400 500
MIT-p' (kPa)
MIT
-q (k
Pa)
Mohr-Coulomb Parameters: c' = 0; Phi' = 35.3°
Figure 16. Frictional Envelope of Piedmont Residual Soils at Opelika.
are discussed elsewhere (Vinson & Brown, 1997). Interestingly, a fairly high valuefor the cone bearing factor of NKT = 36 was required to match the CPT results withthe laboratory data, whereas commonly adopted values for intact clays are oftentaken in the range: 8 < NKT < 16 for compression type loading modes (Lunne, et al.1997).
Permeability
A very limited number of falling head permeability tests have been conducted ontube samples (Finke, 1998). These tests indicated representative values ofcoefficient of hydraulic conductivity (k . 1 A 10-4 cm/s) for the sandy silts to finesandy silts of the Piedmont geology at Opelika.
Resonant Column
A total of 12 resonant column specimens (142-mm height; 72-mm diameter solidcylinders) were tested under isotropic consolidation using a Stokoe device. Thespecimens were recovered and trimmed from 10 Shelby tubes retrieved at OpelikaNGES. The specimens corresponded to residual soil formations (SM and ML) atdepths ranging from 3 m to 10 m. Details are presented in Schneider et al. (1999)and Hoyos & Macari (1999).
18 - Mayne, Brown, Vinson, Schneider, & Finke
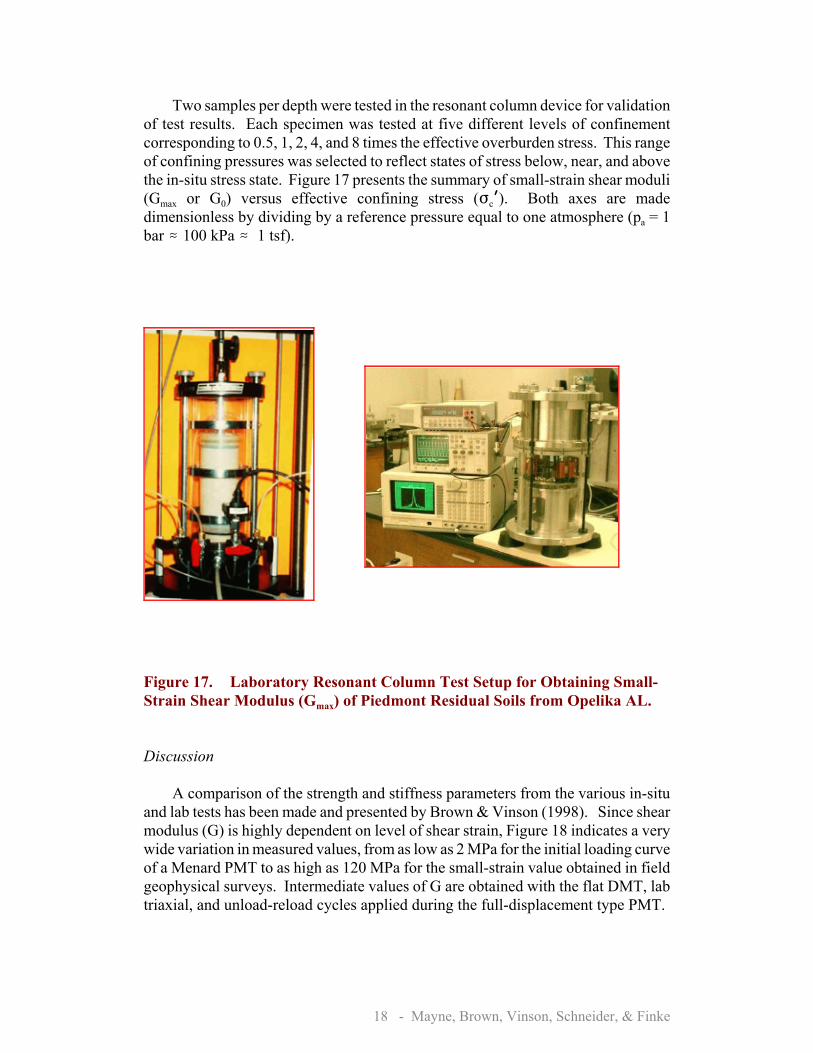
Two samples per depth were tested in the resonant column device for validationof test results. Each specimen was tested at five different levels of confinementcorresponding to 0.5, 1, 2, 4, and 8 times the effective overburden stress. This rangeof confining pressures was selected to reflect states of stress below, near, and abovethe in-situ stress state. Figure 17 presents the summary of small-strain shear moduli(Gmax or G0) versus effective confining stress (Fcr). Both axes are madedimensionless by dividing by a reference pressure equal to one atmosphere (pa = 1bar . 100 kPa . 1 tsf).
Figure 17. Laboratory Resonant Column Test Setup for Obtaining Small-Strain Shear Modulus (Gmax) of Piedmont Residual Soils from Opelika AL.
Discussion
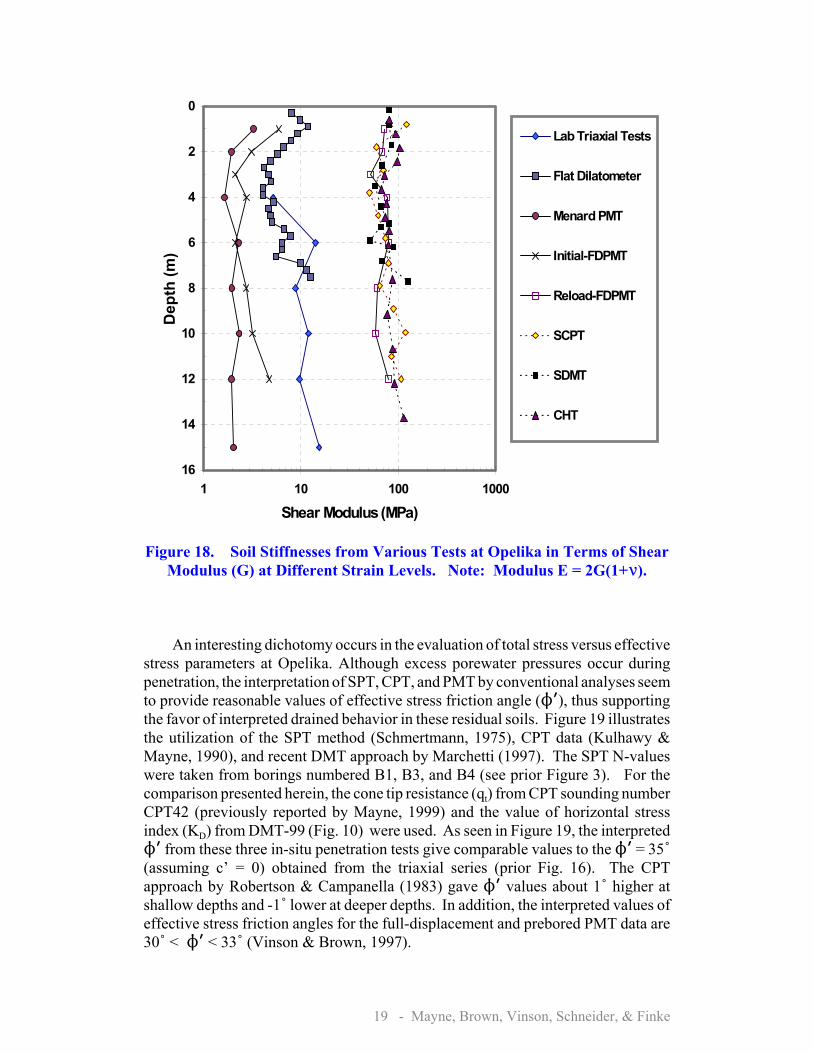
A comparison of the strength and stiffness parameters from the various in-situand lab tests has been made and presented by Brown & Vinson (1998). Since shearmodulus (G) is highly dependent on level of shear strain, Figure 18 indicates a verywide variation in measured values, from as low as 2 MPa for the initial loading curveof a Menard PMT to as high as 120 MPa for the small-strain value obtained in fieldgeophysical surveys. Intermediate values of G are obtained with the flat DMT, labtriaxial, and unload-reload cycles applied during the full-displacement type PMT.
19 - Mayne, Brown, Vinson, Schneider, & Finke
0
2
4
6
8
10
12
14
161 10 100 1000
Shear Modulus (MPa)
Dep
th (m
)
Lab Triaxial Tests
Flat Dilatometer
Menard PMT
Initial-FDPMT
Reload-FDPMT
SCPT
SDMT
CHT
Figure 18. Soil Stiffnesses from Various Tests at Opelika in Terms of ShearModulus (G) at Different Strain Levels. Note: Modulus E = 2G(1+<).
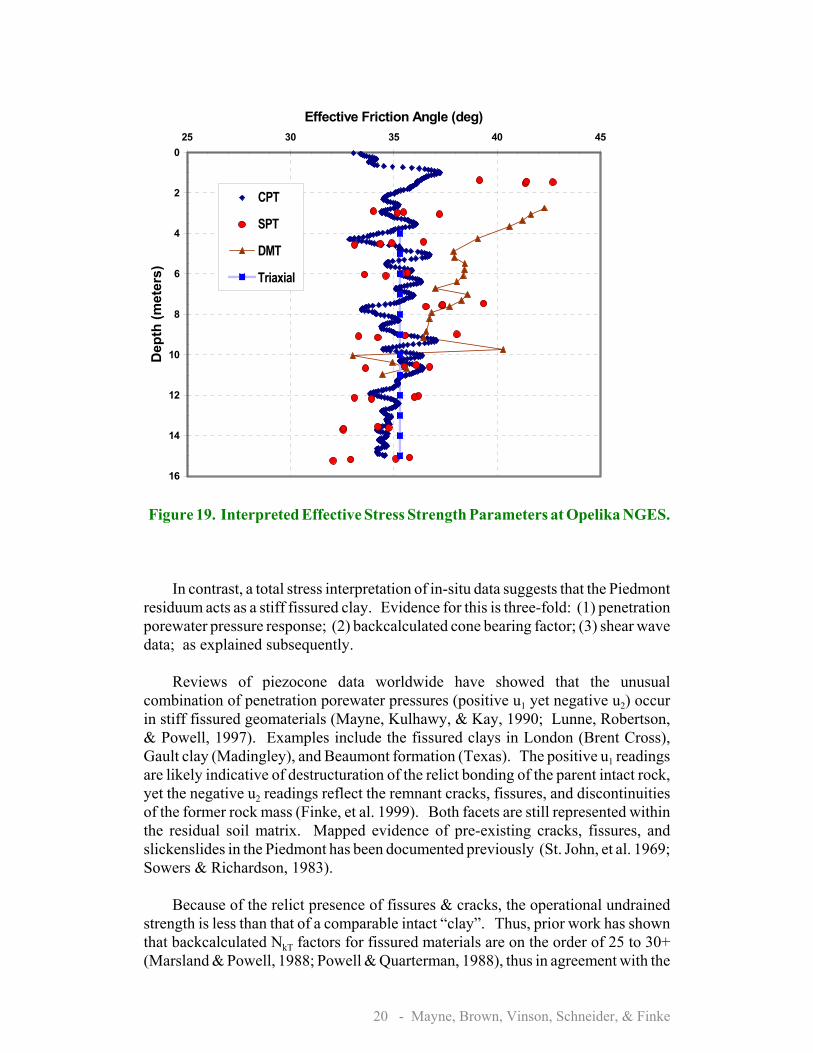
An interesting dichotomy occurs in the evaluation of total stress versus effectivestress parameters at Opelika. Although excess porewater pressures occur duringpenetration, the interpretation of SPT, CPT, and PMT by conventional analyses seemto provide reasonable values of effective stress friction angle (Nr), thus supportingthe favor of interpreted drained behavior in these residual soils. Figure 19 illustratesthe utilization of the SPT method (Schmertmann, 1975), CPT data (Kulhawy &Mayne, 1990), and recent DMT approach by Marchetti (1997). The SPT N-valueswere taken from borings numbered B1, B3, and B4 (see prior Figure 3). For thecomparison presented herein, the cone tip resistance (qt) from CPT sounding numberCPT42 (previously reported by Mayne, 1999) and the value of horizontal stressindex (KD) from DMT-99 (Fig. 10) were used. As seen in Figure 19, the interpretedNr from these three in-situ penetration tests give comparable values to the Nr = 35/(assuming c� = 0) obtained from the triaxial series (prior Fig. 16). The CPTapproach by Robertson & Campanella (1983) gave Nr values about 1/ higher atshallow depths and -1/ lower at deeper depths. In addition, the interpreted values ofeffective stress friction angles for the full-displacement and prebored PMT data are30/ < Nr < 33/ (Vinson & Brown, 1997).
20 - Mayne, Brown, Vinson, Schneider, & Finke
0
2
4
6
8
10
12
14
16
25 30 35 40 45
Effective Friction Angle (deg)
Dep
th (m
eter
s)
CPT
SPT
DMT
Triaxial
Figure 19. Interpreted Effective Stress Strength Parameters at Opelika NGES.
In contrast, a total stress interpretation of in-situ data suggests that the Piedmontresiduum acts as a stiff fissured clay. Evidence for this is three-fold: (1) penetrationporewater pressure response; (2) backcalculated cone bearing factor; (3) shear wavedata; as explained subsequently.
Reviews of piezocone data worldwide have showed that the unusualcombination of penetration porewater pressures (positive u1 yet negative u2) occurin stiff fissured geomaterials (Mayne, Kulhawy, & Kay, 1990; Lunne, Robertson,& Powell, 1997). Examples include the fissured clays in London (Brent Cross),Gault clay (Madingley), and Beaumont formation (Texas). The positive u1 readingsare likely indicative of destructuration of the relict bonding of the parent intact rock,yet the negative u2 readings reflect the remnant cracks, fissures, and discontinuitiesof the former rock mass (Finke, et al. 1999). Both facets are still represented withinthe residual soil matrix. Mapped evidence of pre-existing cracks, fissures, andslickenslides in the Piedmont has been documented previously (St. John, et al. 1969;Sowers & Richardson, 1983).
Because of the relict presence of fissures & cracks, the operational undrainedstrength is less than that of a comparable intact �clay�. Thus, prior work has shownthat backcalculated NkT factors for fissured materials are on the order of 25 to 30+(Marsland & Powell, 1988; Powell & Quarterman, 1988), thus in agreement with the
21 - Mayne, Brown, Vinson, Schneider, & Finke
0
2
4
6
8
10
12
14
16
0 50 100 150 200 250 300
Undrained Shear Strength for TC (kPa)
Dep
th (m
eter
s)
CPT
SPT
DMT
Triaxial
TC = Triaxial Compression M ode
values obtained by Brown & Vinson (1998). It is important to cite the specific modeof undrained shear under consideration (i.e., triaxial, simple shear, plane strain) anddirection of loading (i.e., compression vs. extension), as the undrained shear strength(su) depends significantly on these facets, as well as the effects of strain rate,anisotropic stress state, and other factors (Kulhawy & Mayne, 1990).
Figure 20 shows the undrained shear strengths (suTC) for triaxial compressionloading from reference laboratory CIUC tests compared with in-situ interpretationsbased on the CPT using a bearing factor Nkt = 35 (Lunne, et al. 1997), SPT (Stroud,1988), and DMT with Nc = 7 (Roque, et al. 1988). The overall average suTC fromUU and CIUC tests is 92 kPa at the Opelika site. The triaxial data shown herein areonly CIUC results performed at the current effective vertical overburden stresses.Surprisingly, the same SPT, CPT, and DMT data were used to generate both the totalstress parameters (Fig. 20) and effective stress parameters (Fig. 19), thus illustratingthe hermaphroditic strength characteristics of the Piedmont residuum.
Figure 20. Interpreted Undrained Shear Strengths at Opelika NGES.
22 - Mayne, Brown, Vinson, Schneider, & Finke
1
10
100
1000
1 10 100
Ratio Go/qt
Nor
mal
ized
Q =
(qt- σ
vo)/ σ
vo'
Sand Mixtures
SiltMixtures
Clays
Gravelly Sands
Sand
PiedmontResiduum
Young Uncemented
Soils
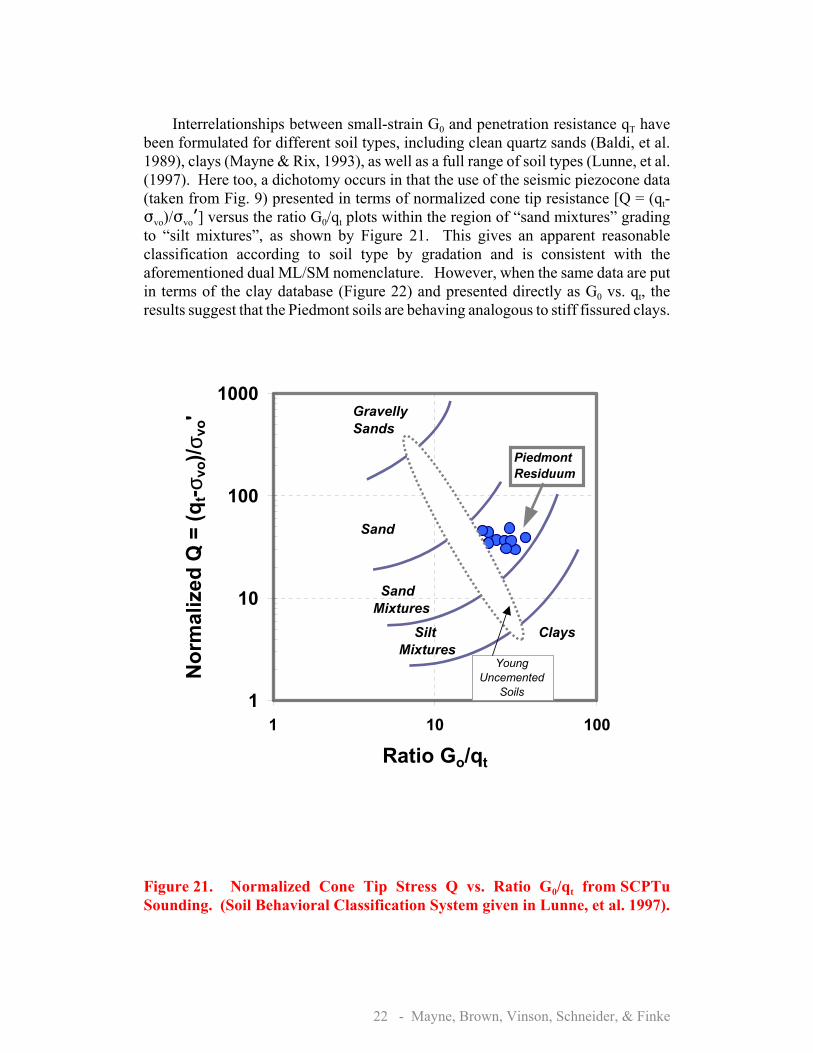
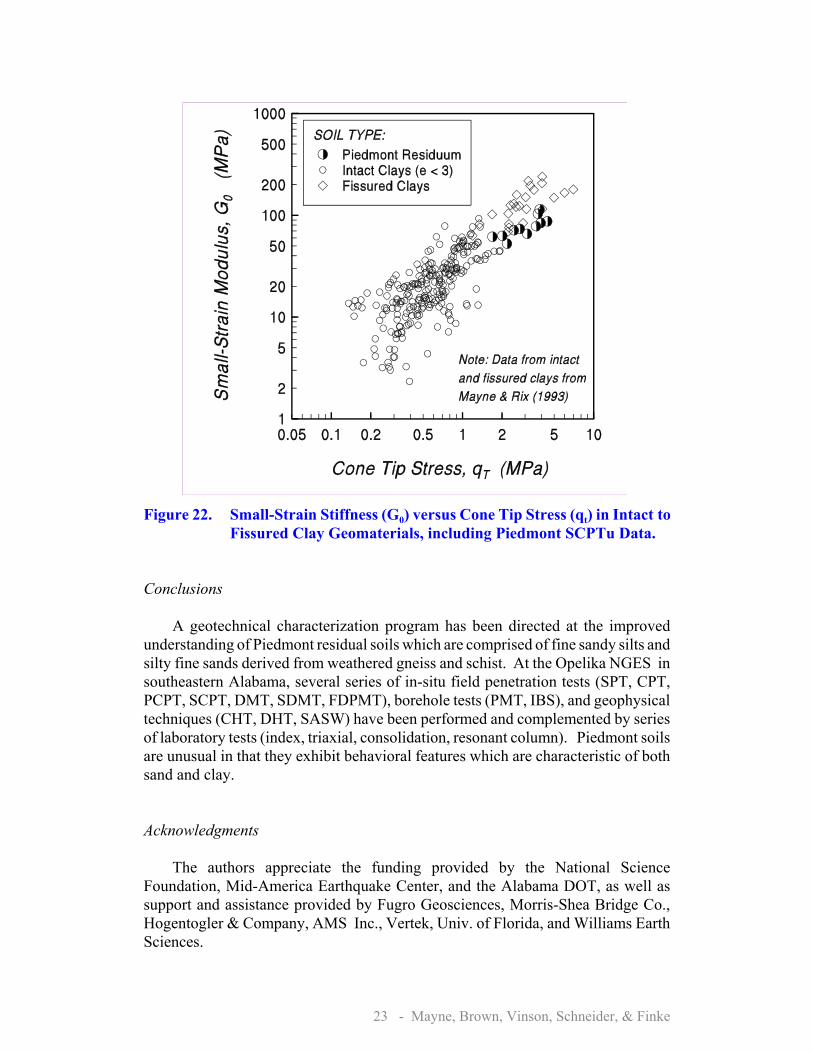
Interrelationships between small-strain G0 and penetration resistance qT havebeen formulated for different soil types, including clean quartz sands (Baldi, et al.1989), clays (Mayne & Rix, 1993), as well as a full range of soil types (Lunne, et al.(1997). Here too, a dichotomy occurs in that the use of the seismic piezocone data(taken from Fig. 9) presented in terms of normalized cone tip resistance [Q = (qt-Fvo)/Fvor] versus the ratio G0/qt plots within the region of �sand mixtures� gradingto �silt mixtures�, as shown by Figure 21. This gives an apparent reasonableclassification according to soil type by gradation and is consistent with theaforementioned dual ML/SM nomenclature. However, when the same data are putin terms of the clay database (Figure 22) and presented directly as G0 vs. qt, theresults suggest that the Piedmont soils are behaving analogous to stiff fissured clays.
Figure 21. Normalized Cone Tip Stress Q vs. Ratio G0/qt from SCPTuSounding. (Soil Behavioral Classification System given in Lunne, et al. 1997).
23 - Mayne, Brown, Vinson, Schneider, & Finke
Figure 22. Small-Strain Stiffness (G0) versus Cone Tip Stress (qt) in Intact toFissured Clay Geomaterials, including Piedmont SCPTu Data.
Conclusions
A geotechnical characterization program has been directed at the improvedunderstanding of Piedmont residual soils which are comprised of fine sandy silts andsilty fine sands derived from weathered gneiss and schist. At the Opelika NGES insoutheastern Alabama, several series of in-situ field penetration tests (SPT, CPT,PCPT, SCPT, DMT, SDMT, FDPMT), borehole tests (PMT, IBS), and geophysicaltechniques (CHT, DHT, SASW) have been performed and complemented by seriesof laboratory tests (index, triaxial, consolidation, resonant column). Piedmont soilsare unusual in that they exhibit behavioral features which are characteristic of bothsand and clay.
Acknowledgments
The authors appreciate the funding provided by the National ScienceFoundation, Mid-America Earthquake Center, and the Alabama DOT, as well assupport and assistance provided by Fugro Geosciences, Morris-Shea Bridge Co.,Hogentogler & Company, AMS Inc., Vertek, Univ. of Florida, and Williams EarthSciences.
24 - Mayne, Brown, Vinson, Schneider, & Finke
References
Baldi, G., Bellotti, R., Ghionna, V., Jamiolkowski, M., and LoPresti, D.C.F. (1989).Modulus of sands from CPT and DMT. Proceedings, 12th InternationalConference on Soil Mechanics & Foundation Engrg., Vol. 1, Rio, 165-170.
Borden, R.H., Shao, L, and Gupta, A. (1996). Dynamic properties of Piedmontresidual soils. Journal of Geotechnical & Geoenvironmental Engineering, Vol.122 (10), 813-821.
Brown, D.A. and Vinson, J. (1998) Comparison of strength and stiffness parametersfor a Piedmont residual soil, Geotechnical Site Characterization, Vol. 2, (Proc.ISC�98, Atlanta), Balkema, Rotterdam, 1229-1234.
Campanella, R.G. and Robertson, P.K. (1988). Current status of the piezocone test,Penetration Testing 1988, Vol. 1, Balkema Publishers, Rotterdam, 93-116.
Campanella, R.G. (1994). Field methods for dynamic geotechnical testing. DynamicGeotechnical Testing II, (STP 1213), ASTM, West Conshohocken, 3-23.
Finke, K.A. (1998). Piezocone penetration testing in Piedmont residual soils, MSThesis, School of Civil and Environmental Engineering, Georgia Institute ofTechnology, Atlanta, 265 p.
Finke, K.A. and Mayne, P.W. (1999). Piezocone tests in U.S. Atlantic Piedmontresidual soils. Proceedings, XI Pan American Conference on Soil Mechanics &Geotechnical Engineering, Vol. 1, Foz do Iguassu, Brazil, 329-334.
Finke, K.A., Mayne, P.W., and Klopp, R.A. (1999). Characteristic piezoconeresponse in Piedmont residual soils. Behavioral Characteristics of ResidualSoils, GSP No. 92, ASCE, Reston, VA, 1-11.
Harris, D.E., and Mayne, P.W. (1994). Axial compression behavior of two drilledshafts in Piedmont residual soils, Proceedings, International Conference onDesign and Construction of Deep Foundations, Vol. 2 (Orlando), FederalHighway Administration, Washington, D.C., 352-367.
Hoyos, L., Jr. and Macari, E.J. (1999). Influence of in-situ factors on dynamicresponse of Piedmont residual soils. Journal of Geotechnical and Geoenviron-mental Engineering, Vol. 125 (4), 271-279.
Kulhawy, F.H. and Mayne, P.W. (1990). Manual on Estimating Soil Properties forFoundation Design, Report EL-6800, Electric Power Research Institute, PaloAlto, 306 p.
Lunne, T., Powell, J.J.M., and Robertson, P.K. (1996). Use of piezocone tests innon-textbook materials, Advances in Site Investigation Practice, Thomas Telford,London, 438-451.
Lunne, T., Robertson, P.K., and Powell, J.J.M. (1997). Cone Penetration Testing inGeotechnical Practice, Blackie Academic & Professional, Chapman and Hall,London, 312 p.
Lutenegger, A.J. (1988). Current status of the Marchetti dilatometer test. Penetration Testing 1988, Vol. 1, A.A. Balkema, Rotterdam, 137-155.
Marchetti, S. (1997). The flat dilatometer: design applications. Proceedings, ThirdGeotechnical Engineering Conference, Cairo University, Egypt, 1-25.
Marsland, A. and Powell, J.J.M. (1988). Investigation of cone penetration test inBritish clay. Penetration Testing in the U.K., Thomas Telford, London, 209-214.
25 - Mayne, Brown, Vinson, Schneider, & Finke
Martin, G.K., and Mayne, P.W. (1998). Seismic flat dilatometer tests in Piedmontresidual soils, Geotechnical Site Characterization, Vol. 2, Balkema Rotterdam,837-843.
Martin, R.E. (1977). Estimating foundation settlements in residual soils, Journal ofthe Geotechnical Engineering Division, ASCE, Vol. 103 (GT3), 197-212.
Mayne, P.W. (1999). Site characterization aspects of Piedmont residual soils ineastern U.S. Proceedings, 14th Intl. Conf. on Soil Mechanics & FoundationEngineering, Vol. 4, Balkema/Rotterdam, 2191-2195.
Mayne, P.W. and Dumas, C. (1997). Enhanced in-situ geotechnical testing forbridge foundation analysis, Transportation Research Record, No. 1569, NationalAcademy Press, Washington, D.C., 26-35.
Mayne, P.W. and Harris, D.E. (1993). Axial load-displacement behavior of drilledshaft foundations in Piedmont residuum. Research Report No. E-20-X19 toFHWA by Georgia Tech Research Corp, Atlanta, 162 p.
Mayne, P.W., Kulhawy, F.H., and Kay, J.N. (1990). Observations on thedevelopment of porewater pressures during piezocone penetration in clays,Canadian Geotechnical Journal, Vol. 27, No. 4, 418-428.
Mayne, P.W., Mitchell, J.K., Auxt, J.A., and Yilmaz, R. (1995). U.S. national reporton CPT. Proceedings, Symposium on Cone Penetration Testing, Vol. 1, SwedishGeotechnical Society, Linkoping, 263-276.
Mayne, P.W. and Rix, G.J. (1993). Gmax-qc relationships for clays. ASTMGeotechnical Testing Journal, Vol. 16 (1), 54-60.
Mayne, P.W. , Schneider, J.A., and Martin, G.K. (1999). Small- and large-strain soilproperties from seismic flat dilatometer tests. Pre-Failure DeformationCharacteristics of Geomaterials, Vol. 1, (Proceedings, Torino�99), Balkema,Rotterdam, 419-426.
Pavich, M.J. and Obermeier, S.F. (1985). Saprolite formation beneath coastal plainsediments near Washington, D.C., Geological Society of America Bulletin, Vol.96, 886-900.
Powell, J.J.M and Quarterman, R.S.T. (1988). The interpretation of cone penetrationtests in clays, with particular reference to rate effects. Penetration Testing 1988,Vol. 2, Balkema, Rotterdam, 903-909.
Robertson, P.K and Campanella, R.G. (1983). Interpretation of cone penetrationtests in sand, Canadian Geotechnical Journal, Vol. 20 (4), 718-733.
Roque, R., Janbu, N., and Senneset, K. (1988). Basic interpretation procedures offlat dilatometer tests. Penetration Testing 1988, Vol. 1, (Proceedings, ISOPT-1,Orlando), Balkema, Rotterdam, 577-587.
Schneider, J.A., Hoyos, L., Mayne, P.W., Macari, E.J., and Rix, G.J. (1999). Fieldand lab measurements of dynamic shear modulus of Piedmont residual soils.Behavioral Characteristics of Residual Soils (GSP 92), ASCE, Reston, 12-25.
Sowers, G.F. (1994). Residual soil settlement related to the weathering profile.Vertical and Horizontal Deformations of Foundations and Embankments, GSPNo. 40, Vol. 2, ASCE, New York, 1689-1702.
26 - Mayne, Brown, Vinson, Schneider, & Finke
Sowers, G.F. and Richardson, T.L. (1985). Residual soils of the Piedmont and BlueRidge, Transportation Research Record No. 919, National Academy Press,Washington, D.C., 10-16.
St. John, B.J., Sowers, G.F. and Weaver, C.E. (1969). Proceedings, 7th InternationalConference on Soil Mechanics and Foundation Engineering, Vol. 2, Mexico,City, 591-597.
Stroud, M.A. (1974). The standard penetration test in insensitive clays and softrocks. Proceedings, European Conference on Penetration Testing, Vol. 2 (2),Stockholm, 367-375.
Vinson, J.L and Brown, D.A. (1997). Site characterization of the Spring Villageotechnical test site and a comparison of strength and stiffness parameters fora Piedmont residual soil, Report No. IR-97-04, Highway Research Center,Harbert Engineering Center, Auburn University, AL, 385 p.
Wang, C.E. and Borden, R.H. (1996). Deformation characteristics of Piedmontresidual soils. Journal of Geotechnical Engineering, Vol. 122 (10), 822-830.
Wesley, L.D. (1994). The use of consolidometer tests to estimate settlement inresidual soil. Proceedings, XIII Intl. Conf. on Soil Mechanics & FoundationEngrg., Vol. 2, New Delhi, 929-934.