200
U.S. DEPARTMENT OF ENERGY STRATEGIC PETROLEUM RESERVE PROJECT MANAGEMENT OFFICE NEW ORLEANS, LOUISIANA Site Environmental Report For Calendar Year 2011

U.S. DEPARTMENT OF ENERGY
STRATEGIC PETROLEUM RESERVE PROJECT MANAGEMENT OFFICE NEW ORLEANS, LOUISIANA
Site Environmental Report For
Calendar Year 2011

COVER: The Purple Gallinule, Porphyrio martinica. Photo by Steve Crawford, Big Hill. This species is a summer resident of coastal Texas and Louisiana. Its long toes make it possible to
walk on lily pads – one of the few birds able to do so. The SPR prides itself in environmental stewardship and maintains a high standard for ensuring
the sustainability of surrounding habitats.

STRATEGIC PETROLEUM RESERVE
SITE ENVIRONMENTAL REPORT
FOR
CALENDAR YEAR 2011
Document No. AAA9020459 Version 1.1
Typographical error in date on this page changed from 2010 to 2011 (07/25/2013)
Prepared for the U. S. Department of Energy Strategic Petroleum Reserve Project Management Office
under Contract No. DE-AC96-93PO92207
DM Petroleum Operations Company 850 South Clearview Parkway
New Orleans, Louisiana 70123

This page intentionally blank


This page intentionally blank

QUESTIONNAIRE/READER COMMENT FORM
Please submit your questions/comments on a photocopy of this page and forward it to the following address:
DM Petroleum Operations Company Environmental Department, EF-20 850 South Clearview Parkway New Orleans, LA 70123
A copy of your comments will be sent to the originator for response.
Date: ________________
Name of Submitter:______________________________________________________
Street or P.O. Box: ______________________________________________________
City/State/Zip code: _____________________________________________________
Organization (if applicable): _______________________________________________
Comments:
________________________________________________________________________
________________________________________________________________________
________________________________________________________________________
________________________________________________________________________
________________________________________________________________________
________________________________________________________________________
(Attach other sheets as needed) (for originator’s use)
Subject Matter Expert (SME): ___________________________ Date: _______________
SME’s Response:__________________________________________________________
________________________________________________________________________
________________________________________________________________________
________________________________________________________________________

This page intentionally blank

AAA9020459 Version 1.0 Page i
TABLE OF CONTENTS
Section Title Page EXECUTIVE SUMMARY xi 1. INTRODUCTION 1-1 1.1 BAYOU CHOCTAW 1-2 1.2 BIG HILL 1-2 1.3 BRYAN MOUND 1-2 1.4 ST. JAMES TERMINAL 1-3 1.5 WEST HACKBERRY 1-3 1.6 SPR HEADQUARTERS 1-3 1.7 STENNIS WAREHOUSE 1-3 2. COMPLIANCE SUMMARY 2-1 2.1 COMPLIANCE STATUS (JAN. 1, 2011 THROUGH DEC. 31, 2011) 2-3 2.2 MAJOR ENVIRONMENTAL ISSUES AND ACTIONS 2-15 2.3 SUMMARY OF PERMITS (JAN. 1, 2011 THROUGH DEC. 31, 2011) 2-20 2.4 SUCCESS IN MEETING PERFORMANCE MEASURES 2-23 3. ENVIRONMENTAL PROGRAM INFORMATION 3-1 3.1 ASSOCIATED PLANS AND PROCEDURES 3-1 3.2 REPORTING 3-1 3.2.1 Spill Reporting 3-2 3.2.2 Discharge Monitoring Reports 3-2 3.2.3 Other Reports 3-2 3.3 ENVIRONMENTAL PERMITS 3-6 3.3.1 Bayou Choctaw 3-7 3.3.2 Big Hill 3-8 3.3.3 Bryan Mound 3-9 3.3.4 St. James 3-11 3.3.5 Stennis Warehouse 3-11 3.3.6 Weeks Island 3-11 3.3.7 West Hackberry 3-11 3.4 WASTE MINIMIZATION PROGRAM 3-13 3.5 POLLUTION PREVENTION (P2) 3-14 3.6 SUSTAINABILITY PROGRAM 3-15 3.7 INTEGRATED SAFETY MANAGEMENT (ISM) 3-17 3.8 ENVIRONMENTAL MANAGEMENT SYSTEM (EMS) 3-17 3.9 TRAINING 3-17 3.10 ES&H WEBSITE 3-18 4. ENVIRONMENTAL RADIOLOGICAL PROGRAM INFORMATION 4-1 4.1 SEALED SOURCES 4-1 4.2 NATURALLY OCCURRING RADIOACTIVE MATERIALS 4-1
AAA9020459 Version 1.0 Page ii
TABLE OF CONTENTS (continued)
Section Title Page 5. ENVIRONMENTAL NON-RADIOLOGICAL PROGRAM INFORMATION 5-1 5.1 ENVIRONMENTAL MANAGEMENT SYSTEM 5-1 5.2 PROTECTION OF BIOTA 5-1 5.3 AIR QUALITY MONITORING 5-2 5.3.1 Bayou Choctaw 5-3 5.3.2 Big Hill 5-3 5.3.3 Bryan Mound 5-4 5.3.4 West Hackberry 5-4 5.4 WATER DISCHARGE EFFLUENT MONITORING 5-5 5.4.1 Bayou Choctaw 5-6 5.4.2 Big Hill 5-6 5.4.3 Bryan Mound 5-7 5.4.4 West Hackberry 5-8 5.5 SURFACE WATER QUALITY SURVEILLANCE MONITORING 5-9 5.5.1 Bayou Choctaw 5-9 5.5.2 Big Hill 5-11 5.5.3 Bryan Mound 5-13 5.5.4 West Hackberry 5-15 6. SITE HYDROLOGY, GROUNDWATER MONITORING AND DRINKING
WATER PROTECTION 6-1 6.1 BAYOU CHOCTAW 6-1 6.2 BIG HILL 6-4 6.3 BRYAN MOUND 6-6 6.4 ST. JAMES 6-10 6.5 WEST HACKBERRY 6-10 7. QUALITY ASSURANCE 7-1 7.1 FIELD QUALITY CONTROL 7-1 7.2 DATA MANAGEMENT 7-1 7.3 PERFORMANCE EVALUATION SAMPLES 7-1 7.4 SPR LABORATORY ACCURACY AND PRECISION PROGRAM 7-2 7.5 CONTROL OF SUBCONTRACTOR LABORATORY QUALITY
ASSURANCE 7-2 APPENDIX A-1: SPR DM ES&H Standards APPENDIX A-2: SPRPMO ES&H Directives
APPENDIX B: SPR Environmental Policy APPENDIX C: Environmental Management System Environmental Management
Programs for 2011
AAA9020459 Version 1.0 Page iii
TABLE OF CONTENTS (continued)
Section Title Page APPENDIX D: Surface Water Quality Surveillance Monitoring
During 2011 APPENDIX E: Ground Water Surveillance Monitoring During 2011 REFERENCES DISTRIBUTION
LIST OF FIGURES
Figure Title Page 2-1 FY 2011 Monthly Hazardous Waste Generation 2-9 2-2 SPR Hazardous Waste Generation FY 1993 to FY 2011 2-9 2-3 Number of Reportable Crude Oil and Brine Spills 1990-2011 2-19 2-4 SPR Environmental Project Events 1986-2011 2-22 2-5 Number of Violations 1991-2011 2-22 D-1 Bayou Choctaw Environmental Monitoring Stations D-1 D-2 Big Hill Environmental Monitoring Stations D-4 D-3 Bryan Mound Environmental Monitoring Stations D-6 D-4 West Hackberry Environmental Monitoring Stations D-9 E-1 Bayou Choctaw Ground Water Monitoring Stations E-2 E-2 Bayou Choctaw Ground Water Contoured Elevations Spring 2011 E-3 E-3 Bayou Choctaw Ground Water Monitoring Well Salinities E-4 E-4 Big Hill Ground Water Monitoring Stations E-8 E-5 Big Hill Ground Water Contoured Elevations Spring 2011 E-9 E-6 Big Hill Ground Water Monitoring Well Salinities E-10 E-7 Bryan Mound Ground Water Monitoring Stations, Deep and Shallow E-14 E-8 Bryan Mound Shallow Ground Water Zone Contoured Elevations
Spring 2011 E-15 E-9 Bryan Mound Deep Ground Water Zone Contoured Elevations Spring 2011 E-16 E-10 Bryan Mound Ground Water Monitoring Well Salinities E-17 E-11 West Hackberry Ground Water Monitoring Stations E-23 E-12 West Hackberry Shallow Ground Water Zone Contoured Elevations
Spring 2011 E-24 E-13 West Hackberry Deep Ground Water Zone Contoured Elevations
Spring 2011 E-25 E-14 West Hackberry Ground Water Monitoring Well Salinities E-26
LIST OF TABLES Tables Title Page 2-1 2011 LA SARA Title III Tier Two Summary at Bayou Choctaw 2-13 2-2 2011 TX SARA Title III Tier Two Summary at Big Hill 2-13 2-3 2011 MS SARA Title III Tier Two Summary at Stennis Warehouse 2-14

AAA9020459 Version 1.0 Page iv
2-4 2011 TX SARA Title III Tier Two Summary at Bryan Mound 2-14 2-5 2011 LA SARA Title III Tier Two Summary in Offsite Pipelines 2-14 2-6 2011 LA SARA Title III Tier Two Summary at West Hackberry 2-14 2-7 FY 2011 M&O Contractor Organizational Assessment Environmental
Findings and Non-Conformances 2-17 2-8 Summary of Regulatory and Third Party Inspections/Visits During 2011 2-18 2-9 Number of Reportable Crude Oil Spills 2-19 2-10 Number of Reportable Brine Spills 2-20 2-11 FY 2011 Objectives and Targets with Performance 2-25 2-12 FY11 SSP Supporting Objectives and Targets with Performance 2-30 3-1 Federal, State, and Local Regulatory Reporting Requirements 3-3 3-2 Permits at Bayou Choctaw 3-7 3-3 Permits at Big Hill 3-9 3-4 Permits at Bryan Mound 3-10 3-5 Permits at Weeks Island 3-11 3-6 Permits at West Hackberry 3-12 3-7 2011 Materials Recycled from all SPR Sites 3-13 5-1 Parameters for the Bayou Choctaw Emission Points 5-3 5-2 Parameters for the Big Hill Emission Points 5-3 5-3 Parameters for the Bryan Mound 5-4 5-4 Parameters for the West Hackberry Emission Points 5-5 5-5 Parameters for the Bayou Choctaw Outfalls 5-6 5-6 Parameters for the Big Hill Outfalls 5-7 5-7 Parameters for the Bryan Mound Outfalls 5-8 5-8 Parameters for the West Hackberry Outfalls 5-9 7-1 SPR Wastewater Analytical Methodology 7-3 D-1 2011 Data Summary for Bayou Choctaw Monitoring Stations D-2 D-2 2011 Data Summary for Big Hill Monitoring Stations D-5 D-3 2011 Data Summary for Bryan Mound Monitoring Stations D-7 D-4 2011 Data Summary for West Hackberry Monitoring Stations D-10
ABBREVIATIONS AND ACRONYMS
A&E Architect and Engineer AFFF aqueous film forming foam AGSC ASRC Gulf States Constructors, LLC ANAB ANSI-ASQ National Accreditation Board ANSI American National Standards Institute AP Affirmative Procurement APHA American Public Health Association ASQ American Society for Quality ASRC Artic Slope Regional Corporation ASTM American Society for Testing and Materials ATS Assessment Tracking System avg average

AAA9020459 Version 1.0 Page v
ABBREVIATIONS AND ACRONYMS (continued)
bbl barrel (1 bbl = 42 gallons) BC Bayou Choctaw BDL below detectable limit BH Big Hill BIG Buy It Green bls below land surface BM Bryan Mound BOD
5 five day biochemical oxygen demand
C degrees Celsius CAA Clean Air Act CAP corrective action plan CB certification body CBT computer-based training CEQ Council for Environmental Quality CERCLA Comprehensive Environmental Response, Compensation, and Liability Act CESQG conditionally exempt small quantity generator CFS cubic feet per second CFR Code of Federal Regulations CO carbon monoxide COD chemical oxygen demand COE United States Army Corps of Engineers CPG Comprehensive Procurement Guidelines CV coefficient of variation CWA Clean Water Act CY calendar year DM DynMcDermott Petroleum Operations Company DMR discharge monitoring report DO dissolved oxygen DOE United States Department of Energy DOT United States Department of Transportation E&P Exploration and Production EA environmental assessment EFCOG Energy Facility Contractors Group EFH East Fillhole EIQ emissions inventory questionnaire EIS emissions inventory summary EIS environmental impact statement EMP Environmental Monitoring Plan EMS Environmental Management System EO executive order EOT Extension of Time EPA United States Environmental Protection Agency EPACT Energy Policy Act EPCRA Emergency Planning and Community Right-to-Know Act EPEAT Electronic Product Environmental Assessment Tool ERP Emergency Response Procedure ERT emergency response team ESA Endangered Species Act ES&H Environmental Safety & Health E-W East-West FEMP Federal Energy Management Program FFCA Federal Facilities Compliance Act FIFRA Federal Insecticide, Fungicide, and Rodenticide Act

AAA9020459 Version 1.0 Page vi
ABBREVIATIONS AND ACRONYMS (continued)
fps feet per second FRP Facility Response Plan ft feet ft/yr feet per year F&WS United States Fish and Wildlife Service FY Fiscal Year GALCOE U.S. Army Corps of Engineers, Galveston District GHG Green House Gas GLO General Land Office gpd gallons per day GSA General Services Administration GWPMP Ground Water Protection and Management Plan HAP hazardous air pollutant HW hazardous waste ICW Intracoastal Waterway ISM Integrated Safety Management ISO International Organization for Standardization LA Louisiana LAC Louisiana Administrative Code lbs pounds LCF Light Commercial Facility LCMS Lake Charles Meter Station LDEQ Louisiana Department of Environmental Quality LDHH Louisiana Department of Health and Hospitals LDNR Louisiana Department of Natural Resources LPDES Louisiana Pollutant Discharge Elimination System m meters
m3 cubic meters
ml milliliters m/yr meters per year max maximum MCL maximum contaminant levels MDEQ Mississippi Department of Environmental Quality MDR maximum diversion rate mg/l milligrams per liter mmb million barrels MPAR Maintenance Performance Appraisal Report m/sec meters per second M&O management & operating MS Mississippi MSDS Material Safety Data Sheets MSGP multi-sector general permit mt metric tons MW monitoring well N north NAAQS National Ambient Air Quality Standards NAEP National Association of Environmental Professionals NE northeast NEPA National Environmental Policy Act NFAATT No Further Action At This Time NFRAP No Further Remedial Action Planned NHPA National Historic Preservation Act NIMS National Incident Management System

AAA9020459 Version 1.0 Page vii
ABBREVIATIONS AND ACRONYMS (continued)
NO New Orleans NODCOE U.S. Army Corps of Engineers, New Orleans District NOEC No Observed Effect Concentration NOI Notice of Intent NORM naturally occurring radioactive material NOV notice of violation NOx nitrogen oxide NPDES National Pollutant Discharge Elimination System NPL National Priority List (CERCLA) N-S North-South NSR new source review NW northwest NWP nationwide permit OCC Operations Control Center O&G oil and grease OPA Oil Pollution Act of 1990 OSPRA Oil Spill Prevention and Response Act OVA organic vapor analyzer P2 Pollution Prevention PCB polychlorinated biphenyl PE performance evaluation pH negative logarithm of the hydrogen ion concentration PM
10 particulate matter (less than 10 microns)
PMO Project Management Office PPA Pollution Prevention Act of 1990 PPOA Pollution Prevention Opportunity Assessment PPP Pollution Prevention Plan ppt parts per thousand PREP Preparedness for Response Exercise Program PSD prevention of significant deterioration PSI pounds per square inch PVC Polyvinyl Chloride PW periphery well PZ piezometer QC quality control QPL Qualified Products List RAB Registrar Accreditation Board RCRA Resource Conservation and Recovery Act RCT Railroad Commission of Texas REC Recognized Environmental Concern RECAP Risk Evaluation Corrective Action Program ROD Record of Decision RWIS raw water intake structure S south SAL salinity SARA Superfund Amendments and Reauthorization Act SDWA Safe Drinking Water Act SE southeast SER Site Environmental Report SIC Standard Industrial Classification SIP state implementation plan SO
2 sulfur dioxide
SOC security operations center
AAA9020459 Version 1.0 Page viii
ABBREVIATIONS AND ACRONYMS (continued)
SPCC Spill Prevention Control and Countermeasures SPR Strategic Petroleum Reserve SPRPMO Strategic Petroleum Reserve Project Management Office SQG small quantity generator STP sewage treatment plant s.u. standard units SW southwest SWPPP Storm Water Pollution Prevention Plan TCEQ Texas Commission on Environmental Quality TCLP Toxicity Characteristic Leaching Procedure TDH&PT Texas Department of Highways and Public Transportation TDS total dissolved solids TNRCC Texas Natural Resource Conservation Commission TOC total organic carbon TPQ threshold planning quantity TPWD Texas Parks and Wildlife Department tpy tons per year TRI Toxic Release Inventory TSCA Toxic Substance Control Act TSD Treatment Storage Disposal TSS total suspended solids TVP True Vapor Pressure TX Texas UIC underground injection control URS United Research Services VOC volatile organic compound VWS Verification Well Study WCP Water Conservation Plan WAD Work Authorization Directive W west WH West Hackberry
VERSION HISTORY
Version History AAA9020.125., Site Environmental Report for Calendar Year 2011
VERSION DESCRIPTION EFFECTIVE DATE 1.0 New document. 09/30/2012
EXECUTIVE SUMMARY
The purpose of the annual Site Environmental Report (SER) is to characterize site environmental management performance, confirm compliance with environmental standards and requirements, and highlight significant programs and efforts for the U. S. Department of Energy (DOE) Strategic Petroleum Reserve (SPR). The SER serves the public by summarizing monitoring data collected to assess how the SPR impacts the environment. It provides a balanced synopsis of non-radiological monitoring and regulatory compliance data. It also affirms that the SPR has been operating within acceptable regulatory limits and illustrates the success of SPR efforts toward continual environmental improvement.

AAA9020459 Version 1.0 Page ix
The SER contains descriptions of each site's physical environment, an overview of the SPR environmental program, and a recapitulation of special environmental activities and events associated with each SPR site during 2011. It also characterizes environmental management performance and programs pertinent to the SPR. Each section discusses by site, active permits and the results of environmental monitoring programs. The SPRs quality assurance program is presented along with results from laboratory and field audits, and studies performed internally and by regulatory agencies. The SPR was the recipient of the DOE "EStar Award” in 2011 for the development of the Buy It Green (BIG) List which assists the sites in the procurement of green products. There were no reportable crude oil spills in 2011; however, there was one brine spill that totaled 12 barrels (1.90 m3). Reportable oil and brine spills have declined substantially, from 27 in 1990 to one in 2011. No Clean Air Act (CAA), Clean Water Act (CWA) or Resource Conservation and Recovery Act (RCRA) Notice of Violations (NOV) were received in 2011. SPR facilities in Louisiana, Mississippi and Texas continue to operate as Conditionally Exempt Small Quantity Generators (CESQG). The SPR is not a hazardous waste treatment, storage, or disposal facility. The Superfund Amendments and Reauthorization Act (SARA) Title III, Tier Two, reports listing the type and quantity of hazardous substances on SPR facilities were submitted to the appropriate agencies. The SPR facilities operate under the National Pollutant Discharge Elimination System (NPDES). The Louisiana Department of Environmental Quality (LDEQ) has primacy for the Louisiana Pollutant Discharge Elimination System (LPDES) program while the Railroad Commission of Texas (RCT), which has jurisdiction over SPR sites in Texas, does not. Consequently, at this time, there are dual federal and state discharge programs at the Texas sites. Also, each SPR site operates in accordance with a Storm Water Pollution Prevention Plan (SWPPP) prepared in accordance with a separately issued general permit for storm water associated with industrial activity or with language contained within the recently renewed federal discharge permits. The air quality programs at the SPR facilities are regulated by LDEQ and the Texas Commission on Environmental Quality (TCEQ) for the Louisiana and Texas sites respectively. The monitoring of air pollutants and the calculation of air emissions at the SPR indicated that all the sites operated in accordance with air quality regulatory requirements during CY 2011. The SPR management and operating contractor’s Environmental Management System (EMS) has been certified by a third party registrar against the International Organization for Standardization ISO 14001 standard since May 2000. Advanced Waste Management Systems, Inc., a third party certification body (CB), conducted ISO 14001 surveillance audits of the SPR EMS twice during 2011. One minor non-conformity from a previous audit remained open, and one new minor non-conformity was found. A Corrective Action Plan (CAP) was developed for both the non-conformities and they are both on track for closing in 2012. Neither non-conformity identified any evidence of environmental degradation. The third party surveillance audits resulted in the recommendation for continued certification and verified that the EMS remains suitable, adequate, and effective. Environmental compliance and management audits were conducted in-house and by outside entities during 2011. DOE Strategic Petroleum Reserve Project Management Office (SPRPMO) appraisal teams

AAA9020459 Version 1.0 Page x
conducted formal annual appraisals at all five sites, and the Stennis Warehouse. Audits included meeting with Management and Operations (M&O) staff, reviewing environmental practices and performance indicators, the EMS, and previous findings. There were 3 low risk environmental findings associated with the DOE SPRPMO audits; and no high or medium risk environmental findings, 3 low risk findings, and no low-risk EMS nonconformities during the internal M&O contractor environmental assessments. Low risk hazards are minor deviations for internal requirements and regulations. Three of the compliance findings remain open. The SPR EMS is fully implemented, operational, and effective as required by the ISO 14001 standard, DOE O 436.1 and the environmental management requirements of Executive Orders (EO) 13423 and 13514; in addition to strengthening the environmental leg of the SPR Integrated Safety Management (ISM) system. The Bayou Choctaw storage site, cavern 20 (BC-20) was identified as being high-risk for cavern integrity failure. The decision was made to empty BC-20 of oil, and allocate cavern 102 (BC-102) as the replacement. A Phase I Environmental Site Assessment of the BC-102 site was conducted, and resulted in no Recognized Environmental Concerns (REC). The cavern was acquired through land condemnation in November 2011. In 2008, the SPR sites in Texas implemented a multi-sensor caliper program to assess cavern integrity and identify any irregularities in storage wellhead components and casings; this was expanded in 2010 to include the Louisiana sites as well. In 2011 a total of 21 multiple arm caliper tests were performed at Big Hill, Bryan Mound, and West Hackberry, which resulted in a total of 5 remediations, two each at Big Hill, and West Hackberry, and one at Bryan Mound. Concern for the environment is integrated into daily activities through environmental management. In addition, adherence to the requirements of EO 13423 and EO 13514 has ensured that a high level environmental stewardship is maintained. The Questionnaire/Reader Comment Form located in the front of this document may be utilized to submit questions or comments to the originator.
End of Section
AAA9020459 Version 1.0 Section 1 - Page 1
1. INTRODUCTION
This SER presents a summary of environmental data gathered at or near SPR sites to characterize site environmental management performance, confirm compliance with environmental standards and requirements, assure protection of the public, and highlight significant programs and efforts (DOE Order 231.1B). The creation of the SPR was mandated by Congress in Title I, Part B, of the Energy Policy and Conservation Act (P.L. 94-163), of December 22, 1975. The SPR provides the United States with sufficient petroleum reserves to mitigate the effects of a significant oil supply interruption. Emergency crude oil supplies are stored by the SPR in salt caverns. The caverns were created deep within the massive Louann salt deposits that underlie most of the Texas and Louisiana coastline. The caverns currently in use were created through the process of solution mining. The utilization of the caverns to store crude oil provides assurance against normal hazards associated with the aboveground storage, offers the best security, and is the most affordable means of storage. The cost of using caverns to store crude oil is up to 10 times less than aboveground tanks and 20 times less than hard rock mines.
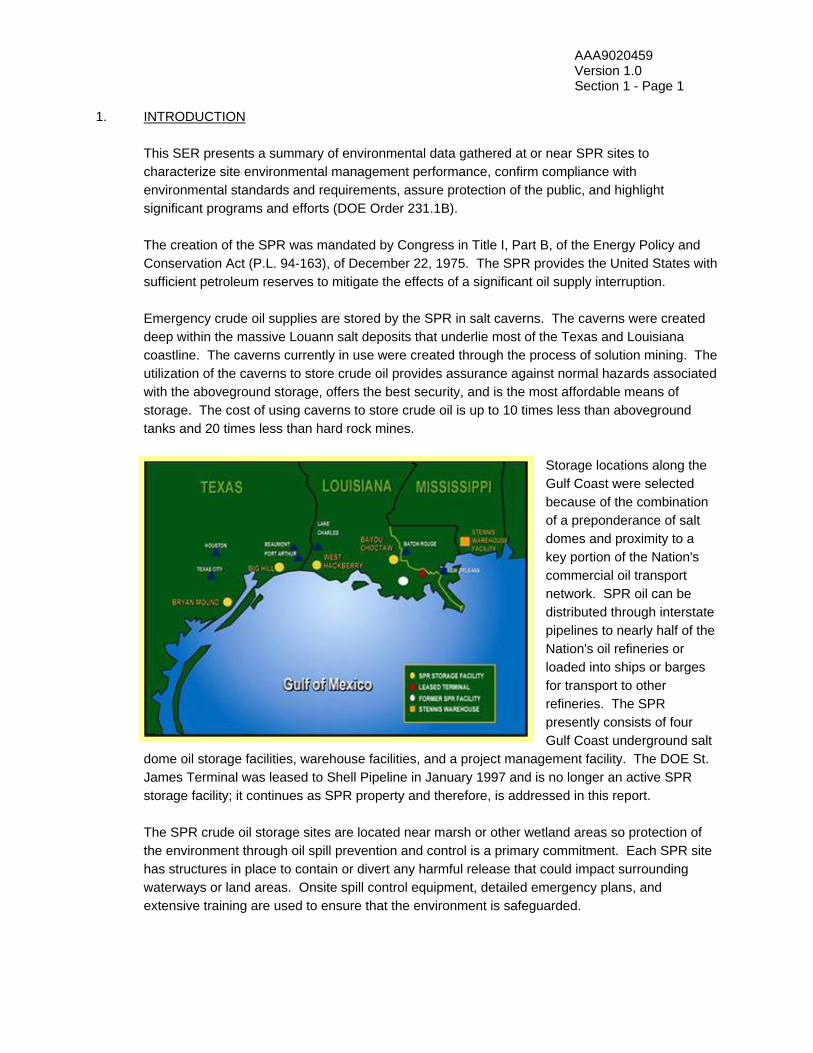
Storage locations along the Gulf Coast were selected because of the combination of a preponderance of salt domes and proximity to a key portion of the Nation's commercial oil transport network. SPR oil can be distributed through interstate pipelines to nearly half of the Nation's oil refineries or loaded into ships or barges for transport to other refineries. The SPR presently consists of four Gulf Coast underground salt
dome oil storage facilities, warehouse facilities, and a project management facility. The DOE St. James Terminal was leased to Shell Pipeline in January 1997 and is no longer an active SPR storage facility; it continues as SPR property and therefore, is addressed in this report.
The SPR crude oil storage sites are located near marsh or other wetland areas so protection of the environment through oil spill prevention and control is a primary commitment. Each SPR site has structures in place to contain or divert any harmful release that could impact surrounding waterways or land areas. Onsite spill control equipment, detailed emergency plans, and extensive training are used to ensure that the environment is safeguarded.
AAA9020459 Version 1.0 Section 1 - Page 2
1.1 BAYOU CHOCTAW
The SPR’s Bayou Choctaw storage facility is located in Iberville Parish, Louisiana. Development of the 356-acre site was initiated in 1977 and completed in 1991. Small canals and bayous flow through the site area and join larger bodies of water off-site. The area surrounding the site is a freshwater swamp, which includes substantial stands of bottomland hardwoods with interconnecting waterways. The site proper is normally dry and protected from spring flooding by the site's flood control levees and pumps. The surrounding area provides habitat for a diverse wildlife population, including many kinds of birds and mammals such as raccoon and deer, and reptiles including the American alligator.
1.2 BIG HILL
The 270-acre Big Hill storage facility is located in Jefferson County, Texas. Big Hill is the SPR's most recently constructed storage facility and is located close to commercial marine and pipeline crude oil distribution facilities. Development of the site was initiated in 1982 and completed in 1991. Most of the site is upland habitat, consisting of tall grass. A few 150-year-old live oak trees are present on the site. The nearby ponds and marsh provide excellent habitat for the American alligator and over-wintering waterfowl. Identified bird concentrations and rookeries are located in the area of the site. No rare, threatened, or endangered species habitat has been identified in the vicinity of Big Hill. Wildlife in the area include coyote, rabbits, raccoon, and many bird species.
1.3 BRYAN MOUND
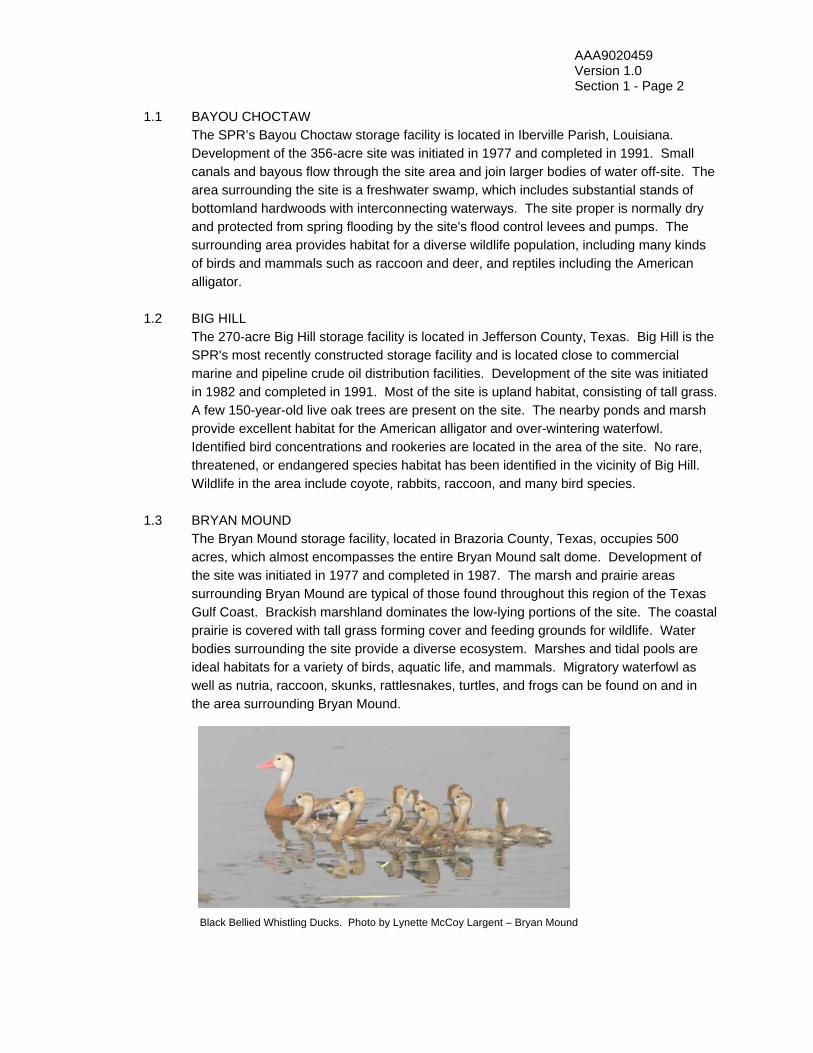
The Bryan Mound storage facility, located in Brazoria County, Texas, occupies 500 acres, which almost encompasses the entire Bryan Mound salt dome. Development of the site was initiated in 1977 and completed in 1987. The marsh and prairie areas surrounding Bryan Mound are typical of those found throughout this region of the Texas Gulf Coast. Brackish marshland dominates the low-lying portions of the site. The coastal prairie is covered with tall grass forming cover and feeding grounds for wildlife. Water bodies surrounding the site provide a diverse ecosystem. Marshes and tidal pools are ideal habitats for a variety of birds, aquatic life, and mammals. Migratory waterfowl as well as nutria, raccoon, skunks, rattlesnakes, turtles, and frogs can be found on and in the area surrounding Bryan Mound.
Black Bellied Whistling Ducks. Photo by Lynette McCoy Largent – Bryan Mound

AAA9020459 Version 1.0 Section 1 - Page 3
1.4 ST. JAMES TERMINAL
The St. James Terminal located along the Mississippi River in St. James Parish, Louisiana was leased to Shell Pipeline in 1997. The 173-acre site consists of the main facility and two satellite docks located on the west Mississippi River batture. A small onsite area was identified as contaminated with crude oil, and remediation efforts toward clean closure were implemented that resulted with a No Further Action At This Time (NFA-ATT) determination by LDEQ in 2008.
1.5 WEST HACKBERRY The 565-acre West Hackberry storage facility is located in Cameron Parish, Louisiana. Development of the site was initiated in 1977 and completed in 1988. Numerous canals and natural waterways bisect the area. The surrounding area consists of marshland with natural ridges. These ridges, called cheniers, typically support grass and trees and affect water flow through the marshes. In many areas, lakes, bayous, and canals are concentrated so that the marsh may not seem to be a landmass, but rather a large region of small islands.
The marshlands surrounding the West Hackberry site provide excellent habitat for a variety of wetland species. Many bird species frequent the area, including southern bald eagle, Arctic peregrine falcon, brown pelicans, and waterfowl. Other inhabitants include red fox, raccoon, nutria, opossum, wolf, bobcat, rabbits, and white-tailed deer. The American alligator is extremely common, breeding and nesting in this area. The marsh also supports a variety of other reptiles, fish, shellfish, and mammals.
1.6 SPR HEADQUARTERS
The project management office for SPR operations is housed in two adjacent office buildings with a nearby warehouse in Harahan, Louisiana, part of the New Orleans metropolitan area. This facility is the main office through which DynMcDermott manages, operates, maintains and supports the crude oil reserve sites. Activities conducted at the New Orleans office complex are predominantly administrative. Office and warehouse space is leased, not owned, by the Department of Energy.
1.7 STENNIS WAREHOUSE
The Stennis Warehouse facility is located in Hancock County, Mississippi. The warehouse and adjacent concrete aprons and parking lot occupy approximately 3.4 acres within the John C. Stennis Space Center. The warehouse has been leased from the U.S. Army since 2004. It is used to maintain and store heavy equipment and piping in support of the four storage sites. It also has office space permanently used by its tenants and, if needed, temporarily used by headquarters personnel.
End of Section

AAA9020459 Version 1.0 Section 2 - Page 1
2. COMPLIANCE SUMMARY
General The SPR operates in conformance with standards established by federal, state, and local statutes and regulations, EOs, and DOE orders and directives. A list of environmental federal, state and many of the DOE standards that, in varying degrees, affect the SPR is provided in Appendix A1 and A2.
The DOE Office of Deputy Assistant Secretary for the Petroleum Reserves has overall programmatic responsibility for establishing the objectives of the SPR. The SPRPMO Project Manager is responsible for implementing these goals and objectives, including articulating an environmental policy statement that is responsive to Departmental requirements. The DOE SPR Environmental Policy (SPRPMO P 451.1C) is applied to SPR operations through the current M&O contractor’s Environmental Policy (both in Appendix B).
The SPR has had an Environmental Protection Program since its inception and initial operation in 1978. The SPRPMO has assigned contractual responsibilities for implementation of the program to the current M&O contractor, DM. The M&O contractor operates on behalf of DOE with regard to waste classification, representations, shipments, and disposal for all SPR activities. Additional responsibilities, as applicable, are assigned to the Architect-Engineering (A&E) contractor, S&B Infrastructure, the Construction Management services contractor, ASRC Gulf States Constructors, LLC (AGSC), and SPR subcontractors. DM has been under contract to DOE since April 1, 1993. The SPRPMO Environmental, Safety, and Health (ES&H) division is responsible for development and oversight of ES&H programs and provides direction, technical guidance, and independent oversight to its prime contractors in the implementation of environmental programs and assessment of contractor performance. It is the SPR's policy and practice to conduct operations in compliance with all applicable environmental requirements with the highest regard for protection and preservation of the environment. Compliance status in this year's report reflects compliance activities conducted by DOE and DM personnel. The SPRPMO has self-certified that the SPR operates an EMS conforming to the requirements of EO 13423 and 13514.
To illustrate its commitment to excellence with regard to environmental management, DM also operates with an EMS that is third party certified against the ISO 14001 standard. This EMS reinforces conformance with DOE Order 436.1 and the environmental management requirements of EO 13423 and 13514, and strengthens the environmental leg of the SPR integrated safety management (ISM) system. In 2009, the scope of the DM EMS was broadened to include DOE prime construction management contractor AGSC, and since then, the EMS has been recognized as the SPR EMS.
A summary of the programs and procedures that presently make up the SPR environmental protection program includes: a. a National Environmental Policy Act (NEPA) program that provides a comprehensive
environmental review of all projects including purchase requisitions, engineering scopes of work, engineering change proposals, design reviews, and design changes for all SPR activities;

AAA9020459 Version 1.0 Section 2 - Page 2
b. a wetlands and floodplains management program that addresses projects that have an
impact on Section 404 of the CWA, Section 10 of the Rivers and Harbors Act, and state coastal zone management programs;
c. inspections, appraisals, assessments, and surveillance which provide regular monitoring to ensure compliance with regulatory and policy requirements;
d. a non-routine reporting program directed toward notification of oil, brine, or hazardous substance spills, and noncompliant effluent discharges, to identify the impact of such spills and discharges on property and the environment, and to comply with regulatory requirements;
e. a routine reporting program directed toward fulfilling self-reporting obligations under water, air, and waste permits and regulations;
f. a permit monitoring program to ensure compliance with all permit requirements and limitations, onsite operations and maintenance activities;
g. an environmental monitoring and surveillance program to detect any possible influence routine SPR operations might have on surface waters and ground waters on or near SPR sites and to provide a baseline in the event of an environmental upset;
h. discharge procedures used by each site when releasing liquid from any authorized containment or control system;
i. an environmental training program to ensure that applicable personnel are aware of the SPR EMS and environmental laws and regulations and are proficient in oil and hazardous material spill prevention, and safe handling of hazardous waste;
j. a pollution prevention (P2) program which focuses on source reduction, recycling, reuse, affirmative and biobased procurement, and proper disposal of all wastes produced on the SPR sites;
k. an underground injection control (UIC) program mandated by the Safe Drinking Water Act (SDWA) to ensure sound operation of Class II underground wells/caverns for brine disposal or hydrocarbon storage to protect aquifers;
l. a regulatory review program for identification of new environmental requirements; and
m. an employee environmental awards program to recognize activities, initiatives, and innovative approaches for improved environmental management and pollution prevention.
Regulatory The principal agencies responsible for enforcing environmental regulations at SPR facilities are the Environmental Protection Agency (EPA) Region VI, the New Orleans and Galveston Districts of the U.S. Army Corps of Engineers (COE), NODCOE and GALCOE, respectively, the U.S. Fish and Wildlife Service (F&WS), the Louisiana Department of Environmental Quality (LDEQ), the Louisiana Department of Natural Resources (LDNR), the Louisiana Department of Wildlife and Fisheries (LDWF), the Railroad Commission of Texas (RCT), the Texas Commission on Environmental Quality (TCEQ), the Texas General Land Office (TGLO), Texas Parks and Wildlife Department (TPWD), and the Mississippi Department of Environmental Quality (MDEQ). These agencies issue permits, review compliance reports, inspect site operations, and oversee compliance with regulations. Executive Orders (EO) 13423 and 13514 In January 2007, President Bush enacted EO 13423, “Strengthening Federal Environmental, Energy, and Transportation Management”. This EO consolidated and strengthened five previous

AAA9020459 Version 1.0 Section 2 - Page 3
executive orders and two memorandums of understanding, and established new and updated goals, practices, and reporting requirements for environmental, energy, and transportation performance and accountability. The EO requires federal agencies to lead by example in advancing the nation’s energy security and environmental performance. During 2011, the SPR made a concerted effort to successfully comply with the goals of the EO and associated requirements based on the implementation strategies developed in 2007. EO 13514, “Federal Leadership in Environmental, Energy, and Economic Performance”, was enacted on October 5, 2009 by President Obama to establish an integrated strategy towards sustainability in the Federal Government and to make reduction of green house gas emissions (GHG), a priority for federal agencies. The federal government will lead as an example to create a clean energy economy. The strategy to achieve this EO is similar to and integrates with that of previous EO 13423.
The SPR responded to associated DOE guidance and implementation memoranda through several initiatives. One of these is the organization of the DM Environmental Department to increase efficiency and place added emphasis on key program areas. Job tasks are arranged into the functions of Chemical Management, NEPA and Air Quality, Waste Management, Surface and Ground Water, EMS, P2, Environmental Compliance, and Environmental Programs. DOE environmental staff includes a NEPA Compliance officer, who also has responsibility for Pollution Prevention / Waste Management, and an Environmental Program manager, whose responsibilities include Air Quality, Surface and Ground Water, and EMS.
The SPR follows and operates in conformance with DOE Orders applicable to its operation. Two of the major orders include the sustainability goals found in Departmental Sustainability (DOE O 436.1) and the NEPA Compliance Program (DOE O 451.1B, Chg 1). The orders establish some of the policies of the SPRPMO that help to ensure that environmental stewardship is maintained. 2.1 COMPLIANCE STATUS (JAN. 1, 2011 THROUGH DEC. 31, 2011)
A major component of the SPR's compliance program is associated with meeting regulations under the CWA. At the beginning of the year, the SPR sites had a total of 95 wastewater and stormwater discharge monitoring stations that remained unchanged during this period, and 35 active (core-structure) individual wetland permits authorizing various structures at each of the sites.
The SPR is also required to meet many requirements under the CAA and the SDWA and conduct waste management activities in accordance with RCRA and state guidelines. The following sections highlight primary compliance activities at the SPR sites by environmental statute.
Clean Water Act The SPR sites comply with the CWA through permitting under the NPDES program, following the Spill Prevention, Control and Countermeasures (SPCC) regulations, complying with the requirements of the Oil Pollution Act (OPA) of 1990 and complying with the wetlands usage program.
AAA9020459 Version 1.0 Section 2 - Page 4
In 2004, the SPR, on its own initiative, requested minor modifications to both of the Texas site individual NPDES permits to increase the minimum nozzle exit velocity from the assigned 20 feet per second (fps) to 30 fps in order to increase dispersion of the offshore brine discharge further reducing potential impacts to organisms in the receiving waters. These modification requests were granted effective February, 2005 and were requested for reauthorization with the permit renewal applications submitted in April, 2008, which became effective February 1, 2009. Louisiana has primary enforcement responsibility for the NPDES discharge program, issuing permits under the CWA. LDEQ issued the BC facility a renewed Light Commercial general permit in August of 2011.
The SPR maintains a Louisiana statewide permit from LDEQ for discharge of hydrostatic test water that minimizes permit-filing fees and increases flexibility in support of site construction and maintenance activities. Each SPR storage site and the Stennis warehouse comply with the federal SPCC regulations and in Louisiana with the state SPCC regulations by following a plan that addresses prevention and containment of petroleum and hazardous substance spills. All of the SPR SPCC plans are current in accordance with Title 40 CFR 112 and corresponding state regulations. Regulatory required five-year reviews of the BC, BM, and WH SPCC Plans were performed in 2011, and a review of the BH SPCC Plan is scheduled in 2012. The SPR sites obtain permits from the COE and Coastal Zone Management representatives of the responsible state agencies whenever fill, discharge, or dredging occurs in a wetland.
During 2011, only the BC Cavern 102 project occurred in jurisdictional wetlands in Louisiana or Texas requiring COE permitting actions from the New Orleans and Galveston Districts or separate Coastal Zone Management approval (LDNR – Coastal Zone Management in Louisiana and the GLO in Texas). The BC 102 project required a modification to the existing BC Clear Zone Permit to include the acquisition of cavern 102 and the required security clear zone around the cavern pad and the building of the 102 cavern pad. It also required compensatory mitigation for the impacts to jurisdictional wetlands by the project. There were, however, several maintenance notifications made for dredging at the raw water intake structures (RWIS), and traveling screen removals for repair and associated replacements.
Oil Pollution Act of 1990 SPR emergency programs, planning, and management are guided by OPA 1990 regulatory standards for onshore storage facilities, pipelines, and marine terminal facilities. Facility Response Plans (FRP) on the SPR have been combined with the site emergency response procedures in accordance with the EPA “One Plan” scheme and meet or exceed the requirement of OPA 1990 and related state acts such as the Oil Spill Prevention and Response Act (OSPRA) in Texas. The plans are approved by the
AAA9020459 Version 1.0 Section 2 - Page 5
appropriate federal and state regulatory agencies. The Texas sites maintain their individual OSPRA certifications in accordance with state requirements.
The SPR conducts emergency drills or hands-on training of its sites each quarter in accordance with the National Preparedness for Response Program (PREP), along with full equipment deployment announced and unannounced exercises at each site annually. A professional staff of emergency management personnel from DM New Orleans (NO) conducts these drills and exercises and includes the participation of public and regulatory/governmental agencies as available. The SPR utilizes the National Incident Management System (NIMS), the response management system required by the National Oil and Hazardous Substances Pollution Contingency Plan. SPR site and New Orleans response management personnel have been trained in the unified Incident Command System, and a team of selected New Orleans personnel is available to support extended site emergency operations when needed.
Safe Drinking Water Act The SPR oil storage caverns and brine disposal wells are regulated by the SDWA. The EPA granted primacy under the SDWA to both Louisiana and Texas Underground Injection Control (UIC) programs, which regulate underground hydrocarbon storage, related brine disposal, and oil field wastes. The SPR operates 21 saltwater disposal wells for the Louisiana sites. In Texas, brine is disposed via brine pipelines that extend into the Gulf of Mexico. Some ancillary commercial disposal wells are used occasionally. The 2011 Annual Report Form OR-1 for underground injection was completed and submitted on schedule to the LDNR. Historic ground water evaluations have indicated the presence of some shallow ground water impacts from salt water at the BM and WH sites. At BM, data suggest that use of unlined brine storage pits by the previous industrial tenants may have been a major contributor to the salt impacted ground water located east of the site's closed large brine storage pond. As part of the site’s overall groundwater surveillance, the post-closure monitoring near the BM brine storage pond is provided through this report to the RCT as requested.
The WH site completed closure of its brine ponds in 1999 under a CAP negotiated with LDNR. All remedial recovery pumping was successfully completed in 2001. Post closure monitoring for three closed anhydrite ponds of certain wells for 30 years is currently met by monitoring quarterly and reporting annually in this SER, which is shared with LDNR. A 2002 proposal for resumption of a site-wide ground water monitoring program addressing both the brine pond and anhydrite pond closures was approved by LDNR in 2004, and has been followed since. Ground water monitoring of the uppermost interconnected aquifer at all SPR sites is mandated through DOE orders for surveillance assessment and are coordinated on the SPR through the Environmental Monitoring Plan (EMP). Details of the ground water monitoring of the site wide well nets are presented in Chapter 6. Of note again this year

AAA9020459 Version 1.0 Section 2 - Page 6
are the recognized saltwater impacts remaining from Hurricane Ike storm surge leaving two of five effected wells to continue with their freshening conditions.
Local public water systems supply drinking water to all storage sites, NO headquarters, and the NO and Stennis warehouses. Potable water systems at BM and BH are classified by state and federal regulations as “non-transient, non-community” public water systems, and these sites are required to have potable water monitoring programs. In August 2011, BC was connected to an Iberville Parish potable water supply and the on-site water well that had provided fresh water to the site since the site was constructed was properly plugged and abandoned. Unlike BH and BM, WH and now the BC facility are not required to have potable water monitoring programs and are recognized as water purchasers only.
In 2011, drinking water samples were taken monthly at BH and BM and quarterly (though July) at BC for total coliform testing by state-approved outside laboratories. Residual chloramine was monitored weekly at BH and BM. Residual chlorine was monitored daily at BC until the site was connected to a municipal waste supply. Potable water at BM, BH, and BC has been tested under state programs for lead and copper, most recently in 2008 at the BM and BC sites, respectively, and in 2009 at the BH site. Test results dictate that BC maintain a corrosion control program to protect piping and help ensure the drinking water lead and copper concentration action thresholds are not exceeded. Lead and copper are tested every two years at BC, and the results continue to indicate that the corrosion control program has been successful. Testing for disinfection by-products was conducted in 2008 at BC, and 2010 at BM and BH. Favorable test results have allowed the three sites to be tested on a reduced frequency – every three years at BC and annually at BH and BM. Testing is conducted through the Louisiana Department of Health and Hospitals (LDHH) and the TCEQ. Most recent tests results for the two groups of disinfection by-products – trihalomethanes and haloacetic acids – show that concentrations continue to be below the maximum contaminant levels (MCL) at the three sites. Previous to 2005, the MCL for both contaminants were exceeded at BC and required quarterly testing. However, the results in 2005 and 2006 were below the MCL for both by-products and have remained so through 2008, allowing reduced testing.
BH, BM and BC calculate maximum residual disinfectant levels (free chlorine at BC, and chloramine at BH and BM), based on a running annual arithmetic average. Calculated results at both sites have not exceeded the regulatory MCL for disinfectants.
American Bittern. Photo by Renee1 Hebert – Big Hill

AAA9020459 Version 1.0 Section 2 - Page 7
Clean Air Act The SPR sites comply with the applicable provisions of the CAA and State Implementation Plans (SIP) through permitting and following applicable regulations. The state agencies have primacy (LDEQ and TCEQ). All of the SPR sites are located in attainment areas for all National Ambient Air Quality Standards (NAAQS) pollutants with the exception of ozone. The BC, BH and WH sites are located in attainment areas for ozone; therefore, it is regulated by the Prevention of Significant Deterioration (PSD) permitting program. The BM site is located in a non-attainment area for ozone; therefore, the New Source Review (NSR) permitting program applies. None of the SPR sites are considered to be major sources of air emissions during normal operations under PSD, NSR, Title III hazardous air pollutant (HAP), or Title V operating permit regulations. All of the facilities operate in accordance with the provisions of the applicable state air permits. Pollution Prevention Act of 1990 (PPA) Each SPR site operates in accordance with an SWPPP prepared in accordance with EPA multi-sector general storm water discharge authority for storm water associated with industrial activity and similar Louisiana and Mississippi state requirements. This multimedia document consolidates these regulatory agency requirements with the more general DOE Order 450.1A and EO 13423, which require a Pollution Prevention Program (PPP) and the related Waste Minimization and Solid Waste Management Plans.
Resource Conservation and Recovery Act Hazardous wastes generated on the SPR are managed in strict compliance with state and EPA hazardous waste programs. The EPA has delegated the hazardous waste program to LDEQ in Louisiana and MDEQ in Mississippi. SPR Texas sites fall under the jurisdiction of the RCT, which has not yet received delegation; therefore, the SPR complies with both EPA and RCT regulations in Texas. Large quantities of hazardous waste are not routinely generated at the SPR and the sites are classified as either CESQG or Small Quantity Generators (SQG). Hazardous wastes are not treated, stored, or disposed at the SPR sites and therefore, the sites are not RCRA-permitted treatment, storage, and disposal (TSD) facilities. Each site has an EPA generator number that is used to track the manifesting of hazardous waste for off-site treatment or disposal. None of the SPR sites are identified on the National Priority Listing (NPL) under Comprehensive Environmental Response, Compensation and Liability Act (CERCLA).
SPR non-hazardous wastes associated with underground hydrocarbon storage activities are regulated under the corresponding state programs for managing drilling fluids, produced waters, and other wastes related to the exploration, development, production or storage of crude oil or natural gas. These wastes are referred to as Exploration and Production (E&P) wastes. Hazardous E&P wastes are exempted from RCRA, but Congress did not include the underground storage of hydrocarbons in the scope of the E&P criteria. Under LA and TX regulations, underground storage of hydrocarbons is included in the E&P scope. In order to remain in compliance with federal law, the SPR does not dispose of hazardous waste under the "E&P" exemption rules. The SPR

AAA9020459 Version 1.0 Section 2 - Page 8
characterizes all E&P waste streams to determine if they exhibit hazardous characteristics, and any that do are managed and disposed as hazardous waste. The SPR disposes of non-hazardous wastes generated by the E&P process at state approved E&P disposal facilities. During CY 2011, 40 percent of non-hazardous E&P wastes (95 tons) generated on the SPR was recycled. Other non-hazardous wastes, such as office wastes, are managed in accordance with state solid waste programs. The appropriate waste management strategy is based on the results of waste stream characterization.
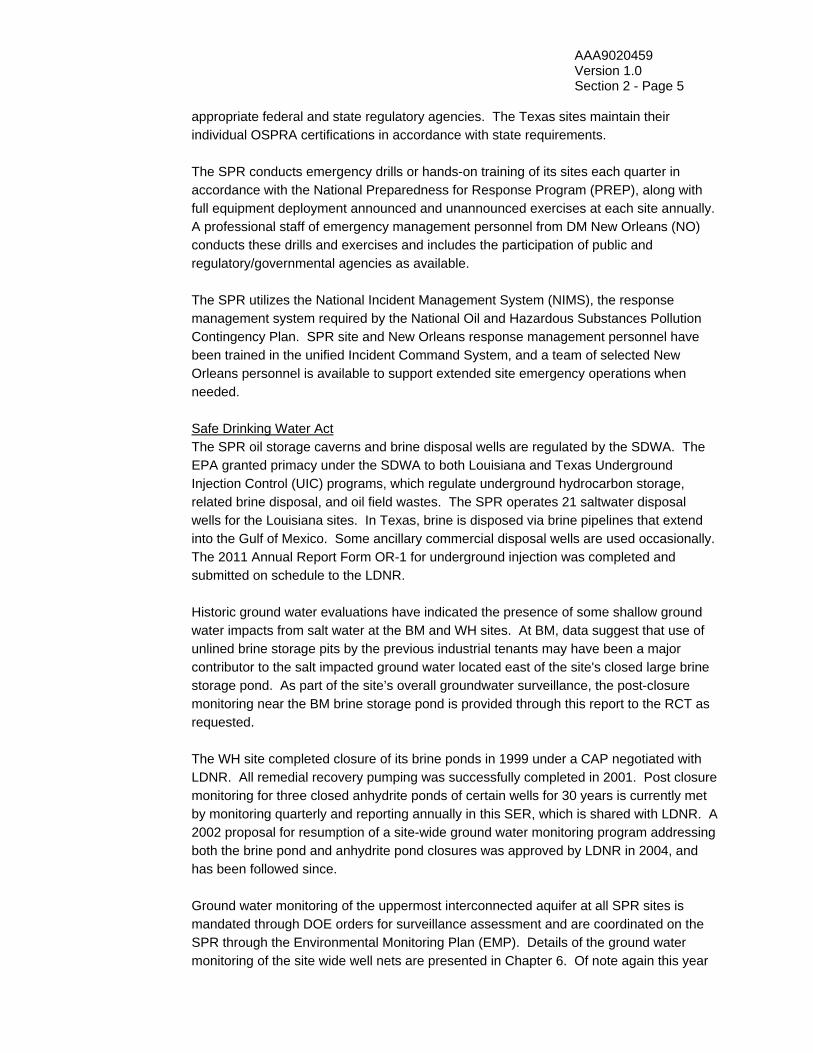
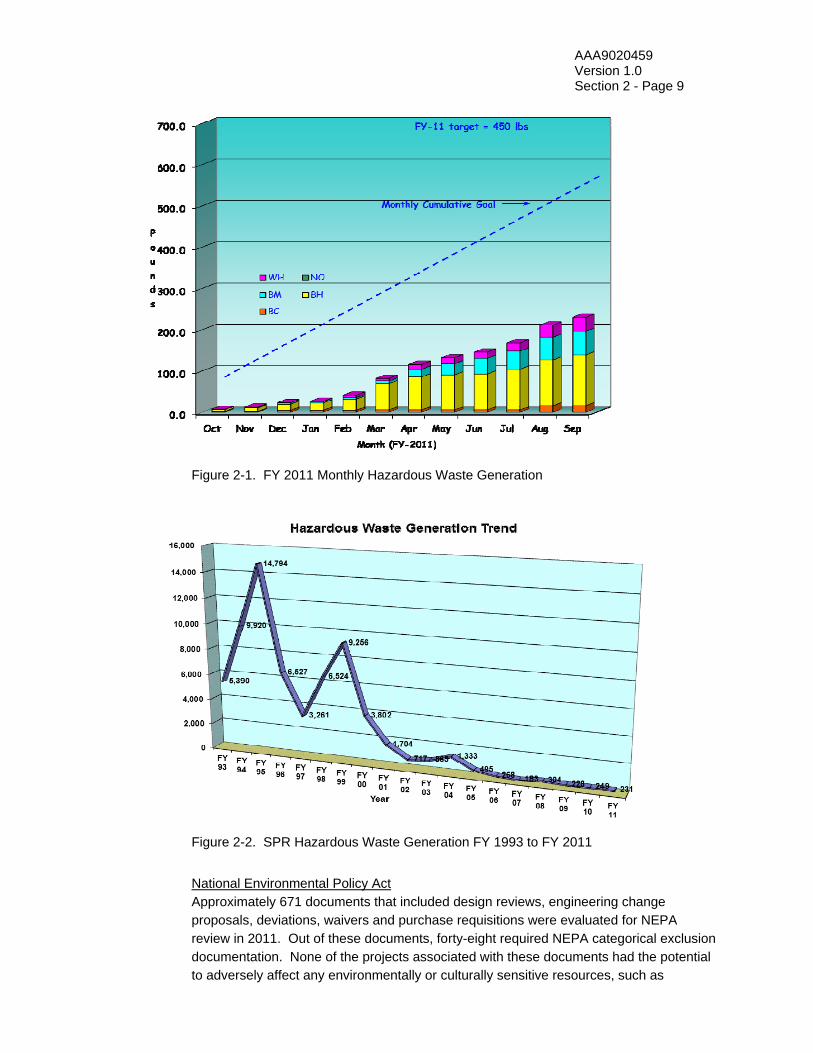
Hazardous waste that was generated during CY 2011 (224 lbs.) consisted primarily of laboratory wastes (generated at the SPR LA and TX sites), and non-Toxicity Characteristic Leaching Procedure (TCLP) compliant bulbs (generated at SPR Texas sites). During CY 2011, all SPR sites averaged hazardous waste generation rates well within the CESQG limits. The SPR achieved the 100% Affirmative Procurement (AP) purchases target for fiscal year 2011. All purchases qualified as recycled products or justified virgin products. There were no purchases of virgin products in 2011. Figures 2-1 and 2-2 illustrate FY 2011 monthly waste generation versus the pro-rated fiscal year’s target of 450 lbs. and the trend of hazardous waste reduction since 1993, respectively. The DOE and M&O contractor’s corporate environmental policies stress the SPR’s commitment to waste management and environmental protection (Appendix B). Toxic Substances Control Act (TSCA) Friable asbestos is not present at SPR sites. Small amounts of non-friable asbestos usually in the form of seals or gaskets are disposed of locally as they are taken out of service, in accordance with applicable solid waste regulations. Non-asbestos replacement components are used. No liquid-filled electrical equipment or hydraulic equipment currently used on the SPR has been identified as polychlorinated biphenyl (PCB) equipment or PCB contaminated under TSCA. Procedures are in place to preclude or prohibit purchase of equipment containing either friable asbestos or PCBs.
AAA9020459 Version 1.0 Section 2 - Page 9
Figure 2-1. FY 2011 Monthly Hazardous Waste Generation
Figure 2-2. SPR Hazardous Waste Generation FY 1993 to FY 2011
National Environmental Policy Act Approximately 671 documents that included design reviews, engineering change proposals, deviations, waivers and purchase requisitions were evaluated for NEPA review in 2011. Out of these documents, forty-eight required NEPA categorical exclusion documentation. None of the projects associated with these documents had the potential to adversely affect any environmentally or culturally sensitive resources, such as

AAA9020459 Version 1.0 Section 2 - Page 10
structures of historic, archeological, or architectural significance or any threatened or endangered species or their habitat. Also, no wetlands were adversely impacted as a result of these actions. All of these NEPA reviews resulted in categorical exclusions that required no further action. The purpose of the NEPA Program is to review all SPR projects in the early planning stages to ensure that environmental impacts and requirements are adequately evaluated. All activities on the SPR must have, or have had, a NEPA review. For most projects, the NEPA document is a “Record of NEPA Review” (RONR), which suggests that a project is a categorical exclusion (CX) or that the project is covered under an existing NEPA document. For those few projects not covered by a RONR, a higher level of NEPA review is required, and is part of the planning process. A RONR is required if the project’s value is greater than $100,000 (for information systems, construction contracts, and service contracts) or for any project or task that might cause significant environmental impact. The following are reviewed for NEPA compliance: • Conceptual Design Reports • Definitive Engineering Scopes • Statements of Work • Work Orders or Service Orders • Engineering Change Proposals • Deviations and Waivers • Design Reviews • Purchase Requests • Scopes of Work A signed NEPA document is required 1) prior to detailed design beyond conceptual design, 2) before a scope of work is issued for construction or 3) before manpower commitment. The NEPA process is also a key method of identifying environmental aspects for incorporation into the EMS. Federal Insecticide, Fungicide, and Rodenticide Act (FIFRA) Much of the SPR property is developed with buildings, piping, cable trays, and other structures where the use of pesticide products is necessary to control unwanted vegetation and other pests. During 2011 the SPR continued to use pesticide products to control pests in buildings and around work areas, control vegetation throughout site grounds and the security zone areas, and to mitigate the reduction of the number of personnel dedicated to mowing. Although the use of pesticides and herbicides is a necessary and integral part of property maintenance on the SPR, there is a concerted effort made, through screening of chemicals prior to purchase, to restrict the use of those products to the least harmful to the environment and the employees. Endangered Species Act (ESA) In a continuing effort to minimize disruption and provide suitable habitat to migratory birds at SPR sites, bird-nesting areas are closed or otherwise protected during critical periods to prevent disturbance as a result of site operations. The F&WS is consulted in regard to appropriate actions taken that may affect migratory birds or threatened and endangered

AAA9020459 Version 1.0 Section 2 - Page 11
species. For example, the F&WS is consulted prior to the removal and relocation of nuisance wildlife.
As part of the original conditional coverage and as obtained through the re-issued Multi Sector General Permit (MSGP), a required signatory on each Notice of Intent (NOI) precipitated a formal review of site-specific potential endangered species impacts. This was accomplished prior to finalizing the NOIs and involved an update/comparison step with original Environmental Impact Statements (EISs), with the current ESA lists, and a generalized evaluation or assessment of any potential impacts relating to or resulting from SPR storm water "sheet flow" run-off. No potential impacts
were discerned at that time. The MSGP coverage has since been migrated to either the individual or general permits issued to each site. Executive Order (EO) 13186, Responsibilities of Federal Agencies to Protect Migratory Birds and the Migratory Bird Treaty Act The active storage facilities comprising the SPR are located in a variety of environs and migratory pathways along the Gulf Coast of Texas and Louisiana. As such, a variety of waterfowl and other nesting birds frequent our sites during a typical year. Environmental awareness of migratory bird issues commences at the site level. Each site ES&H Manager implements site-wide surveillance in the conduct of normal operations. Selected fields are not mowed from early fall through early spring at BM, BH, and WH to provide food and shelter for migrating birds. At the BC site a feed plot is provided for wintering wildlife. When discovered, nesting areas at all sites are flagged in the field for the duration of the nesting season (e.g. least terns); and equipment has been designated for limited/restricted use on occasion when they harbor bird nests (e.g. by mockingbird, mourning dove, and shrikes). At the WH site selected areas are not mowed and/or are posted to avoid from early spring through mid summer to allow bird nesting and brooding. These activities illustrate the coordination maintained with local Fish & Wildlife representatives at the SPR sites in fulfillment of environmental stewardship. National Historic Preservation Act (NHPA) No site projects required certified reviews by the Louisiana State Historical Preservation Office (SHPO) in 2011. A historic project-wide review step for the NHPA to accompany the MSGP NOI as detailed in the previous ESA section was accomplished in 2006. No places on or eligible to the National Register of Historic Places are located on or adjacent to SPR sites. The BM SPR site is located on a Texas State Historical Place for its significance to the sulfur mining industry and long-term development of the nearby town of Freeport. A monument commemorates the historical significance of this location.
Yellow Crowned Night Heron. Photo by: Paul Bonin – Big Hill
AAA9020459 Version 1.0 Section 2 - Page 12
Executive Order (EO) 11988, “Floodplain Management” Since the inception of the SPR, compliance with EO 11988 has been maintained by complying with NEPA requirements, identifying potential environmental impacts, and obtaining permits through the COE and state coastal management agencies prior to any construction, maintenance, rehabilitation, or installation of structures and facilities. Executive Order (EO) 11990, “Protection of Wetlands” The measures that illustrate the SPR compliance with EO 11988 are also used to comply with EO 11990 and ensure that any practicable steps to minimize harm to wetlands are identified and taken. EO 13423, “Strengthening Federal Environmental, Energy, and Transportation Management”, and EO 13514, “Federal Leadership in Environmental, Energy, and Economic Performance” – Sustainability Program Because both EO 13423 and 13514 are interrelated, they are discussed together. EO 13423 was published in January 2007 and replaced five previous executive orders by consolidating their intent into one all encompassing order. Enacted in 2009, EO 13514 is closely related to EO 13423, extending out to 2020 many of the goals set by that EO. The goals of both EO’s are implemented through the SPR Sustainability Program. The goals are as follows:
Increase energy efficiency and reduce Scope 1 and 2 green house gas generation
Reduce Scope 3 green house gas generation
Conduct an annual comprehensive green house gas inventory
Promote high performance sustainable building design and construction
Promote regional and local planning
Increase water use efficiency and management
Promote pollution prevention and waste elimination
Increase sustainable acquisition
Promote electronic stewardship and energy efficient data centers Each year DM and DOE sustainability implementation teams identify, select, schedule, budget, and implement activities that support the sustainability program. A brief synopsis of 2011 activities and their success is found at the end of this section. Superfund Amendments and Reauthorization Act SARA Title III Tier Two reports, also known as Emergency Planning and Community Right-to-Know Act (EPCRA) Section 312 reports were prepared and distributed as required by March 1, 2011 to state and local emergency planning committees and local fire departments. Tables 2-1 through 2-6 contain a summary of the inventory information that was submitted for 2011. The SPR continued to use an electronic format as required by the state implementing agencies for the preparation and submission of Tier Two Reports for the SPR facilities in Louisiana, Texas, and Mississippi. SPR sites are required to report under EPCRA Section 313, by submitting Toxic Chemical Release Inventory (TRI) Form R when reporting thresholds, defined by emissions from crude oil placed in commerce, are exceeded. Specifically when crude oil

AAA9020459 Version 1.0 Section 2 - Page 13
is placed in commerce, it is considered to be repackaging of hazardous substances and must be reported. This form must be submitted by July 1 for the reporting thresholds exceeded during the preceding calendar year. The submittal of a TRI Form R was required for the WH site in 2011 because the SPR introduced crude oil into commerce during the WH-BC exchange in September, 2010. Federal Facilities Compliance Act (FFCA) During 2011 none of the SPR sites generated any waste considered to be hazardous and radioactive (mixed waste). Therefore, this act did not apply to the SPR. Atomic Energy Act of 1954 X-ray and other sealed radioactive sources are used at the SPR to perform analytical, monitoring and scanning activities. Conformance with this act is demonstrated by following state implementing agency radiation control regulations
International Organization for Standardization Certification On May 19, 2000, the DM EMS was first evaluated by an independent CB accredited by the American National Standards Institute American Society for Quality (ANSI-ASQ) National Accreditation Board (ANAB) and certified in conformance with the ISO 14001 standard. The EMS was recertified in 2003, 2006 and again in 2010 as the SPR EMS by the same ANAB accredited CB. Between certifications the CB has conducted surveillance audits to evaluate the SPR EMS every six months.
Table 2-1. 2011 Louisiana SARA Title III Tier Two Summary at Bayou Choctaw
Chemical Name (Category)
* Max Daily Amt (lbs.)
Location
AFFF 3% 10,000 – 99,999 OPS., FOAM STORAGE BUILDING BLACK MAX COPPER SLAG 10,000 – 99,999 CONTRACTOR, CYPRESS BAYOU BRINE
PUMP AREA CRUDE OIL PETROLEUM > 1 Billion FLAMMABLE STORAGE BUILDING, SITE
TANKS, PIPING, UNDERGROUND CAVERNS DIESEL FUEL 10,000 – 99,999 EMERGENCY GENERATOR FUEL TANK,
PROPERTY TANK 2 DIESEL FUEL #2 10,000 – 99,999 CONTRACTOR LAYDOWN AREA GASOLINE, INCLUDING CASING HEAD
1,000 – 9,999 PROPERTY TANK 1
NITROGEN BALANCE GAS 100 – 999 CONTROL BUILDING * Reporting range specified by LA SARA Title III Tier Two Reporting Requirement
Table 2-2. 2011 Texas SARA Title III Tier Two Summary at Big Hill
Chemical Name (Category)
* Max Daily Amt (lbs.)
Location
CRUDE OIL PETROLEUM > 1 Billion FLMMABLE STORAGE BUILDING, SITE TANKS, PIPING, UNDERGROUND CAVERNS
CHEMGUARD C301 MS AFFF 10,000 – 99,999 OPS., BLDGS. 805, AND 834. BHSE 834 DIESEL FUEL 10,000 – 99,999 OPERATIONS, BHT-4, BHT-50, BHT-51,
AND BHT 53 FC-600 LIGHTWATER BRAND AFFF 10,000 – 99,999 OPERATIONS FOAM BLDG., BHT 16 HYDROGEN SULFIDE 0 – 99 I & C OFFICE SULFURIC ACID 0 – 99 ENV. LAB, BLDG 803 CAB 5 XYLENE 0 – 99 ENV. LAB, CRUDE OIL STORAGE BLDG.
* Reporting range specified by Texas SARA Title III Tier Two Reporting Requirement

AAA9020459 Version 1.0 Section 2 - Page 14
Table 2-3. 2011 Mississippi SARA Title III Tier Two Summary at the Stennis Warehouse
* Reporting range specified by MS SARA Title III Tier Two Reporting Requirement
Table 2-4. 2011 Texas SARA Title III Tier Two Summary at Bryan Mound
Chemical Name (Category) * Max Daily Amt (lbs.) Location
CRUDE OIL PETROLEUM > 1 Billion FLAMMABLE STORAGE BUILDING, SITE
TANKS, PIPING, UNDERGROUND CAVERNS
ABRADE AWAY 10,000 – 99,999 PAINT YARD HOPPER
3% AFFF 100,000 – 999,999 FOAM BLDG 207 AND 213, TANKS, FIRE
TRUCK DIESEL 10,000 – 99,999 FUEL TANK, PIPING, WORKOVER
HYDROGEN SULFIDE 0 – 99 DEGAS PLANT MOBIL DELVAC 1300 SUPER 1,000 – 9,999 MAINTENANCE BLD. 210
MOBIL DTE OIL BB 1,000 – 9,999 DEGAS CRANKCASES MOBIL DTE OIL HEAVY 1,000 – 9,999 DEGAS CRANKCASES
* Reporting range specified by TX SARA Title III Tier Two Reporting Requirement Table 2-5. 2011 Louisiana SARA Title III Tier Two Summary in Offsite Pipelines
Chemical Name (Category)
*Max Daily Amt (lbs.)
Location
CRUDE OIL, PETROLEUM 50,000,000 – 99,999,999 OFF-SITE PIPELINES IN CALCASIEU PARISH, LA (WEST HACKBERRY)
CRUDE OIL, PETROLEUM 10,000,000 – 49,999,999 OFF-SITE PIPELINES IN CAMERON PARISH, LA (WEST HACKBERRY)
* Reporting range specified by LA SARA Title III Tier Two Reporting Requirement Table 2-6. 2011 Louisiana SARA Title III Tier Two Summary at West Hackberry
Chemical Name (Category)
*Max Daily Amt (lbs.)
Location
BACTRON K-95 1,000 – 9,999 ABOVE GROUND TANK CRUDE OIL PETROLEUM > 1 Billion LCMS PIPING, SITE TANKS, PIPING,
UNDERGROUND CAVERNS, WAREHOUSE E DIESEL FUEL 10,000 – 99,999 FUEL PUMP TANK, MAINTENANCE LAYDOWN
YARD DIESEL FUEL #2 1,000 – 9,999 WORKOVER RIG FC-203CF LIGHTWATER BRAND AFFF 10,000 – 99,999 FIRE TRUCK WHFT3, BLDGs 303 AND 304 FC-600 LIGHTWATER BRAND ATC/AFFF 1,000 – 9,999 BLDG 303, BLDG 305 GASOLINE, INCLUDING CASING HEAD 1,000 – 9,999 FUEL PUMP TANK, LAYDOWN YARD, MINERAL OIL 1,000 – 9,999 WORKOVER RIG MOTOR OIL 1,000 – 9,999 MAINTENANCE FLAMMABLE STORAGE
BUILDING, OPS., MAIN GATE PURPLE K DRY CHEMICAL 1,000 – 9,000 OPERATIONS BLDG SILICA – SAND 1,000 – 9,000 RPX PUMP LAYDOWN YARD SWEEPING COMPOUND WAX BASE 1000 – 999 WAREHOUSE
* Reporting range specified by LA SARA Title III Tier Two Reporting Requirement
Chemical Name (Category)
*Max Daily Amt (lbs.)
Location
DIESEL FUEL 1,000 – 9,999 OUTSIDE OF WAREHOUSE MOTOR OIL 1,000 – 9,000 WAREHOUSE DIESEL ENGINE OIL 1,000 – 9,000 WAREHOUSE
AAA9020459 Version 1.0 Section 2 - Page 15
2.2 MAJOR ENVIRONMENTAL ISSUES AND ACTIONS
Gassy Oil When SPR crude oil is brought to surface facilities, methane and ethane gas (non-regulated) that has migrated from the salt in the salt dome is released, stripping regulated pollutants (VOC) into the atmosphere. Also, geothermal processes raise the crude oil temperature, elevating the true vapor pressure (TVP) potentially above the atmospheric pressure of 14.7 pounds per square inch (PSI). This elevated vapor pressure may exceed regulatory limits for storage in floating roof tanks, potentially affecting some of the SPR sites and receiving commercial terminals (customers). Beginning in 1995 the SPR conducted operations to separate and remove gas from stored oil, in addition to heat exchangers used to cool oil prior to transport offsite. Recent operation of the degas plant at BH began in early 2004 and completed operations in October 2006. The degas plant was disassembled and moved to BM in 2007. Operations started in September 2007, and were completed in February 2011.
Bayou Choctaw Cavern 102 In order to make certain that the SPR is able to successfully perform its mission of stockpiling crude oil in the event of a petroleum supply disruption; processes are monitored to ensure the integrity of the storage systems. Sonar testing at the BC storage site identified Cavern 20 (BC-20) as being deficient and having a high risk of integrity failure. It was decided to empty BC-20 of crude and purchase BC Cavern 102 (BC-102), an existing cavern owned by a private entity, as a replacement for BC-20. In 2010 DOE canceled the expansion at the Richton site and elected to pursue the purchase of BC-102 from Petrologistics, LLC. In November 2011 DOE acquired BC-102 through land condemnation. In May 2010, DM commissioned services to conduct a Phase I Environmental Site Assessment of the BC-102 Cavern Site. The assessment was completed in June 2010 and indicated that there were no RECs associated with the BC-102 cavern area. The wetland permit application was completed in March 2011. Cavern Integrity Texas Administrative Code (TAC), Title 16, Part 1, Chapter 3, Rule 3.95 (o) (3) requires storage wellhead components and casing to be inspected at least once every 10 years for corrosion, cracks, deformations or other conditions that may compromise integrity and that may not be detected by the five-year mechanical integrity test. In response, the SPR initiated a multi-sensor caliper program in 2008 to evaluate the condition of the last cemented casing string. In some cases where caliper results showed an irregularity, a downhole camera was run to better define the anomaly. If the anomaly is determined to be structural, plans are made to remediate the issue. The remediation varies depending on they type of anomaly involved. These remediations have been worked in conjunction with state regulatory agencies and in full compliance with the regulatory requirements. Once a cavern is depressured for workover, the wellhead components are taken off and inspected. This work continues in conjunction with the cavern workover and remediation programs. These programs were expanded to include the Louisiana SPR sites in addition to the required Texas sites. In FY 2011 mechanical integrity tests were completed on the following wells: BC 18, 19, 20, and 101; WH 6B, 101, 104, 108 and

AAA9020459 Version 1.0 Section 2 - Page 16
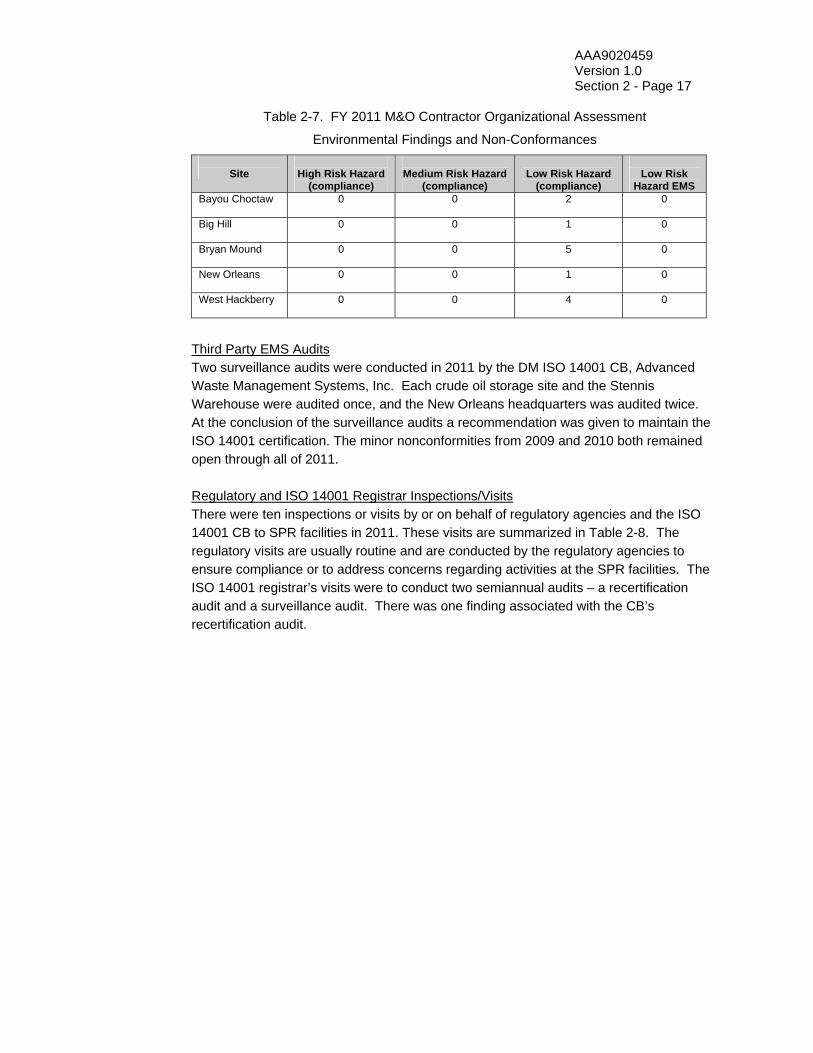
113; BH 105, 109, 111 and 113; BM 101, 107, 108, 109, 111 and 112. Both WH 6C and BH 109B did not pass the pressure analysis and were remediated. In addition, a total of 21 multiple arm caliper tests, used to detect deformations in pipe walls, were performed at BH, BM, and WH. These tests resulted in a total of 5 remediations: BH 109B and 105B, BM 106A, WH 8, and WH 6 Slick. Environmental Awards The SPR was the recipient of the DOE “EStar Award” in 2011 for the development of the Buy It Green (BIG) list for the procurement of green products. DOE On-Site Appraisal SPRPMO On-Site Management Appraisal teams conduct formal visits to SPR sites annually. The teams meet with site contractor management staff and audit environmental compliance and EMS practices, records management, annual reporting requirements, survey performance indicators, and review the audit findings with the contractor staff during exit briefings. Issues reviewed in Fiscal Year (FY) 2011 included waste characterization/determinations accuracy and records inventory management. During FY 2011 there were three low risk environmental findings associated with the audits. Root cause and corrective actions were identified for all findings and tracked to closure in the SPR’s Assessment Tracking System (ATS). M&O Contractor Organizational Assessment The New Orleans environmental group conducted annual EMS and compliance assessments at all five sites in FY 2011. Assessors were independent of the operating sites and were not accountable to those directly responsible for the issues audited. EMS related issues were examined based on all 17 elements of the ISO 14001:2004 Standard. All elements were reviewed at least once (and many twice) during the audit year. Environmental compliance was examined through the framework of the EMS and included compliance with regulations, DOE contract requirements, and other internal and external requirements such as management oversight and reporting, air, water, waste, toxic chemicals, pollution prevention programs, and EO 13423. Specific audit topics are chosen based on current management concerns and the results of previous audits. Waste management, management of chemical products, and the use of the SPR Qualified Products List (QPL) continued to be environmental concerns for 2011. DM identified 13 environmental compliance findings and 0 EMS nonconformities during FY 2011. All compliance findings were classified as low risk hazards, minor deviations from internal requirements and regulations. CAPs were developed and implemented for all. Findings are tracked to completion in ATS. Table 2-7 tabulates the 2011 findings/non-conformities by site.
AAA9020459 Version 1.0 Section 2 - Page 17
Table 2-7. FY 2011 M&O Contractor Organizational Assessment
Environmental Findings and Non-Conformances
Site
High Risk Hazard
(compliance)
Medium Risk Hazard
(compliance)
Low Risk Hazard
(compliance)
Low Risk
Hazard EMS Bayou Choctaw 0 0 2 0
Big Hill 0 0 1 0
Bryan Mound 0 0 5 0
New Orleans 0 0 1 0
West Hackberry 0 0 4 0
Third Party EMS Audits Two surveillance audits were conducted in 2011 by the DM ISO 14001 CB, Advanced Waste Management Systems, Inc. Each crude oil storage site and the Stennis Warehouse were audited once, and the New Orleans headquarters was audited twice. At the conclusion of the surveillance audits a recommendation was given to maintain the ISO 14001 certification. The minor nonconformities from 2009 and 2010 both remained open through all of 2011.
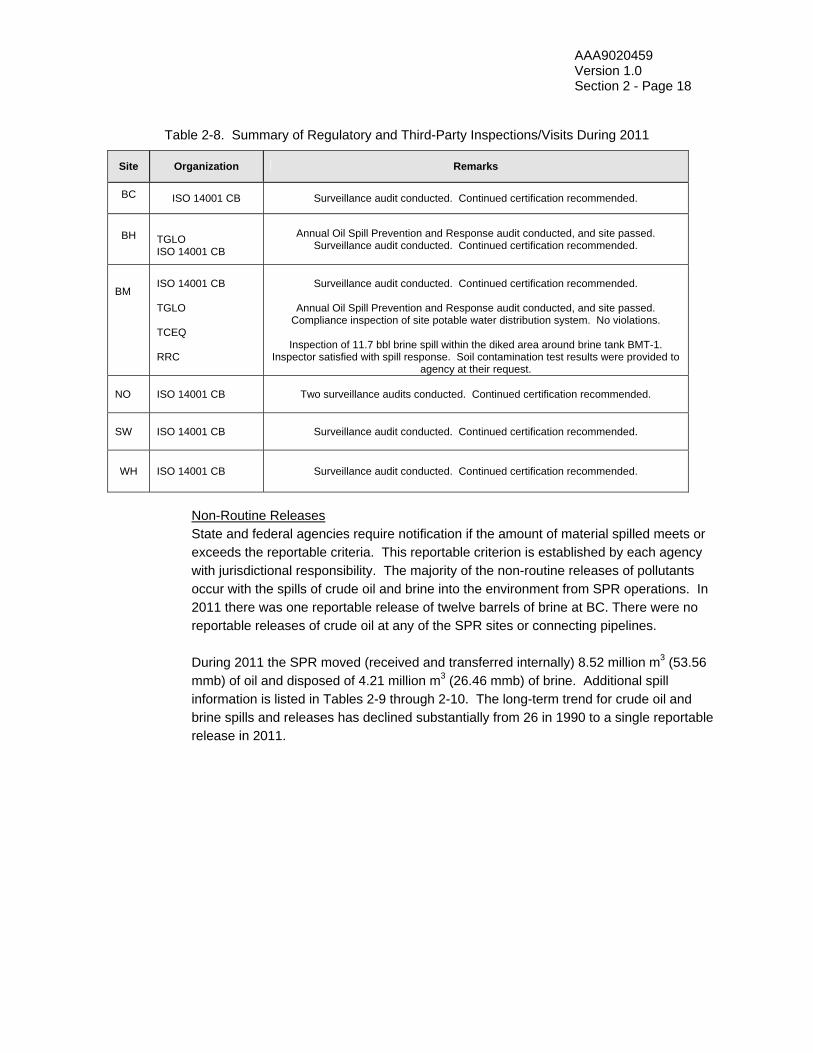
Regulatory and ISO 14001 Registrar Inspections/Visits There were ten inspections or visits by or on behalf of regulatory agencies and the ISO 14001 CB to SPR facilities in 2011. These visits are summarized in Table 2-8. The regulatory visits are usually routine and are conducted by the regulatory agencies to ensure compliance or to address concerns regarding activities at the SPR facilities. The ISO 14001 registrar’s visits were to conduct two semiannual audits – a recertification audit and a surveillance audit. There was one finding associated with the CB’s recertification audit.
AAA9020459 Version 1.0 Section 2 - Page 18
Table 2-8. Summary of Regulatory and Third-Party Inspections/Visits During 2011
Site Organization Remarks
BC ISO 14001 CB Surveillance audit conducted. Continued certification recommended.
BH TGLO ISO 14001 CB
Annual Oil Spill Prevention and Response audit conducted, and site passed. Surveillance audit conducted. Continued certification recommended.
BM
ISO 14001 CB TGLO TCEQ RRC
Surveillance audit conducted. Continued certification recommended.
Annual Oil Spill Prevention and Response audit conducted, and site passed.
Compliance inspection of site potable water distribution system. No violations.
Inspection of 11.7 bbl brine spill within the diked area around brine tank BMT-1. Inspector satisfied with spill response. Soil contamination test results were provided to
agency at their request. NO
ISO 14001 CB
Two surveillance audits conducted. Continued certification recommended.
SW
ISO 14001 CB
Surveillance audit conducted. Continued certification recommended.
WH ISO 14001 CB Surveillance audit conducted. Continued certification recommended.
Non-Routine Releases State and federal agencies require notification if the amount of material spilled meets or exceeds the reportable criteria. This reportable criterion is established by each agency with jurisdictional responsibility. The majority of the non-routine releases of pollutants occur with the spills of crude oil and brine into the environment from SPR operations. In 2011 there was one reportable release of twelve barrels of brine at BC. There were no reportable releases of crude oil at any of the SPR sites or connecting pipelines. During 2011 the SPR moved (received and transferred internally) 8.52 million m3 (53.56 mmb) of oil and disposed of 4.21 million m3 (26.46 mmb) of brine. Additional spill information is listed in Tables 2-9 through 2-10. The long-term trend for crude oil and brine spills and releases has declined substantially from 26 in 1990 to a single reportable release in 2011.

AAA9020459 Version 1.0 Section 2 - Page 19
Figure 2-3. Number of Reportable Crude Oil & Brine Spills 1990-2011
Table 2-9. Number of Reportable Oil Spills
Year
Total Spills
Volume Spilled m3 (barrels)
Percent Spilled of Total Throughput
1982 24 847.0 (5,328) 0.00704 1983 21 380.9 (2,396) 0.00281 1984 13 134.8 (848) 0.00119 1985 7 85.4 (537) 0.00122 1986 5 1232.5 (7,753) 0.01041 1987 5 2.5 (16) 0.00002 1988 6 8.8 (55) 0.00001 1989 11 136.4 (858) 0.00004 1990 14 74.8 (467) 0.00003 1991 6 37.9 (237) 0.0004 1992 5 1.9 (12) 0.00006 1993 6 36.9 (232) 0.0007 1994 7 6.2 (39) 0.0003 1995 2 56.3 (354) 0.0006 1996 4 4.7 (30) 0.00002 1997 1 0.32 (2) 4.0 x 10⁻⁹ 1998 1 Sheen N/A 1999 1 31.8 (200) 0.00056 2000 1 11.1 (70) 0.00011 2001 2 1.6 (10) 0.0000163 2002 0 0 0.0 2003 3 1.1 (7) 0.0000104 2004 0 0 0.0 2005 0 0 0.0 2006 2 0.5 (3) 3.3 x 10⁻⁶
2007 0 0 0.0 2008 0 0 0.0 2009 0 0 0.0 2010 0 0 0.0 2011 0 0 0.0

AAA9020459 Version 1.0 Section 2 - Page 20
Table 2-10. Number of Reportable Brine Spills
2.3 SUMMARY OF PERMITS (JAN. 1, 2011 THROUGH DEC. 31, 2011)
General Permits in effect during 2011 include 8 state and federal CWA wastewater discharge permits, 5 CAA permits, 35 active original structure COE wetlands (Section 404 of CWA) permits (not counting associated modifications and amendments), and more than 100 oil field pit, underground injection well, and mining permits. In addition, a number of other minor permits were in effect during the year. Many of these major permits are presented in tabular form in Section 3, Tables 3-2 through 3-6. During calendar year 2011, the LDEQ issued the modified WH air permit, effective July 27, 2011; which added the degas plant emissions for when the unit moves from the BM site to WH. The BM air permit renewal application, which included the emissions from the BM degas plant air permit, was submitted to TCEQ on November 28, 2011. The current BM air permit expires on June 11, 2012, but it is still applicable while TCEQ is processing the BM air permit renewal application. In calendar year 2011, the LDEQ issued renewed state (LPDES) water discharge authority to BC, effective August, 2011; and the RCT issued a renewed state permit to discharge water to the BH site effective on January 1, 2011.
Year
Total Spills
Volume Spilled m3 (barrels)
Percent Spilled of Total Throughput
1982 43 443.8 (2,792) 0.0005 1983 44 259.4 (1,632) 0.0002 1984 17 314.0 (1,975) 0.0003 1985 16 96,494.8 (607,000) 0.1308 1986 7 275.6 (1,734) 0.0017 1987 22 96.5 (608) 0.0003 1988 12 93.8 (586) 0.0001 1989 17 131,231.6 (825,512) 0.1395 1990 12 11,944.3 (74,650) 0.0170 1991 7 1,156.8 (7,230) 0.004 1992 9 48.0 (302) 0.003 1993 6 59.2 (370) 0.001 1994 2 14.4 (90) 0.0006 1995 3 131.1 (825) 0.0028 1996 5 179.7 (1,130) 0.0014 1997 0 0 0.0 1998 3 6.2 (39) 0.00028 1999 0 0 0.0 2000 0 0 0.0 2001 1 0.019 (0.12) 5.60 x 10⁻⁷ 2002 2 2.1 (13) 3.9 x 10⁻⁶ 2003 0 0 0.0 2004 1 1.6 (10) 2.2 x 10⁻⁷ 2005 1 27 .0 (170) 5.5x10⁻⁶ 2006 0 0 0.0 2007 0 0 0.0 2008 0 0 0.0 2009 1 0.8 (5) 0.000018 2010 0 0 0.0 2011 1 1.9 (12) 0.000045
AAA9020459 Version 1.0 Section 2 - Page 21
Permit Compliance Compliance with environmental permits is assured by meeting the conditions detailed within the permit. These conditions can be monitoring of components or processes, monitoring of pollutant effluents to ensure they meet permit limits, maintaining structures in their original condition, and inspecting facilities.
Air quality operating permits require piping components such as valves, flanges, pressure relief valves, and pump seals be inspected for leaks of VOCs on a regular basis (biennially in Texas and annually in Louisiana) using organic vapor analyzers (OVA). In addition, the Texas permits require that the flanges be inspected visually, audibly, and or by olfactory methods to identify any possible leaks on a weekly basis. All SPR air permits contain permit limitations based on pollutant emission rates in pounds per hour and tons per year.
The SPR ensures compliance with these permit limits by monitoring the processes that emit the pollutants. This includes monitoring use of generators, volumes of crude oil, diesel, and gasoline moved through tanks, volume of paint, and others. The results of this monitoring are reported to the agencies annually by BM and BH (if applicable) through an Emissions Inventory Questionnaire (EIQ). The BC and WH sites do not require reporting because they are below the required emission limit to report in Louisiana. All 2011 air reports were submitted to the appropriate agencies on time. Water discharge permits require that analytical permit limits are met and reported. Other permit conditions require visual monitoring of the effluents to ensure that they have no visible sheen or foaming. All SPR sites periodically (daily, monthly and/or quarterly) monitor permit limit compliance with quarterly reporting through the NPDES, LPDES, and RCT Statewide Rule 8 Discharge Monitoring Reports (DMRs). All such reports were submitted to the appropriate agencies on time in 2011. Non-compliances There were no permit non-compliances on the SPR out of a total of 1244 permit-related analyses reported in 2011. With zero permit non-compliances an overall project-wide compliance rate of 100 percent for 2011 was achieved. Environmental Reportable Project Events Project events equal all reportable spills, and all discharge permit non-compliances. These events are used to provide a summary of SPR performance as illustrated in Figure 2-4. During 2011 there was a single environmental reportable project event at the SPR.
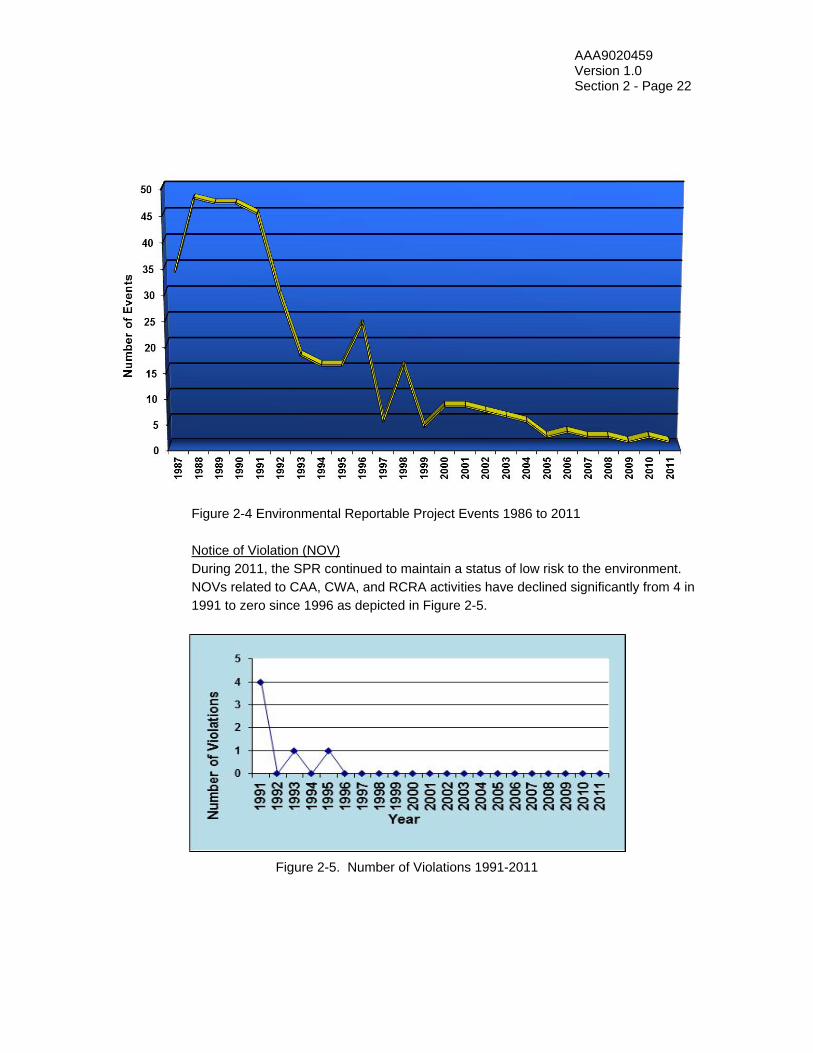
AAA9020459 Version 1.0 Section 2 - Page 22
Figure 2-4 Environmental Reportable Project Events 1986 to 2011 Notice of Violation (NOV) During 2011, the SPR continued to maintain a status of low risk to the environment. NOVs related to CAA, CWA, and RCRA activities have declined significantly from 4 in 1991 to zero since 1996 as depicted in Figure 2-5.
Figure 2-5. Number of Violations 1991-2011
AAA9020459 Version 1.0 Section 2 - Page 23
2.4 SUCCESS IN MEETING PERFORMANCE MEASURES
General Forty-one performance measures were tracked by the SPR EMS in FY 2011. A performance measure that is part of the EMS is identified as an environmental objective. A target (preferably a metric that can be measured) is established for each objective. Some objectives have two targets, a minimum level that all DOE contractors should meet as a minimum and a more challenging “stretch” level. Refer to Tables 2-11 and 2-12 for a description of objectives and targets.
All of the EMS targets are either identified directly in contract Work Authorization Directives (WADs) as contract objectives or support the WADs, or indirectly through activities required by the DOE Strategic Sustainability Performance Plan (SSPP) to achieve Executive Orders 13423 and 13514. Objectives and targets are jointly developed for each fiscal year by DOE and DM and tracked for success. Some objectives focus on specific disciplines, such as the Environmental or Emergency Management departments, while others involve all disciplines. Several at BH and BM have supported environmental commitments made for TCEQ’s Clean Texas program (now disbanded). All performance measures were related to significant environmental aspects or interests to top management. Success in Meeting Environmental Objectives Refer To Tables 2-11 and 2-12 for synopses in meeting performance measures. Table 2-11 delineates those objectives that have been achieved and tracked for more than 6 to 10 years. Identified as “institutional” objectives, these are based strictly on SPR-specific environmental aspects. Table 2-12 delineates additional objectives that support the goals of the DOE SSPP. These are required by Executive Orders 13423 and 13514, and are based on global environmental aspects.
SPR-Specific (Institutional) Objectives Refer to Table 2-11 for information on SPR specific objectives. Of the 20 institutional environmental objectives tracked in FY 2011, 19 were met or surpassed at the more challenging stretch target level. One objective did not meet the target (ID # 9 in Table 2-11); all of the sites but 1 were able to meet the target. Most of the environmental objectives have been tracked for several years. The following highlights provide an overview of the 5 to 9-year measurements of success in meeting the targets:
improved performance on 1 objective o increase recycling of sanitary waste
steady performance on 18 objectives o reduce permit exceedances o avoid regulatory violations o reduce reportable releases o reduce generation of hazardous waste o reduce generation of sanitary waste o purchase affirmative procurement products o increase purchasing of biobased products o review all documents sent to the Environmental Department o submit environmental documents on time to DOE and regulators o complete and submit Pipeline and Pipeline Integrity Report

AAA9020459 Version 1.0 Section 2 - Page 24
o have key emergency equipment available o have basic ordering agreements in place for emergencies o train number of ERT personnel o complete PREP exercises o plan and administer effective community outreach program o provide on site habitat for wildlife o meet maintenance performance appraisal report (MPAR) index o conduct predictive maintenance program
waning performance on 1 objective o increase use of the Qualified Products List
SSPP Objectives Refer to Table 2-12. Of the 25 SSPP objectives (seven of which are also considered institutional) tracked in FY 2011, 10 were achieved, 8 were progressing toward achievement, and 7 had not yet shown progress. Achieved Success
o Reduce Departmental fleet petroleum use and Increase use of alternative fuels. Acquire alternative fuel vehicles for light duty.
o Minimize waste generation and pollutants through source reduction o Divert construction/demolition materials and debris for recycling o Reduce paper use and acquisition o Meet sustainable procurement requirements o Reduce/minimize quantity of toxic/hazardous chemicals and materials
acquired, used, or disposed of. o Implement integrated pest management and other appropriate landscape
management practices. o Use acceptable alternative chemicals and processes that support
procurement policies. o Decrease use of chemicals that would jeopardize achieving green house gas
emission reduction targets. o Ensure that PC’s laptops, and monitors will be energy efficient.
Progressing Toward Achievement
o Reduce Scope 1 and 2 green house gas emissions o Reduce Scope 3 green house gas o Install metering for electricity and water o Install cool roofs o Reduce or eliminate the use of sulfur hexafluoride (SF6) o Reduce potable water use o Increase number of high performance sustainable buildings on the SPR o Divert non-hazardous solid waste (excluding construction/demolition debris)
for recycling
No Progress Yet Toward Achievement o Provide on-site renewable energy generation o Reduce energy intensity o Train personnel to direct energy and water management programs o Reduce industrial/landscaping/agricultural water use o Divert compostable and organic material from the waste stream. o Meter all data centers o Data centers will have a PUE of 1.4

AAA9017.10 Version 1.0 Section 2 - Page 25
Table 2-11. FY 11 SPR–SPECIFIC OBJECTIVES AND TARGETS WITH PERFORMANCE
ID # WAD ID Aspect Objective Target
Minimum Target
Level of Achievement
in FY 2011
Performance (Since FY00)
Trend
1 2011 - 1.J.I (ENV)
Discharges Reduce permit exceedances reported on the Discharge Monitoring Reports
No more than 8 annually
No more than 4 annually
Zero for 2011. 9 in 2000 4 in 2001 2 in 2002 6 in 2003 3 in 2004 1 in 2005 1 in 2006 1 in 2007 2 in 2008 0 in 2009 2 in 2010
Steady for the most part.
2 2011 - 1.J (ENV)
Spill Discharges Air Emissions Monitoring Wetlands disturbance Drainage Navigation Public exposure
Avoid cited Clean Water Act, Clean Air Act, and RCRA (waste) enforcement actions (notices of violations)
Not Applicable 0 per year Met target. 0 violations
0 violations from FY00 through 2007 and past 10 years.
Rock steady
3 2011 – 1.J.I (ENV)
Spill Reduce reportable occurrences of releases from operational facilities
No more than 8 annually
No more than 4 annually
Zero for 2011. 1 in 2000 4 in 2001 1 in 2002 4 in 2003 2 in 2004 1 in 2005 1 in 2006 0 in 2007 1 in 2008 0 in 2009 1 in 2010
Steady for the most part.
4 2011 - 1.J.1.a (ENV)
Waste Reduce total amount of hazardous waste generated.
Not Applicable No more than 450 lbs/yr total
230 lbs. for 2011. 51% of maximum.
3802 lbs in 2000 1712 lbs in 2001 717 lbs in 2002 865 lbs in 2003 1333 lbs in 2004 495 lbs in 2005 268 lbs in 2006 182 lbs in 2007 290 lbs in 2008 227.9 lbs in 2009 266 lbs in 2010
Decreased greatly after 2004. Began to increase in 2008, but decreased again in 2009. Performance remains within range over last 4 years.
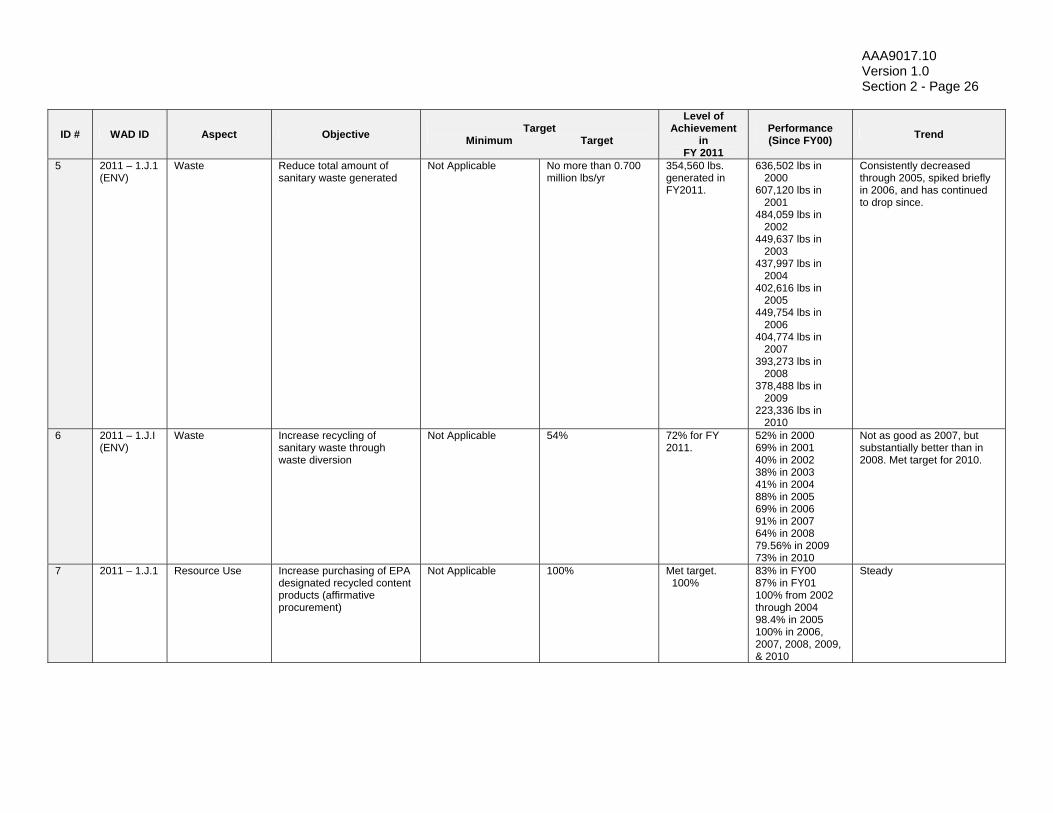
AAA9017.10 Version 1.0 Section 2 - Page 26
ID # WAD ID Aspect Objective Target
Minimum Target
Level of Achievement
in FY 2011
Performance (Since FY00)
Trend
5 2011 – 1.J.1 (ENV)
Waste Reduce total amount of sanitary waste generated
Not Applicable No more than 0.700 million lbs/yr
354,560 lbs. generated in FY2011.
636,502 lbs in 2000 607,120 lbs in 2001 484,059 lbs in 2002 449,637 lbs in 2003 437,997 lbs in 2004 402,616 lbs in 2005 449,754 lbs in 2006 404,774 lbs in 2007 393,273 lbs in 2008 378,488 lbs in 2009 223,336 lbs in 2010
Consistently decreased through 2005, spiked briefly in 2006, and has continued to drop since.
6 2011 – 1.J.I (ENV)
Waste Increase recycling of sanitary waste through waste diversion
Not Applicable 54%
72% for FY 2011.
52% in 2000 69% in 2001 40% in 2002 38% in 2003 41% in 2004 88% in 2005 69% in 2006 91% in 2007 64% in 2008 79.56% in 2009 73% in 2010
Not as good as 2007, but substantially better than in 2008. Met target for 2010.
7 2011 – 1.J.1
Resource Use Increase purchasing of EPA designated recycled content products (affirmative procurement)
Not Applicable 100% Met target. 100%
83% in FY00 87% in FY01 100% from 2002 through 2004 98.4% in 2005 100% in 2006, 2007, 2008, 2009, & 2010
Steady
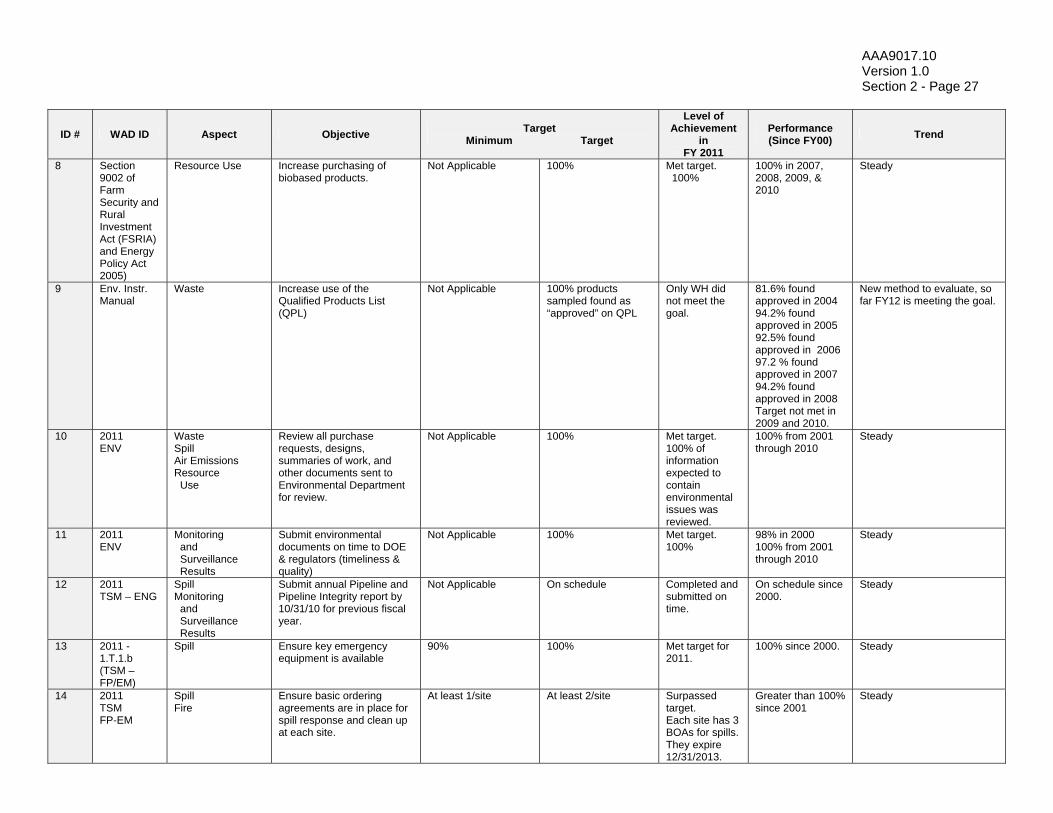
AAA9017.10 Version 1.0 Section 2 - Page 27
ID # WAD ID Aspect Objective Target
Minimum Target
Level of Achievement
in FY 2011
Performance (Since FY00)
Trend
8 Section 9002 of Farm Security and Rural Investment Act (FSRIA) and Energy Policy Act 2005)
Resource Use Increase purchasing of biobased products.
Not Applicable 100% Met target. 100%
100% in 2007, 2008, 2009, & 2010
Steady
9 Env. Instr. Manual
Waste Increase use of the Qualified Products List (QPL)
Not Applicable 100% products sampled found as “approved” on QPL
Only WH did not meet the goal.
81.6% found approved in 2004 94.2% found approved in 2005 92.5% found approved in 2006 97.2 % found approved in 2007 94.2% found approved in 2008 Target not met in 2009 and 2010.
New method to evaluate, so far FY12 is meeting the goal.
10 2011 ENV
Waste Spill Air Emissions Resource Use
Review all purchase requests, designs, summaries of work, and other documents sent to Environmental Department for review.
Not Applicable 100% Met target. 100% of information expected to contain environmental issues was reviewed.
100% from 2001 through 2010
Steady
11 2011 ENV
Monitoring and Surveillance Results
Submit environmental documents on time to DOE & regulators (timeliness & quality)
Not Applicable 100% Met target. 100%
98% in 2000 100% from 2001 through 2010
Steady
12 2011 TSM – ENG
Spill Monitoring and Surveillance Results
Submit annual Pipeline and Pipeline Integrity report by 10/31/10 for previous fiscal year.
Not Applicable On schedule Completed and submitted on time.
On schedule since 2000.
Steady
13 2011 - 1.T.1.b (TSM – FP/EM)
Spill Ensure key emergency equipment is available
90% 100% Met target for 2011.
100% since 2000. Steady
14 2011 TSM FP-EM
Spill Fire
Ensure basic ordering agreements are in place for spill response and clean up at each site.
At least 1/site At least 2/site Surpassed target. Each site has 3 BOAs for spills. They expire 12/31/2013.
Greater than 100% since 2001
Steady
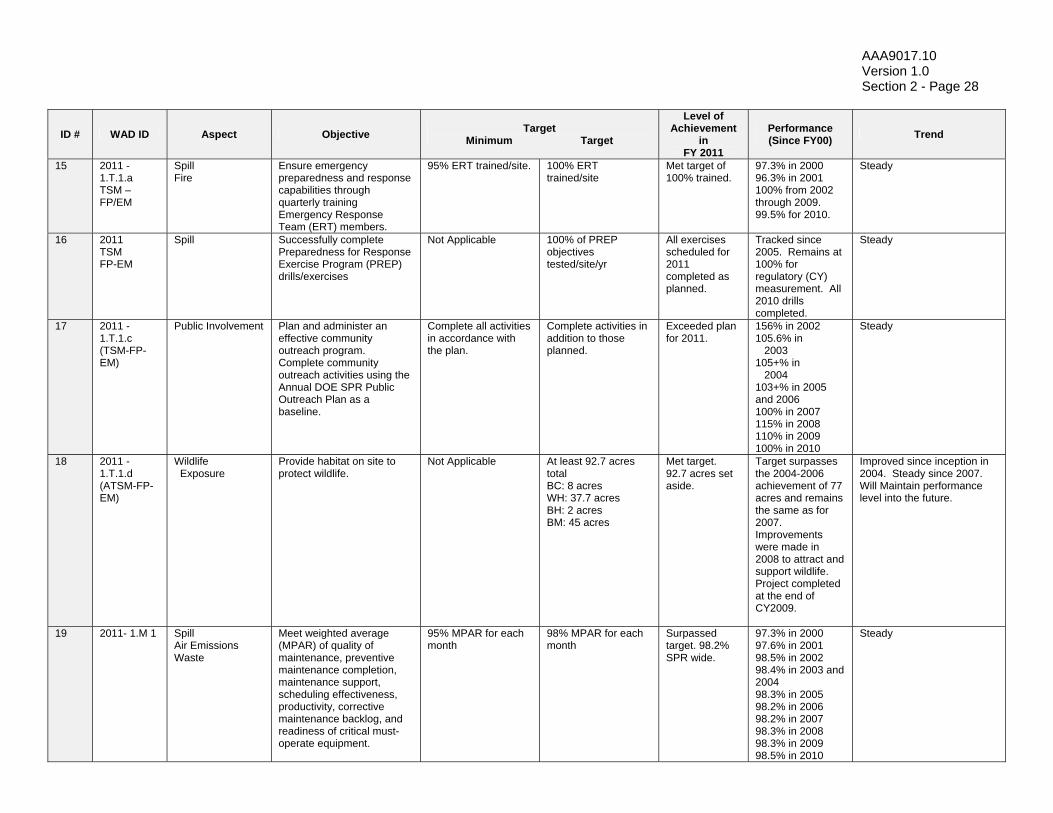
AAA9017.10 Version 1.0 Section 2 - Page 28
ID # WAD ID Aspect Objective Target
Minimum Target
Level of Achievement
in FY 2011
Performance (Since FY00)
Trend
15 2011 - 1.T.1.a TSM – FP/EM
Spill Fire
Ensure emergency preparedness and response capabilities through quarterly training Emergency Response Team (ERT) members.
95% ERT trained/site.
100% ERT trained/site
Met target of 100% trained.
97.3% in 2000 96.3% in 2001 100% from 2002 through 2009. 99.5% for 2010.
Steady
16 2011 TSM FP-EM
Spill Successfully complete Preparedness for Response Exercise Program (PREP) drills/exercises
Not Applicable 100% of PREP objectives tested/site/yr
All exercises scheduled for 2011 completed as planned.
Tracked since 2005. Remains at 100% for regulatory (CY) measurement. All 2010 drills completed.
Steady
17 2011 - 1.T.1.c (TSM-FP-EM)
Public Involvement Plan and administer an effective community outreach program. Complete community outreach activities using the Annual DOE SPR Public Outreach Plan as a baseline.
Complete all activities in accordance with the plan.
Complete activities in addition to those planned.
Exceeded plan for 2011.
156% in 2002 105.6% in 2003 105+% in 2004 103+% in 2005 and 2006 100% in 2007 115% in 2008 110% in 2009 100% in 2010
Steady
18 2011 - 1.T.1.d (ATSM-FP-EM)
Wildlife Exposure
Provide habitat on site to protect wildlife.
Not Applicable At least 92.7 acres total BC: 8 acres WH: 37.7 acres BH: 2 acres BM: 45 acres
Met target. 92.7 acres set aside.
Target surpasses the 2004-2006 achievement of 77 acres and remains the same as for 2007. Improvements were made in 2008 to attract and support wildlife. Project completed at the end of CY2009.
Improved since inception in 2004. Steady since 2007. Will Maintain performance level into the future.
19 2011- 1.M 1 Spill Air Emissions Waste
Meet weighted average (MPAR) of quality of maintenance, preventive maintenance completion, maintenance support, scheduling effectiveness, productivity, corrective maintenance backlog, and readiness of critical must-operate equipment.
95% MPAR for each month
98% MPAR for each month
Surpassed target. 98.2% SPR wide.
97.3% in 2000 97.6% in 2001 98.5% in 2002 98.4% in 2003 and 2004 98.3% in 2005 98.2% in 2006 98.2% in 2007 98.3% in 2008 98.3% in 2009 98.5% in 2010
Steady

AAA9017.10 Version 1.0 Section 2 - Page 29
ID # WAD ID Aspect Objective Target
Minimum Target
Level of Achievement
in FY 2011
Performance (Since FY00)
Trend
20 2011- 1.M 2 Resource Use
Conduct a predictive maintenance program (PdM) that will identify potential equipment failures.
Achieve 90% weighted average PdM Index each month
Achieve 95% weighted average PdM Index each month
Surpassed target. 100% SPR wide.
Completed scheduled PdM activities: 99.5% in 2003 99.98% in 2004 99.93% in 2005 100% in 2006 98.8% in 2007 99.8% in 2008 98.8% in 2009 99.98% in 2010
Steady
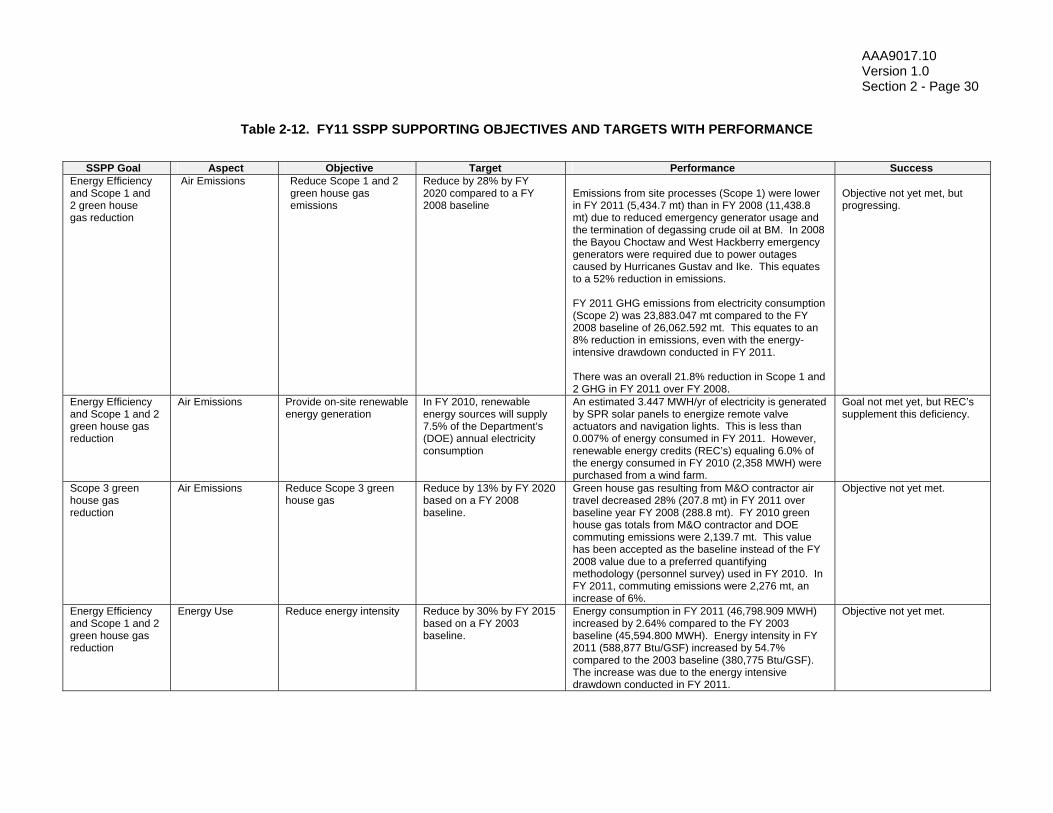
AAA9017.10 Version 1.0 Section 2 - Page 30
Table 2-12. FY11 SSPP SUPPORTING OBJECTIVES AND TARGETS WITH PERFORMANCE
SSPP Goal Aspect Objective Target Performance Success
Energy Efficiency and Scope 1 and 2 green house gas reduction
Air Emissions Reduce Scope 1 and 2 green house gas emissions
Reduce by 28% by FY 2020 compared to a FY 2008 baseline
Emissions from site processes (Scope 1) were lower in FY 2011 (5,434.7 mt) than in FY 2008 (11,438.8 mt) due to reduced emergency generator usage and the termination of degassing crude oil at BM. In 2008 the Bayou Choctaw and West Hackberry emergency generators were required due to power outages caused by Hurricanes Gustav and Ike. This equates to a 52% reduction in emissions. FY 2011 GHG emissions from electricity consumption (Scope 2) was 23,883.047 mt compared to the FY 2008 baseline of 26,062.592 mt. This equates to an 8% reduction in emissions, even with the energy-intensive drawdown conducted in FY 2011. There was an overall 21.8% reduction in Scope 1 and 2 GHG in FY 2011 over FY 2008.
Objective not yet met, but progressing.
Energy Efficiency and Scope 1 and 2 green house gas reduction
Air Emissions Provide on-site renewable energy generation
In FY 2010, renewable energy sources will supply 7.5% of the Department’s (DOE) annual electricity consumption
An estimated 3.447 MWH/yr of electricity is generated by SPR solar panels to energize remote valve actuators and navigation lights. This is less than 0.007% of energy consumed in FY 2011. However, renewable energy credits (REC’s) equaling 6.0% of the energy consumed in FY 2010 (2,358 MWH) were purchased from a wind farm.
Goal not met yet, but REC’s supplement this deficiency.
Scope 3 green house gas reduction
Air Emissions Reduce Scope 3 green house gas
Reduce by 13% by FY 2020 based on a FY 2008 baseline.
Green house gas resulting from M&O contractor air travel decreased 28% (207.8 mt) in FY 2011 over baseline year FY 2008 (288.8 mt). FY 2010 green house gas totals from M&O contractor and DOE commuting emissions were 2,139.7 mt. This value has been accepted as the baseline instead of the FY 2008 value due to a preferred quantifying methodology (personnel survey) used in FY 2010. In FY 2011, commuting emissions were 2,276 mt, an increase of 6%.
Objective not yet met.
Energy Efficiency and Scope 1 and 2 green house gas reduction
Energy Use Reduce energy intensity Reduce by 30% by FY 2015 based on a FY 2003 baseline.
Energy consumption in FY 2011 (46,798.909 MWH) increased by 2.64% compared to the FY 2003 baseline (45,594.800 MWH). Energy intensity in FY 2011 (588,877 Btu/GSF) increased by 54.7% compared to the 2003 baseline (380,775 Btu/GSF). The increase was due to the energy intensive drawdown conducted in FY 2011.
Objective not yet met.

AAA9017.10 Version 1.0 Section 2 - Page 31
SSPP Goal Aspect Objective Target Performance Success Energy Efficiency and Scope 1 and 2 green house gas reduction
Air Emissions
Reduce Departmental fleet petroleum use and Increase use of alternative fuels. Acquire alternative fuel vehicles for light duty.
Reduce petroleum use by 2% annually and by 30% by FY 2020, based on a FY 2005 baseline. Increase use of alternative fuels by 10% year over year. Strive to meet 75% acquisition of alternative fuel vehicles by FY 2015, if available.
SPR fleet fuel consumption in FY 2011 (45,684 gal) decreased by 64% over the FY 2005 baseline consumption (142,477 gal). No alternative fuels were used by SPR fleet vehicles in FY 2011, but 57% of the vehicles were E85 fuel compatible. An AFV waiver was submitted to DOE Headquarters due to the lack of an alternative fuel (LPG or E85 fuels) infrastructure for AFV’s in the areas around SPR sites. In FY 2011 12 hybrid vehicles (eight sedans, one SUV, and three trucks) replaced equivalent customary vehicles, and five vehicles were dropped from the fleet. There have been no purchases of alternative fuel vehicles.
Fuel reduction objective met and surpassed. Progressing on the vehicle reduction and AFV acquisition targets.
Energy Efficiency and Scope 1 and 2 green house gas reduction Water use efficiency and management
Energy and Water Use
Install metering for electricity and water.
To the maximum extent practicable, install advanced metering for electricity and standard metering for water.
No additional advanced or standard metering installed in FY 201, but electricity and water metering are being considered for buildings selected to be renovated to LEED or Guiding Principles specifications. As many as 13 buildings will need to be metered in order to capture energy consumption data on eight of the buildings identified for renovation.
Objective progressing but not yet met.
Energy Efficiency and Scope 1 and 2 green house gas reduction
Energy Use Install cool roofs Install cool roofs, unless uneconomical, for applicable building roof replacements.
No cool roofs were installed in FY 2011. Cool roof requirements and applicability will be evaluated on all future roof replacements of existing buildings and new buildings.
Objective will be met when the appropriate application occurs.
Energy Efficiency and Scope 1 and 2 green house gas reduction Water use efficiency and management
Energy and Water Use
Train personnel to direct energy and water management programs.
Trained personnel will direct energy and water management programs and dedicate all or a substantial portion of their time to effective implementation of energy and water management plans. DOE facility energy managers are to be certified energy managers by 9/12.
The SPR has not yet identified a person to become a certified energy manager. The position has not yet been created, but SPR staff will continue to attend conferences and attend FEMP sponsored web-based training to enhance their current knowledge base.
Objective not yet met.
Energy Efficiency and Scope 1 and 2 green house gas reduction
Air Emissions Reduce or eliminate the use of sulfur hexafluoride (SF6).
Establish a sulfur hexafluoride (SF6) management program to control and reduce or eliminate SF6 fugitive emissions.
Key SF6 emission sources (totaling 225 lbs) have been identified and are being monitored and managed to prevent loss. At WH, a 30 lb release occurred due to a gauge tubing fracture. This equates to 326.1 mt of CO2. Maintenance contracts require its control, and procurement is monitored to control the amount purchased. SF6 is used in relatively small quantities on the SPR, and it is managed to prevent release. It can be eliminated only with the replacement of expensive circuit breakers that currently harbor the chemical. When this equipment reaches end of service, replacements that do not use SF6 will be sought.
Objective not yet met, but progressing.

AAA9017.10 Version 1.0 Section 2 - Page 32
SSPP Goal Aspect Objective Target Performance Success High performance sustainable design
Project Design Increase number of high performance sustainable buildings on the SPR
15% of enduring buildings larger than 5,000 gross sq ft (GSF) on the SPR must be compliant with the five guiding principles of the High Performance Sustainable Building by 2015.
In FY 2011 no buildings complied with the Guiding Principles, but eight buildings were identified for upgrading tot meet the 15% target by FY 2015. The DOE A/E contractors conducted a gap analysis to identify necessary projects required to bring these buildings into compliance. A schedule and cost estimate were also developed.
Objective not yet met, but progressing.
Water use efficiency and management
Water Use Reduce potable water use
Reduce potable water intensity by 16% by FY 2015 and 26% by FY 2020, based on a FY 2007 baseline.
Potable water consumed in FY 2011 was 18.183 million gallons, as compared to 10.399 million gallons consumed in FY 2007. This is a 74.8% increase in consumption. Potable water intensity in FY 2011 was 50.168 gal/GSF compared to 32.132 gal/GSF in FY 2007. This is a 56.1% increase in water intensity. The dramatic increase in FY 2011 was due to a drawdown. Potable water was used for pump bearing cooling and seal flushing.
Objective not yet met, but progressing.
Water use efficiency and management
Water Use Reduce industrial/landscaping/ agricultural water use
Reduce industrial/landscaping/ agricultural water consumption by 20% by FY 2020, based on an FY 2010 baseline.
The only significant source of ILA water (non-potable freshwater) on the SPR is from an on-site well at WH that is used to flush brine strings (brine piping that extends down into the caverns) and serves as fire water and seal flush water for pumps. During FY 2010, 5.120 million gallons were used. In FY 2011, 5.467 million gallons were used, a 6.8% increase in FY 2011 due to increased demand for workover and drawdown activities.
Objective not yet met.
Pollution prevention and waste elimination
Waste Minimize waste generation and pollutants through source reduction
Refer to objectives 4 and 5 in Table 2-11.
Refer to objectives 4 and 5 in Table 2-11. Targets achieved. Refer to objectives 4 and 5 in Table 2-11.
Pollution prevention and waste elimination
Waste Divert non-hazardous solid waste (excluding construction/demolition debris) for recycling.
Divert at least 50% of non-hazardous solid waste (excluding construction/demolition debris) by the end of FY 2015.
Refer to related objective 6 in Table 2-11. In FY 2011, 1011 mt of non-hazardous, non-construction solid waste was managed. Of this, 36% was recycled. The primary waste streams that were recycled included abrasives, exploration and production wastes, cardboard, paper, and used oil. The primary waste streams that were disposed of as waste included municipal solid waste, exploration and production wastes that could not be recycled, and sewage sludge.
Target was not achieved this year despite program in place to minimize waste. To help minimize waste generation, waste determinations are generated and documented on each waste stream, including those that are destined for recycling. Effort continues to segregate re-useable materials from the SPR wastes.
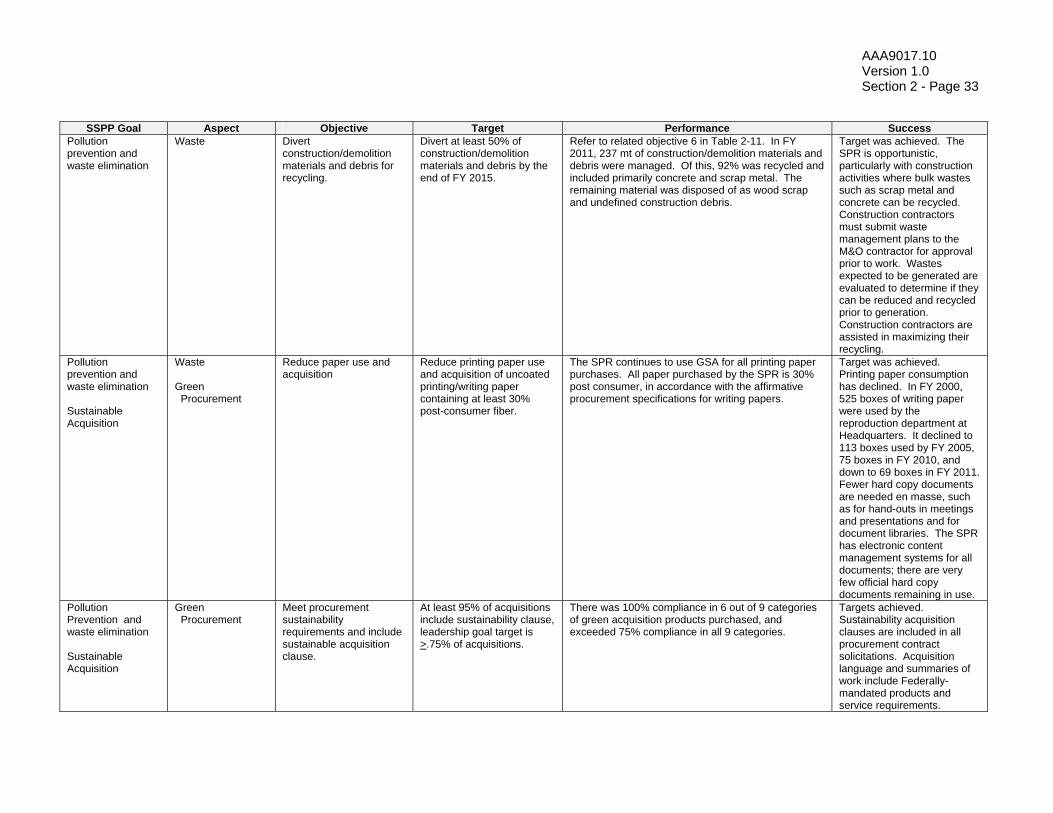
AAA9017.10 Version 1.0 Section 2 - Page 33
SSPP Goal Aspect Objective Target Performance Success Pollution prevention and waste elimination
Waste Divert construction/demolition materials and debris for recycling.
Divert at least 50% of construction/demolition materials and debris by the end of FY 2015.
Refer to related objective 6 in Table 2-11. In FY 2011, 237 mt of construction/demolition materials and debris were managed. Of this, 92% was recycled and included primarily concrete and scrap metal. The remaining material was disposed of as wood scrap and undefined construction debris.
Target was achieved. The SPR is opportunistic, particularly with construction activities where bulk wastes such as scrap metal and concrete can be recycled. Construction contractors must submit waste management plans to the M&O contractor for approval prior to work. Wastes expected to be generated are evaluated to determine if they can be reduced and recycled prior to generation. Construction contractors are assisted in maximizing their recycling.
Pollution prevention and waste elimination Sustainable Acquisition
Waste Green Procurement
Reduce paper use and acquisition
Reduce printing paper use and acquisition of uncoated printing/writing paper containing at least 30% post-consumer fiber.
The SPR continues to use GSA for all printing paper purchases. All paper purchased by the SPR is 30% post consumer, in accordance with the affirmative procurement specifications for writing papers.
Target was achieved. Printing paper consumption has declined. In FY 2000, 525 boxes of writing paper were used by the reproduction department at Headquarters. It declined to 113 boxes used by FY 2005, 75 boxes in FY 2010, and down to 69 boxes in FY 2011. Fewer hard copy documents are needed en masse, such as for hand-outs in meetings and presentations and for document libraries. The SPR has electronic content management systems for all documents; there are very few official hard copy documents remaining in use.
Pollution Prevention and waste elimination Sustainable Acquisition
Green Procurement
Meet procurement sustainability requirements and include sustainable acquisition clause.
At least 95% of acquisitions include sustainability clause, leadership goal target is >.75% of acquisitions.
There was 100% compliance in 6 out of 9 categories of green acquisition products purchased, and exceeded 75% compliance in all 9 categories.
Targets achieved. Sustainability acquisition clauses are included in all procurement contract solicitations. Acquisition language and summaries of work include Federally-mandated products and service requirements.
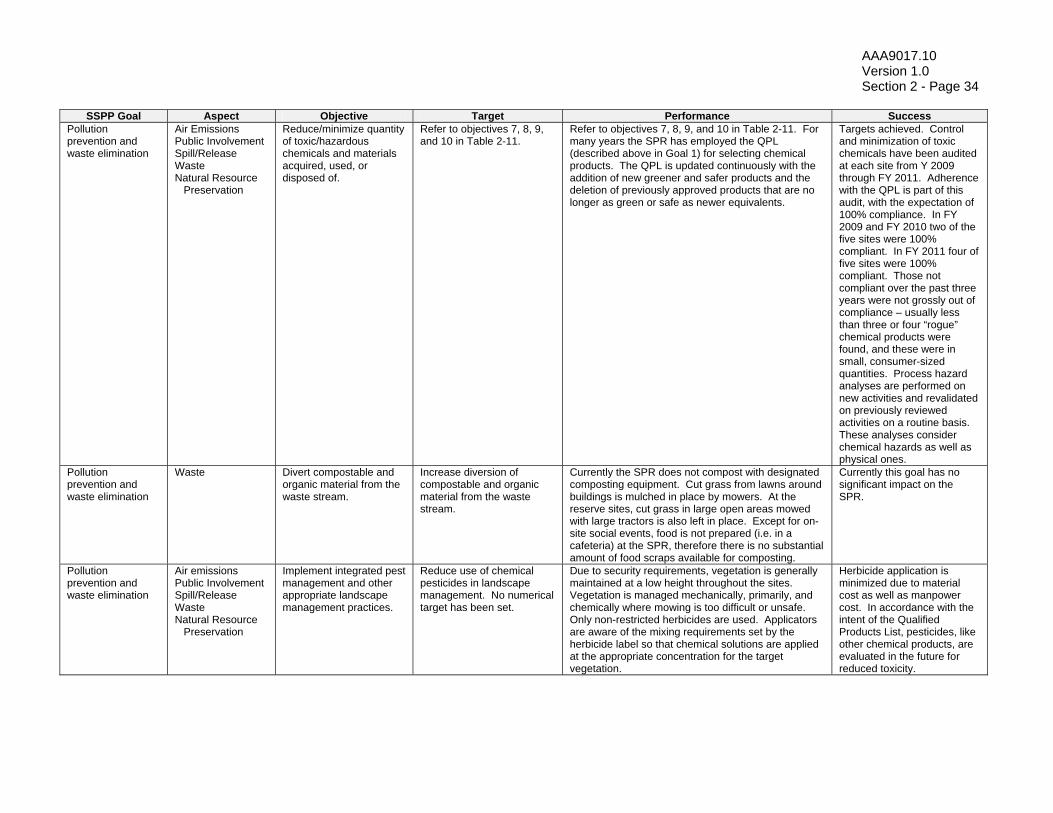
AAA9017.10 Version 1.0 Section 2 - Page 34
SSPP Goal Aspect Objective Target Performance Success
Pollution prevention and waste elimination
Air Emissions Public Involvement Spill/Release Waste Natural Resource Preservation
Reduce/minimize quantity of toxic/hazardous chemicals and materials acquired, used, or disposed of.
Refer to objectives 7, 8, 9, and 10 in Table 2-11.
Refer to objectives 7, 8, 9, and 10 in Table 2-11. For many years the SPR has employed the QPL (described above in Goal 1) for selecting chemical products. The QPL is updated continuously with the addition of new greener and safer products and the deletion of previously approved products that are no longer as green or safe as newer equivalents.
Targets achieved. Control and minimization of toxic chemicals have been audited at each site from Y 2009 through FY 2011. Adherence with the QPL is part of this audit, with the expectation of 100% compliance. In FY 2009 and FY 2010 two of the five sites were 100% compliant. In FY 2011 four of five sites were 100% compliant. Those not compliant over the past three years were not grossly out of compliance – usually less than three or four “rogue” chemical products were found, and these were in small, consumer-sized quantities. Process hazard analyses are performed on new activities and revalidated on previously reviewed activities on a routine basis. These analyses consider chemical hazards as well as physical ones.
Pollution prevention and waste elimination
Waste Divert compostable and organic material from the waste stream.
Increase diversion of compostable and organic material from the waste stream.
Currently the SPR does not compost with designated composting equipment. Cut grass from lawns around buildings is mulched in place by mowers. At the reserve sites, cut grass in large open areas mowed with large tractors is also left in place. Except for on-site social events, food is not prepared (i.e. in a cafeteria) at the SPR, therefore there is no substantial amount of food scraps available for composting.
Currently this goal has no significant impact on the SPR.
Pollution prevention and waste elimination
Air emissions Public Involvement Spill/Release Waste Natural Resource Preservation
Implement integrated pest management and other appropriate landscape management practices.
Reduce use of chemical pesticides in landscape management. No numerical target has been set.
Due to security requirements, vegetation is generally maintained at a low height throughout the sites. Vegetation is managed mechanically, primarily, and chemically where mowing is too difficult or unsafe. Only non-restricted herbicides are used. Applicators are aware of the mixing requirements set by the herbicide label so that chemical solutions are applied at the appropriate concentration for the target vegetation.
Herbicide application is minimized due to material cost as well as manpower cost. In accordance with the intent of the Qualified Products List, pesticides, like other chemical products, are evaluated in the future for reduced toxicity.

AAA9017.10 Version 1.0 Section 2 - Page 35
SSPP Goal Aspect Objective Target Performance Success Pollution prevention and waste elimination Sustainable Acquisition
Air missions Public Involvement Spill/Release Waste Natural Resource Preservation
Use acceptable alternative chemicals and processes that support procurement policies.
Refer to objectives 7, 8, 9, and 10 in Table 2-11. Increase use of acceptable alternative chemicals and processes that support procurement policies.
Refer to objectives 7, 8, 9, and 10 in Table 2-11. The SPR M&O contractor continually seeks new chemical products, especially those that are greener than previously approved equivalents. Requests for new products come from M&O personnel and subcontractors. Only chemical products found on the SPR Qualified Products List (QPL) are allowed to be used. The QPL is a dynamic list that is becoming greener with age.
Targets achieved. Selection of chemical products purchased is controlled. All purchase requisitions (PRs) are generated electronically and go through a review process where the PR is automatically routed to different functions (i.e. environmental, safety) for review and approval before reaching the buyer. All credit card purchases are tracked with a completed form that prompts the requestor to verify that any chemical products purchased are on the QPL. No chemical products can be purchased via check requests.
Scope 1 green house gas Pollution prevention and waste elimination Sustainable Acquisition
Air Emissions Decrease use of chemicals that would jeopardize achieving green house gas emission reduction targets.
Refer to objectives 8, 9, and 10 in Table 2-11.
Refer to objectives 8, 9, and 10 in Table 2-11. Chemical such as refrigerants and SF6 have been identified by location and inventoried. In FY 2011, 1 lb of R-134a and 30 lb of SF6 were replenished at BM and WH, respectively, for losses. Effort continues to reduce/eliminate VOC emissions from crude oil through leak awareness, reducing exposure of VOCs to the atmosphere, and using permitted structures such as crude oil storage tanks with emissions controls.
Despite the chemical losses, the SPR has controls in place to reduce these chemicals. Selection and purchase of chemical products will continue to be monitored and controlled.
Data Centers and Electronic Stewardship
Energy Use Meter all data centers to measure monthly power utilization effectiveness (PUE)
Meter 100% of data centers by FY 2015.
No meter has been installed to measure data center energy consumption.
Target not met, but power usage data is available from power distribution unit (PDU) for all computing equipment operating in the data center.
Data Centers and Electronic Stewardship
Energy Use Data centers will be energy efficient.
Data centers will have a maximum annual weighted average PUE of 1.4 by FY 2015.
Current PUE is 1.8. Performance is near target, but there are no projects currently planned to reach 1.4 PUE. Recent power management study conducted on data center will be reviewed to determine other means to reduce the PUE.
Data Centers and Electronic Stewardship
Energy Use PC’s laptops, and monitors will be energy efficient.
100% of eligible PC’s, laptops, and monitors will have power management features activated by FY 2012.
100% of virtual current desk top function is available to users. Energy efficient thin client devices are available to 48% of users. All printers are set to go into power saver mode when not in use. All monitors are set to go to sleep after being idle for 20 minutes.
Target achieved. Effort is being made to manage power on all eligible equipment.

AAA9017.10 Version 1.0 Section 2 - Page 36
End of Section

AAA9020459 Version 1.0 Section 3 - Page 1
3. ENVIRONMENTAL PROGRAM INFORMATION
The environmental program is implemented by the prime M&O contractor for the SPR on behalf of DOE (permittee) and is designed to support the SPR through tasks aimed at avoiding or minimizing adverse environmental effects from the SPR on surrounding lands, air, and water bodies. The monitoring and inspection program, originally developed under guidance of the SPR Programmatic Environmental Action Report and Site Environmental Action Reports, now conforms to the requirements outlined in the SPR EMS Manual (AS 15400.55). Section 1.5 Checking and Corrective Action, subsection 1.5.1 Monitoring and Measurement, of the EMS Manual requires that the organization establish, implement and maintain procedures to monitor and measure key characteristics of its operations that can have a significant environmental impact. This program includes monitoring permitted NPDES outfalls and air emissions, conducting other required federal and state inspections, and surveillance sampling and analysis of site-associated surface and ground water quality. This makes possible the assessment of environmental impacts relative to the baseline and early detection of water quality degradation that may occur from SPR operations. The results of the individual program areas such as air emissions monitoring and reporting, NPDES compliance, water quality monitoring, and ground water monitoring for 2011 are discussed in sections 5 and 6.
3.1 ASSOCIATED PLANS AND PROCEDURES
Associated plans that support the SPR environmental program include the Emergency Management Plan and Implementing Procedures, the site specific Emergency Response Procedures with spill reporting procedures; the site-specific SPCC; the EMP which incorporates the Ground Water Protection Management Program (GWPMP) plan; and the Pollution Prevention (P2) Plan which includes the SWPPP for each site. The EMP, GWPMP, and the PPP are reviewed and updated annually; the SPCC plans are reviewed and revised as needed or every five years per regulation.
Associated procedures that support the SPR environmental program are located in the DM Environmental Instructions Manual. These procedures identify requirements, responsible personnel, deadlines, and governing standards. Each site has developed instructions where needed that implement the environmental program specific to their facility. The ISO 14001 EMS Manual was developed to describe and provide direction to DM policies, plans, and procedures that make up the environmental management system and to illustrate how the EMS conforms to the ISO 14001 standard. This document is reviewed and revised at least annually.
3.2 REPORTING

AAA9020459 Version 1.0 Section 3 - Page 2
Proper operation of the SPR with respect to the environment involves several types of reports and reporting procedures. The basic reports are summarized briefly in this section.
3.2.1 Spill Reporting
Site Emergency Response Procedures address spill reporting requirements of the SPR contractor, DOE, and appropriate regulatory agencies. Specific reporting procedures are dependent upon several key factors including the quantity and type of material spilled, immediate and potential impacts of the spill, and spill location (e.g., wetland or water body). All spills of hazardous substances are first verbally reported to site management and then through the SPR contractor management reporting system to New Orleans contractor and DOE management. The tool to document these spills is the Operations Control Center (OCC) Non-Routine and Occurrence Report form that is completed at the site level and then forwarded to the New Orleans OCC. Verbal notification and associated written reports to the appropriate regulatory agencies occur as required, if the spill meets the reportable criteria. Final written reports from the sites are submitted after cleanup, unless otherwise directed by the DOE or appropriate regulatory agency.
3.2.2 Discharge Monitoring Reports
Wastewater and storm water discharges from SPR sites are authorized by EPA through the NPDES program and through the LDEQ by the LPDES. The EPA has not yet delegated the NPDES program to the RCT so parallel EPA NPDES and RCT Rule 8 water discharge programs are in place for BH and BM. The routine monitoring reports are prepared and submitted in accordance with site-specific permit requirements. All discharge permits issued to the SPR require quarterly reporting to the appropriate agency(s) (LDEQ, or RCT and EPA). Should a noncompliance or reportable bypass occur during the reporting period, an explanation of the cause and actions taken to correct the event is included in the corresponding quarterly report.
3.2.3 Other Reports
The SPR contractor provides several other reports to, or on behalf of DOE. Table 3-1 contains a comprehensive list of environmental regulations and reporting requirements applicable to the SPR. Table 3-1. Federal, State, and Local Regulatory Reporting Requirements
Regulation, Statute
or Directive
Regulated Area
Enforcement
Agency
Types of Required Permits, Applications, or
Documentation
Routine Reporting
Requirements Clean Air Act Control of
hydrocarbon emissions from tanks, valves, and piping
TCEQ
Air Emissions Permit
Annual Emissions Inventory Questionnaires
TCEQ Air Emissions Permit Special Requirement
Monthly Tank Emissions
Clean Water Act as amended (FWPCA)
Wastewater discharges
U.S. EPA, Region VI
NPDES Permit Quarterly monitoring reports
LA Dept. of Env. Quality (LDEQ)
Water Discharge Permit Quarterly monitoring reports
Railroad Commission of Texas (RCT)
Water Discharge Permit Quarterly monitoring reports
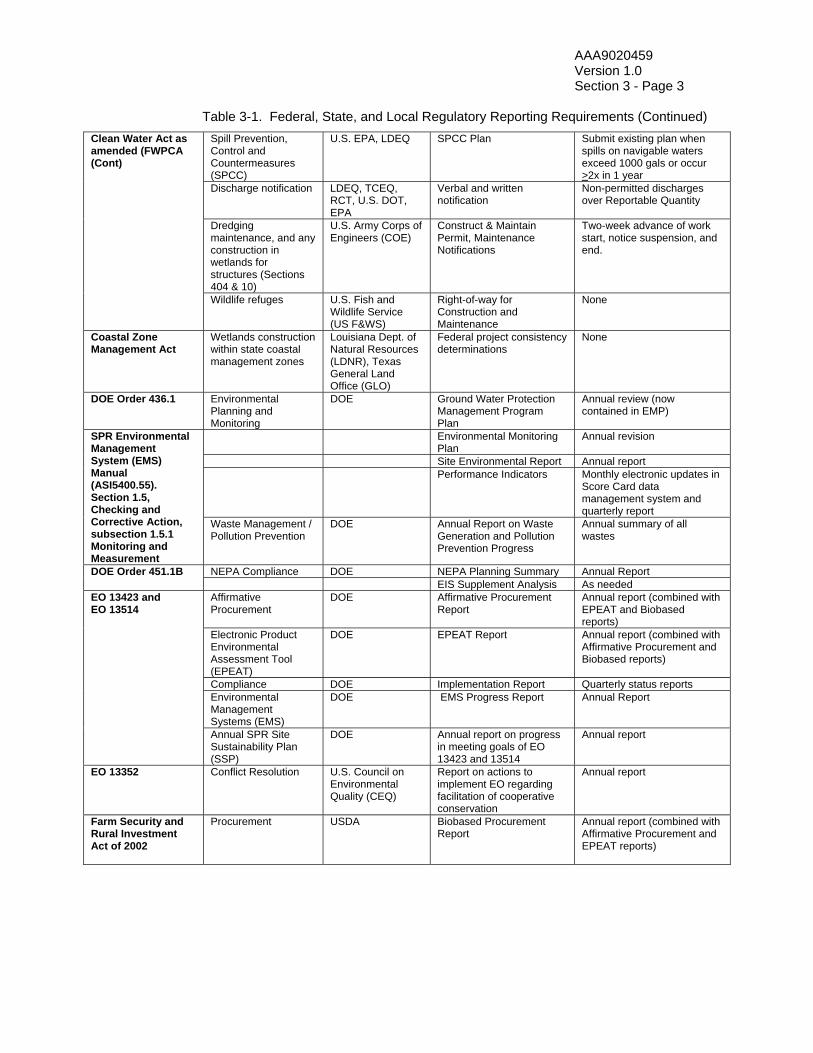
AAA9020459 Version 1.0 Section 3 - Page 3
Table 3-1. Federal, State, and Local Regulatory Reporting Requirements (Continued)
Clean Water Act as amended (FWPCA (Cont)
Spill Prevention, Control and Countermeasures (SPCC)
U.S. EPA, LDEQ SPCC Plan Submit existing plan when spills on navigable waters exceed 1000 gals or occur >2x in 1 year
Discharge notification LDEQ, TCEQ, RCT, U.S. DOT, EPA
Verbal and written notification
Non-permitted discharges over Reportable Quantity
Dredging maintenance, and any construction in wetlands for structures (Sections 404 & 10)
U.S. Army Corps of Engineers (COE)
Construct & Maintain Permit, Maintenance Notifications
Two-week advance of work start, notice suspension, and end.
Wildlife refuges U.S. Fish and Wildlife Service (US F&WS)
Right-of-way for Construction and Maintenance
None
Coastal Zone Management Act
Wetlands construction within state coastal management zones
Louisiana Dept. of Natural Resources (LDNR), Texas General Land Office (GLO)
Federal project consistency determinations
None
DOE Order 436.1
Environmental Planning and Monitoring
DOE Ground Water Protection Management Program Plan
Annual review (now contained in EMP)
SPR Environmental Management System (EMS) Manual (ASI5400.55). Section 1.5, Checking and Corrective Action, subsection 1.5.1 Monitoring and Measurement
Environmental Monitoring Plan
Annual revision
Site Environmental Report Annual report Performance Indicators Monthly electronic updates in
Score Card data management system and quarterly report
Waste Management / Pollution Prevention
DOE Annual Report on Waste Generation and Pollution Prevention Progress
Annual summary of all wastes
DOE Order 451.1B NEPA Compliance DOE NEPA Planning Summary Annual Report EIS Supplement Analysis As needed
EO 13423 and EO 13514
Affirmative Procurement
DOE Affirmative Procurement Report
Annual report (combined with EPEAT and Biobased reports)
Electronic Product Environmental Assessment Tool (EPEAT)
DOE EPEAT Report Annual report (combined with Affirmative Procurement and Biobased reports)
Compliance DOE Implementation Report Quarterly status reports Environmental Management Systems (EMS)
DOE EMS Progress Report Annual Report
Annual SPR Site Sustainability Plan (SSP)
DOE Annual report on progress in meeting goals of EO 13423 and 13514
Annual report
EO 13352 Conflict Resolution U.S. Council on Environmental Quality (CEQ)
Report on actions to implement EO regarding facilitation of cooperative conservation
Annual report
Farm Security and Rural Investment Act of 2002
Procurement USDA Biobased Procurement Report
Annual report (combined with Affirmative Procurement and EPEAT reports)
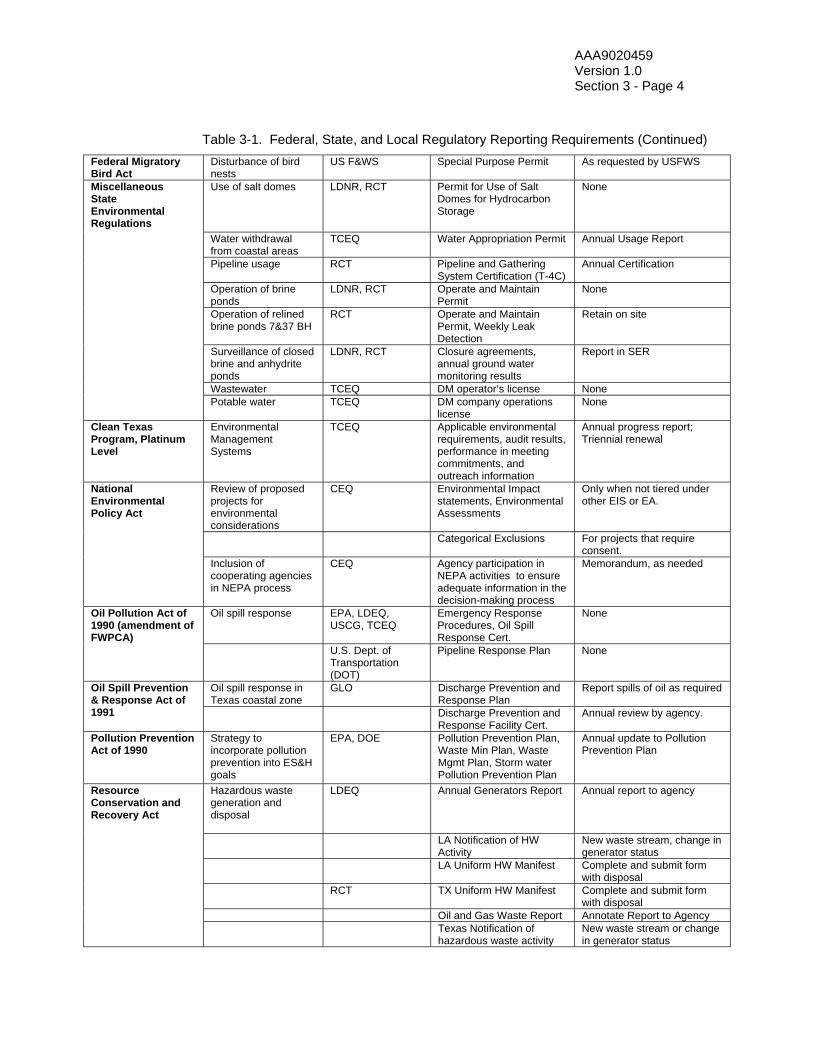
AAA9020459 Version 1.0 Section 3 - Page 4
Table 3-1. Federal, State, and Local Regulatory Reporting Requirements (Continued)
Federal Migratory Bird Act
Disturbance of bird nests
US F&WS Special Purpose Permit As requested by USFWS
Miscellaneous State Environmental Regulations
Use of salt domes LDNR, RCT Permit for Use of Salt Domes for Hydrocarbon Storage
None
Water withdrawal from coastal areas
TCEQ Water Appropriation Permit Annual Usage Report
Pipeline usage RCT Pipeline and Gathering System Certification (T-4C)
Annual Certification
Operation of brine ponds
LDNR, RCT Operate and Maintain Permit
None
Operation of relined brine ponds 7&37 BH
RCT Operate and Maintain Permit, Weekly Leak Detection
Retain on site
Surveillance of closed brine and anhydrite ponds
LDNR, RCT Closure agreements, annual ground water monitoring results
Report in SER
Wastewater TCEQ DM operator’s license None Potable water TCEQ DM company operations
license None
Clean Texas Program, Platinum Level
Environmental Management Systems
TCEQ Applicable environmental requirements, audit results, performance in meeting commitments, and outreach information
Annual progress report; Triennial renewal
National Environmental Policy Act
Review of proposed projects for environmental considerations
CEQ Environmental Impact statements, Environmental Assessments
Only when not tiered under other EIS or EA.
Categorical Exclusions For projects that require consent.
Inclusion of cooperating agencies in NEPA process
CEQ Agency participation in NEPA activities to ensure adequate information in the decision-making process
Memorandum, as needed
Oil Pollution Act of 1990 (amendment of FWPCA)
Oil spill response EPA, LDEQ, USCG, TCEQ
Emergency Response Procedures, Oil Spill Response Cert.
None
U.S. Dept. of Transportation (DOT)
Pipeline Response Plan None
Oil Spill Prevention & Response Act of 1991
Oil spill response in Texas coastal zone
GLO Discharge Prevention and Response Plan
Report spills of oil as required
Discharge Prevention and Response Facility Cert.
Annual review by agency.
Pollution Prevention Act of 1990
Strategy to incorporate pollution prevention into ES&H goals
EPA, DOE Pollution Prevention Plan, Waste Min Plan, Waste Mgmt Plan, Storm water Pollution Prevention Plan
Annual update to Pollution Prevention Plan
Resource Conservation and Recovery Act
Hazardous waste generation and disposal
LDEQ Annual Generators Report Annual report to agency
LA Notification of HW Activity
New waste stream, change in generator status
LA Uniform HW Manifest Complete and submit form with disposal
RCT TX Uniform HW Manifest Complete and submit form with disposal
Oil and Gas Waste Report Annotate Report to Agency Texas Notification of
hazardous waste activity New waste stream or change in generator status

AAA9020459 Version 1.0 Section 3 - Page 5
Table 3-1. Federal, State, and Local Regulatory Reporting Requirements (Continued)
Resource Conservation and Recovery Act (cont.)
Used oil burned for recovery
LDEQ, RCT Uniform HW Manifest (Recycling)
Complete and submit form with disposal
Non-hazardous oilfield waste disposal (exploration and production)
LDNR Non-Hazardous Oilfield Waste Shipping Control Ticket (UIC-28)
Complete and submit form with disposal
Non-hazardous special
LDEQ, TCEQ Shipping Paper Complete and submit form with disposal
Waste Management LDEQ, TCEQ Monthly waste inventory form
Complete for documentation
Weekly waste inspection form
Complete for documentation
Affirmative Procurement
EPA Affirmative Procurement Report
Annual Report (combined with EPEAT and Biobased reports)
Safe Drinking Water Act
Cavern formation, well workovers, and salt-water disposal wells
LDNR, Office of Conservation, Under-ground Injection and Mining Division
Well Work over Permit (WH-1)
Well Work over Report
Cavern Inspection (29-M) Semi-annual Cavern Inspection Report
Saltwater Disposal (UIC-10)
Annual Saltwater Disposal Well Report
Cavern Integrity Test Report
Annual Cavern Integrity
Oil Wells Integrity (W-10) Annual Oil Well Status Report RCT Brine Injection Permit (H-
10) Annual Disposal/ Injection Wells Reports
Potable water LA Dept. of Health & Hospitals (LDHH)
Any reporting if a break onsite occurs? and we repair and shock?
TCEQ Weekly disinfectant residual concentration (BM and BH) Monthly total coliform test (BM and BH) Annual disinfectant and disinfectant by-products test (BM) Lead and copper test
Quarterly to agency Retain results on site Submit to TCEQ Frequency based on past test result
Storage of oil in underground salt domes
LDNR, RCT Storage permit None

AAA9020459 Version 1.0 Section 3 - Page 6
Table 3-1. Federal, State, and Local Regulatory Reporting Requirements (Continued)
Superfund Amendment Reauthorization Act
Reporting of inventories of hazardous substances and materials stored on site
Louisiana Dept. of Public Safety and Corrections, Texas Dept. of Health Texas Department of State Health Services Tier II Chemical Reporting Program Mississippi Emergency Management Agency
Title III, Tier II Title III, Tier II Title III, Tier II
Annual Inventory Report Annual Inventory Report Title III, Tier II
Reporting of discharges of all listed hazardous materials
EPA Toxic Release Inventory, Form R
Complete and submit form when threshold exceeded
3.3 ENVIRONMENTAL PERMITS
The active environmental permits required by regulatory agencies to construct, operate, and maintain the SPR are discussed by site. The SPR holds a general permit to discharge hydrostatic test water in the state of Louisiana that applies to all of the Louisiana SPR sites and their offsite pipelines. This permit requires quarterly discharge monitoring reporting. LDEQ has primacy for the NPDES program in Louisiana that includes responsibility for all compliance and enforcement actions relating to the discharge of water in Louisiana. The LDEQ-issued general storm water permit coverages remained in-force throughout 2011 for WH and also the renewal general permit (Light Commercial General) was issued in August 2011 for BC authorizing all of their discharges replacing with a combination of LCGP and MSGP coverage. Since the RCT does not have primacy for the NPDES program, BH and BM operate under parallel EPA and RCT discharge permits. In addition to obtaining renewed federal coverage (effective February 1, 2009), the two Texas SPR sites operate under authority granted with Statewide Rule 8 water discharge permits issued by the RCT. The BH state discharge permit was renewed in December, 2010, effective January 1, 2011. The Certification of No Exposure five-year renewal was processed to the MDEQ in 2009, for the Mississippi Stennis Warehousing operations in lieu of state issued MSGP stormwater coverage at that location. The renewed coverage was automatic in July, 2009, and continued in full force throughout 2011.
The air permits for the SPR facilities are administered by the LDEQ in Louisiana and the TCEQ in Texas. The WH air permit was modified in 2011 and issued by LDEQ on July 27, 2011. The BM air permit renewal application was submitted to TCEQ on November 28, 2011.

AAA9020459 Version 1.0 Section 3 - Page 7
3.3.1 Bayou Choctaw
Table 3-2 lists the permits at BC. Individual work permits are received from the Louisiana Underground Injection Control Division of LDNR for each well work over performed. State inspectors periodically visit the site to observe SPR operations. BC operates under the water and air programs delegated to Louisiana by EPA. LDEQ finally received authority to re-issue the statewide general permit for Light Commercial Facilities and called for each former permittee to re-submit a full NOI by March of 2011. A full NOI was submitted and on August 15, 2011, a letter extending LCGP coverage to the BC site authorized all of the discharges. This renewed permit effectively replaced the administratively extended coverage of LAG4800540, keeping the same permit number. The site’s security perimeter “clear sight zone” authorized and implemented by the NODCOE in the summer of 2006 was maintained by site personnel throughout 2011. This permit was modified to allow for the annexation of and construction work to the cavern 102 well pad. Additional appurtenances included a temporary personnel escape bridge and temporary ditch and ring levee during well construction.
Table 3-2. Permits at Bayou Choctaw
PERMIT NUMBER
ISSUING AGENCY
PERMIT TYPE
EFFECTIVE DATE
EXPIRATION DATE
COMMENTS
LAG480540 LDEQ LPDES 8/15/11 11/31/15 (1),(2) 1280-00015- 02 LDEQ Air 12/2/99 Open (3) None LDNR Injection 01/11/83 Open (4) SDS-1 LDNR Injection 09/09/77 Open (5) LMNOD-SP (Bull Bay) 3
COE Constr. & Maintain
01/30/79 - * (6)
LMNOD-SP (Iberville Parish Wetlands) 7
COE Constr. & Maintain
09/26/77 - (7)
LMNOD-SP (Iberville Parish Wetlands) 10
COE
Constr. &Maintain
06/12/78
-
(8)
LMNOD-SP (Iberville Parish Wetlands) 17
COE Constr. & Maintain
11/06/78 - (9)
LMNOD-SP (Iberville Parish Wetlands) 31
COE Constr. & Maintain
05/27/80 - (10)
LMNOD-SP (Iberville Parish Wetlands) 102
COE Constr. & Maintain
09/26/77 - (11)
WN-20-020-0168 COE Constr. & Maintain
04/02/02 - (12)
WT-20-020-2654 COE Constr. & Maintain
08/20/02 - (13)
WT-20-020-3621 COE Constr. & Maintain
09/17/02 - (14)
LMNOD-SP (Bayou Plaquemine)
COE Constr. & Maintain
09/26/77 - (15)
CT-20-030-1379-0 COE Constr. & Maintain
03/12/03 - (16)
CT-20-030-1501-0 COE Constr. & Maintain
03/28/03 - (17)
CT-20-030-3087-0 COE Constr. & Maintain
07/25/03 - (18)
MVN-2004-4453-CT COE Constr. & Maintain
10/14/04 - (19)
MVN-2003-2234-CT COE Constr. & Maintain
02/2/06 Mod 10/4/11
- (20)

AAA9020459 Version 1.0 Section 3 - Page 8
* COE permits remain active for the life of the structure. (1) LDEQ cancelled the LPDES converted permit LA0053040 and LA MSGP permit LAR05M577 replacing both with a single
Light Commercial Facility (LCF) general permit LAG480540. (2) The state’s LPDES LCF general permit (LAG48000) was renewed 1DEC11 and discharge authority was given to BC on
15AUG11 after review of a full NOI from March. The former BC LCGP permit number remained intact. (3) Site air operating permit modified 12/99 (4) Letter of financial responsibility to plug and abandon injection wells. (5) Permit approved use of salt dome cavities for storage of liquid hydrocarbons. (6) Maintain Bull Bay 24" brine disposal pipeline recorded with applicable Registrar of Deeds. (7) Construct and maintain well pads (brine disposal wells). (8) Enlarge existing well pads and construct access roads (brine disposal wells 1, 2, & 3.) (9) Construct and maintain access road to brine disposal well area. NOTE: brine disposal pipeline was constructed under
NWP authority and maintenance is allowed in conjunction with the access road permit. Major maintenance performed in 1996.
(10) Construct and maintain well pad, levees, access road & appurtenances to Cavern 102 and additional bank stabilization, warehouse pad and culvert per additions of 1983.
(11) Construct and maintain ring levee, drill site and appurtenances, Well 101. (12) Install and maintain fill with culverts for parking. Permit authorized a construction period until 4/30/2007. (13) Install and maintain culverts and fill to construct minor roadway crossings. Activity authorized under NWP-14 and
provides a construction period until 8/20/2004. (14) Replace, repair and maintain security fence with concrete footing and curbing. Activity authorized under NWP-3 and
provides a construction period until 9/17/2004. (15) Install and maintain 36” petroleum products pipeline under and across Bayou Plaquemine (16) Install and maintain a replacement N-S bridge for an existing, permitted N-S bridge on the Main Site. Activity authorized
under NWP-3; provides a construction period until 3/12/2005. (17) Install and maintain a replacement brine disposal access road bridge for an existing permitted structure on the brine
disposal access road. Activity authorized under NWP-3, provides a construction period until 3/28/2005. (18) Install and maintain a bulkhead and fill for bank stabilization in the North-South Canal on the Main Site. Activity authorized
under NWP-13 providing a construction period until 7/25/2005. (19) Install and maintain refurbished Bailey Bridge crossing over Wilbert’s Canal via NWP14, providing construction period for
2 years. (20) Implement and maintain an expanded clear sight security perimeter zone. Requires compensatory mitigation and long-
term oversight of the mitigation bank sites. Modified to include the acquisition of BC 102 and development of clear zone and cavern pad. Included compensatory mitigation via wetland mitigation bank credit purchases.
3.3.2 Big Hill
Table 3-3 lists the permits at BH. In 2011, the site appropriated 3.196 million m3 (2591.24 acre-feet) of water from the Intracoastal Waterway (ICW) exclusive of water for fire protection. This represents 8.64 percent of the current revised total allowable withdrawal for a year. The certified affidavit and annual report of water usage was forwarded to the TCEQ as required in 2011. The M&O contractor is registered with TCEQ as a Public Water System Operations Company (registration # WC0000073) since both BH and BM provide sanitary control of their purchased water distribution system on-site. This registration was successfully renewed in May 2011. In addition, the M&O contractor is also registered as a Waste Water Operations Company (registration #OC0000067) which was successfully renewed in 2009 and which continued in 2011.
The state water discharge permit UHS-006 expired in 2009. A renewal application was provided to the RCT in October, 2009, and was found administratively complete. The RCT finalized the renewed permit in December 2010, with an effective date of January 1, 2011. This action assured seamless authority for discharges during the renewal process. The site’s permit to appropriate state water (water right permit 4045A) requires a current Water Conservation Plan (WCP) to be filed with the TCEQ. The third (5-year cycle) plan was filed in 2009 and the one year Implementation Report was completed, as required by

AAA9020459 Version 1.0 Section 3 - Page 9
the WCP, in May 2010, a similar report is now called for by the Texas Water Development Board (TWDB), and that report was submitted as required before May 2011.
Table 3-3. Permits at Big Hill
PERMIT NUMBER
ISSUING AGENCY
PERMIT TYPE
EFFECTIVE DATE
EXPIRATION DATE
COMMENTS
TX0092827 EPA NPDES 02/01/09 01/31/14 (1) NOT EPA NPDES 1/17/09 none (2) SWGCO-RP 16536 (01,02,03,04, 05)
COE Constr. & Maintain
01/11/84 Dredging clause to 12/2008
(3) (4)
P-7 F&WS Constr. & Operate
07/31/86 06/30/2036 (5)
9256 TCEQ Air 01/11/08 01/10/2018 Site Air Permit 02939 RCT Operate 11/28/83 Open (6) P000226A & P000226B
RCT Operate/ Maintain
09/19/84 Open (7)
0048295, 0048320, 004816, 004817
RCT Operate 05/09/83 06/23/83
Open Open
(8)
UHS-006 RCT Water Discharge.
01/01/11 12/31/2015 (extended)
(9)
4045A TNRCC Water Use 11/14/83 Open (10)
(1) Renewal submitted 4/23/2008. Accepted as administratively complete 6/18/2008; comments to draft permit made
Oct.2008; final permit issued Jan. 2009, effective 2/1/2009. (2) NPDES coverage for Storm Water Associated with Industrial Activity was written into the individual permit TX0092827, as
a result the former MultiSector General Permit (MSGP) coverage was terminated with a Notice of Termination instrument. (3) Permits and modifications to construct and maintain RWIS, raw water 48" pipeline, brine disposal 48" pipeline, crude oil
36" pipeline. Maintenance dredging clause renewed until 12/31/08. Modified in 1996 for new integrity test method. (4) Completion of raw water, brine disposal, and crude oil pipeline extended. Amended to install offshore pipeline by
trenching. Dredging clause is allowed to lapse due to no RWIS dredging needed before expiration indicated above. Shall be renewed with next maintenance dredging activity/project.
(5) Completion of pipeline construction extended. (48" Brine Pipeline) (6) Pipeline distribution system registration to operate crude oil lines. Renewed annually. (7) Permits to operate and maintain anhydrite and brine/oil pits. Modifications are on file. (8) Permits to create, operate, and maintain an underground hydrocarbon storage facility consisting of 14 caverns. (9) Corresponds to TX0092827 (EPA-NPDES). Renewal sent October 2009; found administratively complete; permit renewed
December 2010; effective 1/1/11. (10) Permit amended in 1990 to allow for annual diversion of no more than 117,291 ac feet of water and to authorize diversion
until termination of the project as a SPR operation. Modified in 1996 to reduce water set aside down to 30,000 acre/ft per year. Maximum Diversion Rate (MDR) 175 cubic feet per second (CFS).
3.3.3 Bryan Mound
Table 3-4 lists the permits for the BM site. The BM air permit renewal application was submitted to TCEQ on November 28, 2011. It includes the emissions from the BM degas plant air permit. The current air permit expires on June 12, 2012; but is still applicable while TCEQ is processing the permit renewal application. The BM site has a permit from TCEQ for the appropriation of state waters for the leaching program, site utility, and fire protection systems. The permit requires a yearly report of the quantity of water used. In 2011, the site used a total of 3.286 million m3 (2663.64 acre-feet) of water from the Brazos River Diversion Channel, representing 5.12 percent of the annual water usage authorized. The certified affidavit and annual report of water usage was forwarded as required in 2011. Maintenance dredging in the approach channel to the RWIS was implemented in a single episode in 2011, using the Extension of Time replacement permit, SWG-2006-2658,

AAA9020459 Version 1.0 Section 3 - Page 10
effective July 10, 2007. Required annual reporting for 2011 involved the successful brine line integrity test to Region 6 EPA, raw water usage to TCEQ; and crude oil pipeline system operations renewal (T4C) to the RCT. The M&O contractor registered with TCEQ as a Public Water System Operations Company (registration # WC0000073) since both BM and BH provide sanitary control of their purchased water distribution system on-site. This registration was successfully renewed in May 2011. In addition, the M&O contractor is also registered as a Waste Water Operations Company (registration #OC0000067) which was successfully renewed in 2009 and which remained in full force through the 2011 calendar year.
Table 3-4. Permits at Bryan Mound.
PERMIT NUMBER
ISSUING AGENCY
PERMIT TYPE
EFFECTIVE DATE
EXPIRATION DATE
COMMENTS
TX0074012 EPA NPDES 02/01/09 01/31/14 (1) NOT EPA NPDES 1/17/09 none (2) SWGCO-RP-12347 (03), repl. by SWG-2006-2568
COE Constr & Maintain
02/22/78 Dredging clause open to 12/2017
(3)
3-67-782 (Docket#) RCT Injection 08/21/78 Open (4) 3-70-377 (Docket#) RCT Injection 12/18/78 Open (4) P001447 RCT Operate 10/30/84 Open (5) 3681A TNRCC Water Use 07/20/81 Open (6) UHS-004 RCT Water Disch 04/01/09 03/31/14 (7) 82-8475 TDH&PT Constr. 01/01/83 Open (8) SWGCO-RP-11666 COE Constr. &
Maintain 10/15/77 - * (9)
SWGCO-RP-12112 COE Constr. & Maintain
07/25/77 - (10)
SWGCO-RP-12062 (03) COE Constr. & Maintain
10/10/78 - (11)
SWGCO-RP-14114 (01) COE Constr. & Maintain
05/18/85 - (12)
SWGCO-RP-16177 COE Constr. & Maintain
09/07/82 - (13)
SWGCO-RP-13435 (01) COE Constr. & Maintain
05/21/79 - (14)
04994 RCT Operate 08/01/00 Open (15) 6176B TCEQ Air 06/12/02 06/12/12 Site Air Permit 52962 TCEQ Air 11/07/02 11/07/12 Degas Permit
* COE permits remain active for the life of the structure. (1) Renewal submitted 4/23/2008. Accepted as administratively complete 6/18/2008; comments to draft permit made
Oct.2008; final permit issued Jan. 2009, effective 2/1/2009. (2) NPDES coverage for Storm Water Associated with Industrial Activity was written into the individual permit TX0074012, as a
result the former MultiSector General Permit (MSGP) coverage was terminated with a Notice of Termination instrument. (3) Maintenance dredging of raw water intake extended to 12/31/06. (SWGCO-RP 12347 authorized construction of RWIS).
Extension/renewal authorizes spoil area addition. A renewed Extension of Time (EOT) re-authorized maintenance dredging for a ten year period effective July10, 2007.
(4) Approval of oil storage and salt disposal program. (5) Authority to operate brine pond. (6) Permit expires at project end, covers 52,000 ac/ft/yr and MDR of 130 CFS per 2001 amendment. (7) Corresponds with TX0074012 (EPA-NPDES). Renewal submitted 12/15/2008; RCT acted on permit in mid March2009,
effective 4/1/09. (8) Corresponds with SWGCO-RP-16177. (9) For 30” crude oil pipeline to 3 miles SW from Freeport (10) For 30” crude oil pipeline to 2 miles S from Freeport (11) For 36” brine disposal pipeline & diffuser. Revision/amendment (01) deleted special condition (a) requiring maximized deep
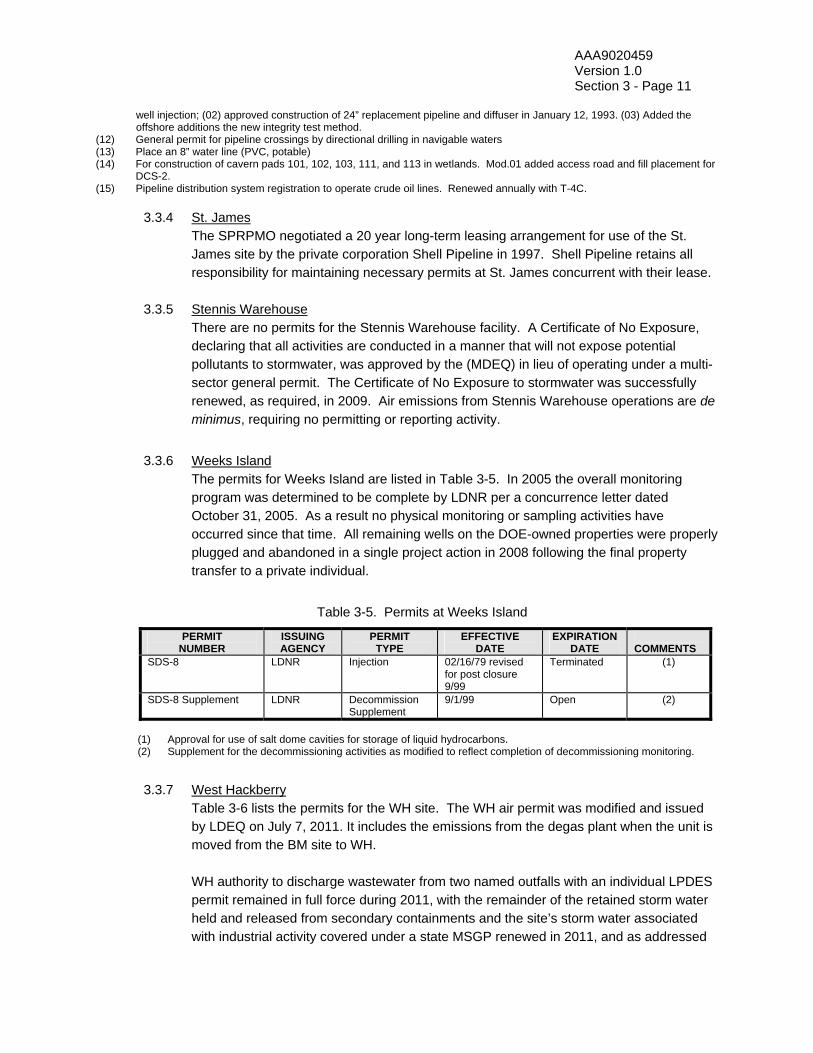
AAA9020459 Version 1.0 Section 3 - Page 11
well injection; (02) approved construction of 24” replacement pipeline and diffuser in January 12, 1993. (03) Added the offshore additions the new integrity test method.
(12) General permit for pipeline crossings by directional drilling in navigable waters (13) Place an 8” water line (PVC, potable) (14) For construction of cavern pads 101, 102, 103, 111, and 113 in wetlands. Mod.01 added access road and fill placement for
DCS-2. (15) Pipeline distribution system registration to operate crude oil lines. Renewed annually with T-4C.
3.3.4 St. James The SPRPMO negotiated a 20 year long-term leasing arrangement for use of the St. James site by the private corporation Shell Pipeline in 1997. Shell Pipeline retains all responsibility for maintaining necessary permits at St. James concurrent with their lease.
3.3.5 Stennis Warehouse
There are no permits for the Stennis Warehouse facility. A Certificate of No Exposure, declaring that all activities are conducted in a manner that will not expose potential pollutants to stormwater, was approved by the (MDEQ) in lieu of operating under a multi-sector general permit. The Certificate of No Exposure to stormwater was successfully renewed, as required, in 2009. Air emissions from Stennis Warehouse operations are de minimus, requiring no permitting or reporting activity.
3.3.6 Weeks Island The permits for Weeks Island are listed in Table 3-5. In 2005 the overall monitoring program was determined to be complete by LDNR per a concurrence letter dated October 31, 2005. As a result no physical monitoring or sampling activities have occurred since that time. All remaining wells on the DOE-owned properties were properly plugged and abandoned in a single project action in 2008 following the final property transfer to a private individual.
Table 3-5. Permits at Weeks Island
PERMIT NUMBER
ISSUING AGENCY
PERMIT TYPE
EFFECTIVE DATE
EXPIRATION DATE
COMMENTS
SDS-8 LDNR Injection 02/16/79 revised for post closure 9/99
Terminated (1)
SDS-8 Supplement LDNR Decommission Supplement
9/1/99 Open (2)
(1) Approval for use of salt dome cavities for storage of liquid hydrocarbons. (2) Supplement for the decommissioning activities as modified to reflect completion of decommissioning monitoring.
3.3.7 West Hackberry Table 3-6 lists the permits for the WH site. The WH air permit was modified and issued by LDEQ on July 7, 2011. It includes the emissions from the degas plant when the unit is moved from the BM site to WH. WH authority to discharge wastewater from two named outfalls with an individual LPDES permit remained in full force during 2011, with the remainder of the retained storm water held and released from secondary containments and the site’s storm water associated with industrial activity covered under a state MSGP renewed in 2011, and as addressed
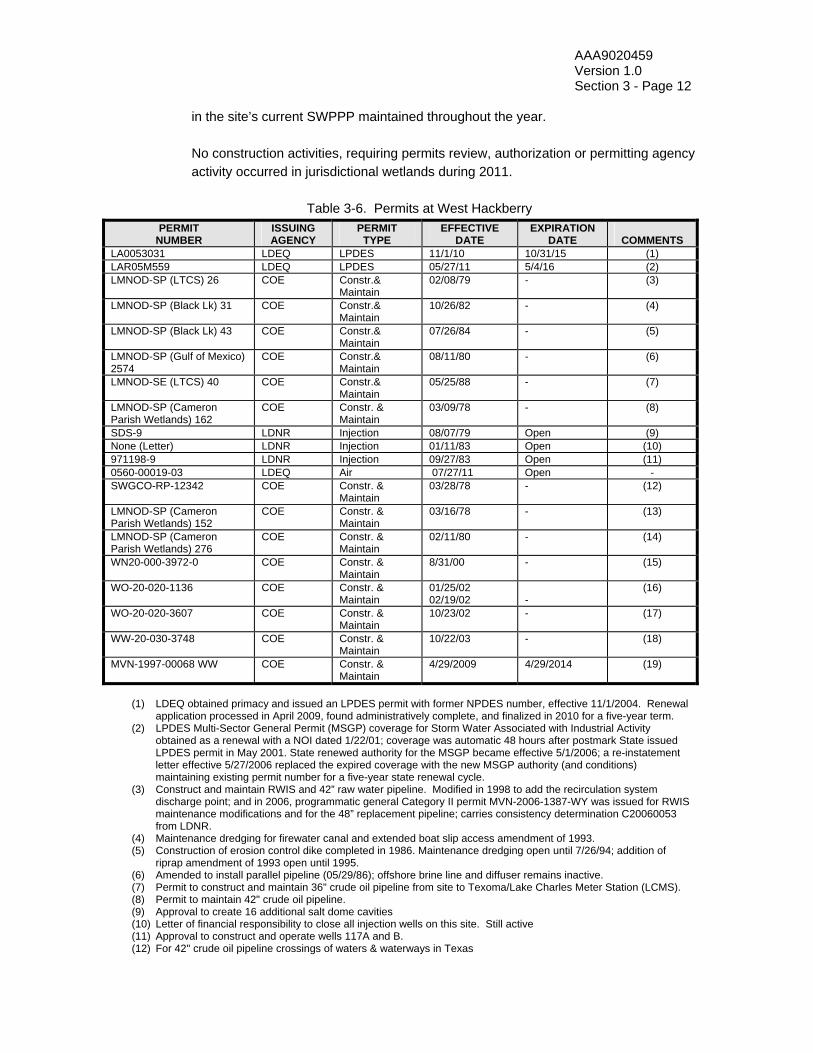
AAA9020459 Version 1.0 Section 3 - Page 12
in the site’s current SWPPP maintained throughout the year. No construction activities, requiring permits review, authorization or permitting agency activity occurred in jurisdictional wetlands during 2011. Table 3-6. Permits at West Hackberry
PERMIT NUMBER
ISSUING AGENCY
PERMIT TYPE
EFFECTIVE DATE
EXPIRATION DATE
COMMENTS
LA0053031 LDEQ LPDES 11/1/10 10/31/15 (1) LAR05M559 LDEQ LPDES 05/27/11 5/4/16 (2) LMNOD-SP (LTCS) 26 COE Constr.&
Maintain 02/08/79 - (3)
LMNOD-SP (Black Lk) 31 COE Constr.& Maintain
10/26/82 - (4)
LMNOD-SP (Black Lk) 43 COE Constr.& Maintain
07/26/84 - (5)
LMNOD-SP (Gulf of Mexico) 2574
COE Constr.& Maintain
08/11/80 - (6)
LMNOD-SE (LTCS) 40 COE Constr.& Maintain
05/25/88 - (7)
LMNOD-SP (Cameron Parish Wetlands) 162
COE Constr. & Maintain
03/09/78 - (8)
SDS-9 LDNR Injection 08/07/79 Open (9) None (Letter) LDNR Injection 01/11/83 Open (10) 971198-9 LDNR Injection 09/27/83 Open (11) 0560-00019-03 LDEQ Air 07/27/11 Open - SWGCO-RP-12342
COE Constr. & Maintain
03/28/78 - (12)
LMNOD-SP (Cameron Parish Wetlands) 152
COE Constr. & Maintain
03/16/78 - (13)
LMNOD-SP (Cameron Parish Wetlands) 276
COE Constr. & Maintain
02/11/80 - (14)
WN20-000-3972-0 COE Constr. & Maintain
8/31/00 - (15)
WO-20-020-1136 COE Constr. & Maintain
01/25/02 02/19/02
-
(16)
WO-20-020-3607 COE Constr. & Maintain
10/23/02 - (17)
WW-20-030-3748 COE Constr. & Maintain
10/22/03 - (18)
MVN-1997-00068 WW COE Constr. & Maintain
4/29/2009 4/29/2014 (19)
(1) LDEQ obtained primacy and issued an LPDES permit with former NPDES number, effective 11/1/2004. Renewal
application processed in April 2009, found administratively complete, and finalized in 2010 for a five-year term. (2) LPDES Multi-Sector General Permit (MSGP) coverage for Storm Water Associated with Industrial Activity
obtained as a renewal with a NOI dated 1/22/01; coverage was automatic 48 hours after postmark State issued LPDES permit in May 2001. State renewed authority for the MSGP became effective 5/1/2006; a re-instatement letter effective 5/27/2006 replaced the expired coverage with the new MSGP authority (and conditions) maintaining existing permit number for a five-year state renewal cycle.
(3) Construct and maintain RWIS and 42” raw water pipeline. Modified in 1998 to add the recirculation system discharge point; and in 2006, programmatic general Category II permit MVN-2006-1387-WY was issued for RWIS maintenance modifications and for the 48” replacement pipeline; carries consistency determination C20060053 from LDNR.
(4) Maintenance dredging for firewater canal and extended boat slip access amendment of 1993. (5) Construction of erosion control dike completed in 1986. Maintenance dredging open until 7/26/94; addition of
riprap amendment of 1993 open until 1995. (6) Amended to install parallel pipeline (05/29/86); offshore brine line and diffuser remains inactive. (7) Permit to construct and maintain 36" crude oil pipeline from site to Texoma/Lake Charles Meter Station (LCMS). (8) Permit to maintain 42" crude oil pipeline. (9) Approval to create 16 additional salt dome cavities (10) Letter of financial responsibility to close all injection wells on this site. Still active (11) Approval to construct and operate wells 117A and B. (12) For 42" crude oil pipeline crossings of waters & waterways in Texas
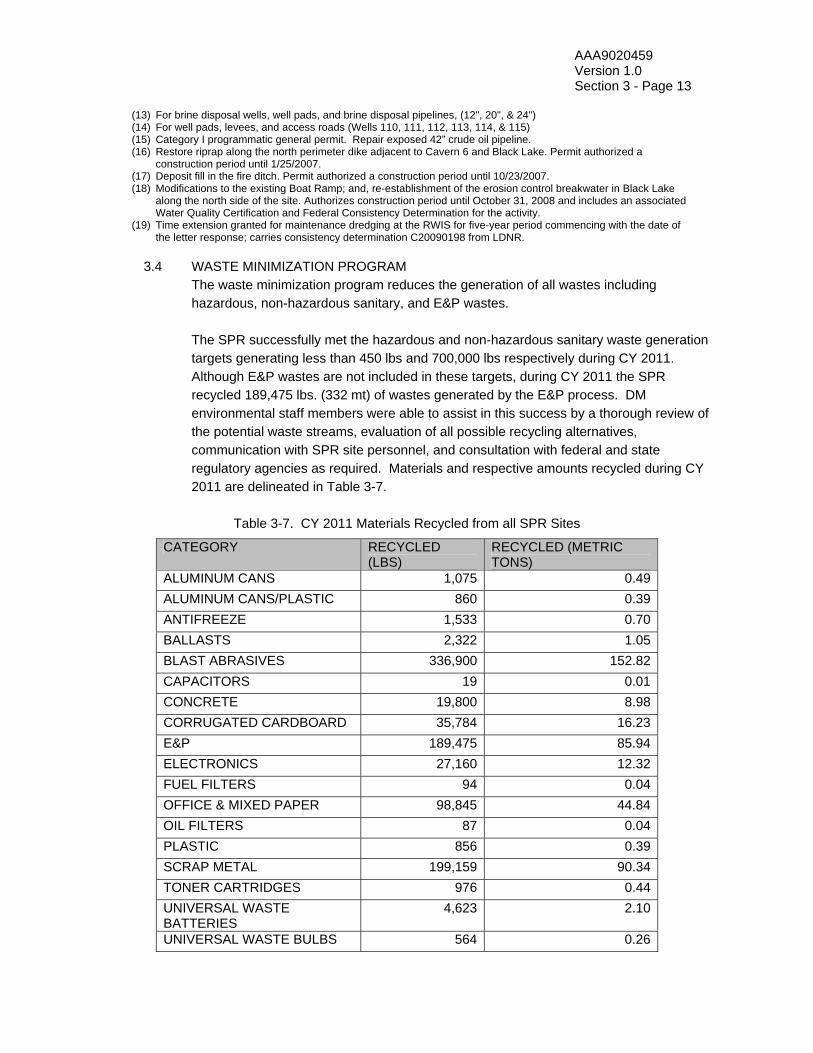
AAA9020459 Version 1.0 Section 3 - Page 13
(13) For brine disposal wells, well pads, and brine disposal pipelines, (12", 20", & 24") (14) For well pads, levees, and access roads (Wells 110, 111, 112, 113, 114, & 115) (15) Category I programmatic general permit. Repair exposed 42” crude oil pipeline. (16) Restore riprap along the north perimeter dike adjacent to Cavern 6 and Black Lake. Permit authorized a
construction period until 1/25/2007. (17) Deposit fill in the fire ditch. Permit authorized a construction period until 10/23/2007. (18) Modifications to the existing Boat Ramp; and, re-establishment of the erosion control breakwater in Black Lake
along the north side of the site. Authorizes construction period until October 31, 2008 and includes an associated Water Quality Certification and Federal Consistency Determination for the activity.
(19) Time extension granted for maintenance dredging at the RWIS for five-year period commencing with the date of the letter response; carries consistency determination C20090198 from LDNR.
3.4 WASTE MINIMIZATION PROGRAM
The waste minimization program reduces the generation of all wastes including hazardous, non-hazardous sanitary, and E&P wastes. The SPR successfully met the hazardous and non-hazardous sanitary waste generation targets generating less than 450 lbs and 700,000 lbs respectively during CY 2011. Although E&P wastes are not included in these targets, during CY 2011 the SPR recycled 189,475 lbs. (332 mt) of wastes generated by the E&P process. DM environmental staff members were able to assist in this success by a thorough review of the potential waste streams, evaluation of all possible recycling alternatives, communication with SPR site personnel, and consultation with federal and state regulatory agencies as required. Materials and respective amounts recycled during CY 2011 are delineated in Table 3-7.
Table 3-7. CY 2011 Materials Recycled from all SPR Sites
CATEGORY RECYCLED (LBS)
RECYCLED (METRIC TONS)
ALUMINUM CANS 1,075 0.49
ALUMINUM CANS/PLASTIC 860 0.39
ANTIFREEZE 1,533 0.70
BALLASTS 2,322 1.05
BLAST ABRASIVES 336,900 152.82
CAPACITORS 19 0.01
CONCRETE 19,800 8.98
CORRUGATED CARDBOARD 35,784 16.23
E&P 189,475 85.94
ELECTRONICS 27,160 12.32
FUEL FILTERS 94 0.04
OFFICE & MIXED PAPER 98,845 44.84
OIL FILTERS 87 0.04
PLASTIC 856 0.39
SCRAP METAL 199,159 90.34
TONER CARTRIDGES 976 0.44
UNIVERSAL WASTE BATTERIES
4,623 2.10
UNIVERSAL WASTE BULBS 564 0.26

AAA9020459 Version 1.0 Section 3 - Page 14
The SPR Chemical Management Program is successful in restricting use of chemical products to those that are more environmentally friendly. One of the key tools to select chemical products is the SPR QPL.
3.5 POLLUTION PREVENTION (P2)
The purpose of the SPR P2 program is to integrate P2 activities into all SPR operations, support technology development programs aimed at minimizing multimedia waste generation, and coordinate P2 efforts with SPR sites. All SPR employees have P2 responsibilities under the program.
P2 announcements and suggestions are communicated via the SPR’s quarterly newsletter “ESPRIT”, and routine email distributions including pertinent local information and useful weblinks. These communications are published on the DM Environmental webpage, which is available to all SPR employees. In 2011, the SPR continued its aggressive integration of the P2 and EMS programs into its business operations, providing both cost savings and pollution reduction.
Earth Day celebration at Bryan Mound Each year the SPR joins in Earth Day, America Recycles Day, and National Pollution Prevention Week celebrations to raise awareness of and encourage source reduction and recycling efforts by all employees. During 2011, the SPR recognized both Earth Day and America Recycles Day with an emphasis on the choices we make now that will have a lasting effect on our lives, our children’s lives, and our planet. To emphasize sustainability handouts included a variety of reusable products such as eating utensils, drinking cups and relevant internet links to useful websites such as local area recycling centers and activities. In addition to “at work” awareness activities, employees also participate in after hours outreach programs such as annual Beach Sweep activities. 2011 marked the 12th year SPR employees, relatives, and friends volunteered to prevent debris from washing into waterways and onto beaches based on the Ocean Conservancy’s worldwide program. P2 outreach activities include BH personnel volunteering for seed planting demonstrations at local schools. Christmas tree and Mardi Gras bead recycling is another example of SPR employee awareness campaigns. During 2011, SPR employees continued participation in the Federal Transportation Subsidy Program which provides incentives to encourage federal employees to use mass transit or vanpooling as their preferred commuting choice. By partnering with another federal agency (Minerals Management Service) increased benefits such as reduced air emissions and fuel consumption are realized as well as increased safety and cost savings for the participants.
All SPR employees generate waste and are responsible for properly managing it. SPR
AAA9020459 Version 1.0 Section 3 - Page 15
requirements, corresponding training, and compliance with procedural and contractual requirements minimize its generation. To further achieve waste minimization/reduction, the SPR promotes the use of non-hazardous substitutes, prevention of spills, and proper management of those wastes generated. These and other P2 activities are incorporated in the design, construction, operation, and maintenance of all projects and activities. SPR employees are trained on buying items with recycled content in accordance with the Comprehensive Procurement Guidelines (CPG), which is EPA's continuing effort to promote the use of materials recovered from solid waste. DM employees empowered to make purchases are required to take an annual computer based training (CBT) course on AP. This helps ensure that the materials collected in recycling programs will be reused again in the manufacture of new products. In 2011, the SPR again achieved 100 percent success for purchasing AP products, helping to fulfill the SPR target Pollution Prevention Goal to increase purchases of EPA-designated items with recycle content, as referenced in Section 2.
3.6 SUSTAINABILITY PROGRAM The scope of the sustainability program includes all requirements of Executive Orders
13423 and 13514. Basically, it covers all facets of compliance and pollution prevention and is implemented through the EMS. The following is a brief listing, by sustainability goal, of projects and activities conducted in FY 2011:
Energy Efficiency and Scope 1 and 2 Green House Gas Reduction Purchased renewable energy credits equal to 6% of the electricity consumed in the
previous year 12 hybrid vehicles have replaced conventional gasoline vehicles in the SPR motor
fleet. Effort is being made to reduce fleet motor vehicle use by promoting employee
carpooling when traveling to the same location and linking trips where two or more locations are visited during the same trip instead of taking individual trips.
Annually, the SPR motor fleet undergoes a vehicle optimization exercise to assure efficient use and number of vehicles.
Scope 3 Green House Gas Reduction
Surveyed SPR personnel for commuting data and quantified business travel of SPR personnel to quantify green house gas.
Annual Comprehensive Green House Gas Inventory
A comprehensive inventory was completed for FY 2011 as part of the annual SPR Site Sustainability Plan
High Performance Sustainable Design
Green Building Specifications will continue to be included in SPR construction projects where applicable
Eight buildings at the four storage sites were selected for updating to high performance sustainable design criteria, including cost and schedule
The Readiness Review Board (RRB) process is used for commissioning of new equipment or retrofit construction to ensure that systems are designed, installed,

AAA9020459 Version 1.0 Section 3 - Page 16
functionally tested and capable of being operated and maintained to perform in conformity with the project intent.
Regional and Local Planning
The SPR continues its strong communication with federal and state regulators. Water Use Efficiency and Management
The BC potable water distribution system was disconnected from an on-site water well and tied to a Parish water supply system.
Pollution Prevention and Waste Elimination
SARA (312) Title III, Tier Two reports were completed for each SPR facility and distributed.
Quantity and types of toxic chemical products continues to be reduced through approval and allowance of less toxic equivalents through the Qualified Products List.
Chemical products were inventoried at each SPR site during their organizational assessment with the intent of determining ways to eliminate or minimize their acquisition.
SPR sites continue to operate within their air and water permit limits established by regulating agencies.
Generation of hazardous waste was limited to 230 lbs., which is only 51% of the do-not-exceed target of 450 lbs.
Air pollutant emissions are tracked and maintained at BC, BH, BM, and WH. Air emissions were recalculated using EPA's AP-42, when facility changes were made. Annual emission reports were submitted to states as required. H2S emissions will be monitored at facility fenceline (to determine public exposure) when a site activity such as oil spill, combined with specific meteorological conditions, could result in offsite emissions.
No permit non-compliances occurred during the year anywhere on the SPR. There was one reportable release (brine) during the year, at BC, WH, surpassing the
do-not-exceed target of three annual reportable releases. Contaminants identified by the U.S. Geological Survey as part of its National
Reconnaissance of Emerging Contaminants are included in the SPR Qualified Products List.
Recycled 36% of sanitary wastes Generated 0.354 million lbs. of sanitary waste which is only 51% of the allowable
target of 700,000 lbs. Earth Day and America Recycles informative bulletins and awards were distributed. Participated in voluntary environmental partnership programs such as the
Stewardship Action Council (M&O contractor is a Founding Member) and the Louisiana Environmental Leadership Program.
Sustainable Acquisition
Buy It Green (BIG) Sharepoint site continues to provide information to all SPR organizations/contractors for purchasing biobased, environmentally preferable, energy-efficient (Energy Star, Federal Energy Management Program (FEMP) designated, and Electronic Product Environmental Assessment Tool (EPEAT) registered products), water-efficient (WaterSense designated products), and recycled-content products, and paper of at least 30 percent post-consumer fiber content.
SPR M&O contractor actively participates in the Energy Facility Contractors Group (EFCOG), and the Environmental Manager served as the Vice Chairperson of EFCOG Environmental Subgroup

AAA9020459 Version 1.0 Section 3 - Page 17
Electronic Stewardship and Data Centers
Environmentally preferable electronics qualified through the EPEAT are specified in the solicitation and acquisition of desktop computers, notebooks, and other electronic products for which there are EPEAT standards.
Energy Star features are deployed to maximum degree (based on mission needs) on all computers, monitors, printers, copiers, and other electronic equipment.
The useful lifespan of computer systems and other electronic products are extended through software upgrades as possible.
UNICOR was utilized for recycling end-of-life electronics.
Success in achieving performance measures related to many of these activities are found in Tables 2-11 and 2-12 in section 2 of this document.
3.7 INTEGRATED SAFETY MANAGEMENT
The EMS is the environmental leg of ISM that is integrated throughout all SPR activities. The SPR ISM utilizes the EMS to infuse ISM principles throughout the environmental program. In the same regard EMS elements are directed up through the overarching ISM system.
3.8 ENVIRONMENTAL MANAGEMENT SYSTEM (EMS)
The SPR EMS complies with provisions of executive order 13423 and 13524 and DOE Order 436.1. Environmental considerations are interwoven into management, work programs and practices at all levels so as to achieve DOE’s mission while achieving prevention of pollution, continuous improvement, and compliance with requirements. By integrating the NEPA process into the EMS, the SPR enhances protection of the environment. Protection of the public and the environment is achieved throughout all phases of a project beginning with a formal NEPA review at the conceptual stage of a project and ending with the project’s completion under controlled conditions that minimize environmental impact. A NEPA review includes the recognition of the environmental aspects of the project that, if not managed, could result in detrimental environmental impact when the project is completed. The end point of the project, such as the construction, installation, and use of a piece of equipment, is also examined for environmental aspects so that impact is controlled from implementation forward. Section 5.1 discusses the SPR EMS in greater detail.
3.9 TRAINING
Site personnel with environmental responsibilities and Emergency Response Team (ERT) personnel have received training in environmental plans and procedures. Site management personnel are knowledgeable of environmental procedures; spill reporting procedures, site-specific SPCC Plans, Emergency Response Procedures (ERP), and compliance awareness. ERT personnel from all sites participate in annual spill response refresher and hazardous materials technician training currently provided at the Beaumont Emergency Services Training facility. Onsite drills and exercises are also conducted to hone spill management strategies, practice spill cleanup methodologies, and sharpen control skills. Site response personnel are trained to rapidly and effectively contain and cleanup oil, brine, and hazardous substance spills under circumstances typical at each SPR site. New Orleans personnel, who are expected to provide site support during an

AAA9020459 Version 1.0 Section 3 - Page 18
incident response, have also been trained to the hazardous materials technician level. All site personnel, unescorted subcontractors, and some site visitors receive basic compliance and EMS awareness training via "The Active Force of Protection" video which provides an overview of the environmental program including individual responsibilities under the program. Spill Prevention and Waste Management/Hazardous Waste Handling training is mandatory and conducted annually for those personnel who could discover, prevent, or respond to spills, and handle or supervise the handling of wastes.
All site personnel also receive computer-based ISO 14001 EMS training annually. The
training provides an overview of those elements of the ISO 14001 standard that involve all personnel. It also relates environmental aspects and impacts of SPR activities and environmental objectives to be achieved that year. A select group of personnel receive biennial CBT-based AP training. As a goal, all M&O contractor environmental staff members are trained to the National Registry of Environmental Professionals, Registered Environmental Manager level and are independently certified as such through examination. Several M&O environmental staff members have completed ISO 14001 Lead Auditor certification training in order to better assist the SPR sites with regard to performing SPR site assessments, and due-diligence inspections of disposal and recycling facilities. DOE environmental staff provides oversight of M&O and construction contractor activities and have completed ISO 14001 Lead Auditor Certification, and NEPA and environmental compliance training.
3.10 ENVIRONMENTAL FUNCTIONAL AREA SHAREPOINT WEBSITE
In order to provide an efficient and effective means of obtaining information about key environmental topics at the SPR, an Environmental Functional Area Sharepoint website was developed. This website is only available on the SPR internal intranet and contains a summary of all the major environmental regulatory and program information, including active permits, procedures and this report. The website is used to store SPR environmental documents and is typically updated daily. This report and other DOE ES&H information is available to the public at www.spr.doe.gov/esh/. End of Section
AAA9020459 Version 1.0 Section 4 - Page 1
4. ENVIRONMENTAL RADIOLOGICAL PROGRAM INFORMATION Radioactive sources at the SPR consist of X-ray that is used in laboratory and scanning equipment or other sealed sources brought on site for the purpose of performing radiography and cavern wire-line type logging operations. Procedures are in place to protect personnel from exposure during these operations. In addition the SPR is subject to inspections by the state implementing agencies (LDEQ and Texas Department of Health) and required notices to employees are posted on each X-ray scanning device.
4.1 SEALED SOURCES
At the SPR sealed sources of radiation are used for monitoring activities related to the physical properties of crude oil, brine, and cavern dimensions. During 2007 sealed sources were used at the SPR to perform cavern integrity monitoring activities without the occurrence of any incidents. In 2009, one sealed source of radiation was lost in Cavern 117 at WH. The subcontracted tool company made the required notifications and provided the permanent sign which was installed on the cavern making it compliant with all regulatory requirements. The source will remain at the bottom of the cavern in the brine.
4.2 NATURALLY OCCURRING RADIOACTIVE MATERIALS (NORM)
A contracted survey conducted at all SPR sites and the commercial pipe yard where SPR piping is stored was completed in 1991. The results indicating no readings of elevated levels at any location were submitted to the state agencies as required by Louisiana and Texas regulations. No additional monitoring is required due to the negative readings taken during the 1991 NORM survey.
End of Section
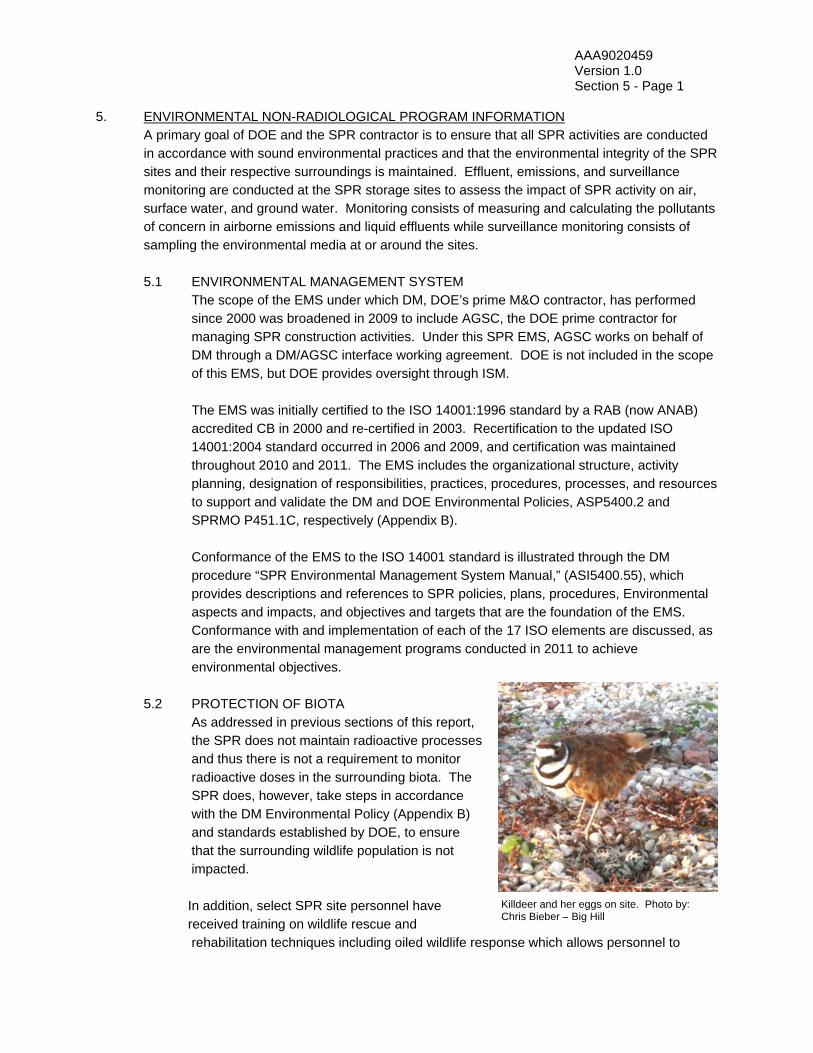
AAA9020459 Version 1.0 Section 5 - Page 1
5. ENVIRONMENTAL NON-RADIOLOGICAL PROGRAM INFORMATION A primary goal of DOE and the SPR contractor is to ensure that all SPR activities are conducted in accordance with sound environmental practices and that the environmental integrity of the SPR sites and their respective surroundings is maintained. Effluent, emissions, and surveillance monitoring are conducted at the SPR storage sites to assess the impact of SPR activity on air, surface water, and ground water. Monitoring consists of measuring and calculating the pollutants of concern in airborne emissions and liquid effluents while surveillance monitoring consists of sampling the environmental media at or around the sites. 5.1 ENVIRONMENTAL MANAGEMENT SYSTEM The scope of the EMS under which DM, DOE’s prime M&O contractor, has performed since 2000 was broadened in 2009 to include AGSC, the DOE prime contractor for managing SPR construction activities. Under this SPR EMS, AGSC works on behalf of DM through a DM/AGSC interface working agreement. DOE is not included in the scope of this EMS, but DOE provides oversight through ISM. The EMS was initially certified to the ISO 14001:1996 standard by a RAB (now ANAB) accredited CB in 2000 and re-certified in 2003. Recertification to the updated ISO 14001:2004 standard occurred in 2006 and 2009, and certification was maintained throughout 2010 and 2011. The EMS includes the organizational structure, activity planning, designation of responsibilities, practices, procedures, processes, and resources to support and validate the DM and DOE Environmental Policies, ASP5400.2 and SPRMO P451.1C, respectively (Appendix B).
Conformance of the EMS to the ISO 14001 standard is illustrated through the DM procedure “SPR Environmental Management System Manual,” (ASI5400.55), which provides descriptions and references to SPR policies, plans, procedures, Environmental aspects and impacts, and objectives and targets that are the foundation of the EMS. Conformance with and implementation of each of the 17 ISO elements are discussed, as are the environmental management programs conducted in 2011 to achieve environmental objectives.
5.2 PROTECTION OF BIOTA
As addressed in previous sections of this report, the SPR does not maintain radioactive processes and thus there is not a requirement to monitor radioactive doses in the surrounding biota. The SPR does, however, take steps in accordance with the DM Environmental Policy (Appendix B) and standards established by DOE, to ensure that the surrounding wildlife population is not impacted.
In addition, select SPR site personnel have received training on wildlife rescue and
rehabilitation techniques including oiled wildlife response which allows personnel to
Killdeer and her eggs on site. Photo by: Chris Bieber – Big Hill

AAA9020459 Version 1.0 Section 5 - Page 2
work under the supervision of a licensed rehabilitator or manage contract rehabilitators. Trained personnel have special knowledge and skills in the wildlife rescue and rehabilitation techniques necessary in support of the emergency incident command structure organization. An oil spill at the SPR sites could affect large numbers of protected migratory birds and wildlife requiring many trained and certified responders.
5.3 AIR QUALITY MONITORING
Air pollutants of concern emitted by the SPR sites are either hazardous or have an impact on the ambient air quality. Benzene, toluene, ethyl benzene, and xylene are HAPs that are emitted in relatively small quantities and do not trigger HAP reporting. The non-hazardous pollutants that have an impact on air quality are non-methane/non-ethane VOCs, nitrogen oxides (NOx), sulfur dioxides (SO2), CO, and particulate matter (PM10). The quantity of these pollutants emitted is minor relative to other facilities in the respective air quality regions.
Monitoring for air pollutants consists of monitoring processes and calculating the volume through the use of acceptable industry practices. These results are compared to the permitted limits to ensure that they are in compliance.
Monitoring at the SPR consists of measuring the following in order to quantify emissions:
run-time of diesel powered emergency electrical generators;
volume and type of crude oil flowed through frac tanks, floating roof tanks, diesel tanks, gasoline tanks, and oil-water separators;
volume of paint and solvent used on-site;
volume of brine which may release VOCs placed into the brine pond;
number of piping components that emit over the acceptable regulatory limits by monitoring all components with an OVA.
Monitoring for air pollutants is conducted at both Texas and Louisiana sites. The results are reported to the Texas state agency through EIQs. The Louisiana sites are exempt from reporting because their emissions are below the regulatory threshold for reporting in their respective air quality regions. Even though the results of monitoring for BC and WH are not reported, they are used to determine ongoing compliance with the permit and assure adequate performance of emission control equipment. In addition, air pollution control equipment monitoring is performed at SPR sites. Air regulations require that seals on internal and external floating roof tanks be inspected at frequent intervals for visible tears, holes, or cumulative gaps exceeding regulatory limits, and to ensure they are operating accordingly. The BH and BM sites each have an external floating roof tank that requires inspection of the primary (every five years) and secondary (semi-annual) seals. The two internal floating roof tanks at BM have a mechanical shoe seal that requires seal inspections every year.

AAA9020459 Version 1.0 Section 5 - Page 3
5.3.1 Bayou Choctaw Located in an attainment area for ozone, BC is permitted to emit 7.4 metric tons per year (tpy) (8.14 tpy) of VOC. Since this site emits less than nine metric tpy (10 tpy), it is not required to submit an emissions inventory summary (EIS) to report its annual emissions.
Although BC is exempt from reporting emissions, monitoring was conducted in 2011 on all permitted sources. These sources include the volume of crude oil in slop tanks and frac tanks, volume of brine flowing through the brine pond, fugitive emissions from monitoring piping components for acceptability, and monitoring the run-time of the emergency generators. BC operated in accordance with all air quality regulatory requirements in 2011. Table 5-1 is a summary of the permitted limits and actual emissions for BC.
Table 5-1. Parameters for the Bayou Choctaw Emission Points
Emission Point Description
Parameter
Permit Limits Metric tpy (tpy)
Actual Emissions Metric tpy (tpy)
Crude & Slop Oil Tanks VOC 2.43 (2.67) 0.37 (0.41) Gasoline Fuel Tank VOC 0.52 (0.57) 0.17 (0.19) Frac Tanks VOC 1.42 (1.56) 0 (0) Brine Pond VOC 1.14 (1.26) 0.05 (0.06) Fugitive Emissions VOC 1.66 (1.83) 0.05 (0.06) Air Eliminator VOC 0.04 (0.04) 0 (0) Emergency Generators/Pumps VOC
PM10 SO2 NOx CO
0.19 (0.21) 0.18 (0.20) 0.72 (0.79) 5.54 (6.09) 1.26 (1.39)
0.03 (0.03) 0.03 (0.03) 0 (0)
0.67 (0.74) 0.15 (0.17)
5.3.2 Big Hill
Located in an ozone attainment area, BH is permitted to emit 7.44 metric tpy (8.20 tpy) of VOC. BH is required to use an EIQ to report its annual emissions if it emits 10 tpy of VOC. Monitoring was conducted in 2011 on all permitted sources such as the volume of crude oil in slop tanks, frac tanks, and surge tanks; volume of brine into the brine pond; and monitoring the run-time of the emergency generators. BH operated in accordance with all air quality regulatory requirements in 2011. Table 5-2 is a summary of the permitted limits and actual emissions for BH.
Table 5-2. Parameters for the Big Hill Emission Points
Emission Point Description
Parameter Permit Limits,
Metric tpy (tpy) Actual Emissions
Metric tpy (tpy) Crude & Slop Oil Tanks VOC 1.45 (1.60) 0.91(1.00)
Gasoline & Diesel Fuel Tanks VOC 0.35 (0.39) 0.27(0.30) Frac Tanks VOC None 0.09 (0.10) Brine Pond VOC 2.86 (3.15) 1.84 (2.03)
Fugitive Emissions VOC 2.59 (2.86) 0.07 (0.08) Air Eliminator VOC 0.07 (0.08) 0 (0)
Solvent Recycler VOC Acetone
0.01 (0.01) 0.01 (0.01)
0 (0) 0 (0)
Emergency Generators/Pumps VOC PM10 SO2 NOx CO
0.10 (0.11) 0.09 (0.10) 0.64 (0.70) 2.30 (2.54) 0.53 (0.58)
0.08 (0.09) 0.08 (0.09)
0 (0) 2.24 (2.47) 0.51 (0.56)
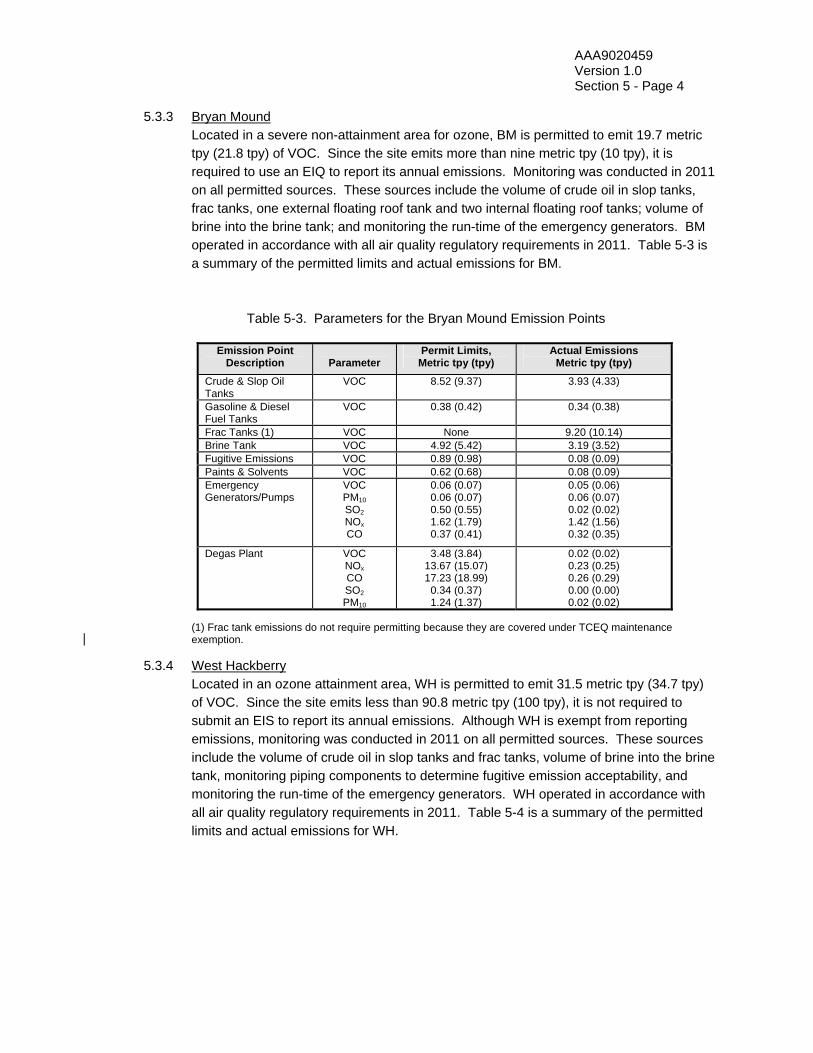
AAA9020459 Version 1.0 Section 5 - Page 4
5.3.3 Bryan Mound Located in a severe non-attainment area for ozone, BM is permitted to emit 19.7 metric tpy (21.8 tpy) of VOC. Since the site emits more than nine metric tpy (10 tpy), it is required to use an EIQ to report its annual emissions. Monitoring was conducted in 2011 on all permitted sources. These sources include the volume of crude oil in slop tanks, frac tanks, one external floating roof tank and two internal floating roof tanks; volume of brine into the brine tank; and monitoring the run-time of the emergency generators. BM operated in accordance with all air quality regulatory requirements in 2011. Table 5-3 is a summary of the permitted limits and actual emissions for BM.
Table 5-3. Parameters for the Bryan Mound Emission Points
(1) Frac tank emissions do not require permitting because they are covered under TCEQ maintenance exemption.
5.3.4 West Hackberry
Located in an ozone attainment area, WH is permitted to emit 31.5 metric tpy (34.7 tpy) of VOC. Since the site emits less than 90.8 metric tpy (100 tpy), it is not required to submit an EIS to report its annual emissions. Although WH is exempt from reporting emissions, monitoring was conducted in 2011 on all permitted sources. These sources include the volume of crude oil in slop tanks and frac tanks, volume of brine into the brine tank, monitoring piping components to determine fugitive emission acceptability, and monitoring the run-time of the emergency generators. WH operated in accordance with all air quality regulatory requirements in 2011. Table 5-4 is a summary of the permitted limits and actual emissions for WH.
Emission Point Description
Parameter
Permit Limits, Metric tpy (tpy)
Actual Emissions Metric tpy (tpy)
Crude & Slop Oil Tanks
VOC 8.52 (9.37)
3.93 (4.33)
Gasoline & Diesel Fuel Tanks
VOC 0.38 (0.42) 0.34 (0.38)
Frac Tanks (1) VOC None 9.20 (10.14) Brine Tank VOC 4.92 (5.42) 3.19 (3.52) Fugitive Emissions VOC 0.89 (0.98) 0.08 (0.09) Paints & Solvents VOC 0.62 (0.68) 0.08 (0.09) Emergency Generators/Pumps
VOC PM10 SO2 NOx
CO
0.06 (0.07) 0.06 (0.07) 0.50 (0.55) 1.62 (1.79) 0.37 (0.41)
0.05 (0.06) 0.06 (0.07) 0.02 (0.02) 1.42 (1.56) 0.32 (0.35)
Degas Plant VOC NOx
CO SO2
PM10
3.48 (3.84) 13.67 (15.07) 17.23 (18.99)
0.34 (0.37) 1.24 (1.37)
0.02 (0.02) 0.23 (0.25) 0.26 (0.29) 0.00 (0.00) 0.02 (0.02)

AAA9020459 Version 1.0 Section 5 - Page 5
Table 5-4. Parameters for the West Hackberry Emission Points
5.4 WATER DISCHARGE EFFLUENT MONITORING
The water discharge permit-monitoring program fulfills the requirements of the EPA NPDES, and corresponding states RCT Rule 8 and LPDES programs. All SPR point source discharges are conducted in compliance with these federal and state programs.
SPR personnel regularly conducted point source discharges from all sites during 2010. These discharges are grouped as follows: a. brine discharged to the Gulf of Mexico; b. storm water runoff from tank, well, and pump pads; c. rinse water from vehicles at specific locations draining to permitted outfalls; d. effluent from package sewage treatment plants; and e. hydrostatic test water from piping or tanks (LA only).
The SPR disposed of 4.21 million m3 (26.46 mmb) of brine (mostly saturated sodium chloride solution with some infrequent discharges of lower salinities than normally attributed to brine) during 2011. Approximately 76.7 percent of the brine was disposed in the Gulf of Mexico via the BM (31.64 percent of the total) and the BH (45.02 percent of the total) brine disposal pipelines. The remaining 23.3 percent was disposed in saline aquifers via injection wells at the WH site (23.07 percent of the total) and BC site (0.27 percent of the total). These figures represent an overall major project-wide increase of brine disposal that translates to a more than five fold increase over the 2010 calendar year.
During 2011, 1,244 measurements and analyses were performed and reported to monitor wastewater discharge quality from the SPR in accordance with NPDES and corresponding state permits. With zero non-compliances experienced in 2011, the SPR was in compliance with permit requirements for 100 percent of the analyses performed.
Emission Point Description Parameter
Permit Limits,Metric tpy (tpy)
Actual EmissionsMetric tpy (tpy)
Slop Oil Tanks & Sump VOC 1.74 (1.92) 0.50 (0.55)
Gasoline Fuel Tank VOC 0.73 (0.81) 0.59 (0.65)
Frac Tanks VOC 23.85 (26.29) 9.73 (10.73)
Brine Tanks VOC 2.72 (3.00) 2.37 (2.61)
Fugitive Emissions VOC 0.10 (0.11) 0.10 (0.11)
Air Eliminator VOC 0.06 (0.07) 0 (0)
Emergency Generator VOC PM10 SO2 NOx CO
0.24 (0.26) 0.24 (0.26) 1.10 (1.21) 8.11 (8.94) 1.86 (2.05)
0.06 (0.07) 0.06 (0.07)
0 (0) 2.22 (2.45) 0.51 (0.56)
Degas Plant VOC PM10 SO2 NOx CO
1.60 (1.76) 1.26 (1.39) 0.35 (0.39)
13.89 (15.31) 17.52 (19.31)
0 (0) 0 (0) 0 (0) 0 (0) 0 (0)

AAA9020459 Version 1.0 Section 5 - Page 6
Parameters monitored varied by site and discharge. Separate tables provide specific parameters and the most frequent sampling interval (based on permit limitations). More frequent measurements are often made of certain parameters that assist with unit operations; these additional data are reported as required by the permits. The data measurement variation observed during CY 2011 is discussed in separate site specific sections.
5.4.1 Bayou Choctaw
BC personnel performed and reported a total of 47 measurements on permitted outfalls and reporting stations to monitor LPDES permit compliance during 2011. Table 5-5 provides the permit required monitoring parameters and limits for the BC outfalls, reflecting the changes associated with the permit renewal effective August, 2011. There were no permit non-compliances at BC in 2011 resulting in a 100 percent site compliance performance record for the year
Most monitoring is related to water discharges regulated under the LDEQ Office of Water Resources LPDES permit. Discharges are from two package sewage treatment plants (STP), a permit limited vehicle rinsing station with the site’s stormwater runoff from well pads, and pump pads (containment areas), addressed as a cross-reference to the LA MSGP and in the permit required SWPPP.
Table 5-5. Parameters for the Bayou Choctaw Outfalls
Location/Discharge
Parameter
Frequency
Compliance Range
Sewage Treatment Plants Flow BOD5 TSS pH Fecal Coliform
1/6 months 1/6 months 1/6 months 1/6 months 1/6 months
(Report only, GPD) <45 mg/l Avg. <45 mg/l max 6.0 – 9.0 s.u. <400 col./100 ml
Storm Water (from former named/numbered outfalls)
Systematic Visual Observation
1/quarter (if discharging)
maintain written observations
Vehicle Rinsing (without soaps and/or detergents)
Flow COD TSS Oil and grease pH
1/quarter 1/quarter 1/quarter 1/quarter 1/quarter
Estimate in GPD <200 mg/l avg and <300 mg/l max <45 mg/l <15 mg/l 6.0-9.0 s.u.
5.4.2 Big Hill During 2011, 647 measurements were performed reported to monitor NPDES and state discharge permit compliance. Table 5-6 provides the permit required monitoring parameters and limits for the BH outfalls. There were no non-compliances during 2011 resulting in a 100 percent site compliance performance level.
Water discharges at BH are regulated and enforced through the EPA NPDES permit program and the similar RCT discharge permit program (Rule 8). The discharges at the site involve brine to the Gulf of Mexico, hydroclone blow down into the ICW, effluent from the sewage treatment plant, and storm water from well pads and pump pads. There were no discharges during 2011 from the hydroclone blow down system.

AAA9020459 Version 1.0 Section 5 - Page 7
Table 5-6. Parameters for the Big Hill Outfalls
Location/Discharge
Parameter
Frequency
Compliance Range
Brine to Gulf Flow Velocity Oil & Grease TDS TSS pH DO Biomonitoring Integrity Tests
Continuously Per flow 1/month 1/month 1/month 1/month Daily 1/quarter 1/year
0.27 million m3/day >9.1 m/sec (30 ft/sec) <15 mg/l max, <10 mg/l avg. (report only) (report only) 6.0 - 9.0 s.u. detectable (when using O2 scavenger) Lethal NOEC 2.5% Offshore within 4% of onshore
Storm Water Outfalls Oil and Grease TOC pH Salinity
1/quarter 1/quarter 1/quarter 1/quarter
<15 mg/l < 75 mg/l 6.0 - 9.0 s.u. <8 ppt
Recirculated Raw Water Flow 1/month Report only Sewage Treatment Plant
Flow BOD5 TSS pH
5 days/week 1/month 1/month 1/month
(report only) <45 mg/l max and <20 mg/l avg. <45 mg/l max and <20 mg/l avg. 6.0 - 9.0 s.u.
Hydroclone Blow down (not used)
Flow TSS pH
1/week 1/week 1/week
report report 6.0 - 9.0 s.u.
5.4.3 Bryan Mound
BM personnel made and reported 505 measurements on permitted outfalls for the purpose of monitoring NPDES and state discharge permit compliance during 2011. Table 5-7 provides the permit-required parameters and limits for the BM outfalls. There were no permit non-compliances resulting in a site compliance performance level of 100 percent for the calendar year.
Water discharges at BM are regulated and enforced through the EPA NPDES permit program and the similar RCT discharge permit program for state waters (Rule 8).
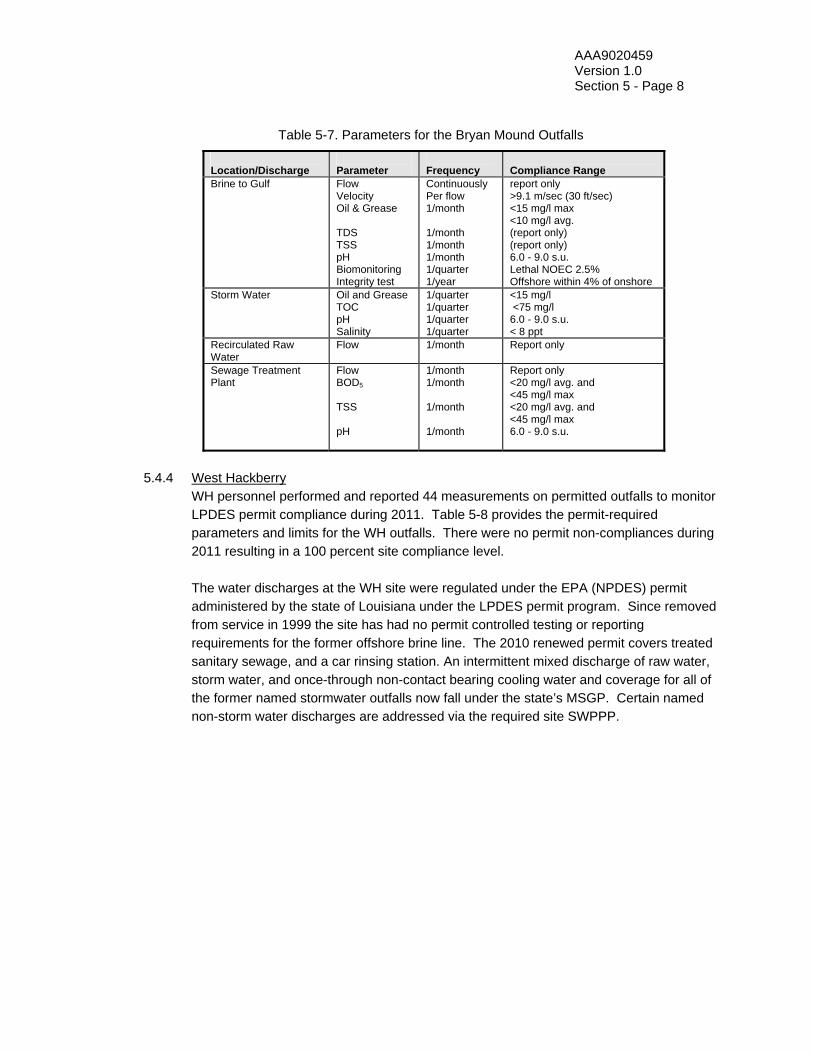
AAA9020459 Version 1.0 Section 5 - Page 8
Table 5-7. Parameters for the Bryan Mound Outfalls
Location/Discharge
Parameter
Frequency
Compliance Range
Brine to Gulf
Flow Velocity Oil & Grease TDS TSS pH Biomonitoring Integrity test
Continuously Per flow 1/month 1/month 1/month 1/month 1/quarter 1/year
report only >9.1 m/sec (30 ft/sec) <15 mg/l max <10 mg/l avg. (report only) (report only) 6.0 - 9.0 s.u. Lethal NOEC 2.5% Offshore within 4% of onshore
Storm Water Oil and Grease TOC pH Salinity
1/quarter 1/quarter 1/quarter 1/quarter
<15 mg/l <75 mg/l 6.0 - 9.0 s.u. < 8 ppt
Recirculated Raw Water
Flow 1/month Report only
Sewage Treatment Plant
Flow BOD5 TSS pH
1/month 1/month 1/month 1/month
Report only <20 mg/l avg. and <45 mg/l max <20 mg/l avg. and <45 mg/l max 6.0 - 9.0 s.u.
5.4.4 West Hackberry
WH personnel performed and reported 44 measurements on permitted outfalls to monitor LPDES permit compliance during 2011. Table 5-8 provides the permit-required parameters and limits for the WH outfalls. There were no permit non-compliances during 2011 resulting in a 100 percent site compliance level.
The water discharges at the WH site were regulated under the EPA (NPDES) permit administered by the state of Louisiana under the LPDES permit program. Since removed from service in 1999 the site has had no permit controlled testing or reporting requirements for the former offshore brine line. The 2010 renewed permit covers treated sanitary sewage, and a car rinsing station. An intermittent mixed discharge of raw water, storm water, and once-through non-contact bearing cooling water and coverage for all of the former named stormwater outfalls now fall under the state’s MSGP. Certain named non-storm water discharges are addressed via the required site SWPPP.
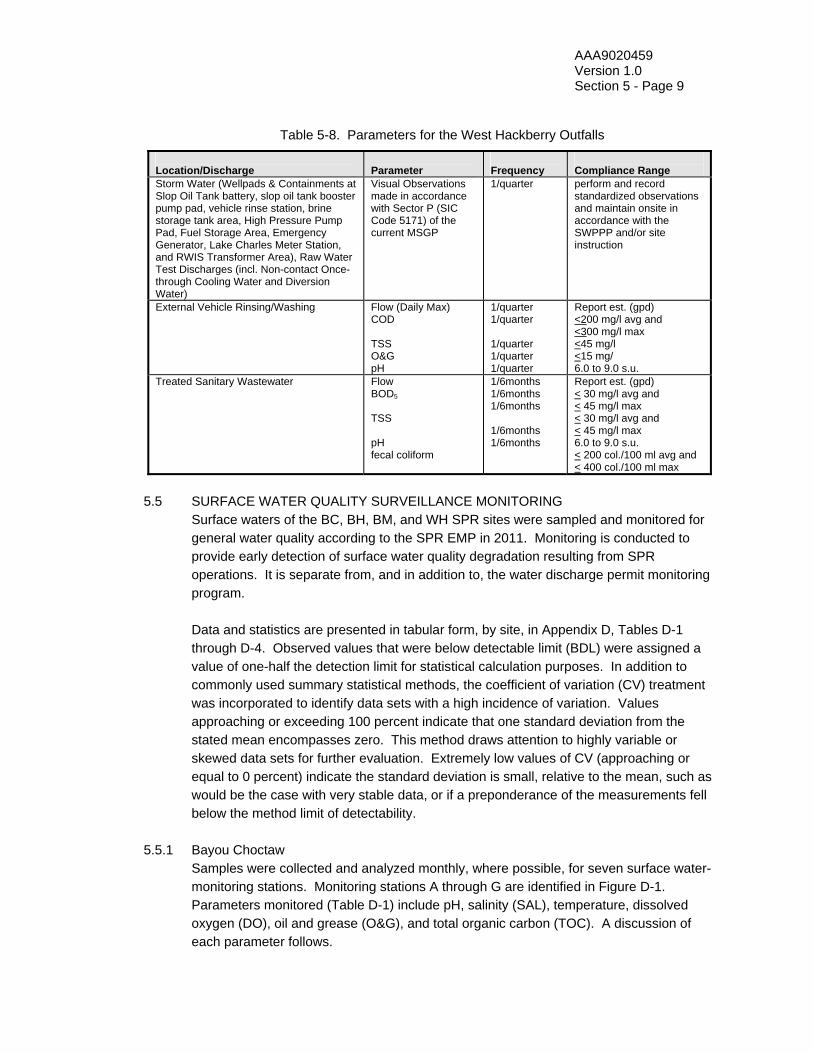
AAA9020459 Version 1.0 Section 5 - Page 9
Table 5-8. Parameters for the West Hackberry Outfalls
Location/Discharge
Parameter
Frequency
Compliance Range
Storm Water (Wellpads & Containments at Slop Oil Tank battery, slop oil tank booster pump pad, vehicle rinse station, brine storage tank area, High Pressure Pump Pad, Fuel Storage Area, Emergency Generator, Lake Charles Meter Station, and RWIS Transformer Area), Raw Water Test Discharges (incl. Non-contact Once-through Cooling Water and Diversion Water)
Visual Observations made in accordance with Sector P (SIC Code 5171) of the current MSGP
1/quarter
perform and record standardized observations and maintain onsite in accordance with the SWPPP and/or site instruction
External Vehicle Rinsing/Washing Flow (Daily Max) COD
TSS O&G pH
1/quarter 1/quarter 1/quarter 1/quarter 1/quarter
Report est. (gpd) <200 mg/l avg and <300 mg/l max <45 mg/l <15 mg/ 6.0 to 9.0 s.u.
Treated Sanitary Wastewater Flow BOD5
TSS pH fecal coliform
1/6months 1/6months 1/6months 1/6months 1/6months
Report est. (gpd) < 30 mg/l avg and < 45 mg/l max < 30 mg/l avg and < 45 mg/l max 6.0 to 9.0 s.u. < 200 col./100 ml avg and < 400 col./100 ml max
5.5 SURFACE WATER QUALITY SURVEILLANCE MONITORING
Surface waters of the BC, BH, BM, and WH SPR sites were sampled and monitored for general water quality according to the SPR EMP in 2011. Monitoring is conducted to provide early detection of surface water quality degradation resulting from SPR operations. It is separate from, and in addition to, the water discharge permit monitoring program. Data and statistics are presented in tabular form, by site, in Appendix D, Tables D-1 through D-4. Observed values that were below detectable limit (BDL) were assigned a value of one-half the detection limit for statistical calculation purposes. In addition to commonly used summary statistical methods, the coefficient of variation (CV) treatment was incorporated to identify data sets with a high incidence of variation. Values approaching or exceeding 100 percent indicate that one standard deviation from the stated mean encompasses zero. This method draws attention to highly variable or skewed data sets for further evaluation. Extremely low values of CV (approaching or equal to 0 percent) indicate the standard deviation is small, relative to the mean, such as would be the case with very stable data, or if a preponderance of the measurements fell below the method limit of detectability.
5.5.1 Bayou Choctaw
Samples were collected and analyzed monthly, where possible, for seven surface water-monitoring stations. Monitoring stations A through G are identified in Figure D-1. Parameters monitored (Table D-1) include pH, salinity (SAL), temperature, dissolved oxygen (DO), oil and grease (O&G), and total organic carbon (TOC). A discussion of each parameter follows.

AAA9020459 Version 1.0 Section 5 - Page 10
Hydrogen Ion Activity - The annual median values of pH for all the monitored stations ranged from 7.2 to 7.6 s.u., which is consistent with ambient conditions of the surrounding waters. The complete range for all measurements at all stations for 2011 is 7.0 to 8.5 s.u. Fluctuations observed are attributed to environmental and seasonal factors such as variations in rainfall, temperature, and aquatic system flushing.
Temperature - Observed temperature ranged from 4.7 C to 28.1 C. Temperature fluctuations were consistent among all stations and are attributed solely to meteorological conditions since the BC site produces no thermal discharges.
Salinity - Average annual salinities in 2011 ranged from 0.5 ppt (indicating below detectable limits) to 1.0 ppt at (Stations A, C, and F). Wetland stations B, D, E, and G revealed below detectable limits throughout the year in their respective databases. Four total measurements above BDL were shared at stations A, C, and F, with station F receiving two of those. Station F is situated in the wetland waters subject to variable conditions (highest CV of all stations). Low water conditions may have influenced the salinity readings this year. It is believed that the remainder of the values are a response to the return of a near normal rainfall pattern for the region.
Oil and Grease – Eighteen separate quantifications above BDL for O&G were spread amongst the seven reporting stations. This basically means that for 2011, O&G levels were found to be measurable in 65 percent of the samples taken over the year at all of the stations. No definitive source is identifiable nor did any oil spillage occur at the site; and the levels measured are too small to result in producing a visible sheen. The total range in the measurements was from BDL to 7.0 mg/l, with each station quantifying O&G in two or three of the quarterly sampling episodes.
Dissolved Oxygen - Overall, DO average and median levels are relatively low (below the minimum threshold <5 mg/l). The range for all stations is 0.5 mg/l to 6.4 mgl, with annual means and medians for all stations ranging from 2.6 mg/l to 4.0 mg/l. These low numbers are attributed to high temperature and high natural organic loading combined with low flow and minimal flushing typically observed at times in the two wetland area stations. Peak levels over 6.0 mg/l at stations A, and G are attributed to increased primary productivity.
Total Organic Carbon - Average annual TOC concentrations ranged from 10.9 to 13.2 mg/l. High TOC readings typically correlate with high organic loading that is usually found in stagnant or sluggish water bodies of limited volume, such as an evaporating pool of water. The highest value measured was 39.6 mg/l occurring at Station A suggesting low flows to stagnant water for several months as this station also had the highest average TOC for this year. The relatively low values observed around the site sampling locations as well as the peaks produced no discernible physical impacts and are not out of line with the natural setting or system receiving episodic rainfall.

AAA9020459 Version 1.0 Section 5 - Page 11
General Observations - Based on the above discussion, the following general observations are made regarding the quality of BC surface waters.
The surrounding surface waters continue to have a relatively neutral to slightly basic pH, with infrequent more basic excursions attributable to a localized flushing (runoff) action with the episodic rainfall.
Observed salinity measurements remained generally low and within the historical range.
Temperature variations were caused by seasonal changes. There are no thermal processes used at any SPR site.
Low minimum and annual average DO levels are attributed to high temperatures and organic loading resulting from low flow and minimal flushing typically observed in backwater swamp areas.
This year all stations reported measurable oil and grease levels. The highest measurement (7.0 mg/l) is not enough to produce a visible sheen. The values, although numerous about the site, are not indicative of any relatable spill events at the facility, as no oil releases occurred during the year.
5.5.2 Big Hill
Monitoring stations were established at five locations (Figure D-2) to assess site-associated surface water quality and to provide early detection of any surface water quality degradation that may result from SPR operations. It must be noted that Station A has only minimal sampling coverage again this year. Because this sample point is located at an overflow point to a former onsite stock pond that first receives the site’s treated effluent, it has become rare that a monthly flowing surface water sample can be taken due to low rainfall and the infrequent batching from the sewage treatment plant. Parameters including pH, temperature, SAL, O&G, DO and TOC were monitored (Table D-2).
Hydrogen Ion Activity - The 2011 data show the pH of site and surrounding surface waters remained between 6.7 and 8.42 s.u. The annual median values of pH for each of the monitored stations ranged from 7.4 to 7.7 s.u. and indicate that in general the area waters sampled became slightly more basic versus last year’s readings.
Temperature - Temperatures observed in 2011 ranged from 11 C to 31 C exhibiting the characteristics expected from seasonal meteorological changes. All stations reported very similar ranges and temporal fluctuations throughout the year. Salinity – Long-term average annual salinities are usually quite low for the BH stations and physical setting and the individual monthly tests typically range from fresh on the site all year long to a maximum, usually in the upper teens, associated with the tidally influenced RWIS location on the ICW (Station C) nearest the Gulf. Because of its location, Station C also routinely has a higher mean and a higher median salinity as compared to the other stations. This year all stations reported acceptably low variation salinity data with the CV values all below 100 percent. However, the means at most locales rose somewhat versus 2010. This observation may be related to the continued

AAA9020459 Version 1.0 Section 5 - Page 12
persistent drought conditions that continued throughout 2011. The short term rains and long dry spells tend to accumulate and concentrate salt content. Two of the stations (A & B) which are closest to the main site and furthest from the coast produced several BDL measurements in their respective datasets; with three stations revealing increasing (more salty) conditions. Station A was capable of producing flowing samples in 5 of the 12 months this year due to drought. Even so, this station produced the lowest mean and median values and also the most consistent (least variable) dataset this year.
Oil and Grease - No oil & grease value was found above the historic detectable limit of 5 mg/l this year. No indication of oil impacts from SPR activities was found or observed during any of the sampling episodes. Stations A and E had only three of the quarterly O&G samples this year due to low water or non-flowing conditions.
Dissolved Oxygen - Dissolved oxygen generally is greatest in the winter and spring and lowest from summer through fall. DO peaks were observed in the months of December through February and the lowest values were determined in the summer to early fall generally in the August to November timeframe this year. The lowest variability of a full 12 month set of data points was found at the RWIS measuring point of the ICW (Station C) with a CV value of 27.0 percent where the general size of the water body is expected to impart a more consistent dissolved oxygen level that the testing embellishes and although the variability is the most modest, it is not without variation in the year. The station with the most DO variability during the year was sampling station A with a CV of 51.4 percent, however, only five of the 12 monthly samples could be taken due to non-flowing conditions. The overall range in DO this year is found to be 1.7 mg/l to 9.4 mg/l with a mean range of 5.2 mg/l to 7.0 mg/l from all tests and stations. None of the monitoring stations produced samples during the year with DO levels below 1 mg/l. Levels below 1.0 mg/l cannot be expected to support much aerobic life; values below 2.0 mg/l generally define anoxic conditions. The low values were not persistent and may be associated with varying degrees of flushing, peak primary production, or both.
Total Organic Carbon - Average annual TOC concentrations varied from 7.3 to 39.2 mg/l over the year at the five monitoring stations. The range in TOC from all samples is 4.5 to 70.1 mg/l. Stations B, D, and E had noticeably higher levels of TOC than other stations. The consistently higher TOC levels observed are believed to be a result of intermittent reduced flushing (dry spells) combined with higher organic loading (post Ike detritus) reaching the receiving waters and stagnating off and on throughout the year.
General Observations - Based on the above discussion, the following general observations are made regarding the quality of BH surface waters.
The fresh surface waters had a slightly basic tendency this year in terms of the range of median pH, with many of the receiving waters found to range a little wider and also slightly elevated(more basic) than in 2010, both in terms of median values and overall range.

AAA9020459 Version 1.0 Section 5 - Page 13
The observed salinity measurements were lower on the site and increased in natural fashion from fresh water at the site to an intermediate brackish and highly variable water regime at the ICW. The flushing action occurring post-Hurricane Ike, appears to have concluded, at least temporarily, as drought conditions concentrated salts in many of the sampled locations this year.
Surrounding surface waters were neither contaminated nor affected by SPR crude oil with no O&G measurement made from the five stations monitored.
Temperature variations followed seasonal meteorological changes. In general, low dissolved oxygen and high total organic carbon fluctuations were
within typical ranges indicative of seasonal meteorological and biological influences for such a setting and range of environments. DO levels did not drop below 1.7 mg/l this year and TOC values did not rise above 70.1 mg/l. Both of these values are noticeable natural improvements in their own versus last year’s datasets.
5.5.3 Bryan Mound
Surface receiving waters surrounding the BM site were monitored during 2011. Blue Lake has seven sampling stations and Mud Lake has three established stations. Surface water monitoring stations are identified in Figure D-3. Stations A through C and E through G are located along the Blue Lake shoreline to monitor effects of site runoff. Stations H and I are located along the Mud Lake shoreline to monitor effects of site runoff. Stations D and J, located further from the site, serve as controls. The results from these controls will not be included in the analysis, but will serve as references.
Parameters monitored in the BM surface waters include pH, temperature, salinity, oil and grease, dissolved oxygen, and total organic carbon (Table D-3). Mud Lake water levels were high enough this year to accomplish 7 monthly sampling events which is the same as with 2010 and Blue Lake had water levels high enough for sampling in only 5 of the 12 months. Hydrogen Ion Activity - In 2011, the pH range for Blue Lake and Mud Lake stations was from 6.5 to 8.1 s.u. for the combined datasets. The control point for Blue Lake produced a similar range of 7.2 s.u. to 7.6 s.u. The range for the Mud Lake control was 6.6 to 8.1 s.u. The results reveal a slightly basic condition for Blue Lake, and slightly more acidic for Mud Lake, while also proving an analogous condition for the controls. These data are indicative of natural waters devoid of carbon dioxide and generally hard in regard to mineral content. Marine and brackish waters, such as those in Blue Lake and Mud Lake, typically have somewhat elevated pH levels and high mineral content. The pH fluctuations measured this year are comparable to the normal range of variability historically seen at the BM site.
Temperature - Temperatures observed in 2011 ranged from 10.9 C to 33.1 C and reflect a complete set of monthly ambient surface water testing in Blue Lake and nearly a full range of seasonal samples for Mud Lake. The observation can be made, however, that the range of fluctuations are attributed to meteorological events. Salinity - Observed salinity fluctuations ranged from 4.5 ppt to only 5.6 ppt in Blue Lake and from 10.9 ppt to 37.6 ppt in Mud Lake. Salinity fluctuations are attributed to meteorological and tidal conditions rather than site operations, since salinity observed at

AAA9020459 Version 1.0 Section 5 - Page 14
control sample stations D and J varied consistently with those found along site shorelines. The higher salinity values in Mud Lake are primarily caused by the strong tidal and wind influence on the lake, its more direct link with the nearby Gulf of Mexico through the ICW. This year's datasets indicate a return to a persistent drought pattern for the area.
Oil and Grease – All samples at the eight stations and two control locales were below the detectable limit (5.0 mg/l) calculated at 2.5 mg/l for statistical calculations. These data favorably reflect continued good site housekeeping and effective site spill prevention, control, and response efforts. Dissolved Oxygen - During 2011, DO was measured from five times at each Blue Lake station to seven times at each of the Mud Lake stations during the year. The two lakes produce differences in oxygen content that vary opposite to the variation in salinity. Mud Lake is tidally influenced with regular inflows of estuarine/Gulf waters slightly lower in DO concentrations; whereas, Blue Lake, reflecting a fresher regime, typically would be expected to have a higher oxygen carrying capacity. However, for 2011, Mud Lake was again observed this year have both higher means and median DO levels than those found in Blue Lake, and also higher maximum values than those observed in Blue Lake. Fluctuations in DO levels in each lake are consistent with their respective control points. All measurements indicate “no apparent impact” from SPR operations. Blue Lake means and medians that range from 3.1 mg/l to 3.8 mg/l and 3.1 mg/l to 3.9 mg/l respectively, verify that overall DO levels were adequate for aquatic life throughout the year. Mud Lake’s lowest DO measurement of 1.0 mg/l, was about the same as Blue Lake’s low of 2.1 mg/l this year; however, means for the Mud Lake stations were above 3.3 mg/l and medians were found above 3.0 mg/l support the likelihood that lower DO levels although not unheard of, are infrequent, and that Mud Lake must receive a higher degree of overall mixing that may be an influence on the available DO for the waterbody.
Total Organic Carbon - In 2011, all 35 TOC measurements of Blue Lake ranged from 3.2 to 29.9 mg/l. The thirteen TOC observations made at each of the two Mud Lake stations were higher ranging from 14.3 mg/l to 31.8 mg/l. Both control points have results that are similar to their respective lakes. The TOC levels observed in both lakes, however, are indicative of healthy, unaffected ambient conditions. General Observations - Based on the above discussions, the following general observations are made regarding the quality of BM surface waters.
The observed pH was stable for the period tested and slightly basic in both Blue Lake and Mud Lake, but typical of brackish waters. Of the two receiving waters, Blue Lake was slightly more basic again this year based upon lower annual median and low values being observed in Mud Lake
Temperature and salinity fluctuations observed during the period tested are attributed to meteorological and tidal conditions rather than site operations.
TOC is found to be about the same in both receiving waters this year. The dissolved oxygen level measured in both Blue Lake and Mud Lake was within
typical ranges indicative of seasonal, meteorological, and biological influences for
AAA9020459 Version 1.0 Section 5 - Page 15
such a setting and environment and overall were found to be slightly lower in both lakes in 2011 versus 2010. The overall lower levels of DO in Blue Lake versus Mud Lake, which are contrary to the salinity levels, may be related to the higher TOC levels and resultant higher primary productivity, which in turn could be depleting or lowering DO over time or perhaps related to less overall physical mixing with a more oxygenated water such as occurs with Mud Lake.
5.5.4 West Hackberry
In 2011, six surface water quality stations (Figure D-4) were monitored monthly at WH. Parameters monitored (Table D-4) include pH, temperature, salinity, dissolved oxygen, oil and grease, and total organic carbon.
Hydrogen Ion Activity - The pH of surface waters ranged between 6.6 and 8.6 s.u., and annual median values ranged from 7.2 to 7.6 s.u. from all stations. The ambient waters measured were slightly more acidic in overall range than last year’s data. Station A, in Black Lake produced the highest median value this year with a 7.6 s.u. Station D, produced the highest single value of 8.6 s.u. for all stations. Although the travel paths and long but intermittent travel times over crushed limestone placed for erosion control and trafficability would tend to raise pH levels, the rainfall events of 2011 reduced that tendency. Fluctuations of observed pH were relatively minor and could only be attributable to environmental and seasonal factors such as variation in rainfall, temperature, algae and biotic growth, aquatic system flushing and the buffering effects of crushed limestone gravel on slightly acidic rainfall. Temperature - Observed temperatures in 2011 were consistent with observations at other sites and were indicative of regional climatic effects. No off-normal measurements were
observed. Recorded temperatures ranged from 11.0 C to 31.0 C and were found very consistent among stations. Salinity - Meteorological factors such as wind, tide, and rainfall contributed to the salinity variation observed in brackish Black Lake (Stations A, B, and C) and the ICW (Station F). Salinity ranges observed in these water bodies (16.7 to 25.5 ppt in Black Lake) and (9.1 to 25.6 ppt in the ICW) are more conducive to supporting euryhaline organisms with variable salinity tolerance and those with sufficient mobility to avoid salinity stresses that occur with seasonal changes. Station F on the ICW reflected a wider range due to the influences of the tides and proximity to diluted but saltier Gulf waters. However, mean annual salinity observed at the ICW (18.9 ppt) was lower than stations in Black Lake (20.2 to 20.6 ppt) due largely to the fresher water influences received from more northerly drainage ways to the ICW and brackish water with limited movement to or from Black Lake. Main site Stations D and E had the lowest salinities, with 21 out of 23 samples being 1.0 ppt or BDL. Salinities observed at these two upland site stations were affected by rainfall induced surface runoff and not by Black Lake. Station D had one measurement of 1.0 ppt and station E had a 1.1 ppt with the remainder being BDL. Oil and Grease – Observed O&G levels were below the detectable level (5 mg/l) for all six monitoring stations during 2011. These data are reflective of effective spill prevention and good housekeeping practices being maintained by site personnel.

AAA9020459 Version 1.0 Section 5 - Page 16
Dissolved Oxygen - Minimum DO levels were at levels that support aquatic life, ranging from 1.6 to 5.2 mg/l from all stations. Dissolved oxygen was most variable at onsite Station D as opposed to the open and flowing receiving water stations. Since all other parameters have similar patterns with the other stations, Station D’s variable and wider ranging DO values can be attributed to natural factors, such as aeration and biological oxygen demand. Station D, this year, produced the lowest single measurement and also the single highest value (12.4 mg/l). Greater surface area and water movement through currents and wave action always provide continuous aeration of the lake and ICW water. Mean DO values ranged from 7.0 to 8.3 mg/l across the six sampling stations. Total Organic Carbon - TOC concentrations for 2011 ranged from 2.0 to 30.9 mg/l with site stations D and E experiencing both the highest and lowest single values of all the stations this year. This range is not out of line with the nature of the water bodies and is very consistent with the measurements obtained during the year at all Black Lake stations. The average annual TOC concentrations by station ranged from 4.6 to 16.2 mg/l with station (E) experiencing the most variability and station (D) the largest range throughout the year. Because the variation is so consistent among the remaining stations, and especially so for the Black Lake stations, it is indicated that these measurements reflect a return of near normal rainfall to Black Lake and also the surrounding environs. General Observations - The following observations are made, based on the above discussion, concerning operational impacts on the WH aquatic environs.
pH and temperature were observed within ranges routinely expected from the archival history, setting and conditions experienced in the year. Measurements of pH from all stations remained fairly stable, and in general, the waters remained slightly basic but were found to have shifted a little more acidic in general, compared to the 2010 values. The measurements and observations made appear to be reflective of the return to more abundant coastal derived rainfall and the typical seasonal influences.
Detectable salinity levels were found mainly in Black Lake and the ICW. The salinity measurements made throughout 2011 were consistent with the ambient and slightly brackish receiving water environment, reflective of the return of abundant coastal derived rainfall to the area.
Oil and grease measurements are made quarterly throughout the year by routine in order to include seasonality in the dataset. Historically, the O&G tests here are typified by BDL measurements. The site maintained a complete BDL record at all stations and for all samples made during the year. This is reflective of a focus on good housekeeping associated with all operations and a high degree of attention on spill prevention.
All dissolved oxygen levels at site and Black Lake stations were consistently high and do not appear adversely affected by site operations. Onsite station D produced the highest and lowest levels of all stations and also the higher mean and median resulting in higher variability and larger range. None of the data from either locale suggest any impact or effects from SPR operations.
Total organic carbon concentrations were quite similar at all stations with the exception of station D throughout the year suggesting no substantial transient bio-contamination or ecological events. The increased variability observed at the site drainage stations (D and E) results from the wider range of the values found (D and E

AAA9020459 Version 1.0 Section 5 - Page 17
had the highest value and lowest value respectively) of all the locations during the year but nothing indicative of any impact, insult or impairment.
End of Section
AAA9020459 Version 1.0 Section 6 - Page 1
6. SITE HYDROLOGY, GROUND WATER MONITORING AND PUBLIC DRINKING WATER PROTECTION Ground water monitoring is performed at all 4 reserve sites to comply with DOE Order 450.1A, and also in the case of the WH site, a state agency agreement. Salinity is measured and the potential presence of hydrocarbons is screened at all sites using TOC as an indicator. In addition, pH and temperature are taken along with the physical attribute depth to water for each well at each sampling episode. The overall monitoring scheme performed at West Hackberry is governed by an agreement between DOE and the LDNR to report annual ground water monitoring data through this document. At the Weeks Island, Louisiana site, long-term ground water monitoring has been accepted as complete as part of the state approved decommissioning plan. BM ground water quality is conveyed annually to the RCT via copy of this report. Wells surrounding the operating brine storage and disposal pond system at BH monitor groundwater as part of permit required leak detection. The St. James terminal has undergone and completed a remediation to satisfy state criteria for some limited historic crude oil leakage there and because follow-on studies indicated no further action required; no permanent ground water monitoring well system is indicated for the leased facility. Available ground water salinity data collected for the past five years are presented graphically (Appendix E), for the historic site well nets and for the more recently installed Periphery Well
(PW) series. These data are then discussed within each site-specific section and any gaps in data for the graphs are noted. The Y-axis have been standardized with appropriate exceptions noted at either the 0–10 ppt or 0–100 ppt as the baseline dependent upon the historical range, providing easier comparisons among the monitoring stations.
Three of the storage sites have a long history of industrialized development primarily involving the mining of salt and
associated minerals that were used for various purposes and as feedstock. A 10 ppt cut-off for salinity is used in this report in making comparisons for assessing affected and unaffected waters. This is not a regulatory limit but rather a value, given the setting, which represents usable versus unusable water. At BM, however, because of its particular site specific and historic mining conditions, a 20 ppt cut-off is employed for evaluating the generalized ambient shallow ground water conditions there. 6.1 BAYOU CHOCTAW
The Plaquemine Aquifer, the main source of fresh water for the site and several surrounding municipalities, is located approximately 18 m (60 ft) below the surface and extends to a depth of 150 to 182 m (500-600 ft). The upper 18 m (60 ft) of sediment in the aquifer consists predominantly of Atchafalaya clay. The interface of freshwater and saline water occurs at a depth of 122 to 150 m (400-500 ft) below the surface on the dome. Ground water levels in the Plaquemine Aquifer are said to respond locally with the
Alligator at Big Hill. Photo by: Paul Bonin - Big Hill
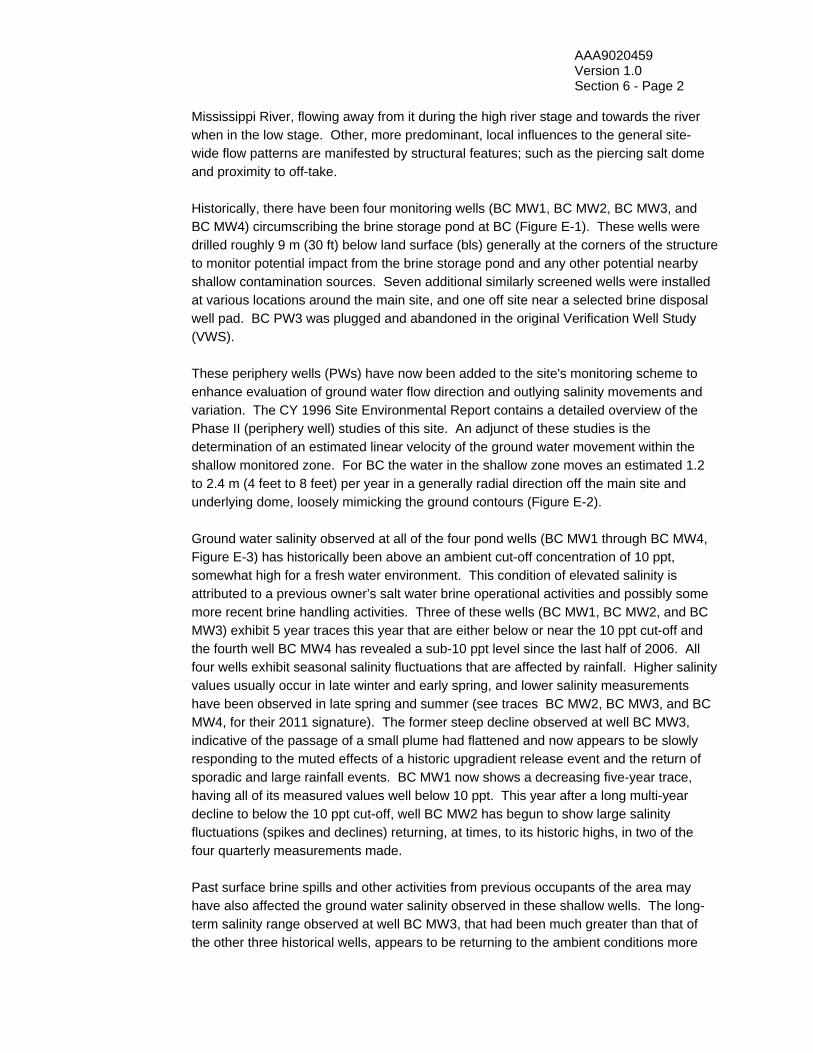
AAA9020459 Version 1.0 Section 6 - Page 2
Mississippi River, flowing away from it during the high river stage and towards the river when in the low stage. Other, more predominant, local influences to the general site-wide flow patterns are manifested by structural features; such as the piercing salt dome and proximity to off-take.
Historically, there have been four monitoring wells (BC MW1, BC MW2, BC MW3, and BC MW4) circumscribing the brine storage pond at BC (Figure E-1). These wells were drilled roughly 9 m (30 ft) below land surface (bls) generally at the corners of the structure to monitor potential impact from the brine storage pond and any other potential nearby shallow contamination sources. Seven additional similarly screened wells were installed at various locations around the main site, and one off site near a selected brine disposal well pad. BC PW3 was plugged and abandoned in the original Verification Well Study (VWS).
These periphery wells (PWs) have now been added to the site's monitoring scheme to enhance evaluation of ground water flow direction and outlying salinity movements and variation. The CY 1996 Site Environmental Report contains a detailed overview of the Phase II (periphery well) studies of this site. An adjunct of these studies is the determination of an estimated linear velocity of the ground water movement within the shallow monitored zone. For BC the water in the shallow zone moves an estimated 1.2 to 2.4 m (4 feet to 8 feet) per year in a generally radial direction off the main site and underlying dome, loosely mimicking the ground contours (Figure E-2). Ground water salinity observed at all of the four pond wells (BC MW1 through BC MW4, Figure E-3) has historically been above an ambient cut-off concentration of 10 ppt, somewhat high for a fresh water environment. This condition of elevated salinity is attributed to a previous owner’s salt water brine operational activities and possibly some more recent brine handling activities. Three of these wells (BC MW1, BC MW2, and BC MW3) exhibit 5 year traces this year that are either below or near the 10 ppt cut-off and the fourth well BC MW4 has revealed a sub-10 ppt level since the last half of 2006. All four wells exhibit seasonal salinity fluctuations that are affected by rainfall. Higher salinity values usually occur in late winter and early spring, and lower salinity measurements have been observed in late spring and summer (see traces BC MW2, BC MW3, and BC MW4, for their 2011 signature). The former steep decline observed at well BC MW3, indicative of the passage of a small plume had flattened and now appears to be slowly responding to the muted effects of a historic upgradient release event and the return of sporadic and large rainfall events. BC MW1 now shows a decreasing five-year trace, having all of its measured values well below 10 ppt. This year after a long multi-year decline to below the 10 ppt cut-off, well BC MW2 has begun to show large salinity fluctuations (spikes and declines) returning, at times, to its historic highs, in two of the four quarterly measurements made.
Past surface brine spills and other activities from previous occupants of the area may have also affected the ground water salinity observed in these shallow wells. The long-term salinity range observed at well BC MW3, that had been much greater than that of the other three historical wells, appears to be returning to the ambient conditions more
AAA9020459 Version 1.0 Section 6 - Page 3
reflective of background, as observed with wells BC MW1 and BC MW2, before this year. Well BC MW4 located down gradient of the site and south of the E-W canal has a historic somewhat elevated overall salinity concentration, but the recent long-term time-series trending reflected a strong downward trace suggestive of the passage of a small saltwater slug with three years evident now below the 10 ppt cut-off. This trace began to change late in 2010 and has continued with wild swings into this year resulting in an overall upward trending appearance. This year’s “wild swings” in salinity measurements has returned in all but two of the wells. Such swings have been observed in the past. Much of the variability exhibited with the earlier data may have resulted from over purging and inconsistently applied sampling techniques. However, use of low-flow sampling has aided the ground water testing by assuring more representative sampling. The return of the wide fluctuations may be a lag-time influenced response associated with the temporary break from prolonged drought to more normal rainfall conditions which began over a year ago. Ground water surface piezometric data of all the wells indicate that ground water movement is radial in all directions from the high point on the dome around Cavern 15 and to the north. A 1991 brine spill on the nearby low pressure pump pad north of the well BC MW3 appears to have passed, for the most part beyond both this well and the further down gradient well BC MW4.
Long-term salinity trends have been tracked which, when examined within the context of the radial ground water movement, assist in identifying possible areas of or sources of salt water contamination. This year’s keynote observation is the return of trending reversals with the five-year traces. Five of the ten main-site monitor wells reveal trending reversals this year presumably due to the large swings observed in the four quarterly measurements found in all but one of the wells. Even so, with such slow ground water movement being applied to a series of salinity values mostly below 10 ppt, slight fluctuations can often cause the five-year trends to change direction (flip-flop) with a single year’s data addition. With the large swings evident in most of the wells, we also saw a pattern or a discernable “signature” evident in many traces, especially the PW series wells, that may be indicative of an area to region wide response to breaking of the long running drought. A discernable signature response for this year occurred in all of the wells monitored and coincides with the beginning of such behavior noticed last year.
This year, well BC MW1, up gradient of the brine pond, maintained a pronounced decreasing five-year salinity trend below 10 ppt, ostensibly driven by the position of the “uptick” occurring in the 2006 timeframe. This well continues to freshen in 2011, despite the wild swings evident here. Well BC MW2, the intercept well immediately down gradient of the brine pond reveals a five year trace reversal this year to that of increasing salinity resulting from the wild swings in the four quarterly measurements made. This well shows the seasonal signature found in the well net, but to a more pronounced level. The spikes observed this year do not exceed historic values observed in the dataset from pre-low-flow sampling times but the swings and the trending combine to place this well on our site watch-list.

AAA9020459 Version 1.0 Section 6 - Page 4
With full implementation of the low-flow sampling methodology and with the early and more variable data no longer affecting the five-year trending, more realistic and reliable groundwater interpretations and trending of the data are now evident. Well BC MW1 situated hydraulically on the up gradient side of the brine pond and well BC MW2 located immediately down gradient hydraulically of this potential source (see Figure E-2) reveal fluctuating salinity levels sometimes in opposition for their positions, possibly due to this effect. Another potential source of subsurface contamination may be residuals from historical activity that occurred along the northwest corner of the pond. Periphery well BC PW2 has encountered this area of existing affected ground water and this year’s five-year trace continues to indicate a steady freshening trend from 60 ppt to 40 ppt. This area is up gradient of and therefore not associated with the current brine pond operations.
Although it has in the past captured the most saline ground water on the site, BC MW3 is now exhibiting an essentially stable and decreasing trend. The slightly increasing five-year trend varying around the 10 ppt cut-off which was nudging below that level to ambient in 2005, is now revealing a continuing mild downswing that began after a peak in mid-2007and on into 2011. Former impacts from an historical 1991 brine piping leak appear to have passed this well now in a downgradient (southwesterly) direction.
Three of the seven PW well series wells indicate decreasing five-year salinity trends. Well BC PW7, reveals a continued upward trace since last year’s reversal due to the history of low values culminating in last year’s signature spikes that also persisted into 2011. In both the BC PW5 and BC PW6 locations (and plots) the current five-year trace is influenced by the omission of historical higher values found with the earlier annual samplings and also by the quarterly sampling regime now in-place. At the well location BC PW5 especially, this year’s five-year window has reversed from slight up to slightly down presumably potentially due to the loss of some earlier historic peaks in the dataset; the 2007 data however reveals a freshening trend for that year, 2008 and 2009, basically producing a flat trace within minor fluctuations in a cyclical fashion perhaps associated with seasonal changes in rainfall and lagtime. The salinity levels currently fluctuate at or below 30 ppt and this being the only well with flat 2011 data combined with a dramatic loss in water levels; we shall continue to closely watch this well for changes. All of these monitored locations appear to fluctuate regularly over the entire period of record, but generally with decreasing trend lines and especially with decreasing variability for each well despite the occasional trend reversals noted in the shorter-term five-year windows presented. This scenario of pronounced seasonal fluctuations is especially evident in the year’s quarterly measurements scheme. Future ground water data, including that from the periphery wells added from the Phase II verification studies and ongoing inspections of the brine pond and site piping, will assist in identifying any potential contamination originating from SPR activities. The shallow ground water monitoring well net for this site is adequately placed and sampled to serve as a complete site-wide detection monitoring system.
6.2 BIG HILL The three major subsurface hydrogeological formations in the BH site vicinity are the

AAA9020459 Version 1.0 Section 6 - Page 5
Chicot and Evangeline Aquifers and the Burkeville Aquitard. The major source of fresh water is the Chicot Aquifer, which is compressed from uplift and piercement over the BH salt dome. Fresh water in the upper Chicot Aquifer over the dome is limited from near the surface to a depth of -30 m (-98 ft) below mean sea level. The town of Winnie, situated off the dome and to the west, uses fresh water from the upper Chicot Aquifer. Beaumont and nearby Port Arthur both draw fresh water from the lower Chicot Aquifer. Sampling of six monitoring wells (wells BH MW1 to BH MW6) around the brine disposal pond system (Figure E-4) began in 1987 and was converted to the low-flow method in May 1995. Ground water contours from these and all of the Big Hill site monitor wells developed on spring quarter data are shown on Figure E-5. The interconnected brine pond system is composed of three contiguous PVC-lined above grade ponds (anhydrite settlement, oil recovery and brine ponds). All three have an under drain system contained within a surrounding slurry wall system keyed to an underlying clay bed. Commencing in August 2006, a renovation project to replace the liner material in the oil recovery and brine ponds in the series, was implemented. The project was completed there and the three-pond system was re-commissioned in August 2007.
Salinity data collected from the six permit required wells surrounding the ponds have for the past five years indicated complete consistency and absence of effects below detection limits until 2001 for well BH MW2, which is on the up-gradient side of the ponds (Figure E-6). All values below the detection limit are specified as one-half the detection limit for statistical calculations. No ground water effects associated with the pond operation are evident since monitoring was begun in 1987. The salinity increase in BH MW2, up-gradient (northwest of) the ponds, is attributed to a previous release from buried piping. The salinity increase in BH MW2, which is on the up-gradient (northwest of) the ponds, is attributed to a previous release from buried pipe, that reached a peak near the end of calendar year 2007 to 2008 and declined. The freshening trend continued until Hurricane Ike forced a huge storm surge of saltwater from the Gulf that inundated the site. Several of the wells BH MW2, BH MW5, and BH PW4, were impacted by the saltwater pushed onto the site overtopping several well casings temporarily and allowing saltwater to infiltrate through soils and breather holes in their caps. These three wells have shown remarkable recoveries during the time since Ike with well BH PW4 returning to BDL. The two pond-service wells are showing continued downward trending as the salt is slowly purged reflecting the effort to clear the sandpack materials surrounding the screen zones with the routine low-flow sampling methodology.
Figure E-5 presents the contours of data obtained on a date in the fall quarter for all the site wells, as representative of 2011. The gradients and flow direction remain very similar to all of the previous contouring staggered throughout the calendar year in order to account for any seasonality. In the vicinity of the brine storage pond (wells MW1 through MW6) the flow is southeasterly. The overall basic shallow flow regime mimics the ground surface and appears to be moving radially off the underlying salt dome structure. This contouring appearance cannot be corroborated due to lack of control points off the site in

AAA9020459 Version 1.0 Section 6 - Page 6
a northwesterly direction. As with our other sites, it is suspected that regional flow regimes are locally modified by the underlying piercements. Well BH PW5 located at the most up-gradient point of the site shows only a single spurious 1 ppt measurement and well BH PW4 near the southwest corner, below the closed mud pits, are the only two periphery wells showing any historical trace of measurable salinity on the site removed from brine pond monitoring service. At BH PW4, the trace had been basically characterized as flat and salt free except for a 1 ppt measurement made in 2005, a value of 1.3 ppt was measured in 2007 and a 17 ppt spike at this very low (site elevation) position, when the well was inundated with salt containing Hurricane Ike storm surge when the storm came ashore September 13, 2008. This well is only regularly sampled once per quarter by routine, even so, it is observed to have returned to its pre-Ike BDL by the close of 2009. The well BH PW2 was plugged and abandoned as part of the original VWS Study in the 1995/1996 timeframe and therefore is not depicted as an active well on the site well locator map.
6.3 BRYAN MOUND
Site monitoring wells screened in two water bearing zones, 6 and 15 m (20 and 50 ft) bls, indicate that no shallow fresh water exists in the uppermost inter-connected aquifer over the BM salt dome structure. This generalization was confirmed by the additional salinity data from VWS in 1995-96. However, the Chicot and Evangeline Aquifers are fresh to slightly saline in the Bryan Mound area, and fresh water for Brazoria County is obtained from the upper portions of the Chicot up gradient of the BM salt dome.
Fifteen monitoring wells were drilled at BM in four phases between 1981 and 1990 (Figure E-7). Wells BM BP1S, BM BP2S, and BM PZ2S have been removed from monitoring service due to casing damage. Five additional shallow well locations and one additional deep well were installed in 1996 as part of the VWS, and all of these have been incorporated into the site's monitor well net. All five-year traces this year reflect only the low-flow sampling method which produces less data variability and which helps assure more consistent and representative sampling of the shallow aquifers across the SPR. The resulting trending graphs now more accurately reflect the Bryan Mound site’s ground water conditions. Only one of the 12 total shallow zone wells around the site reveals an increasing trend of saltier conditions for the current 5 –year windows with three of the remaining eleven freshening wells having a basic flat trace. One of the six total deep wells reveals a slightly salty to saltier trending this year. All remaining deep zone wells have reversed their five-year trends from flat to that of freshening. Well BM MW1D although located down gradient of a pre-DOE source had a series of decidedly downward 5-year traces probably due to the freshening data points from 2006 onward and the loss of lows back in 2003. The trend reversal noted this year was aided with freshening conditions continuing from 2007, and on into 2010 despite large swings in the dataset. The five-year trending is only slightly upward this year through a series of extremely pronounced fluctuations in the dataset.

AAA9020459 Version 1.0 Section 6 - Page 7
The four quarterly 2011 values fluctuate less and around a level of 165 ppt which would produce a flat to slightly freshening trace for the single year.
Salinity trends are evident in both salt-affected and unaffected areas. Elevated ground water salinity measurements in both the deep and shallow zones near the former brine pond and pump pad area have, however, remained relatively constant over time.
After an overall step change in salinity evident in both the paired wells back in 1995, BM MW1S and BM MW1D, a decidedly consistent and similar freshening (downward) trend has been observed in both zones until the 2005 five-year trace where the deep zone well BM MW1D began trending upwards briefly, while the shallow zone well screened above it, BM MW1S, continued its consistent freshening. Both wells are currently showing large swings in their 5-year windows but the freshening trend remains for the shallow zone well and a slightly upward trace has returned for the deeper set well of the well pair. This may be the result of a slug of salty water slowly passing the position in both the wells. Water level measurements indicate that the two zones are hydraulically separate or very poorly connected. Salinity measurements (>20 ppt) observed in the shallow zone near the SOC (BM MW5) and the historic anhydrite disposal area and slightly decreasing despite many big salinity swings at the beginning of and near the end of the current five-year trace. These swings and trending are not indicative of any noteworthy releases (slugs) passing and may result from some larger fluctuations observed in the early [older] portions of the series window. A variety of salinity swings are found in this year’s traces of the well pair BM MW2S and BM MW2D. The flattening of the trace occurring in the shallow well (MW2S) early in 2007 has overwhelmed the spurious spike of 2009 and has since that time flattened. The trace in the deep well complement here has trended downward in the same timeframe despite notable swings in the current 5-year dataset. Salinity observed in the unaffected (<20 ppt) deep and shallow well pair at the northwest corner of the site (BM MW4S and BM MW4D) have reversed their upward trends now due to the freshening values observed since 2008. All of the measurements in both the shallow and deep well are below 10 ppt; with the shallow well showing big swings but with a downward trend due to the large drop in salinity commencing in 2010. The underlying deep zone well now is freshening but more slowly and at a lower overall salinity, indicative of differing waters, despite water level measurements not showing the pronounced hydraulic separation (water level difference) found with all the other deep and shallow well pairs on the site. The head difference at this well pair is reversed this year, indicative perhaps of the effects of the prolonged drought which apparently is dewatering the shallower zone to the area surface waters.
BM MW3 now shows a slightly decreasing to flat salinity trend over this five-year period due to stabilized salinity values all below the 10 ppt cut-off. Site ground water movement in the shallow, 6 m (20 ft) bls, zone is found to be flowing radially (in all directions) off the dome with a ground water divide indicated this year along
AAA9020459 Version 1.0 Section 6 - Page 8
a line NE to SW (see Figure E-8). The flow direction in the deeper zone results from a NW-SE trending recharge zone causing flow to move in a northeasterly manner over half the site and in a southwesterly manner for the remaining half (see Figure E-9) again responding to the topographic expression of the underlying piercement. The water level data for the fall quarter of 2011 were contoured using the newly re-leveled measuring points from 2005 and again this year the data do not produce any dramatic changes in flow direction interpretation but reveal gradients that appear to have steepened on portions of the site near the edges of the dome. In proximity to Mud Lake it is speculated that the ground water may be hydraulically recharging both Blue Lake and Mud Lake during the low water conditions brought on by drought. This would be especially evident with Blue Lake as it remains low from drought effects and has little or no tidal influx during these low water times. The water level contouring of the deeper zone wells is showing an apparent response to some localized recharge perhaps, in the center of the site that has resulted in a long-term overall flattening of the deep zone gradients and which also reveals an upward potential at the wells BM PW2D and BM MW4D. This results primarily from the extreme lowering (dewatering) of the shallow zone in proximity to these locations due to the long term regional drought conditions. Both of these aquifers exhibit a very low average linear velocity ranging from an estimated 1.5 m/yr (5 ft/yr) in the shallow zone to 3 m/yr (10 ft/yr) in the deeper zone. This slow movement is due to the combined effects of the clay content of the water bearing strata and very low hydraulic gradients which range from 0.0006 m/m to 0.001 m/m (0.002 ft/ft to 0.004 ft/ft). This low average velocity characteristic reduces the risk of contaminating any fresh and potable water bearing zones known to exist off the flanks of the subsurface dome.
When contoured, two major areas emerge where ground water salinity exceeds ambient conditions (>20 ppt) for the Bryan Mound site. The first area stretches from the former brine pond eastward to the brine pump pads and to the vicinity of an older brine pond demolished by DOE in 1989, and then southward towards the center of the site and below the maintenance building already discussed. Operations pre-dating DOE ownership included brine retention in two separate unlined elongated abandoned ponds reclaimed (filled) by DOE in this same area. The second and considerably smaller area lies southeast of the security operations center (SOC) adjacent to a closed anhydrite and drilling muds confinement area.
Elevated salinity observed at shallow monitor wells since their installation, BM PZ1S, BM MW1S, and former BM BP1S, has been speculated to be associated with old SPR brine storage pond. The large brine pond with a Hypalon® (chlorosulfonated polyethylene) membrane was originally constructed in 1978, and subsequently enlarged with installation of a new Hypalon® liner and a concrete weight coat in 1982. The BM brine pond was removed from service in September 1998 and closed in early spring of 1999. Because of the very slow ground water movement rates and the estimated long lag-time needed for vertical migration, the salinity measurements observed in the pond area and

AAA9020459 Version 1.0 Section 6 - Page 9
especially those to the northeast and east could be the result of seepage from before 1982 renovations of the pond, or from operations occurring before the SPR. Salinity of deep complements to wells BM PZ1S and former BM BP1S (BM PZ1D and BM BP1D) are much lower and considered ambient (<20 ppt) for the site. They indicate no contamination of the deep zone around the immediate vicinity of the former pond and no apparent direct communication with the shallow zone in this area. The shallow zone well BM PZ1S, the most directly down gradient well from the former brine pond, now reveals a slight decreasing trend. No significant overall shift is noted as the 2008 through 2011 data show a freshening tendency. The shallow zone well BM MW1S also maintains a steadily freshening 5-year trend even with large swings in the dataset evident in 2007 and continuing into 2011. Well BM BP1D, located south of the former SPR brine pond reverses a long term to trend slowly downward this year, but overall remaining below 20 ppt. This is one of the several similar downward trending reversals found across the site with this year’s data.
Data from the VWS completed in the summer of 1996 indicate that the primary location of shallow zone salinity impact is in the area of well BM MW1S, which is mirrored by elevated salinity in the underlying deep zone around BM MW1D. This is down gradient of the location of former below grade unlined brine retention ponds from operations that preceded SPR ownership. The high salinity of the deep well may also indicate some limited hydraulic communication of the two ground water zones occurring in or just up gradient of their location. Water levels indicate continued hydraulic separation but with a greatly reduced head difference of only 2.6 feet versus last year’s 7 feet at this well pair. This is a significant observation in that it reinforces the idea that the prolonged drought is actually dewatering the shallow zone over the dome especially noticeable at the edges or connections with depleted area surface water bodies. However, the wells both reveal steady freshening indicative of a slow moving slug passing and dispersing.
Since, the former SPR brine pond was closed in 1999, the shallow ground water had moved about 50 feet laterally per year. Given the anticipated long lag-time for vertical migration and then the lateral distance required to be covered to the nearest wells, it is expected to be considerable time for post-closure salinity changes to become evident in the annual monitoring.
A suspect historical brine contamination source south of the site’s maintenance building may be producing another area of elevated salinity. An active source has neither been identified nor associated with any known historical SPR operations or incidents, and it therefore most likely predates SPR activity. Salinity measurements exceeding ambient levels (> 20 ppt) have been observed historically in both zones at wells BM MW2S and BM MW2D, with the shallow well BM MW2S fluctuating at or below 10 ppt from 2003 through 2008 and then experiencing a big swing in 2009 (spike and return) with subsequent data moderating to present. This area is masked when contoured, falling under the general “blanket” of the effects associated with the pre-SPR brining operations located in the north central portion of the site already described. This area may therefore be considered part of that historic saltwater release; being affected more by diffusion and dispersion rather than direct flow. The head difference here is downward between the

AAA9020459 Version 1.0 Section 6 - Page 10
two wells and the underlying zone is more heavily impacted (trending from 70 to 60 ppt) in this year’s five year trace.
Salt water effects are not evident at the northwest corner of the site. Shallow zone monitor wells BM MW3S and BM MW4S near the southwest corner and west of the former brine pond, respectively, have historically remained relatively stable in the unaffected 5 to 10 ppt range, with the exception of the single outlier of 2006 from well BM MW3S. The ground water salinity at the northwest corner of the site is consistent or better than the salinity observed in Blue Lake, the adjoining surface water feature. The well pair BM MW4S and BM MW4D is also down to side gradient, respectively, of an onsite anhydrite disposal area and their data do not reveal any impacts.
6.4 SAINT JAMES
The Chicot Aquifer is the principal regional aquifer at St. James. The upper strata of the Chicot Aquifer are in direct hydrologic contact with the Mississippi River. Much of the ground water contained in this aquifer is slightly brackish. In the St. James area only the uppermost units contain fresh water.
6.5 WEST HACKBERRY
The Chicot Aquifer, which occurs closest to the surface in the Hackberry area, contains predominantly fresh water with salinity increasing with depth and with proximity to the Gulf of Mexico. The majority of the ground water pumping from the Chicot Aquifer takes place in the Lake Charles area. Pumping is so great that a cone of depression has been created which has reversed the regional southerly flow direction towards the north in the vicinity of the coast below Lake Charles. The fresh/saline water interface is approximately 213 m (700 ft) bls off the sides of the West Hackberry dome and more shallow directly over the diapir where our site is situated. Possibly a result of the piercement by the diapir, laterally limited permeable waterbearing soil found affected and monitored at the West Hackberry site is much nearer the ground surface, with a shallow sandy zone at roughly 6 m (20 ft) bls and a deeper more silty zone at roughly 15 m (50 ft) bls. Details provided by the VWS in 1996 indicate that the two zones contrast sharply in permeability, and as a result, their estimated linear velocity measurements are quite different. The range of linear velocity estimated for the shallow zone is from 50 to 200 feet of movement per year, which results from both a wide permeability range and varying gradients across the site. The deep zone exhibits a generalized velocity estimated to be only 7.5 feet per year (ft/yr), which is largely due to the more silty and clayey nature of the sands conveying these waters and the lower gradients evident within the site’s limited well net.
Situated directly atop the salt dome and given the long industrialized history of the site and the immediate area, a 10 ppt cut-off for salinity is used in comparisons for determining affected and unaffected waters as historical ambient conditions have been found highly variable across the site. The 1991 Contamination Assessment Report and Remedial Alternatives Analysis identified the former brine pond as a source of ground water contamination. The decommissioned brine pond was one of five adjoining ponds comprising a pond system

AAA9020459 Version 1.0 Section 6 - Page 11
and solids management system that handled brine and anhydrite solids pumped from the storage caverns. Construction activity implemented per the state approved brine pond-decommissioning plan was concluded in November 1999. Eleven monitoring wells and 15 former recovery wells (Figure E-11) have been installed on the WH site in five phases. All were historically used to either monitor or control brine contamination movement beneath the brine pond system. Salinity data gathered over the past five years at all wells is depicted in Figure E-14. Four of the seven wells originally installed for VWS were retained for additional water level measurement around the periphery of the main site, bringing the site total up to 30 in the late fall 2006 three wells which were not part of any outside monitoring agreement (WH RW1S, WH RW1D, and WH RW2D), were plugged and abandoned due to cap maintenance construction activity for a closed anhydrite pond, bringing the final site total wells down to 27. Salinity data are depicted in the five-year trending graphs for all of these wells; however, certain wells are tested for salinity only once per year per our 2002 monitoring proposal for resumption of site-wide monitoring as approved by LDNR in early 2004.
WH personnel began using the low flow technique for sampling all non-pumping wells in December 1995. Water level measurements from both zones for the fall quarter of 2011 have been reduced to elevations, contoured, and are presented as Figures E-12 and E-13, Shallow Zone and Deep Zone, respectively. The contour map of the water levels in the underlying deep zone reveals a rather flat pressure derived gradient within the semi-confined water bearing zone. The low permeability of the deeper zone routinely produced very pronounced draw down levels at the former pumping wells, which in turn produced an unusually deep and pronounced cone of depression as an artifact of the contouring. The pressure gradient is very flat (low) and continues to maintain very slow travel times and indecisive travel paths with no clear direction beneath the site on this portion of the dome. The general appearance is that of a confined to semi-confined water bearing zone, receiving some recharge potential in the vicinity of wells WH P1D, WH P2D, and especially WH P4D, and with a potentiometric “sink” suggested with the measurements determined within the limited area bounded by the wells WH RW3D, WH RW4D, and WH MW1D. Over the years the slug of saltwater seepage from the former brine pond, being removed from any source, has slowly changed its shape, growing somewhat smaller, and is drifting slowly towards the east. Of note this year, all the plume affected wells in the shallow monitoring zone: WH P3S, WH P4S, and WH P12S, all reveal downward (freshening) 5-year trending. The implication is that fresher recharge is slowly aiding with the diffusion and movement of the saltwater slug. The center of the slug is now found within a 40 ppt contour circumscribing the two wells: WH P3S and WH P4S, with 2011 average annual salinity values of 42.6 ppt and 46.0 ppt, respectively. The shape of the slug is oriented essentially N-S, which has been greatly influenced by the salinity reduction to BDL at the WH RW2S well location, and then also by the freshening conditions occurring at the well WH P3S. This is a very slow attenuation process primarily driven by dilution and diffusion. The regional drought has had an influence,

AAA9020459 Version 1.0 Section 6 - Page 12
especially with the shallow zone, although the basic flow regimes, shallow and deep, remain fairly constant over time. Well WH P4S is located on the southeast corner of the former brine pond within the main portion of the saltwater slug and this year’s five-year trace moderating (becoming flatter and lower) continuing to show a downward trend of freshening. Overall, since 2001 the salinity levels have revealed a long history of big swings and resulting trend reversals. The big salinity swings now appear to be moderating and a more steady-state 5-year trace reflective of gradual dispersion and diffusion of the stratified saltwater is now evident. The well WH P3S, in the center of the historic saltwater slug, is also beginning to show moderation in terms of the wide historical fluctuations and also in terms of producing a span of freshening five-year trends commencing in 2006. This well responded rapidly to pumping shut-in with the current series of traces reflecting consistent freshening and indicative of a more mature steady-state plug of saltwater that is slowly undergoing general dispersal driven by gradual down gradient ground water movement and as aided by diffusion. Wide salinity swings were also noted historically with both of the wells WH P2S and WH P3S as these were the only two where the high volume submersible pumps were used near the end of the recovery program.
Until sporadic spikes of elevated salinity were experienced with pond closure construction early in 1999, a slight decreasing salinity trend had been observed at wells WH P1S, WH P5S, and WH RW1S along the west side of the former brine pond. Each of the wells exhibited increased salinity due to closure construction that began to subside in 2000 and even more so since recovery cessation in 2001. In fact, former pumping wells WH P1S and WH P5S both began exhibiting salinity below the 10 ppt cut-off within 2002 with nearby well WH RW1S joining them in that range for 2004 and remaining so through 2005 until it was plugged and abandoned in November 2006 as part of the closed south anhydrite pond cap maintenance project. Well WH P13S remains aligned with this group by maintaining now flat series of five-year traces of BDL values and with a longer history of values below 10 ppt. Well WH RW2S also has joined the BDL group, presumably reflecting a long-term (lag time) favorable response to the same 2006 cap maintenance activity.
Many shallow wells exhibited an obvious salinity drop upon cessation of active recovery, indicative of fresher recharge and wells no longer pulling salty water through the formation to their screens. Relatively few (most notably hard pumped well WH P3S) responded with an abrupt salinity spike at shut-in. These wells were formerly pulling a fresher water mix across their screened length when actively pumping. With the return of the pre-recovery ground water movement to the east in-place it is observed that wells situated on the west side of the former pond have freshened to ambient as they capture fresher, uncontaminated ground water from the western recharge area. This is an affirmation that the continuing source of brine contamination was addressed with the pond closure actions completed in the winter of 1999. This improving salinity response will undoubtedly be delayed to the wells on the east and situated directly in the core of
AAA9020459 Version 1.0 Section 6 - Page 13
the slug as the overlying salt impregnated soils slowly respond to the now diminished percolation and to the slow post-closure recharge. Certainly this seems the case now with well WH P3S and well WH P4S appears to have followed. Ground water salinity conditions over most of the site have continued to improve and have settled into long-term gradual freshening trends. As the five-year window for each well has progressed beyond the former recovery operations, the graphs reveal a more “quiet” shallow zone monitoring regime similar to the response which began occuring shortly after the pond system was shut-in in early 1999 and then again when the recovery pumping ended in the spring of 2001. Shallow monitoring wells WH P8, WH P9, and WH P11 at caverns 8, 9, and 11, respectively, are located away from the former brine pond and intercept unaffected waters that are near ambient levels, comparable to up-gradient well WH P6S. Two of these wells (WH P8 and WH P11) have detected minor localized but historic impacts from former firewater line leakage and have since returned to ambient unaffected levels over the present five-year history. These two wells are tested only annually now for salt content per the approved monitoring plan.
Shallow zone monitoring wells WH P6S, WH P12S, and WH P13S, and deep zone monitoring wells WH P2D, WH P6D, WH P12D, WH P13D, and WH MW1D are nearer the brine pond than wells at the caverns and along the site’s perimeter and with the exception of well WH P12S, also intercept ambient ground water. Well WH P12S is the only down gradient long-term [non-recovery] monitoring well that is affected by the shallow zone brine plume extending eastward from the former brine pond. Its salinity remains elevated (17.65 ppt annual average based on the 4 measurements in 2011) which has remained generally consistent since sampling began in 1992 (range 13 to 39 ppt, Std. D = 6.5 ppt, avg. = 26.05ppt, n = 77). The overall trend since 1992 to present is slightly downward, however, the general trace from 2002 to 2006 indicated a gradual rise in salinity for just that period. This year we see the salinity continues to freshen and note that the 2011 annual average of 17.65 ppt remains below the historic average of 26.6 ppt. This continuing regime occurring so distant from the source and at the leading edge of the recognized brine plume (300 or more feet) coupled with the corresponding freshening found in well WH P3S located further up gradient and closer to the former pond; may be indicative of gradual long-term dissipation and dispersal effects on this historic saltwater slug. This well’s location may be situated at the very edge of the diffusion “halo” of the saltwater recognized effects and, which now, with no pumping derived gradient, is undergoing natural dispersion and diffusion aided attenuation with time. Well WH P12D, is the deep well complement to WH P12S, and has a long history of measurements below the 10 ppt cut-off. The early history of the well’s traces included a long period of values below BDL (1 ppt); then a fairly rapid rise occurring in the years 2003 to 2004, presumably a lag-time response to the pond closure construction, was observed to peak around 7 ppt. The salinity then abruptly freshened throughout 2004 and has since presented a slow but steady rising salinity; from around 3 ppt to the present annual average for 2011 of 7 ppt. The climbing trend remains constant enough to warrant more closely watching the measurements and to also trying to deduce a reasonable explanation for the temporal influences at play. The impacts known for the

AAA9020459 Version 1.0 Section 6 - Page 14
deep zone wells is a smaller more and limited area found to the south of and to the west nearer well WH P4D, some 300 feet away. The head difference remains large (6.6 feet) between the two zones here and is in a downward direction based on the 12S and 12D water levels. The overlying shallow zone contains sufficiently high levels of salinity now, and also in the past, that cannot be ruled out as a potential source for the deep well’s long-term trending. As such, the long-term freshening observed with the shallower WH P12S well could potentially a deeper well response. As defined in the final approved closure plan, the synthetic liner held in-place beneath the concrete weight-coat of the former brine pond was required to be pierced to preclude any future concerns with long-term hydraulics. As a result, the salt-affected soils beneath this liner, presumably, shall continue to respond naturally to rainfall conditions and events.
End of Section
Black Bellied Whistling Ducks. Photo by: Lynette McCoy-Largent – Bryan Mound
AAA9020459 Version 1.0 Section 7 - Page 1
7. QUALITY ASSURANCE
The SPR sites undergo periodic evaluation throughout the year in the form of annual internal audits as well as inspections by outside federal and state agencies. The structured laboratory quality assurance program has continued through the systematic application of acceptable accuracy and precision criteria at SPR laboratories. Compliance with this and other environmental program requirements was reviewed and evaluated at each site by means of DM's Organizational Assessments and program inspections at selected sites by state and federal environmental agencies. Results from the environmental program assessments are addressed in Section 2 of this report.
7.1 FIELD QUALITY CONTROL
All field environmental monitoring and surveillance activities are performed in accordance with standard procedures, which are maintained in DM’s Laboratory Programs and Procedures Manual document # MSI7000.133, the EMP and in individual sampling and analytical work instructions. These procedures include maintenance of chain-of-custody, collection of quality control (QC) samples, and field documentation.
7.2 DATA MANAGEMENT
SPR and contractor laboratories generate SPR data. All data generated by SPR laboratories are recorded and maintained in bound, numbered, and signed laboratory notebooks. Contractor laboratory data and accompanying QC data are received by the site laboratory or environmental department and retained on site as part of the original data file.
Water quality data are added to the SPR ES&H Data Management System for retention, manipulation, and interpretation. The data are compiled and appear in various reports such as this SER, in support of assessments of the SPR, evaluations of explained events, and development of appropriate responses.
7.3 PERFORMANCE EVALUATION SAMPLES
The Louisiana and Texas environmental agencies have mandated that any commercial laboratory submitting environmental results from samples to the state must be accredited by the state. The SPR laboratories by definition are not "commercial" and as a result are not required to participate. However, the laboratories analyze Performance Evaluation (PE) samples twice per calendar year and these data are provided to the appropriate state agency. Through this program, the Louisiana and Texas environmental agencies ensure verifiable and consistent data generation by requiring the environmental analytical laboratories of permitted dischargers to perform analysis on blind samples for each of the permit parameters. The laboratories have successfully completed their 2011 round of blind samples. Resultant data were provided to the appropriate state agencies, via the PE sample contractor/provider on a standard report form. The results of this study indicate that all SPR laboratories performed acceptably and are approved for continued DMR analyses.
AAA9020459 Version 1.0 Section 7 - Page 2
7.4 SPR LABORATORY ACCURACY AND PRECISION PROGRAM
The SPR laboratory quality assurance program is based on the U.S. EPA Handbook for Analytical Quality Control in Water and Wastewater Laboratories. This program focuses on the use of solvent or standard and method blanks, check standards, and for instrumental methods, final calibration blanks and final calibration verification standards with each analytical batch to verify quality control. Additionally, replicate and spiked samples are analyzed at a 10 percent frequency to determine precision and accuracy, respectively.
Analytical methodology is based on the procedures listed in Table 7-1. Sufficient quality assurance analyses were performed in 2011 to verify the continuing high quality of SPR laboratory data.
7.5 CONTROL OF SUBCONTRACTOR LABORATORY QUALITY ASSURANCE
The M&O Contractor subcontracts some of the required analytical work. The Laboratories Programs and Procedures Manual contains mandatory guidelines by which such contracts must be prepared. In addition, the respective laboratory staff and M&O Contractor Quality Assurance, Operations and Maintenance, and Environmental staff review laboratory procurement documents. Subcontractor laboratory service vendors are selected from an approved vendor’s list maintained by the M&O Contractor Quality Assurance organization. The successful bidder must be on the approved vendor’s list prior to the start of the laboratory contract. Vendors on the approved list are periodically reassessed by the M&O Contractor Quality Assurance and Operations and Maintenance organizations for adequacy of their analytical and quality assurance program.

AAA9020459 Version 1.0 Section 7 - Page 3
Table 7-1. SPR Wastewater Analytical Methodology
Parameter Method Source* Description Biochemical Oxygen Demand 5210(B)
405.1 APHA EPA-1
5 Day, 20 oC 5 Day, 20 oC
Chemical Oxygen Demand D1252-88(B) 410.4 5220(D)
ASTM EPA-1 APHA
Micro Spectrophotometric Proc. Colorimetric, Manual Closed Reflux, Colorimetric
Fecal Coliform Part III-C-2 9222(D)
EPA-2 APHA
Direct Membrane Filter Method Membrane Filter Procedure
Residual Chlorine 4500-C1(G) 330.5 8021
APHA EPA-1 Hach
DPD Colorimetric Spectrophotometric, DPD DPD Method
Oil & Grease (Total, Recoverable)
413.1 EPA-1 Gravimetric, Separatory Funnel Extraction
Oil & Grease (Partition, Gravimetric)
5520-(B) APHA Gravimetric, Separatory Funnel Extraction
Total Organic Carbon 415.1 D4839-88 5310(C) D2579(A) 5310(B)
EPA-1 ASTM APHA ASTM APHA
Combustion or Oxidation Persulfate – UV Oxidation, IR Persulfate – UV Oxidation, IR Combustion – IR Combustion - IR
Dissolved Oxygen D888-87(D) 360.1 360.2 4500-O(C) 4500-O(G)
ASTM EPA-1 EPA-1 APHA APHA
Membrane Electrode Membrane Electrode Winkler Method with Azide Mod. Winkler Method with Azide Mod. Membrane Electrode
Hydrogen Ion conc. (pH)
D1293-84(A&B) 150.1 4500-H+(B)
ASTM EPA-1 APHA
Electrometric Electrometric Electrometric
Total Dissolved Solids (Residual, Filterable)
160.1 2540(C)
EPA-1 APHA
Gravimetric, Dried at 180oC Gravimetric, Dried at 180oC
Total Suspended Solids (Residual, Non-Filterable)
160.2 2540(D)
EPA-1 APHA
Gravimetric, Dried at 103-105oC Gravimetric, Dried at 103-105oC
Salinity D4542-85 (Sect. 7) 2520(B) & 2510 210B
ASTM APHA APHA (16th Ed.)
Refractometric Electrical Conductivity Hydrometric
Biomonitoring 1006.0 1007.0
EPA-3 EPA-3
Menidia beryllina 7 day survival Mysidopsis bahia 7 day survival
EPA-1 = U.S. Environmental Protection Agency, Methods for Chemical Analysis of Water and Wastes, Document No. EPA - 600/4-79-020.
APHA = American Public Health Association, et al., Standard Methods for the Examination of Water and Wastewater.
EPA-2 = U.S. EPA, Microbiological Methods for Monitoring the Environment: Water and Wastes, Document No. EPA-600/8-78-017.
ASTM = American Society for Testing and Materials, Annual Book of Standards, Section 11 - Water, Volumes 11.01 and 11.02.
Hach = Hach Company, Hach Water Analysis Handbook.
EPA-3 = U.S. EPA, Short Term Methods for Estimating the Chronic Toxicity of Effluents and Receiving Waters to Marine and Estuarine Organisms, Document No. EPA/600/4-87/028.
End of Section
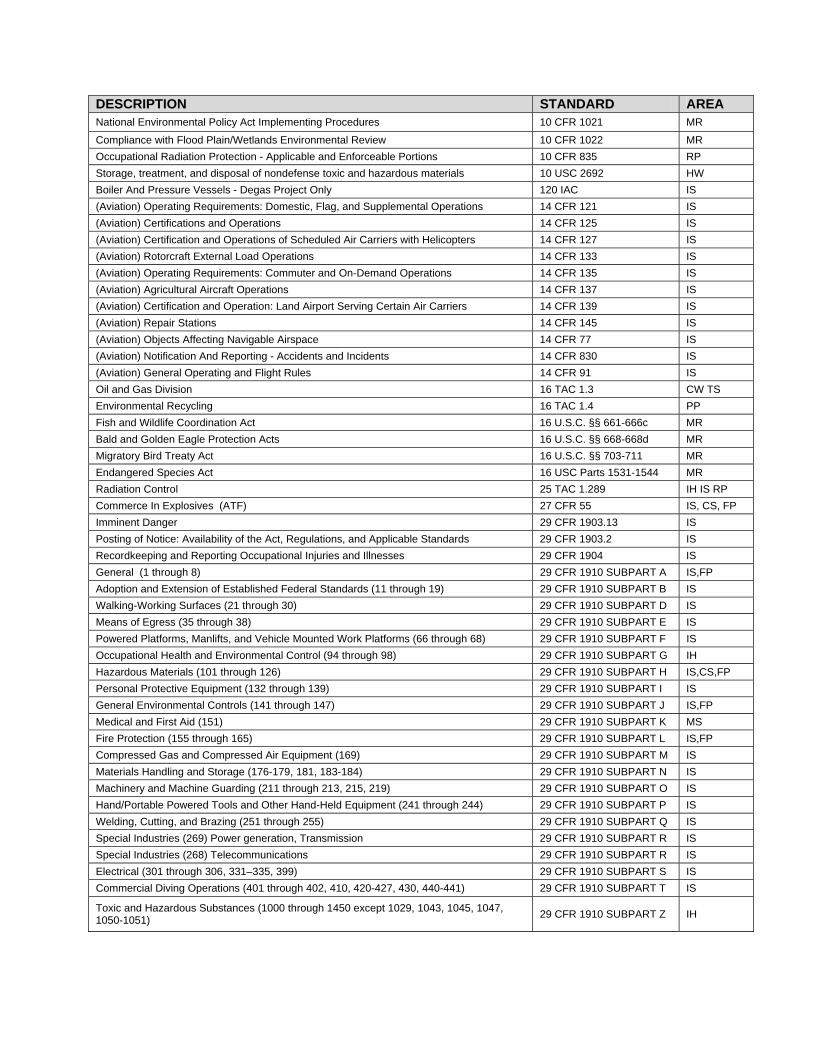
DESCRIPTION STANDARD AREA National Environmental Policy Act Implementing Procedures 10 CFR 1021 MR
Compliance with Flood Plain/Wetlands Environmental Review 10 CFR 1022 MR
Occupational Radiation Protection - Applicable and Enforceable Portions 10 CFR 835 RP
Storage, treatment, and disposal of nondefense toxic and hazardous materials 10 USC 2692 HW
Boiler And Pressure Vessels - Degas Project Only 120 IAC IS
(Aviation) Operating Requirements: Domestic, Flag, and Supplemental Operations 14 CFR 121 IS
(Aviation) Certifications and Operations 14 CFR 125 IS
(Aviation) Certification and Operations of Scheduled Air Carriers with Helicopters 14 CFR 127 IS
(Aviation) Rotorcraft External Load Operations 14 CFR 133 IS
(Aviation) Operating Requirements: Commuter and On-Demand Operations 14 CFR 135 IS
(Aviation) Agricultural Aircraft Operations 14 CFR 137 IS
(Aviation) Certification and Operation: Land Airport Serving Certain Air Carriers 14 CFR 139 IS
(Aviation) Repair Stations 14 CFR 145 IS
(Aviation) Objects Affecting Navigable Airspace 14 CFR 77 IS
(Aviation) Notification And Reporting - Accidents and Incidents 14 CFR 830 IS
(Aviation) General Operating and Flight Rules 14 CFR 91 IS
Oil and Gas Division 16 TAC 1.3 CW TS
Environmental Recycling 16 TAC 1.4 PP
Fish and Wildlife Coordination Act 16 U.S.C. §§ 661-666c MR
Bald and Golden Eagle Protection Acts 16 U.S.C. §§ 668-668d MR
Migratory Bird Treaty Act 16 U.S.C. §§ 703-711 MR
Endangered Species Act 16 USC Parts 1531-1544 MR
Radiation Control 25 TAC 1.289 IH IS RP
Commerce In Explosives (ATF) 27 CFR 55 IS, CS, FP
Imminent Danger 29 CFR 1903.13 IS
Posting of Notice: Availability of the Act, Regulations, and Applicable Standards 29 CFR 1903.2 IS
Recordkeeping and Reporting Occupational Injuries and Illnesses 29 CFR 1904 IS
General (1 through 8) 29 CFR 1910 SUBPART A IS,FP
Adoption and Extension of Established Federal Standards (11 through 19) 29 CFR 1910 SUBPART B IS
Walking-Working Surfaces (21 through 30) 29 CFR 1910 SUBPART D IS
Means of Egress (35 through 38) 29 CFR 1910 SUBPART E IS
Powered Platforms, Manlifts, and Vehicle Mounted Work Platforms (66 through 68) 29 CFR 1910 SUBPART F IS
Occupational Health and Environmental Control (94 through 98) 29 CFR 1910 SUBPART G IH
Hazardous Materials (101 through 126) 29 CFR 1910 SUBPART H IS,CS,FP
Personal Protective Equipment (132 through 139) 29 CFR 1910 SUBPART I IS
General Environmental Controls (141 through 147) 29 CFR 1910 SUBPART J IS,FP
Medical and First Aid (151) 29 CFR 1910 SUBPART K MS
Fire Protection (155 through 165) 29 CFR 1910 SUBPART L IS,FP
Compressed Gas and Compressed Air Equipment (169) 29 CFR 1910 SUBPART M IS
Materials Handling and Storage (176-179, 181, 183-184) 29 CFR 1910 SUBPART N IS
Machinery and Machine Guarding (211 through 213, 215, 219) 29 CFR 1910 SUBPART O IS
Hand/Portable Powered Tools and Other Hand-Held Equipment (241 through 244) 29 CFR 1910 SUBPART P IS
Welding, Cutting, and Brazing (251 through 255) 29 CFR 1910 SUBPART Q IS
Special Industries (269) Power generation, Transmission 29 CFR 1910 SUBPART R IS
Special Industries (268) Telecommunications 29 CFR 1910 SUBPART R IS
Electrical (301 through 306, 331–335, 399) 29 CFR 1910 SUBPART S IS
Commercial Diving Operations (401 through 402, 410, 420-427, 430, 440-441) 29 CFR 1910 SUBPART T IS
Toxic and Hazardous Substances (1000 through 1450 except 1029, 1043, 1045, 1047, 1050-1051)
29 CFR 1910 SUBPART Z IH

DESCRIPTION STANDARD AREA Designations for General Industry Standards Incorporated Into Body of Construction Standards
29 CFR 1926 APPENDIX A IS
General (1 through 5) 29 CFR 1926 SUBPART A MO
General Interpretations (10 through 16) 29 CFR 1926 SUBPART B IS
General Safety and Health Provisions (20 through 35) 29 CFR 1926 SUBPART C IS,FP
Occupational Health and Environmental Controls (50 through 66) 29 CFR 1926 SUBPART D IS
Personal Protection and Life Saving Equipment (95 through 107) 29 CFR 1926 SUBPART E IS,FP
Fire Protection and Prevention (150 through 159) 29 CFR 1926 SUBPART F IS,FP
Signs, Signals, and Barricades (200 through 203) 29 CFR 1926 SUBPART G IS
Materials Handling, Storage, Use, and Disposal (250 through 252) 29 CFR 1926 SUBPART H IS
Tools - Hand and Power (300 through 307) 29 CFR 1926 SUBPART I IS
Welding and Cutting (350 through 354) 29 CFR 1926 SUBPART J IS
Electrical (400 through 408, 416-417, 431-432, 441, 449) 29 CFR 1926 SUBPART K IS
Scaffolds (450 through 454) 29 CFR 1926 SUBPART L IS
Fall Protection (500 through 503) 29 CFR 1926 SUBPART M IS
Cranes, Derricks, Hoists, Elevators, and Conveyors (550 through 555) 29 CFR 1926 SUBPART N IS
Motor Vehicles, Mechanized Equipment, and Marine Operations (600 through 606) 29 CFR 1926 SUBPART O IS
Excavations (650 through 652) 29 CFR 1926 SUBPART P IS
Concrete and Masonry Construction (700 through 706) 29 CFR 1926 SUBPART Q IS
Steel Erection (750 through 752) 29 CFR 1926 SUBPART R IS
Demolition (850 through 860) 29 CFR 1926 SUBPART T IS
Blasting and the Use of Explosives (900 through 914) 29 CFR 1926 SUBPART U IS
Power Transmission and Distribution (950 through 960) 29 CFR 1926 SUBPART V IS
Rollover Protective Structures; Overhead Protection (1000 through 1003) 29 CFR 1926 SUBPART W IS
Stairways and Ladders (1050 through 1060) 29 CFR 1926 SUBPART X IS
Diving (1071 through 1092) 29 CFR 1926 SUBPART Y IS
Toxic and Hazardous Substances (1100 through 1152 except 1129, 1145, 1147) 29 CFR 1926 SUBPART Z IH
Hazardous Materials Information Development, Preparedness and Response Act 30 LA RS 2361-2379 SARA Title III
CS
General Provisions - Document Filing Procedures 30 TAC 1.1.10 CA
General Air Quality Rules 30 TAC 1.101 CA
Permits by Rule 30 TAC 1.106 CA
Control of Air Pollution from Visible Emissions and Particulate Matter 30 TAC 1.111 CA
Control of Air Pollution from Sulfur Compounds 30 TAC 1.112 CA
Control of Air Pollution from Hazardous Air Pollutants 30 TAC 1.113 CA
Control of Air Pollution from Motor Vehicles 30 TAC 1.114 CA
Control of Air Pollution from Volatile Organic Compounds 30 TAC 1.115 CA
Control of Air Pollution by Permits for New Construction or Modification 30 TAC 1.116 CA
Control of Air Pollution from Nitrogen Compounds 30 TAC 1.117 CA
Control of Air Pollution Episodes 30 TAC 1.118 CA
Federal Operating Permits Program 30 TAC 1.122 CA
Electronic Reporting 30 TAC 1.19.3 CA
Environmental Testing Laboratory Accreditation and Certification 30 TAC 1.25 CW MR
Water Quality Certification 30 TAC 1.279 CW
Applications Processing 30 TAC 1.281 CW
Public Drinking Water 30 TAC 1.290 CW
Water Rights, Procedural 30 TAC 1.295 CW
Water Rights, Substantive 30 TAC 1.297 CW
Occupational Licenses and Registrations 30 TAC 1.30 CW
Surface Water Quality Standards 30 TAC 1.307 CW
Sludge Use, Disposal, and Transportation 30 TAC 1.312 HW

DESCRIPTION STANDARD AREA Used Oil 30 TAC 1.324 PP
Spill Prevention and Control 30 TAC 1.327 CW
Waste Minimization and Recycle 30 TAC 1.328 PP
Municipal Solid Waste 30 TAC 1.330 PP
Underground and Aboveground Storage Tanks 30 TAC 1.334 HW
Industrial Solid Waste and Municipal Hazardous Waste 30 TAC 1.335 HW
Radioactive Substance Rules 30 TAC 1.336 RP
Groundwater Protection Recommendation Letters and Fees 30 TAC 1.339 CW
Regulatory Flexibility 30 TAC 1.90 MR
MOU between TCEQ and RRC 30 TAC 7.117 CW, TS
Planning Division 31 TAC 1.15 CW
Oil Spill Prevention and Response 31 TAC 1.19 CW
Natural Resource Damage Assessment 31 TAC 1.20 CW
Oil Spill Prevention and Response Hearings Procedures 31 TAC 1.21 CW
Fisheries 31 TAC II.57 MR
Wildlife 31 TAC II.65 MR
Resource Protection 31 TAC II.69 MR
Coastal Management Program 31 TAC XVI.501 CW
Coastal Management Program Boundary 31 TAC XVI.503 CW
Coastal Management Program 31 TAC XVI.504 CW
Council Procedures for State Consistency With Coastal Management Program Goals and Policies
31 TAC XVI.505 CW
Council Procedures for Federal Consistency With Coastal Management Program Goals and Priorities
31 TAC XVI.506 CW
Certain vehicles must stop at all railroad grade crossings (Explosives) 32 LA RS 173.1 TS
Permission for operation; crossing railroad grade crossings; markings 32 LA RS 251 Subpart J. TS
Equipment and inspection (Explosives) 32 LA RS 252 TS
Handling Class I (Explosive) Materials or Other Dangerous Cargo 33 CFR 126 CW
Control of Pollution by Oil and Hazardous Substances, Discharged Removed 33 CFR 153 CW
Facilities Transferring Oil or Hazardous Material in Bulk 33 CFR 154 CW
Oil and Hazardous Material Transfer Operations 33 CFR 156 CW
Reception Facilities for Oil, Noxious Liquid Substances, and Garbage (MARPOL) 33 CFR 158 HW
Permits for Structures or Work in or Affecting Navigable Waters of the U.S. 33 CFR 322 CW
Permits for Discharges of Dredged or Fill Material into Waters of the U.S. 33 CFR 323 CW
Process of Department of Army Permits 33 CFR 325 CW
Enforcement 33 CFR 326 CW
Definition of Waters of the United States 33 CFR 328 CW
Definition of Navigable Waters of the United States 33 CFR 329 CW
Nationwide Permits 33 CFR 330 CW
Compensatory Mitigation for Losses of Aquatic Resources 33 CFR 332 CW, MR
Markings of Structures, Sunken Vessels and Other Obstructions 33 CFR 64 CW
Private Aid to Navigation 33 CFR 66 CW
Aids to Navigation on Artificial Islands and Fixed Structures 33 CFR 67 CW
Risk Evaluation/Corrective Action Program 33 LAC I.13 MR
Groundwater Fees 33 LAC I.14 MR
Permit Review 33 LAC I.15 MR
Departmental Administrative Procedures 33 LAC I.3 MR
Notification Regulations and Procedures for Unauthorized Discharges 33 LAC I.39 MR
Policy and Intent 33 LAC I.45 MR
Program Requirements 33 LAC I.47 MR

DESCRIPTION STANDARD AREA Organization and Personnel Requirements 33 LAC I.49 MR
On-site Inspection/Evaluation 33 LAC I.51 MR
Quality System Requirements 33 LAC I.53 MR
Sample Protocol/Sample Integrity 33 LAC I.55 MR
Maintenance of Accreditation 33 LAC I.57 MR
Emergency Response Regulations 33 LAC I.69 MR
General Provisions 33 LAC III.1 CA
Control of Emissions of Smoke 33 LAC III.11 CA
Emission Standards for Particulate Matter 33 LAC III.13 CA
Conformity 33 LAC III.14 CA
Rules and Regulations for the Fee System of the Air Quality Control Programs 33 LAC III.2 CA
Control of Emission of Organic Compounds 33 LAC III.21 CA
Odor Regulations 33 LAC III.29 CA
Standards of Performance for New Stationary Sources 33 LAC III.30 CA
Permit Procedures 33 LAC III.5 CA
Comprehensive Toxic Air Pollutant Emission Control Program 33 LAC III.51 CA
Area Sources of Toxic Air Pollutants 33 LAC III.53 CA
Prevention of Air Pollution Emergency Episodes 33 LAC III.56 CA
Chemical Accident Prevention and Minimization of Consequences 33 LAC III.59 CA
Ambient Air Quality 33 LAC III.7 CA
General Regulations on Control of Emissions and Emission Standards 33 LAC III.9 CA
General Provisions 33 LAC IX.1 CW
Surface Water Quality Standards 33 LAC IX.11 CW
Louisiana Water Pollution Control Fee System Regulation 33 LAC IX.13 CW
Water Quality Certification Procedures 33 LAC IX.15 CW
Rules Governing Disposal of Waste Oil, Oil Field Brine, and All Other Materials Resulting From the Drilling for, Production of, or Transportation of Oil, Gas or Sulphur (as amended January 27, 1953)
33 LAC IX.17 CW
State of Louisiana Stream Control Commission 33 LAC IX.19 CW
The LPDES Program Definitions and General Program Requirements 33 LAC IX.23 CW
Permit Application and Special LPDES Program Requirements 33 LAC IX.25 CW
LPDES Permit Conditions 33 LAC IX.27 CW
Transfer, Modification, Revocation and Reissuance, and Termination of LPDES Permits 33 LAC IX.29 CW
Permits 33 LAC IX.3 CW
General LPDES Program Requirements 33 LAC IX.31 CW
Specific Decision making Procedures Applicable to LPDES Permits 33 LAC IX.33 CW
Enforcement 33 LAC IX.5 CW
Effluent Standards 33 LAC IX.7 CW
Spill Prevention and Control 33 LAC IX.9 CW
General Provisions and Definitions 33 LAC V.1 HW
Definitions 33 LAC V.109 HW
Generators 33 LAC V.11 HW
Transporters 33 LAC V.13 HW
Treatment, Storage and Disposal Facilities 33 LAC V.15 HW
Containment Buildings 33 LAC V.18 HW
Tanks 33 LAC V.19 HW
Containers 33 LAC V.21 HW
Prohibitions on Land Disposal 33 LAC V.22 HW
Corrective Action Management Units and Temporary Units 33 LAC V.26 HW
Transportation of Hazardous Liquids by Pipeline 33 LAC V.30 TS

DESCRIPTION STANDARD AREA Financial Requirements 33 LAC V.37 HW
Universal Wastes 33 LAC V.38 HW
Small Quantity Generators 33 LAC V.39 HW
Used Oil 33 LAC V.40 PP
Recyclable Materials 33 LAC V.41 PP
Lists of Hazardous Wastes 33 LAC V.49 HW
Fee Schedules 33 LAC V.51 HW
Manifest System for TSD Facilities 33 LAC V.9 HW
General Provisions and Definitions (solid waste regulations) 33 LAC VII.1 HW
Recycling and Waste Reduction Rules 33 LAC VII.103 PP
Waste Tires 33 LAC VII.105 PP
Scope and Mandatory Provisions of the Program 33 LAC VII.3 HW
Solid Waste Management System 33 LAC VII.5 HW
Solid Waste Standards 33 LAC VII.7 HW
Enforcement 33 LAC VII.9 HW
Program Applicability and Definitions 33 LAC XI.1 HW
Enforcement 33 LAC XI.15 HW
Registration Requirements, Standards and Fee Schedule 33 LAC XI.3 HW
Spill and Overfill Control 33 LAC XI.5 HW
Methods Release Detection and Release Reporting, Investigation, Confirmation and Response
33 LAC XI.7 HW
Out of Service UST Systems and Closure 33 LAC XI.9 HW
General Provisions 33 LAC XV.1 RP
Notices, Instructions, and Reports to Workers; Inspections 33 LAC XV.10 RP
Regulation and Licensing of Naturally Occurring Radioactive Material (NORM) 33 LAC XV.14 RP
Transportation of Radioactive Material 33 LAC XV.15 RP
Licensing and Radiation Safety Requirements for Irradiators 33 LAC XV.17 RP
Registration of Radiation Machines and Facilities 33 LAC XV.2 RP
Radiation Safety Requirements for Wireline Service Operations and Subsurface Tracer Studies
33 LAC XV.20 RP
Fee Schedule 33 LAC XV.25 RP
Licensing of Radioactive Material 33 LAC XV.3 RP
Standards for Protection Against Radiation 33 LAC XV.4 RP
Radiation Safety Requirements for Industrial Radiographic Operations 33 LAC XV.5 RP
Radiation Safety Requirements for Analytical X-Ray Equipment 33 LAC XV.8 RP
Advisory Council on Historical Preservation 36 CFR 800 MR
Pesticides 4 TAC I.7 CS
Asbestos 40 CFR 763 IH,CS
Criteria for State, Local, and Regional Oil Removal Contingency Plans 40 CFR 109 CW
Discharge of Oil 40 CFR 110 CW
Oil Pollution Prevention 40 CFR 112 CW
Designation of Hazardous Substances 40 CFR 116 CW
Determination of Reportable Quantities for Hazardous Substances 40 CFR 117 CW
State Certification of Activities Requiring a Federal License or Permit 40 CFR 121 CW EPA Administrated Permit Programs: The National Pollutant Discharge Elimination System
40 CFR 122 CW
Procedures for Decision Making 40 CFR 124 CW
Criteria and Standards for NPDES 40 CFR 125 CW
Toxic Pollutant Effluent Standards 40 CFR 129 CW
Water Quality Planning and Management, Water Quality Standards 40 CFR 131 CW
Secondary Treatment Regulation 40 CFR 133 CW

DESCRIPTION STANDARD AREA Guidelines Establishing Test Procedures for the Analysis of Pollutants 40 CFR 136 CW
National Primary Drinking Water Regulations 40 CFR 141 CW
National Primary Drinking Water Regulations Implementation 40 CFR 142 CW
National Secondary Drinking Water Regulations 40 CFR 143 CW
Underground Injection Control Program 40 CFR 144 CW
Underground Injection Control Program: Criteria and Standards 40 CFR 146 CW
State Underground Injection Control Programs 40 CFR 147 CW
Sole Source Aquifers 40 CFR 149 CW
NEPA Purpose, Policy and Mandate 40 CFR 1500 MR
NEPA and Agency Planning 40 CFR 1501 MR
NEPA Environmental Impact Statement 40 CFR 1502 MR
NEPA Commenting 40 CFR 1503 MR
NEPA Predecision Referrals to the Council of Proposed Federal Actions Determined to be Environmentally Unsatisfactory
40 CFR 1504 MR
NEPA and Agency Decision Making 40 CFR 1505 MR
Other Requirements of NEPA 40 CFR 1506 MR
NEPA Agency Compliance 40 CFR 1507 MR
NEPA Terminology and Index 40 CFR 1508 MR
Freedom of Information Act Procedures 40 CFR 1515 MR
Privacy Act Implementation 40 CFR 1516 MR
Pesticide Registration and Classification Procedures 40 CFR 152 CS
Labeling Requirements for Pesticides and Devices 40 CFR 156 CS
Worker Protection Standards (Pesticides) 40 CFR 170 CS
Certification of Pesticide Applicators 40 CFR 171 CS
General 40 CFR 220 CW
Section 404 (b) (1) Guidelines for Specification of Disposal Sites for Dredged or Fill Material
40 CFR 230 CW, MR
Guidelines for Storage and Collection of Residential, Commercial, and Institutional Solid Wastes
40 CFR 243 HW
Comprehensive Procurement Guideline for Products Containing Recovered Materials 40 CFR 247 PP
Hazardous Waste Management System: General 40 CFR 260 HW
Identification and Listing of Hazardous Waste 40 CFR 261 HW
Standards Applicable to Generators of Hazardous Wastes 40 CFR 262 HW
Standards applicable to transporters of hazardous wastes 40 CFR 263 HW
Standards for Owners and Operators of Hazardous Waste, Treatment, Storage, and Disposal Facilities
40 CFR 264 HW
Standards for Management of Specific Hazardous Wastes 40 CFR 266 HW
Land Disposal Restrictions 40 CFR 268 HW
Requirements for Authorization of State Hazardous Waste Programs 40 CFR 271 HW
Approved State Hazardous Waste Management Programs 40 CFR 272 HW
Standard for Universal Waste Management 40 CFR 273 HW
Standards for Management of Used Oil 40 CFR 279 HW
Technical Standards and Corrective Action Requirements for Owners and Operators of UST
40 CFR 280 HW
Approved Underground Storage Tank Programs 40 CFR 282 HW
National Oil and Hazardous Substances Pollution Contingency Plans 40 CFR 300 CS
Designation of Reportable Quantities and Notification 40 CFR 302 CS
Emergency Planning and Notification 40 CFR 355 CS
Hazardous Chemical Reporting: Community Right-to-Know 40 CFR 370 CS
Toxic Chemical Release Reporting: Community Right-to-Know 40 CFR 372 CS
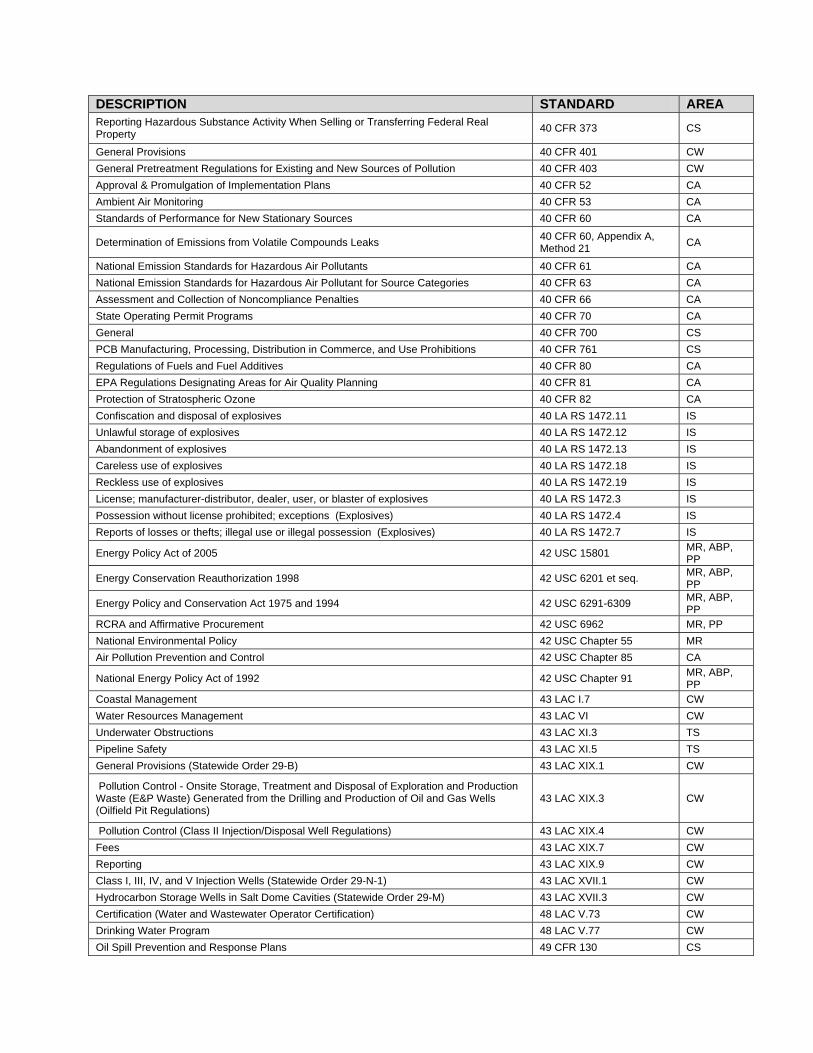
DESCRIPTION STANDARD AREA Reporting Hazardous Substance Activity When Selling or Transferring Federal Real Property
40 CFR 373 CS
General Provisions 40 CFR 401 CW
General Pretreatment Regulations for Existing and New Sources of Pollution 40 CFR 403 CW
Approval & Promulgation of Implementation Plans 40 CFR 52 CA
Ambient Air Monitoring 40 CFR 53 CA
Standards of Performance for New Stationary Sources 40 CFR 60 CA
Determination of Emissions from Volatile Compounds Leaks 40 CFR 60, Appendix A, Method 21
CA
National Emission Standards for Hazardous Air Pollutants 40 CFR 61 CA
National Emission Standards for Hazardous Air Pollutant for Source Categories 40 CFR 63 CA
Assessment and Collection of Noncompliance Penalties 40 CFR 66 CA
State Operating Permit Programs 40 CFR 70 CA
General 40 CFR 700 CS
PCB Manufacturing, Processing, Distribution in Commerce, and Use Prohibitions 40 CFR 761 CS
Regulations of Fuels and Fuel Additives 40 CFR 80 CA
EPA Regulations Designating Areas for Air Quality Planning 40 CFR 81 CA
Protection of Stratospheric Ozone 40 CFR 82 CA
Confiscation and disposal of explosives 40 LA RS 1472.11 IS
Unlawful storage of explosives 40 LA RS 1472.12 IS
Abandonment of explosives 40 LA RS 1472.13 IS
Careless use of explosives 40 LA RS 1472.18 IS
Reckless use of explosives 40 LA RS 1472.19 IS
License; manufacturer-distributor, dealer, user, or blaster of explosives 40 LA RS 1472.3 IS
Possession without license prohibited; exceptions (Explosives) 40 LA RS 1472.4 IS
Reports of losses or thefts; illegal use or illegal possession (Explosives) 40 LA RS 1472.7 IS
Energy Policy Act of 2005 42 USC 15801 MR, ABP, PP
Energy Conservation Reauthorization 1998 42 USC 6201 et seq. MR, ABP, PP
Energy Policy and Conservation Act 1975 and 1994 42 USC 6291-6309 MR, ABP, PP
RCRA and Affirmative Procurement 42 USC 6962 MR, PP
National Environmental Policy 42 USC Chapter 55 MR
Air Pollution Prevention and Control 42 USC Chapter 85 CA
National Energy Policy Act of 1992 42 USC Chapter 91 MR, ABP, PP
Coastal Management 43 LAC I.7 CW
Water Resources Management 43 LAC VI CW
Underwater Obstructions 43 LAC XI.3 TS
Pipeline Safety 43 LAC XI.5 TS
General Provisions (Statewide Order 29-B) 43 LAC XIX.1 CW
Pollution Control - Onsite Storage‚ Treatment and Disposal of Exploration and Production Waste (E&P Waste) Generated from the Drilling and Production of Oil and Gas Wells (Oilfield Pit Regulations)
43 LAC XIX.3 CW
Pollution Control (Class II Injection/Disposal Well Regulations) 43 LAC XIX.4 CW
Fees 43 LAC XIX.7 CW
Reporting 43 LAC XIX.9 CW
Class I, III, IV, and V Injection Wells (Statewide Order 29-N-1) 43 LAC XVII.1 CW
Hydrocarbon Storage Wells in Salt Dome Cavities (Statewide Order 29-M) 43 LAC XVII.3 CW
Certification (Water and Wastewater Operator Certification) 48 LAC V.73 CW
Drinking Water Program 48 LAC V.77 CW
Oil Spill Prevention and Response Plans 49 CFR 130 CS
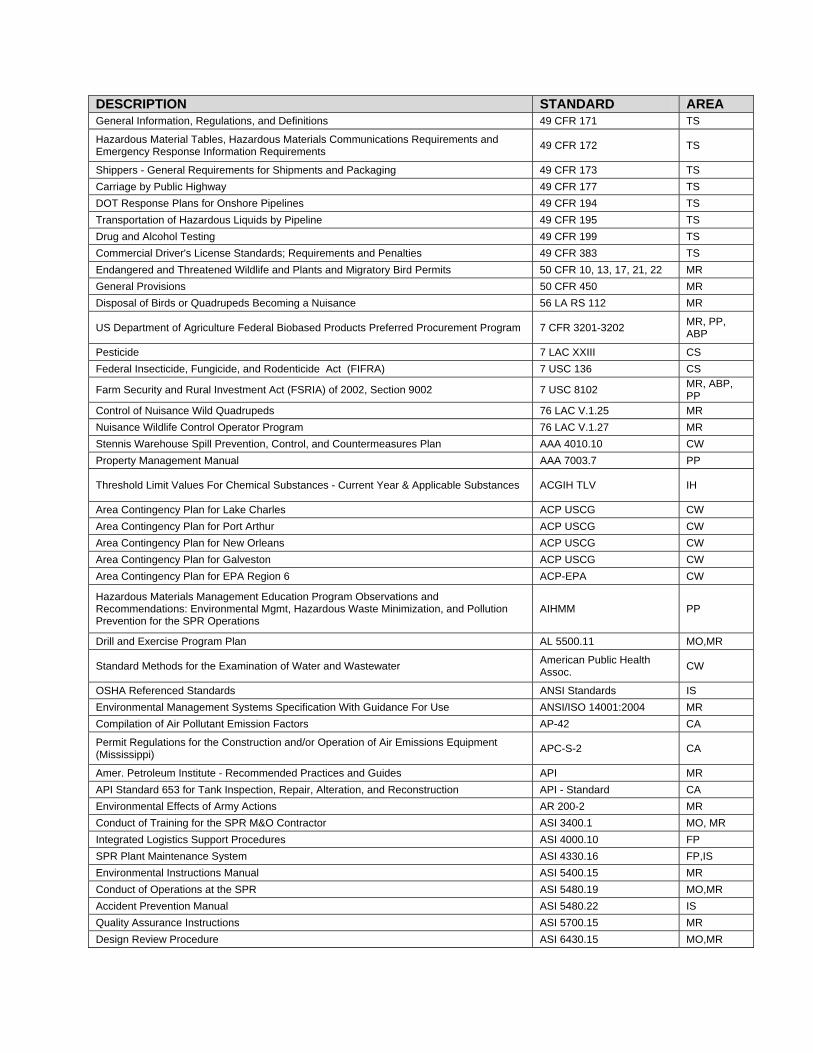
DESCRIPTION STANDARD AREA General Information, Regulations, and Definitions 49 CFR 171 TS
Hazardous Material Tables, Hazardous Materials Communications Requirements and Emergency Response Information Requirements
49 CFR 172 TS
Shippers - General Requirements for Shipments and Packaging 49 CFR 173 TS
Carriage by Public Highway 49 CFR 177 TS
DOT Response Plans for Onshore Pipelines 49 CFR 194 TS
Transportation of Hazardous Liquids by Pipeline 49 CFR 195 TS
Drug and Alcohol Testing 49 CFR 199 TS
Commercial Driver's License Standards; Requirements and Penalties 49 CFR 383 TS
Endangered and Threatened Wildlife and Plants and Migratory Bird Permits 50 CFR 10, 13, 17, 21, 22 MR
General Provisions 50 CFR 450 MR
Disposal of Birds or Quadrupeds Becoming a Nuisance 56 LA RS 112 MR
US Department of Agriculture Federal Biobased Products Preferred Procurement Program 7 CFR 3201-3202 MR, PP, ABP
Pesticide 7 LAC XXIII CS
Federal Insecticide, Fungicide, and Rodenticide Act (FIFRA) 7 USC 136 CS
Farm Security and Rural Investment Act (FSRIA) of 2002, Section 9002 7 USC 8102 MR, ABP, PP
Control of Nuisance Wild Quadrupeds 76 LAC V.1.25 MR
Nuisance Wildlife Control Operator Program 76 LAC V.1.27 MR
Stennis Warehouse Spill Prevention, Control, and Countermeasures Plan AAA 4010.10 CW
Property Management Manual AAA 7003.7 PP
Threshold Limit Values For Chemical Substances - Current Year & Applicable Substances ACGIH TLV IH
Area Contingency Plan for Lake Charles ACP USCG CW
Area Contingency Plan for Port Arthur ACP USCG CW
Area Contingency Plan for New Orleans ACP USCG CW
Area Contingency Plan for Galveston ACP USCG CW
Area Contingency Plan for EPA Region 6 ACP-EPA CW
Hazardous Materials Management Education Program Observations and Recommendations: Environmental Mgmt, Hazardous Waste Minimization, and Pollution Prevention for the SPR Operations
AIHMM PP
Drill and Exercise Program Plan AL 5500.11 MO,MR
Standard Methods for the Examination of Water and Wastewater American Public Health Assoc.
CW
OSHA Referenced Standards ANSI Standards IS
Environmental Management Systems Specification With Guidance For Use ANSI/ISO 14001:2004 MR
Compilation of Air Pollutant Emission Factors AP-42 CA
Permit Regulations for the Construction and/or Operation of Air Emissions Equipment (Mississippi)
APC-S-2 CA
Amer. Petroleum Institute - Recommended Practices and Guides API MR
API Standard 653 for Tank Inspection, Repair, Alteration, and Reconstruction API - Standard CA
Environmental Effects of Army Actions AR 200-2 MR
Conduct of Training for the SPR M&O Contractor ASI 3400.1 MO, MR
Integrated Logistics Support Procedures ASI 4000.10 FP
SPR Plant Maintenance System ASI 4330.16 FP,IS
Environmental Instructions Manual ASI 5400.15 MR
Conduct of Operations at the SPR ASI 5480.19 MO,MR
Accident Prevention Manual ASI 5480.22 IS
Quality Assurance Instructions ASI 5700.15 MR
Design Review Procedure ASI 6430.15 MO,MR
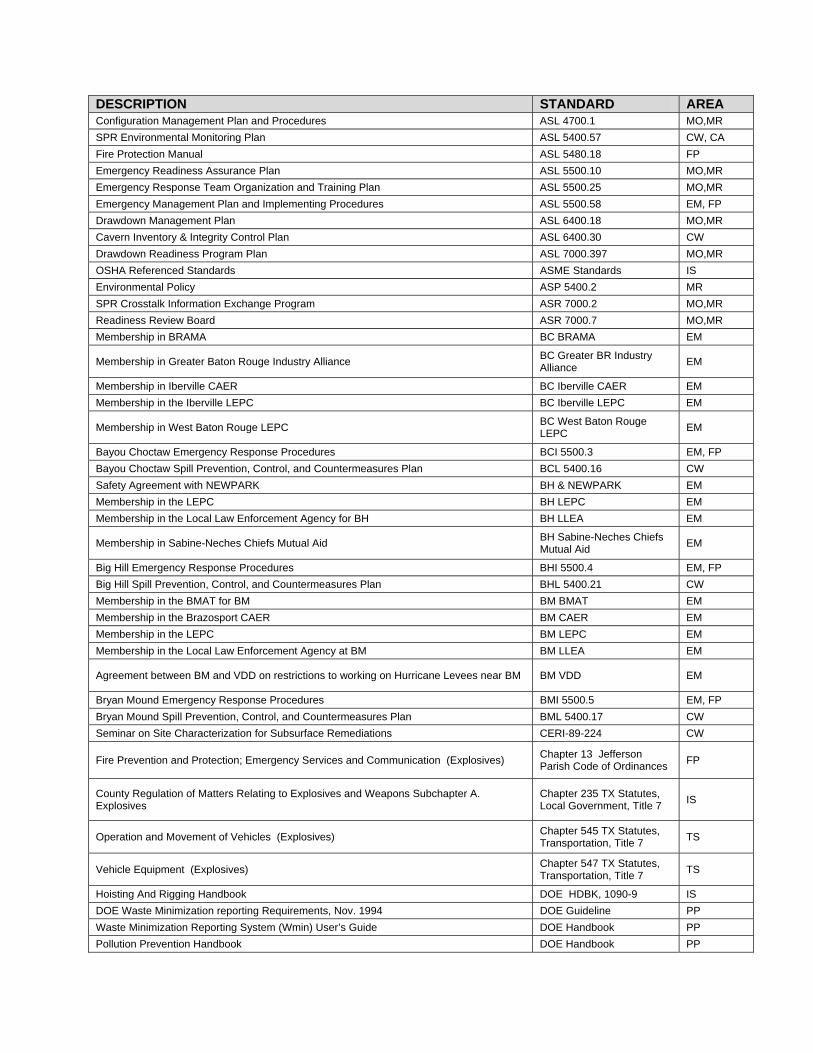
DESCRIPTION STANDARD AREA Configuration Management Plan and Procedures ASL 4700.1 MO,MR
SPR Environmental Monitoring Plan ASL 5400.57 CW, CA
Fire Protection Manual ASL 5480.18 FP
Emergency Readiness Assurance Plan ASL 5500.10 MO,MR
Emergency Response Team Organization and Training Plan ASL 5500.25 MO,MR
Emergency Management Plan and Implementing Procedures ASL 5500.58 EM, FP
Drawdown Management Plan ASL 6400.18 MO,MR
Cavern Inventory & Integrity Control Plan ASL 6400.30 CW
Drawdown Readiness Program Plan ASL 7000.397 MO,MR
OSHA Referenced Standards ASME Standards IS
Environmental Policy ASP 5400.2 MR
SPR Crosstalk Information Exchange Program ASR 7000.2 MO,MR
Readiness Review Board ASR 7000.7 MO,MR
Membership in BRAMA BC BRAMA EM
Membership in Greater Baton Rouge Industry Alliance BC Greater BR Industry Alliance
EM
Membership in Iberville CAER BC Iberville CAER EM
Membership in the Iberville LEPC BC Iberville LEPC EM
Membership in West Baton Rouge LEPC BC West Baton Rouge LEPC
EM
Bayou Choctaw Emergency Response Procedures BCI 5500.3 EM, FP
Bayou Choctaw Spill Prevention, Control, and Countermeasures Plan BCL 5400.16 CW
Safety Agreement with NEWPARK BH & NEWPARK EM
Membership in the LEPC BH LEPC EM
Membership in the Local Law Enforcement Agency for BH BH LLEA EM
Membership in Sabine-Neches Chiefs Mutual Aid BH Sabine-Neches Chiefs Mutual Aid
EM
Big Hill Emergency Response Procedures BHI 5500.4 EM, FP
Big Hill Spill Prevention, Control, and Countermeasures Plan BHL 5400.21 CW
Membership in the BMAT for BM BM BMAT EM
Membership in the Brazosport CAER BM CAER EM
Membership in the LEPC BM LEPC EM
Membership in the Local Law Enforcement Agency at BM BM LLEA EM
Agreement between BM and VDD on restrictions to working on Hurricane Levees near BM BM VDD EM
Bryan Mound Emergency Response Procedures BMI 5500.5 EM, FP
Bryan Mound Spill Prevention, Control, and Countermeasures Plan BML 5400.17 CW
Seminar on Site Characterization for Subsurface Remediations CERI-89-224 CW
Fire Prevention and Protection; Emergency Services and Communication (Explosives) Chapter 13 Jefferson Parish Code of Ordinances
FP
County Regulation of Matters Relating to Explosives and Weapons Subchapter A. Explosives
Chapter 235 TX Statutes, Local Government, Title 7
IS
Operation and Movement of Vehicles (Explosives) Chapter 545 TX Statutes, Transportation, Title 7
TS
Vehicle Equipment (Explosives) Chapter 547 TX Statutes, Transportation, Title 7
TS
Hoisting And Rigging Handbook DOE HDBK, 1090-9 IS
DOE Waste Minimization reporting Requirements, Nov. 1994 DOE Guideline PP
Waste Minimization Reporting System (Wmin) User’s Guide DOE Handbook PP
Pollution Prevention Handbook DOE Handbook PP

DESCRIPTION STANDARD AREA Guidance for the Preparation of the Waste Minimization and Pollution Prevention Awareness Plan, Dec 1993
DOE Handbook PP
EPA’s Interim Final Guidance to Hazardous Waste Generators on the Elements of a Waste Minimization Program
DOE Memorandum PP
For all applicable DOE Orders See Contract No. DE-AC96-03PO92207 Applicable Standards List
DOE Orders MO,MR
Pollution Prevention Program Plan DOE S-0118 PP
Paint Repair of Exterior Metal Surfaces DOE Standard Spec. 17900 PP
Management of Polychlorinated Biphenyls (PCBs) DOE/EH-0350 CS, HW
Performance Objectives and Criteria for Conducting DOE Environmental Audits DOE/EH-0358 MR
Annual report on Waste Generation and Waste Minimization Progress DOE/EM-0276 PP
Standard for Fire Protection of DOE Electronic Computer/Data Processing Systems DOE/EP-0108 FP
Waste Minimization/Pollution Prevention Crosscut Plan 1994 DOE/FM-0145 PP
Fire Protection for Relocatable Structures DOE-STD-1088-95 FP
All SPR Environmental Permits as listed in the Annual Site Environmental Report (ASER) Environmental Permits CW, MR, AR
Protection and Enhancement of Environmental Quality EO 11514 MR
Floodplain Management EO 11988 CW
Protection of Wetlands EO 11990 CW
Federal Compliance with Pollution Control Requirements EO 12088 MR
Federal Action to Address Environmental Justice in Minority Populations and Low-Income Populations
EO 12898 MR
Marine Protected Area EO 13158 CW
Responsibilities of Federal Agencies to Protect Migratory Birds EO 13186 MR
Energy Efficient Standby Power Devices EO 13221 PP
Preserve America EO 13287 MR
Strengthening Federal Environmental, Energy, and Transportation Management EO 13423 MR, EO, ABP, PP
Federal Leadership in Environmental, Energy, and Economic Performance EO 13514 MR, PP
Protocol for Equipment Leak Emission Estimates, Jun 1993 EPA 453/R-93-026 CA
Practical Guide for Groundwater Sampling EPA 600/2-85/105 CW
Handbook for Analytical Quality Control in Water and Wastewater Laboratories EPA 600/4-79-019 CW
Methods for Chemical Analysis of Water and Wastes EPA 600/4-79-020 CW
Handbook for Sampling and Sample Preservation of Water and Wastewater EPA 600/4-82-029 CW
Addendum to Handbook for Sampling and Sample Preservation, EPA 600/4-82-029 EPA 600/4-83-039 CW
Microbiological Methods for Monitoring the Environment, Water and Wastes EPA 600/8-78-017 CW
Facility Pollution Prevention Guide EPA 600/R-92/088 PP
Short Term Methods for Measuring the Acute Toxicity of Effluents to Aquatic Organisms EPA 821-R-02-014 CW
Water Measurement Manual EPA 832B81102 CW
Storm Water Management for Industrial Activities EPA 833-R-92-002 PP
Engineering Support Branch Standard Operating Procedures and Quality Assurance Manual, 4/1/86
EPA Region IV MR
Current National Water Quality Criteria EPA Web Site CW
EPA Waste Minimization Opportunity Assessment Manual EPA, ISBN:0-86587-752-1 PP
Specification for 8’ and 12’ Unlighted and Externally Lighted Wind Cone Assembly FAA AC 150/5345-27 IS
Heliport Design, January 4, 1988 FAA AC 150/5390-2 IS
Obstruction Marking and Lighting, October 1985 FAA AC 70/7460-1G IS
DESCRIPTION STANDARD AREA
For all applicable FAR and DEAR Clauses see Contract DE-AC96-03PO92207, Applicable Clauses List
FAR and DEAR Clauses MR, PP, CA, CW, HW, CS
Factory Mutual - Approval Guide and Loss Prevention Data Sheets FM FP
Hazardous Waste Management Regulations (Mississippi) HW-1 HW
Oil Cos. International. Marine Forum - International Oil Tanker and Terminal Safety Guide ICIMF IS
OSHA Referenced Standards IEEE Standards IS
STRATEGIC PETROLEUM RESERVE MANAGEMENT AND OPERATING AND CONSTUCTION MANAGEMENT SERVICES CONTRACTORS- ENVIRONMENTAL
IWA: DOE-DM-AGSC
CA, CS, CW, EM, FP, HW, MR, PP
STRATEGIC PETROLEUM RESERVE MANAGEMENT AND OPERATING AND CONSTUCTION MANAGEMENT SERVICES CONTRACTORS- SAFETY AND HEALTH
IWA: DOE-DM-AGSC EM, FP, IH, IS, RP, TS
Pollution Prevention Assessment Manual for Texas Businesses LP 92-03 PP
Surface Water and Ground Water Use and Protection (Mississippi) LW-2 CW
Regarding Implementation of the Executive Order 13186, “Responsibilities of Federal Agencies to Protect Migratory Birds"
MOU- USFWS MR
MOU with ATFE for Louisiana Sites during Emergencies MOU with ATFE in LA EM
MOU with ATFE for the Texas Sites during Emergencies MOU with ATFE TX EM
MOU with the BCSO for BM during Emergencies MOU with BCSO EM
MOU with Cameron Parish Sheriff's Office for WH during Emergencies MOU with CamPSO EM
MOU with Calcasieu Parish Sheriff's Office for WH during Emergencies MOU with CPSO EM
MOU with Entergy MOU with Entergy EM
MOU with the FBI for Louisiana Sites during Emergencies MOU with FBI in LA EM
MOU with the FBI for the Texas Sites during Emergencies MOU with FBI TX EM
MOU with Ft. Polk for Louisiana Sites during Emergencies MOU with Ft. Polk EM
MOU with JCSO for BH during Emergencies MOU with JCSO EM
MOU with LA Homeland Security for Louisiana Sites during Emergencies MOU with LA Homeland Security
EM
MOU with LA State Police for Louisiana Sites during Emergencies MOU with LA State Police EM
MOU with US Army 797th Explosive Ordinance Co. for the Texas Sites during Emergencies
MOU with US Army 797 EOC
EM
SPR Gas and Geothermal Heat Effects on Crude Oil Vapor Pressure, Dec. 1994 MP 94W0000131 CA
Power to capture or destroy animals injurious to property MSC Section 49-1-39 MR
Nuisance Wildlife MSC Section 49-7-1 MR
Laboratory Programs & Procedures MSL 7000.133 CW, HW
National Association of Corrosion Engineers NACE FP, IS
National Electric Safety Code NEC FP, IS
Fire Protection Handbook NFPA FP
Uniform Fire Code NFPA 1 FP
Standard for Portable Fire Extinguishers NFPA 10 FP
Standard for Fire Service Professional Qualifications Accreditation and Certification Systems
NFPA 1000 FP
Life Safety Code® NFPA 101 FP, IS
Guide on Alternative Approaches to Life Safety NFPA 101A FP
Standard for Fire Officer Professional Qualifications NFPA 1021 FP
Standard for Professional Qualifications for Fire Inspector and Plan Examiner NFPA 1031 FP
Standard for Professional Qualifications for Fire Investigator NFPA 1033 FP
Standard for Fire Service Instructor Professional Qualifications NFPA 1041 FP Standard for the Installation of Smoke Door Assemblies and other Opening Protectives NFPA 105 FP
Standard for Industrial Fire Brigade Member Professional Qualifications NFPA 1081 FP

DESCRIPTION STANDARD AREA Standard for Low-, Medium-, and High-Expansion Foam NFPA 11 FP
Standard for Emergency and Standby Power Systems NFPA 110 FP
Standard on Stored Electrical Energy Emergency and Standby Power Systems NFPA 111 FP
Standard for the Installation of Sprinkler Systems NFPA 13 FP
Recommended Practice for Fire Department Operations in Properties Protected by Sprinkler and Standpipe Systems
NFPA 13E FP
Standard for the Installation of Standpipe and Hose Systems NFPA 14 FP
Recommended Practice for Fire Service Training Reports and Records NFPA 1401 FP
Standard for Fire Service Respiratory Protection Training NFPA 1404 FP
Standard on Training for Initial Emergency Scene Operations NFPA 1410 FP
Standard for Water Spray Fixed Systems for Fire Protection NFPA 15 FP
Standard on Fire Department Occupational Safety and Health Program NFPA 1500 FP
Standard on Emergency Services Incident Management System NFPA 1561 FP
Standard on Fire Department Infection Control Program NFPA 1581 FP
Standard on Comprehensive Occupational Medical Program for Fire Departments NFPA 1582 FP
Standard for the Installation of Foam-Water Sprinkler and Foam-Water Spray Systems NFPA 16 FP
Standard on Disaster/Emergency Management and Business Continuity Programs NFPA 1600 FP
Standard for Dry Chemical Extinguishing Systems NFPA 17 FP
Standard for Fire Safety Symbols and Emergency Symbols NFPA 170 FP
Standard for Automotive Fire Apparatus NFPA 1901 FP
Standard for the Inspection, Maintenance, Testing & retirement of in Service Automotive Fire Apparatus
NFPA 1911 FP
Standard on Fire Hose NFPA 1961 FP
Standard for the Inspection, Care and Use of Fire Hose, Couplings and Nozzles; and the Service Testing of Fire Hose
NFPA 1962 FP
Standard for Fire Hose Connections NFPA 1963 FP
Standard for Spray Nozzles NFPA 1964 FP
Standard for Fire Hose Appliances NFPA 1965 FP
Standard on Protective Ensemble For Structural Fire Fighting and Proximity Fire Fighting NFPA 1971 FP
Standard on Open-Circuit Self-Contained Breathing Apparatus (SCBA) for Fire and Emergency Services
NFPA 1981 FP
Standard on Personal Alert Safety Systems NFPA 1982 FP
Standard on Fire Service Life Safety Rope and Equipment for Emergency Service NFPA 1983 FP
Standard on Vapor-Protective Ensembles for Hazardous Materials Emergencies NFPA 1991 FP
Standard on Liquid Splash-Protective Ensembles and Clothing for Hazardous Materials Emergencies
NFPA 1992 FP
Standard on Protective Clothing for Emergency Medical Operations NFPA 1999 FP
Standard for the Installation of Stationary Pumps for Fire Protection NFPA 20 FP
Standard on Clean Agent Fire Extinguishing Systems NFPA 2001 FP
Standard on Flame-Resistant Garments for Protection of Industrial Personnel Against Flash Fire
NFPA 2012 FP
Standard for Smoke and Heat Venting NFPA 204 FP
Standard on Selection, Care, Use, and Maintenance of Flame-Resistant Garments for Protection of Industrial Personnel Against Flash Fire
NFPA 2113 FP
Standard for Water Tanks for Private Fire Protection NFPA 22 FP
Standard on Types of Building Construction NFPA 220 FP
Standard for High Challenge Fire Walls, Fire Walls, & Fire Barrier Walls NFPA 221 FP
Standard for the Protection of Records NFPA 232 FP
Standard for the Installation of Private Fire Service Mains and Their Appurtenances NFPA 24 FP
Standard for Safeguarding Construction, Alteration, and Demolition Operations NFPA 241 FP
DESCRIPTION STANDARD AREA Standard for the Inspection, Testing, and Maintenance of Water-Based Fire Protection Systems
NFPA 25 FP
Standard Methods of Tests of Fire Resistance of Building Construction and Materials NFPA 251 FP
Standard Methods of Fire Tests of Door Assemblies NFPA 252 FP
Standard Method of Test for Critical Radiant Flux of Floor Covering Systems Using a Radiant Heat Energy Source
NFPA 253 FP
Standard Method of Test of Surface Burning Characteristics of Building Materials NFPA 255 FP
Recommended Practice for Fire Flow Testing and Marking of Hydrants NFPA 291 FP
Flammable and Combustible Liquids Code NFPA 30 FP
Fire Protection Standard for Pleasure and Commercial Motor Craft NFPA 302 FP
Standard for the Control of Gas Hazards on Vessels NFPA 306 FP
Standard for the Construction and Fire Protection of Marine Terminals, Piers, and Wharves NFPA 307 FP
Standard for the Safeguarding of Tanks and Containers for Entry, Cleaning, or Repair NFPA 326 FP
Recommended Practice for Handling Releases of Flammable and Combustible Liquids and Gases
NFPA 329 FP
Standard for the Installation and Use of Stationary Combustion Engines and Gas Turbines NFPA 37 FP
Standard for Tank Vehicles for Flammable and Combustible Liquids NFPA 385 FP
Standard for Heliports NFPA 418 FP
Code for the Storage of Liquid and Solid Oxidizers NFPA 430 FP
Standard on Fire Protection for Laboratories Using Chemicals NFPA 45 FP
Standard for Professional Competence of Responders to Hazardous Materials/Weapons of Mass Destruction Incidents
NFPA 472 FP
Standard for Competencies for EMS Personnel Responding to Hazardous Materials/WMD Incidents
NFPA 473 FP
Explosive Materials Code NFPA 495 FP
Recommended Practice for the Classification of Flammable Liquids, Gases, or Vapors and of Hazardous (Classified) Locations for Electrical Installations in Chemical Process Areas
NFPA 497 FP
Building Construction and Safety Code NFPA 5000 FP
Fire Safety Standard for Powered Industrial Trucks Including Type Designations, Areas of Use, Conversions, Maintenance, and Operation
NFPA 505 FP
Standard for Fire Prevention During Welding, Cutting, and Other Hot Work NFPA 51B FP
National Fuel Gas Code NFPA 54 FP
Compressed Gases and Cryogenic Fluids Code NFPA 55 FP
Guide to the Fire Safety Concepts Tree NFPA 550 FP
Liquefied Petroleum Gas Code NFPA 58 FP
Standard on Industrial Fire Brigades NFPA 600 FP
Standard for Security Services in Fire Loss Prevention NFPA 601 FP
National Electrical Code NFPA 70 FP, IS
Standard for Fire Retardant Treated Wood and Fire Retardant Coatings for Building Materials
NFPA 703 FP
Standard System for the Identification of the Hazards of Materials for Emergency Response
NFPA 704 FP
Recommended Practice for Electrical Equipment Maintenance NFPA 70B FP
Standard for Electrical Safety in the Workplace NFPA 70E FP
National Fire Alarm and Signaling Code NFPA 72 FP
Standard for the Protection of Information Technology Equipment NFPA 75 FP
Standard on Water Mist Fire Protection Systems NFPA 750 FP
Recommended Practice on Static Electricity NFPA 77 FP
Standard for the Installation of Lightning Protection Systems NFPA 780 FP

DESCRIPTION STANDARD AREA Electrical Standard for Industrial Machinery NFPA 79 FP
Standard for Fire Doors and other Opening Protectives NFPA 80 FP
Recommended Practice for Protection of Buildings from Exterior Fire Exposures NFPA 80A FP
Standard for Fire Protection in Wastewater Treatment and Collection Facilities NFPA 820 FP
Standard Classifications for Incident Reporting and Fire Protection Data NFPA 901 FP
Standard for the Installation of Air-Conditioning and Ventilating Systems NFPA 90A FP
Standard for the Installation of Warm Air Heating and Air-Conditioning Systems NFPA 90B FP
Guide for Fire and Explosion Investigations NFPA 921 FP
Standard for Smoke-Control Systems Utilizing Barriers & Pressure Differences NFPA 92A FP
SPR Qualified Products List No number PP,HW, CS
DM/AGT cooling water discharge agreement No Number CW
Construction of Geotechnical Boreholes and Groundwater Monitoring Systems Handbook (LDOTD and LDEQ)
No number CW
DM, DOE, and AGSC Standard Environmental Contract Boilerplate No Number MO
Environmental, Safety, and Health Management Plan (FY 1998 - FY 2002) No number MO,MR
SPRPMO Level III Design Criteria No number MO, MR
Earth Manual, 3rd Ed., U.S. Department of the Interior, Bureau of Reclamation No number CW
Louisiana’s Suggested Chemical Weed Control Guide for 1994 (LA Cooperative Extension Services)
No number CW
The Sterling Brine Handbook (Int’l Salt Co.) No number CW
Membership in Clean Texas Program http://www.cleantexas.org/index.cfm No number MR
Technical Guidance Package for Chemical Sources, Storage Tanks, TCEQ, Feb 2001 No number CA
Membership in Louisiana Environmental Leadership Program (LaELP) http://www.deq.state.la.us/assistance/elp
No number MR
Organizational and Management Assessments NOI 1000.72 MR
Pipkin Ranch Road use restrictions in emergencies Pipkin Ranch Road EM
Mississippi DWFP Nuisance Animals Public Notice LE-3799 and LEI 3799
MR
Louisiana Department of Environmental Quality Risk Evaluation/Corrective Action Program RECAP (2003) CW
Pollution Prevention Assessment Manual RG-133 PP
Summary of Work S# 01010 MR
Demolition of Facilities S# 02050 MR
Excavation, Backfilling, & Compaction S# 02222 MR
Dikes & Embankments S# 02223 MR
Roadways (Texas) S# 02230 MR
Roadways (Louisiana) S# 02233 MR
Drilled and Belled Concrete Piers S# 02362 MR
Piles and Pile Driving S# 02364 MR
Steel Sheet Piling S# 02369 MR
Fences & Gates S# 02444 MR
Sensor - Compatible Fences and Gates S# 02445 MR
Signage S# 02450 MR
Seeding S# 02485 MR
Asphaltic Concrete Pavement S# 02513 MR
Asphaltic Concrete Pavement (Louisiana) S# 02514 MR
Cast-In-Place Concrete S# 03300 MR
Shotcrete S# 03361 MR
Grout S# 03600 MR
Brick Masonry S# 04210 MR
Concrete Unit Masonry S# 04220 MR Structural Steel green S# 05120 MR

DESCRIPTION STANDARD AREA Metal Roof Deck S# 05310 MR
Rough Carpentry S# 06100 MR
Finish Carpentry S# 06200 MR
Vinyl Sheet Piles S# 06521 MR
Rigid Insulation S# 07212 MR
Built-Up Bituminous Roofing S# 07510 MR
Aluminum Clad Flashing Membrane S# 07550 MR
Fluid Applied Roofing S# 07560 MR
Sealants & Caulking S# 07920 MR
Metal Doors & Frames S# 08100 MR
Flush Wood Doors S# 08211 MR
Hurricane Windows S# 08520 MR
Glass & Glazing S# 08800 MR
Gypsum Wallboard S# 09250 MR
Ceramic Tile S# 09310 MR
Resilient Rubber Flooring S# 09650 MR
Resilient Tile Flooring S# 09660 MR
Carpet - Glue Down S# 09688 MR
Epoxy Flooring S# 09722 MR
Interior Painting S# 09900 MR
Painting (Buildings) S# 09901 MR
Metal Toilet Partitions S# 10162 MR
Toilet Room Accessories S# 10800 MR
Prefabricated Industrial/Commercial Metal Building S# 13121 MR
Modular Insulated Building S# 13126 MR
Prefabricated Metal Shelter/Housing S# 13127 MR
Prefabricated Fiberglass Shelter/Housing S# 13128 MR
Duct Insulation S# 15258 MR
Plumbing Systems S# 15400 MR
Plumbing Fixtures & Trim S# 15450 MR
Air Cooled Condensing Unit S# 15695 MR
Packaged Terminal Air Conditioners S# 15731 MR
Conduit S# 16111 MR
Lighting S# 16510 MR
DOE Policy on Signatures of RCRA Permit Applications SEN-22-90 HW
Nonhazardous Solid Waste Management Regulations and Criteria (Mississippi) SW-2 HW
Texas Tier Two Reporting Forms and Instructions TCRA, 505-507 SARA Title III
CS
Special Licenses and Permits TPWC Chapter 43 MR
Birds; Protection of Nongame Birds; Destroying Nests or Eggs TPWC Chapter 64 MR
Alligators TPWC Chapter 65 MR
Disposition of Protected Wildlife TPWC Section 43.024 MR
Alligators in Texas: Rules, regulations, and general information, 2006-2007 TPWD MR
Texas Regulations for Control of Radiation - General provisions TRCR part 11 RP
Texas Regulations for Control of Radiation - Fees TRCR part 12 RP
Texas Regulations for Control of Radiation - Hearing and Enforcement Procedures TRCR part 13 RP
Standards for Protection Against Radiation - Permissible Doses, Precautionary Procedures, Waste Disposal
TRCR part 21 RP
Notices, Instructions and Reports to Workers; Inspections TRCR part 22 RP
Radiation Safety Requirements and Licensing and Registration Procedures for Industrial Radiography
TRCR part 31 RP
DESCRIPTION STANDARD AREA Licensing of Radioactive Material -Exemptions, Licenses, General Licenses, Specific Licenses, Reciprocity, Transport
TRCR part 41 RP
State Fire Marshall (Explosives) TX Statute Chapter 417 State Fire Marshall
FP
Fire Protection Engineering for Facilities UFC 3-600-01 FP
International Conference of Building Officials - Uniform Building Code and Uniform Fire Code
UFC/UBC FP
Underwriter’s Laboratory - Building Materials, Fire Resistance, Fire Prot. Equip., & Haz. Location Equip. Directories
UL FP
West Hackberry Emergency Response Procedures WHI 5500.9 EM,FP
West Hackberry Spill Prevention, Control, and Countermeasures Plan WHL 5400.20 CW

AAA9020459 Version 1.0 Appendix A2
Appendix A2
SPRPMO ES&H Directives

This page intentionally blank

AAA9020459 Version 1.0 Appendix A2 - Page 1
SPRPMO ES&H Directives
.
Directive
Description
DOE O 151.1C Comprehensive Emergency Management System
DOE O 225.1B Accident Investigations
DOE O 231.1B Environment, Safety and Health Reporting
DOE O 420.1B Change 1 Facility Safety
DOE O 422.1 Conduct of Operations
DOE O 430.1B
Change 1
Change 2
Real Property Asset Management
DOE O 436.1 Departmental Sustainability
DOE O 440.2C Aviation Management Safety
DOE O 460.1C Packaging and Transportation Safety
DOE O 460.2A Departmental Materials Transportation and Packaging Management
DOE M 231.1-2 Occurrence Reporting and Processing of Operations Information
DOE M 440.1-1A DOE Explosives Safety Manual
DOE M 450.4-1 Integrated Safety Management System Manual
DOE P 450.4A Safety Management System Policy
SPRPMO O 231.1A
Change 1
Change 2
Occurrence Reporting and Processing System
SPRPMO O 420.1B Conduct of Operations Requirements for SPR Facilities
SPRPMO O 440.2B Aviation Implementation Plan
SPRPMO O 451.1C National Environmental Policy Act Implementation Plan

AAA9020459 Version 1.0 Appendix A2 - Page 2
SPRPMO ES&H Directives
Directive Description
SPRPMO P 451.1C SPR Environmental Policy
SPRPMO N 450.5B Strategic Petroleum Reserve Environmental, Security, Safety & Health, and Emergency Preparedness Goals FY2011
SPRPMO M 450.1-1B Environmental Safety and Health Manual

AAA9020459 Version 1.0 Appendix B
Appendix B DOE Policy SPRPMO Policy 451.1C, “Environmental Policy Statement” DM Policy ASP5400.2, “Environmental Policy”

AAA9020459 Version 1.0 Appendix B This page intentionally blank

DISTRIBUTION: All SPR Employees
INITIATED BY:
U. S. Department of Energy STRATEGIC PETROLEUM RESERVE PROJECT MANAGEMENT OFFICE New Orleans, La.
POLICY
SPRPMO P 451.1C
APPROVED: 02/18/09
SUBJECT: SPR ENVIRONMENTAL POLICY
1. PURPOSE AND SCOPE. This environmental policy applies to the facilities and pipelines
that comprise the Strategic Petroleum Reserve (SPR). The mission of SPR is to store petroleum and maintain drawdown readiness. Protection of the environment, workers, and the public are responsibilities of paramount importance. To control environmental impact, the goal of the Department of Energy (DOE) and SPR contractors is to design, develop, construct, operate, and maintain facilities and operations in a manner that shall be resource-efficient and will protect the quality of the environment consistent with our mission. Environmental protection will be integrated at all management levels and into all phases of activity.
This environmental policy is implemented by SPR top management through an environmental management system (EMS) under an integrated safety management umbrella.
2. POLICY STATEMENT. The SPR operates only in an environmentally responsible
manner.
Environmentally responsible manner means that top management pledges all functional levels will:
a. Comply with applicable Federal, state, and local environmental legal, regulatory, and
other requirements which relate to the environmental aspects of SPR activities; b. Prevent pollution by undertaking measures to prevent the generation of wastes, and
other residual materials requiring disposal or release to the environment through recycling, reuse, and source reduction. Where the generation of such wastes cannot be avoided, the SPR Project Management Office (PMO) will take action to reduce their volume and toxicity and ensure proper disposal; and
c. Continually improve environmental performance via the EMS and by establishing
and maintaining documented environmental objectives and targets.

AAA9020459 Version 1.0 Appendix B – Page 1
DISTRIBUTION: All SPRPMO Employees
INITIATED BY:
UNOFFICIAL
This Environmental Policy provides the framework for setting and reviewing
environmental objectives and targets that assure excellence in environmental management. It is communicated to all persons working for or on behalf of the SPR, and is available on request at all SPR facilities and electronically on-line at www.spr.doe.gov and www.dynmcdermott.com.
The SPR Environmental, Safety and Health Division of Technical Assurance is
responsible for prompting the periodic review of this Policy by DOE and DynMcDermott Petroleum Operations Company top management as well as its update.
William C. Gibson, Jr. Project Manager Strategic Petroleum Reserve
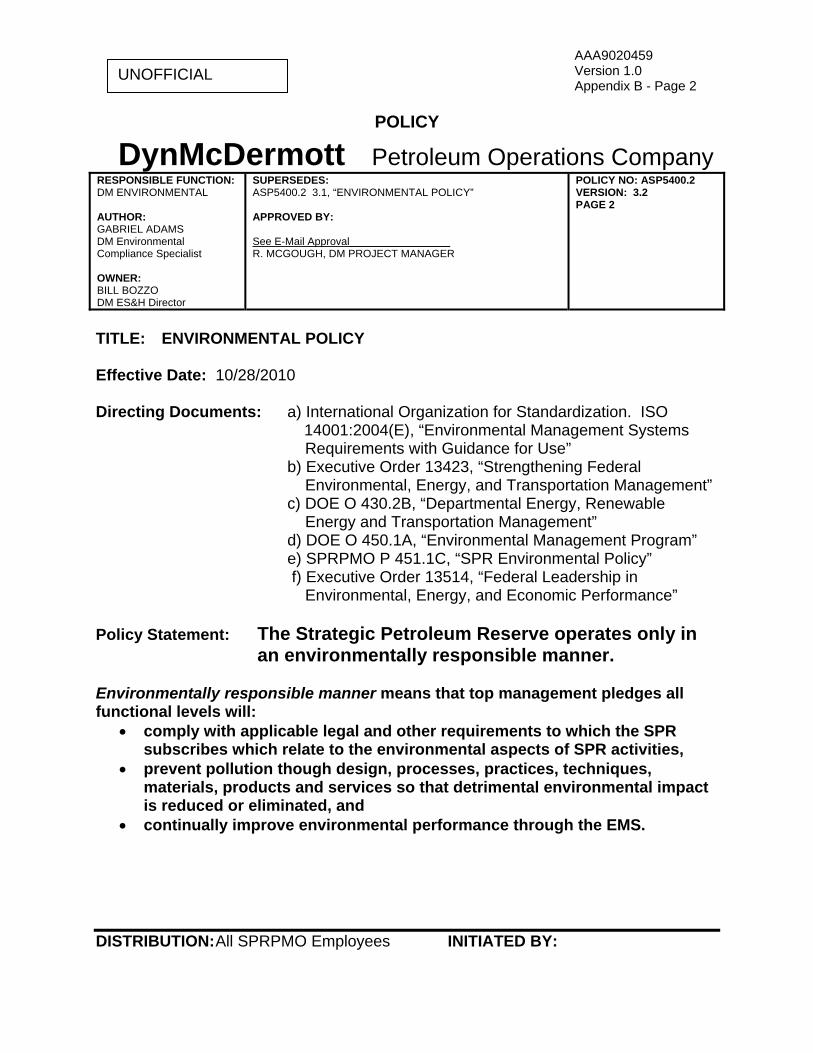
AAA9020459 Version 1.0 Appendix B - Page 2
DISTRIBUTION: All SPRPMO Employees
INITIATED BY:
UNOFFICIAL
POLICY
DynMcDermott Petroleum Operations Company RESPONSIBLE FUNCTION: DM ENVIRONMENTAL AUTHOR: GABRIEL ADAMS DM Environmental Compliance Specialist OWNER: BILL BOZZO DM ES&H Director
SUPERSEDES: ASP5400.2 3.1, “ENVIRONMENTAL POLICY” APPROVED BY: See E-Mail Approval_________________ R. MCGOUGH, DM PROJECT MANAGER
POLICY NO: ASP5400.2 VERSION: 3.2 PAGE 2
TITLE: ENVIRONMENTAL POLICY Effective Date: 10/28/2010 Directing Documents: a) International Organization for Standardization. ISO 14001:2004(E), “Environmental Management Systems Requirements with Guidance for Use” b) Executive Order 13423, “Strengthening Federal Environmental, Energy, and Transportation Management” c) DOE O 430.2B, “Departmental Energy, Renewable Energy and Transportation Management” d) DOE O 450.1A, “Environmental Management Program” e) SPRPMO P 451.1C, “SPR Environmental Policy” f) Executive Order 13514, “Federal Leadership in Environmental, Energy, and Economic Performance” Policy Statement: The Strategic Petroleum Reserve operates only in
an environmentally responsible manner. Environmentally responsible manner means that top management pledges all functional levels will:
comply with applicable legal and other requirements to which the SPR subscribes which relate to the environmental aspects of SPR activities,
prevent pollution though design, processes, practices, techniques, materials, products and services so that detrimental environmental impact is reduced or eliminated, and
continually improve environmental performance through the EMS.

AAA9020459 Version 1.0 Appendix B - Page 3
DISTRIBUTION: All SPRPMO Employees
INITIATED BY:
UNOFFICIAL
This environmental policy is implemented by top management of DynMcDermott Petroleum Operations Company (DM) through an environmental management system (EMS) under an integrated safety management (ISM) umbrella. This environmental policy applies to the facilities and pipelines comprising the Strategic Petroleum Reserve (SPR) and managed and operated by DM. The mission of the SPR is to store petroleum and maintain drawdown readiness. Protection of the environment, workers, and the public are responsibilities of paramount importance. To control environmental impact, DM and its contractors who work at the SPR endorse environmental protection at all management levels and integrate it into all phases of activity – from concept, design, development, and construction, to operation, maintenance, and decommissioning. This environmental policy provides the framework for setting and reviewing environmental objectives and targets that assure excellence in environmental management. It aligns with the DOE SPR Environmental Policy (SPRPMO P 451.1C) which is communicated to all persons working for or on behalf of the SPR by DOE. This DM Environmental Policy is available on request at all SPR facilities and electronically on-line at www.dynmcdermott.com . Functional Oversight: The DM Environmental Department is responsible for assuring the periodic review of this policy by DM top management as well as its update.
Version History – Significant Changes
Version Description Effective Date 3.2 Added additional driver of EO 13524 which
extends and enhances the previously incorporated EO 13423.
10/28/2010
3.1 The SPR Environmental Policy (SPRPMO P 451.1C) was added as a directing document. Minor revisions were made to focus the scope of the policy on DM and DM contractors. This policy also aligns with and supports the DOE SPR Environmental Policy. History description for version B0 was added.
12/7/09
3.0 This is a complete revision structured after policy requirements set by ISO 14001:2004 standard with respective information from previous DOE and DM environmental policies.
12/9/08

AAA9020459 Version 1.0 Appendix B - Page 4
DISTRIBUTION: All SPRPMO Employees
INITIATED BY:
UNOFFICIAL
Version History – Significant Changes
Version Description Effective Date 2.0 Minor revisions were made to the scope of the
policy and to align this policy with the DOE Environmental Policy (SPRPMO P 451.1B) and the DOE ES&H Manual (SPRPMO M 450.1-1A).
11/29/07
1.0 Versioning was changed to 1.0 in concert with requirements of the new Documentum document management system. In Section A., misuse of resources was added as a negative environmental impact, and environmental enhancement was added as a means of creating positive environmental impact.
11/21/06
K1 Minor revisions include deletion of “Draft” from header on pages 2 through 4 of the document and addition of effective date for K0 on this version history table. No significant content changes were made. Revision bars from the K0 version were left in this version.
12/20/05
K0 Policy was revised to support requirements of the ISO 14001:2004 Standard.
12/02/05
J0 Policy was re-formatted in accordance with the DM Document Control and Management Program. Functional oversight for the policy was added. The policy is now more accessible to the Public through the DM website (added web address in paragraph D).
12/15/04
I0 Added wording that more explicitly states that DM will be involved in community environmental outreach in section B. Revision bars in the right margin mark the changed paragraphs.
12/05/03
H0 Added wording that more clearly states: top management’s commitment to compliance and continual improvement (see B below), the framework for establishing and reviewing objectives and targets (C), and requirements for revision of the policy (E). Revision bars in the right margin mark the changed paragraphs.
11/11/02
G0 Deleted specific responsibilities from this document and revised to contain only policy information. The deleted information is covered in other documents.
11/29/01

AAA9020459 Version 1.0 Appendix B - Page 5
DISTRIBUTION: All SPRPMO Employees
INITIATED BY:
UNOFFICIAL
Version History – Significant Changes
Version Description Effective Date F0 Changed “ES&H’ to “ES&Q”. Deleted section 4.J,
Quality Assurance, and moved 4.J.[1] under 4.B, ES&Q Director. Changed the term “independent assessment” under 4.J.[1] to “management appraisal”. Deleted section 4.M., Information Systems. Other minor changes were made to sentence structure. Changed paragraphs are marked with a revision bar in the right margin.
5/01/01
E0 Combined subsections 3.3.B and 3.3.C into a single paragraph entitled Prevention of Pollution and added the words “prevent pollution” to 3.2. Expanded wording in 3.3.D., Compliance, regarding other requirements. In section 4, responsibilities, added environmental management system representative and general responsibilities. Changed paragraphs are marked with a revision bar in the right margin.
4/28/00
D0 Added the following policy statement “DynMcDermott operates only in an environmentally responsible manner.” (3.1) Added 4.C.[1]h. which states that the environmental manager will “assign a person to fill the role of environmental management system coordinator.” Changed paragraphs are marked with a revision bar in the right margin.
2/10/00
C0 Completely revised in a new format. Revised the reference list. Incorporated material to conform to the ISO 14001 standard. Incorporated policy on waste management in section 3. Added project manager responsibilities. Added environmental manager responsibility. Added Human Resources and Development and Information Systems responsibilities. Added responsibilities of managers and employees. Changed paragraphs are marked with a revision bar in the right margin.
7/27/98

AAA9020459 Version 1.0 Appendix B - Page 6
DISTRIBUTION: All SPRPMO Employees
INITIATED BY:
UNOFFICIAL
Version History – Significant Changes
Version Description Effective Date B0 Revised the reference list and added definitions.
Incorporated recent regulatory pollution prevention guidelines. Added policy on waste management. Changed project manager responsibilities to ES&H director. Revised responsibilities of the environmental manager and Operations and Maintenance. Added responsibilities for Engineering and Construction and Quality Assurance. Placed responsibilities of the subcontract manager’s technical representative in a separate list.
10/18/96
A0 New document. 12/17/93
END OF DOCUMENT
End of Appendix

AAA9020459 Version 1.0 Appendix C
Appendix C
ENVIRONMENTAL MANAGEMENT SYSTEM
ENVIRONMENTAL MANAGEMENT PROGRAMS
for 2011

AAA9020459 Version 1.0 Appendix C – Page 1
Environmental Objective Implementation
1. Reduce permit exceedances reported on the Discharge Monitoring Reports.
Personnel involved with activities that involve environmental permits are made aware of permit limitations that can be affected by their activities. Communication is key to awareness. Improvement can be made in understanding and communicating up front with those involved the permit requirements associated with an activity before the activity is performed. When an exceedance occurs, it is addressed formally, in real time, in an Occurrence Report. The report form prompts a description of the occurrence, cause, and corrective action. To provide awareness and promote corrective action, the information is also provided monthly in a report to the DM project manager and to upper management for discussion at the monthly project review meeting.
2. Avoid cited Clean Water Act, Clean Air Act, and RCRA (waste) enforcement actions (notices of violations)
Awareness is provided to site personnel through annual spill prevention and waste management training. To promote improvement, spills and excursions that have occurred on the SPR since the last training session are discussed. Reportable releases are documented and managed like permit exceedances. Waste accumulation areas are inspected weekly and waste inventories are conducted monthly to assure compliance with accumulation requirements. Waste reports are reviewed monthly for compliance issues by ES&H managers and the New Orleans waste management specialist.
3. Reduce reportable occurrences of releases from operational facilities
The number of reportable spills has been reduced through a combination of spill awareness by personnel, systematic preparation for activities that can cause a spill and the upgrade of equipment that can fail and cause a release. Emphasis continues to be placed on personnel behavior, procedures, and equipment to minimize mishaps. Releases are documented and reviewed in the same manner as permit exceedances and violations to the Clean Air and Clean Water Acts.
4. Reduce total amount of hazardous waste generated. The types of wastes that make up the hazardous waste stream have been examined, and the processes that contribute to the waste stream have been evaluated and modified if needed to reduce or eliminate waste.
5. Reduce total amount of sanitary waste generated. Waste generation at all sites is characterized and tracked. Waste reduction and recycling efforts are discussed quarterly via conference calls with site P2 advocates to promote and enforce waste reduction.
6. Increase recycling of sanitary waste through waste diversion.
Office wastes that can be recycled reasonably are diverted from trash cans and placed in recycle bins. Bulk and prevailing components of the sanitary waste stream (i.e. cardboard) are scrutinized for recycling potential. Other waste components are recycled when accepted by those recyclers approved by DM to receive SPR materials. Emphasis is placed on bulk materials from construction activities that could be recycled.
7. Increase purchasing of EPA designated recycled content products (affirmative procurement).
Affirmative procurement (AP) performance has improved through increased awareness of the AP procurement program, increased awareness of those products identified by EPA as AP, and the identification of more vendors who can provide products that meet AP criteria. AP awareness training is provided to all DM personnel on hire and at least every two years thereafter. AP is also discussed with P2 advocates during quarterly P2 conference calls.
8. Increase purchasing of biobased products. The purchase of biobased products is the same as that for AP.

AAA9020459 Version 1.0 Appendix C – Page 2
Environmental Objective Implementation
9. Increase use of the Qualified Products List (QPL). Chemical products are screened for environmental issues prior to purchase reduce the risk of hazardous waste generation later when used, promote efficient product use, and decrease unnecessary user exposure. Product requestors select chemical products previously approved on the QPL or obtain the approval of an unlisted product from the Environmental Department in New Orleans before purchasing. Awareness of the program and how to use the QPL has been increased to bolster program success.
10. Review all purchase requests, designs, summaries of work, and other documents sent to Environmental Department for review.
Each department has a focal point for receiving documents for review. The documents are distributed by the focal point to subject matter experts for review and comment.
11. Submit environmental documents on time to DOE and regulators (timeliness and quality).
Milestone dates for document completion are agreed upon with environmental personnel prior to discussion with DOE and their subsequent establishment. Document milestones are tracked by environmental personnel weekly via DM’s Summary of Significant Environmental Impacts and Activities Report and quarterly for DM’s performance evaluation by DOE.
12. In managing the Piping and Pipeline Assurance program, submit annual Pipeline and Piping Integrity reports by 10/31/10 for the previous fiscal year.
Piping and pipeline assurance reports document pipe integrity assessments. These assessments support spill prevention. They report significant pipeline and piping activities, problems, deficiencies, and concerns. They also report on repairs or inspections of deficiencies and proposed inspections, studies, and repairs to determine piping and pipeline conditions.
13. Ensure key emergency equipment is available. Each site has key emergency equipment that is tailored to site conditions. The equipment is inventoried quarterly by the site’s fire protection/emergency management specialist. Any operational discrepancies are noted and corrective action is taken.
14. Ensure basic ordering agreements are in place for spill response and clean up at each site.
DM has a sufficient number of agreements with spill response contractors to ensure at least one and preferably two or more are available at any time for call-out. When choosing contractors, factors such as company location, availability/type of equipment, and availability of manpower are considered. Effort continues to be made to partner with contractors with the resources that ideally suit the SPR sites. The contractors are also called out to participate in annual drills where their performance is evaluated.
15. Ensure emergency preparedness and response capabilities through training Emergency Response Team (ERT) members.
Each site has a group of well-trained ERT personnel who can respond to emergencies such as spills and fires. Training is budgeted annually by the New Orleans Emergency Preparedness (NOEP) department. New ERT members receive 40 hours of fire training and 40 hours of HazMat level training at an independent off-site training facility that is evaluated and certified by the NOEP department. Refresher training is provided annually with pertinent topics covered within a three-year cycle and specific topics receiving more emphasis than others. Unannounced and scheduled site drills are also conducted at each site to test skills, tactics, and strategies.
16. Successfully complete Preparedness for Response Exercise Program (PREP) drills/exercises.
Formally implemented emergency fire, spill, and security exercises test communications, organizational abilities, strategies, and physical competence of personnel and equipment. Response by DM personnel and emergency response contractors is observed and evaluated by a team composed of DM and DOE personnel and outside interested parties such as state and federal regulators and environmental advisory team members. Exercises allow responders to apply their abilities and knowledge, test their equipment, and learn ways to improve their response.
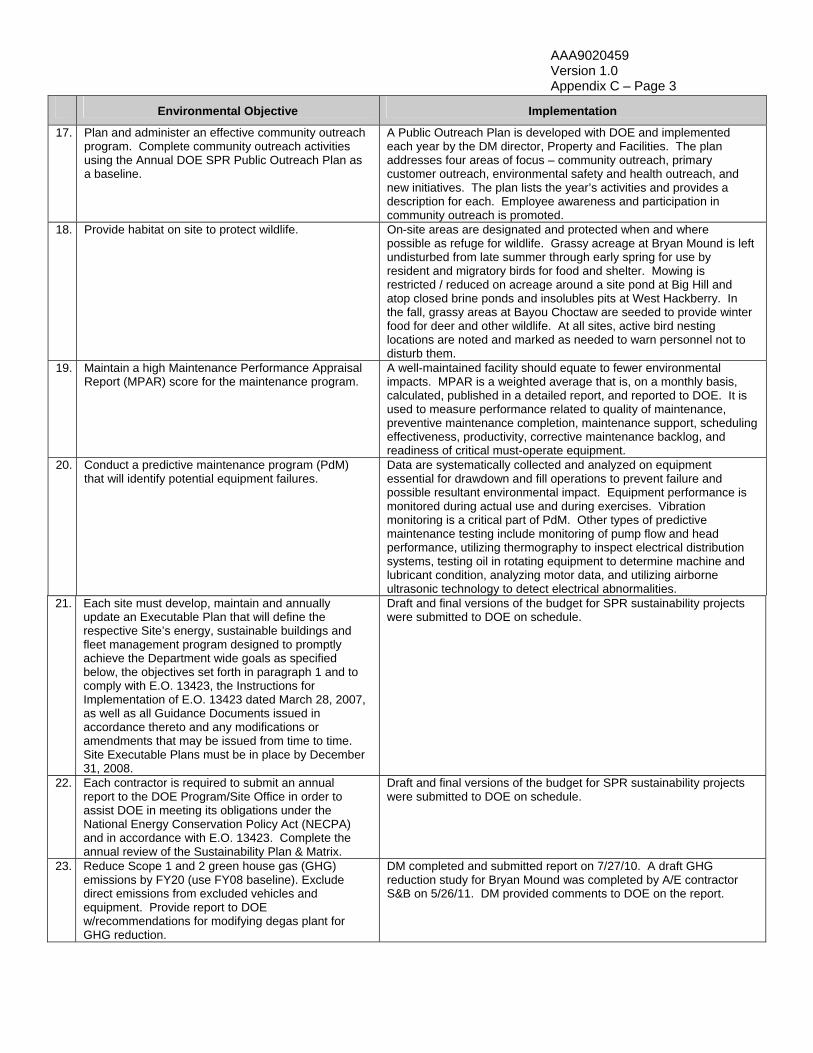
AAA9020459 Version 1.0 Appendix C – Page 3
Environmental Objective Implementation
17. Plan and administer an effective community outreach program. Complete community outreach activities using the Annual DOE SPR Public Outreach Plan as a baseline.
A Public Outreach Plan is developed with DOE and implemented each year by the DM director, Property and Facilities. The plan addresses four areas of focus – community outreach, primary customer outreach, environmental safety and health outreach, and new initiatives. The plan lists the year’s activities and provides a description for each. Employee awareness and participation in community outreach is promoted.
18. Provide habitat on site to protect wildlife. On-site areas are designated and protected when and where possible as refuge for wildlife. Grassy acreage at Bryan Mound is left undisturbed from late summer through early spring for use by resident and migratory birds for food and shelter. Mowing is restricted / reduced on acreage around a site pond at Big Hill and atop closed brine ponds and insolubles pits at West Hackberry. In the fall, grassy areas at Bayou Choctaw are seeded to provide winter food for deer and other wildlife. At all sites, active bird nesting locations are noted and marked as needed to warn personnel not to disturb them.
19. Maintain a high Maintenance Performance Appraisal Report (MPAR) score for the maintenance program.
A well-maintained facility should equate to fewer environmental impacts. MPAR is a weighted average that is, on a monthly basis, calculated, published in a detailed report, and reported to DOE. It is used to measure performance related to quality of maintenance, preventive maintenance completion, maintenance support, scheduling effectiveness, productivity, corrective maintenance backlog, and readiness of critical must-operate equipment.
20. Conduct a predictive maintenance program (PdM) that will identify potential equipment failures.
Data are systematically collected and analyzed on equipment essential for drawdown and fill operations to prevent failure and possible resultant environmental impact. Equipment performance is monitored during actual use and during exercises. Vibration monitoring is a critical part of PdM. Other types of predictive maintenance testing include monitoring of pump flow and head performance, utilizing thermography to inspect electrical distribution systems, testing oil in rotating equipment to determine machine and lubricant condition, analyzing motor data, and utilizing airborne ultrasonic technology to detect electrical abnormalities.
21. Each site must develop, maintain and annually update an Executable Plan that will define the respective Site’s energy, sustainable buildings and fleet management program designed to promptly achieve the Department wide goals as specified below, the objectives set forth in paragraph 1 and to comply with E.O. 13423, the Instructions for Implementation of E.O. 13423 dated March 28, 2007, as well as all Guidance Documents issued in accordance thereto and any modifications or amendments that may be issued from time to time. Site Executable Plans must be in place by December 31, 2008.
Draft and final versions of the budget for SPR sustainability projects were submitted to DOE on schedule.
22. Each contractor is required to submit an annual report to the DOE Program/Site Office in order to assist DOE in meeting its obligations under the National Energy Conservation Policy Act (NECPA) and in accordance with E.O. 13423. Complete the annual review of the Sustainability Plan & Matrix.
Draft and final versions of the budget for SPR sustainability projects were submitted to DOE on schedule.
23. Reduce Scope 1 and 2 green house gas (GHG) emissions by FY20 (use FY08 baseline). Exclude direct emissions from excluded vehicles and equipment. Provide report to DOE w/recommendations for modifying degas plant for GHG reduction.
DM completed and submitted report on 7/27/10. A draft GHG reduction study for Bryan Mound was completed by A/E contractor S&B on 5/26/11. DM provided comments to DOE on the report.

AAA9020459 Version 1.0 Appendix C – Page 4
Environmental Objective Implementation
24. Improve energy efficiency and reduce greenhouse gas emissions through reduction of energy intensity by 3% annually through the end of fiscal year 2015, or 30% by the end of fiscal year 2015, relative to an energy baseline in fiscal year 2003.
The energy efficiency, reduction of greenhouse gas and energy intensity is tabulated at the end of the fiscal year 2011 when the SPR Site Sustainability Plan (SSP) Plan is updated with annual consumption numbers are totaled.
25. Within 15 months of EO 13514 (1/2011) complete comprehensive GHG inventory of Scope 1, 2, and specified Scope 3 emissions.
Completion of FY 2010 SPR Site Sustainability Plan provided insight in types of data needed for an inventory. The inventory was structured after requirements established for annual site sustainability plans. The inventory was completed in accordance with the FY 2012 Site Sustainability Plan Guidance.
26. Consider smart metering, identify if there is payback and if real time computing can be implemented.
Provide updated cost estimates by site for metering identified buildings to DOE. Completed 6/2/10
27. Adopt the California Appliance Efficiency regulations. Determine degree and scope of applicability of regulations. Determine how they could be included in our procurement process. Document results of investigation.
Regulations are not recommended for use; however, the California Energy Commission's appliance database is recommended for use. A link to the database was added to the SPR Buy It Green (BIG) List.
28. Increase telecommuting options SPR wide. Investigate and document additional means to support and promote telecommuting (i.e. instances where it is useful/preferred) and how it could be implemented to reduce energy consumption. Meetings with DOE were not successful due to conflicting priorities at DM and DOE. Meetings are critical in determining scope of telecommuting program. After the scope of telecommuting is clearly defined, recommendations for further action will occur in FY 2012.
29. Purchase greater than 3% of the total electrical site consumption in FY 2009, including process operations, in new Renewable Energy Credits (RECs). Ensure that at least half of the statutorily required renewable energy consumed by the agency in a fiscal year comes from new renewable sources.
The SPR wind credits are purchased as of 8/11/11. The purchase of FY 2011 RECs were purchased at 100% new wind credits which exceeds the statute of 50% new RECs and successfully exceeded the required purchased to satisfied the consumption of the required goals of EO Order 13423.
30. Agencies should conduct energy and water audits of at least 10 percent of facility square footage annually and conduct new audits at least every 10 years, thereafter. This audit requirement can be met by audits done in conjunction with ESPC or UESC projects.
Per DOE disapproval of CMCR 10-363 (Conduct FY 2011 Energy and Water Audit), the FY 11 energy and water audit was cancelled. However, an internal energy and water survey was implemented in June, 2011, at level of effort (LOE). Additionally, an ESCO conducted an SPR–wide audit in 2009.
31. Beginning in FY08, reduce water consumption intensity, relative to FY07 baseline water consumption, through life-cycle cost-effective measures by 2% annually through the end of the FY15 or 16% by the end of FY15.
New SPR portion of new BC potable water line was installed in FY 2010. Tie-in was complete by Iberville Parish in August 2011. Municipal water line and site distribution system were disinfected and brought on line. Site water well was properly plugged and abandoned. Switch to a municipal water supply will reduce water that would otherwise be needed to maintain the old on-site well-based water system.
32. Reduce potable water consumption 2%/FY through FY 2020, or 26% by end of FY 2020 (FY 2007 agency baseline) by implementing water management strategies including water efficient and low flow fixtures and efficient cooling towers. Incorporate efficient plumbing standards in all design and construction standard, leasing agreements, and renovation projects
Continue current processes. DOE building specs have been greened to reflect the water saving plumbing fixtures.
33. Require acquisition of goods and services using sustainable environmental practices, including acquisition of (a) bio-based, (b) environmentally preferable, recycled-content products, and use of paper of at least 30 percent post-consumer fiber content, (c) energy-efficient, and (d) water-efficient.
Ongoing LOE includes successful implementation of the Buy It Green (BIG) webpage and awareness campaign for purchasing green products.

AAA9020459 Version 1.0 Appendix C – Page 5
Environmental Objective Implementation
34. Create and maintain model programs and assist other agencies’ implementation efforts through outreach, promotion, guidance, and technical assistance.
DM (SPR M&O contractor) continues to play an active role in EFCOG. The DM Environmental Manager is the chair person for the environmental subgroup of the ES&H working group.
35. Reduce the quantity of toxic and hazardous chemicals and materials acquired, used, or disposed by the agency.
Additional organizational assessment support was provided. One additional person participates in all DM organizational assessments to evaluate management of chemical products. An audit checklist is utilized.
36. Continue EPCRA reporting. SARA Title III Tier Two (312 EPCRA) completed for CY2010.
37. DM will report against hazardous waste goals by fiscal year.
Final generation volume for FY11 hazardous waste is 230 lbs. This is only 51% of the FY11 target of 450 lbs. This total includes a projected volume for September as data is unavailable at time of this update.
38. No later than January 24, 2008, each agency, at all appropriate organizational levels including appropriate facilities, organizations, and acquisition activities, shall develop written goals and support actions to identify and reduce the release and use of toxic and hazardous chemicals and materials, including toxic chemicals, hazardous substances, ozone-depleting substances (ODSs), and other pollutants that may result in significant harm to human health or the environment. In identifying the list of toxic chemicals, hazardous substances, and other pollutants, each agency shall consider:
See below.
39. Quantity of the chemical or material in use by the agency.
Ongoing Activities: QPL and Chemical Inventory (LOE)
40. Human and/or environmental toxicity of the chemical.
Ongoing Activities: QPL and Chemical Inventory (LOE)
41. Potential for human and/or environmental exposure to the chemical or material.
The 2011 BM, BH, and WH Emergency Planning Hazard Assessment (EPHA) reports were completed and published in 2011. BC EPHA report will be completed in 2012.
42. Operate within air and water discharge permit limits established by regulating agencies.
On-going LOE activity.
43. EIQ Air pollutant emissions are tracked and EIQs maintained at BC, BH, BM, and WH. Air emissions are recalculated using EPA's AP-42, when facility changes are made. Annual emission reports submitted to states as required. H2S emissions monitored at fenceline (to determine public exposure) when a site activity such as oil spill, combined with specific meteorological conditions, could result in offsite emissions.
Completed in March 2011
44. Water effluent permit exceedances monitored, reported to agencies on DMRs, identified as EMS aspect, built into the Work Authorization Directive (WAD) with a target of no more than 2/qtr.
Zero permit exceedances in FY 2011.
45. Ensure reportable releases to the environment from operational facilities to be less than 3 annually.
Zero reportable releases in FY 2011.
46. Periodic analyses of soils are performed in conjunction with spill and construction activities.
On-going LOE activity.
47. Check for persistence of the chemical in the environment through on-going surveillance monitoring.
On-going LOE activity.

AAA9020459 Version 1.0 Appendix C – Page 6
Environmental Objective Implementation
48. Controls are available to manage identifiable risks.
Ongoing LOE activities, including SPR project-level risk assessment.
49. Impacts on mission capability and business costs.
On-going LOE activities such as Continuity of Operations Plan, Regulatory Review, SWOT, and Strategic Planning.
50. Existing environmental hazard lists such as priority chemicals identified by EPA’s Resource Conservation Challenge, and any agency-specific toxic or hazardous chemicals lists.
Ongoing LOE - EPA's Priority Chemicals continue to be addressed in QPL review and Environmental Instructions Manual. RCRA Challenge researched in 2010 and results indicate the SPR is addressing EPA’s Challenge, and other agency- specific toxic or hazardous chemicals lists when applicable.
51. The available substitutes for ODSs identified by EPA’s Significant New Alternatives Policy (SNAP) Program.
LOE Ongoing - EPA’s SNAP Program was evaluated in 2010. ODSs continue to be addressed via organizational assessments and Environmental Instructions Manual.
52. Contaminants identified by the U.S. Geological Survey as part of its National Reconnaissance of Emerging Contaminants.
Ongoing LOE Activity - part of QPL review
53. Where appropriate, regional- and watershed-based environmental improvement efforts such as the Chesapeake Bay Prioritized Chemicals of Concern Program, the Great Lakes Bi-national Strategy or local watershed efforts.
SPR Funds unavailable to donate. Employee volunteers continue to participate in outreach programs such as Beach Sweeps: Lake Pontchartrain (LA) and Bryan Beach (TX).
54. Continue ongoing activities such as the SPR Qualified Products List and the “Big” (Buy It Green) program. Continue EMS objective for 100% compliance with QPL and AP programs. Continue measuring/documenting QPL success during organizational assessments and AP success monthly.
QPL Compliance was 100% for Bryan Mound, Big Hill, Bayou Choctaw, and New Orleans/Stennis audits. QPL compliance was 98% for West Hackberry. Two excursions resulted from a DM subcontracted pesticide applicator using one non-approved product and a construction subcontractor using a non-approved product.
55. Complete annual SARA Title II Tier 2 reporting to state agencies.
SARA Report for 2010 was completed 2/15/2011.
56. By April 24, 2007, each agency shall establish and submit to the FEE solid waste diversion goals to be achieved by December 31, 2010. Where an agency has already established a goal and reported it to the FEE, it shall re-affirm to the FEE that the previous goal is still in effect. Agencies establishing a goal for the first time shall use FY 2000 as the base year.
Attain and maintain goals. Met FY11 P2 goals.
57. Each agency shall maintain waste prevention and recycling programs in all of its facilities in the most cost-effective manner possible, and where appropriate, leased facilities and facilities managed by the General Services Administration (GSA).
DM maintained P2 program and reported against sanitary waste goals by fiscal year. Recycle rate was 72%
58. Recycling programs shall comply with applicable Federal, State, and local recycling requirements and can include cooperative programs with other Federal facilities, State or local agencies, or non-profit organizations.
On-going.
59. Implement employee incentive programs to reward exceptional individual and team performance in increasing energy efficiency and water conservation, deploying renewable energy, minimizing waste, reducing utility costs, and reducing greenhouse gas emissions.
Budget was not available in FY11 for this program.
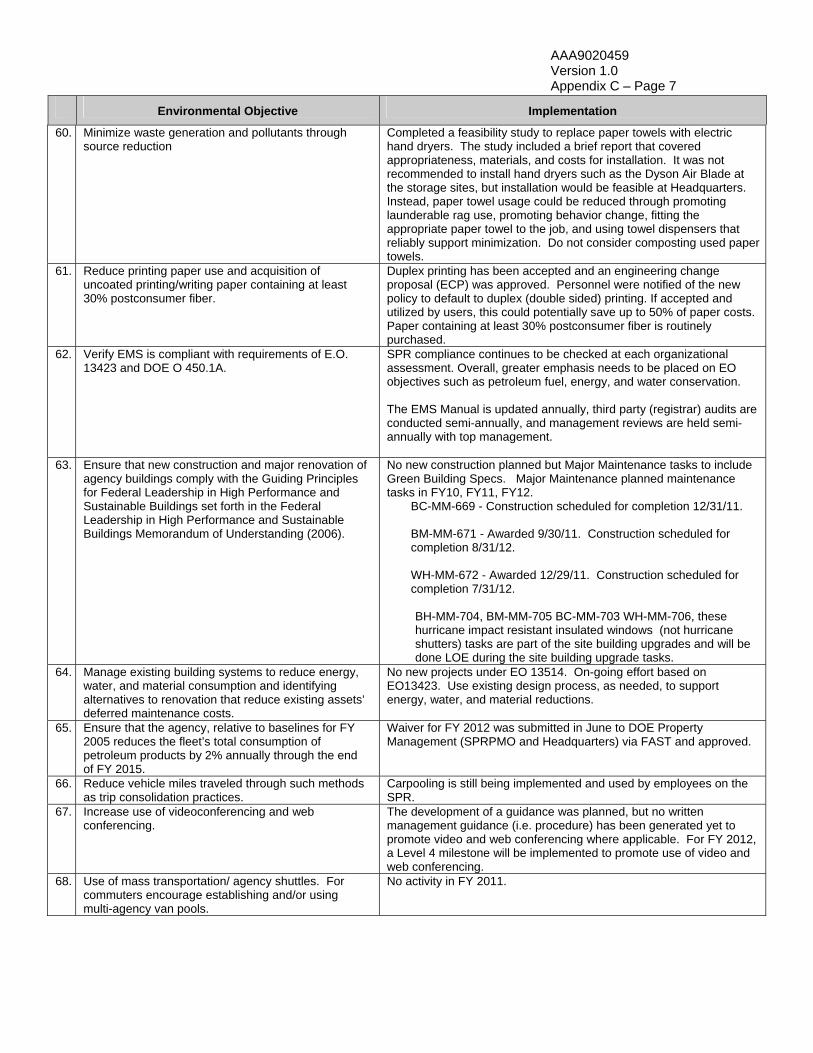
AAA9020459 Version 1.0 Appendix C – Page 7
Environmental Objective Implementation
60. Minimize waste generation and pollutants through source reduction
Completed a feasibility study to replace paper towels with electric hand dryers. The study included a brief report that covered appropriateness, materials, and costs for installation. It was not recommended to install hand dryers such as the Dyson Air Blade at the storage sites, but installation would be feasible at Headquarters. Instead, paper towel usage could be reduced through promoting launderable rag use, promoting behavior change, fitting the appropriate paper towel to the job, and using towel dispensers that reliably support minimization. Do not consider composting used paper towels.
61. Reduce printing paper use and acquisition of uncoated printing/writing paper containing at least 30% postconsumer fiber.
Duplex printing has been accepted and an engineering change proposal (ECP) was approved. Personnel were notified of the new policy to default to duplex (double sided) printing. If accepted and utilized by users, this could potentially save up to 50% of paper costs. Paper containing at least 30% postconsumer fiber is routinely purchased.
62. Verify EMS is compliant with requirements of E.O. 13423 and DOE O 450.1A.
SPR compliance continues to be checked at each organizational assessment. Overall, greater emphasis needs to be placed on EO objectives such as petroleum fuel, energy, and water conservation. The EMS Manual is updated annually, third party (registrar) audits are conducted semi-annually, and management reviews are held semi-annually with top management.
63. Ensure that new construction and major renovation of agency buildings comply with the Guiding Principles for Federal Leadership in High Performance and Sustainable Buildings set forth in the Federal Leadership in High Performance and Sustainable Buildings Memorandum of Understanding (2006).
No new construction planned but Major Maintenance tasks to include Green Building Specs. Major Maintenance planned maintenance tasks in FY10, FY11, FY12.
BC-MM-669 - Construction scheduled for completion 12/31/11. BM-MM-671 - Awarded 9/30/11. Construction scheduled for completion 8/31/12. WH-MM-672 - Awarded 12/29/11. Construction scheduled for completion 7/31/12.
BH-MM-704, BM-MM-705 BC-MM-703 WH-MM-706, these hurricane impact resistant insulated windows (not hurricane shutters) tasks are part of the site building upgrades and will be done LOE during the site building upgrade tasks.
64. Manage existing building systems to reduce energy, water, and material consumption and identifying alternatives to renovation that reduce existing assets’ deferred maintenance costs.
No new projects under EO 13514. On-going effort based on EO13423. Use existing design process, as needed, to support energy, water, and material reductions.
65. Ensure that the agency, relative to baselines for FY 2005 reduces the fleet’s total consumption of petroleum products by 2% annually through the end of FY 2015.
Waiver for FY 2012 was submitted in June to DOE Property Management (SPRPMO and Headquarters) via FAST and approved.
66. Reduce vehicle miles traveled through such methods as trip consolidation practices.
Carpooling is still being implemented and used by employees on the SPR.
67. Increase use of videoconferencing and web conferencing.
The development of a guidance was planned, but no written management guidance (i.e. procedure) has been generated yet to promote video and web conferencing where applicable. For FY 2012, a Level 4 milestone will be implemented to promote use of video and web conferencing.
68. Use of mass transportation/ agency shuttles. For commuters encourage establishing and/or using multi-agency van pools.
No activity in FY 2011.
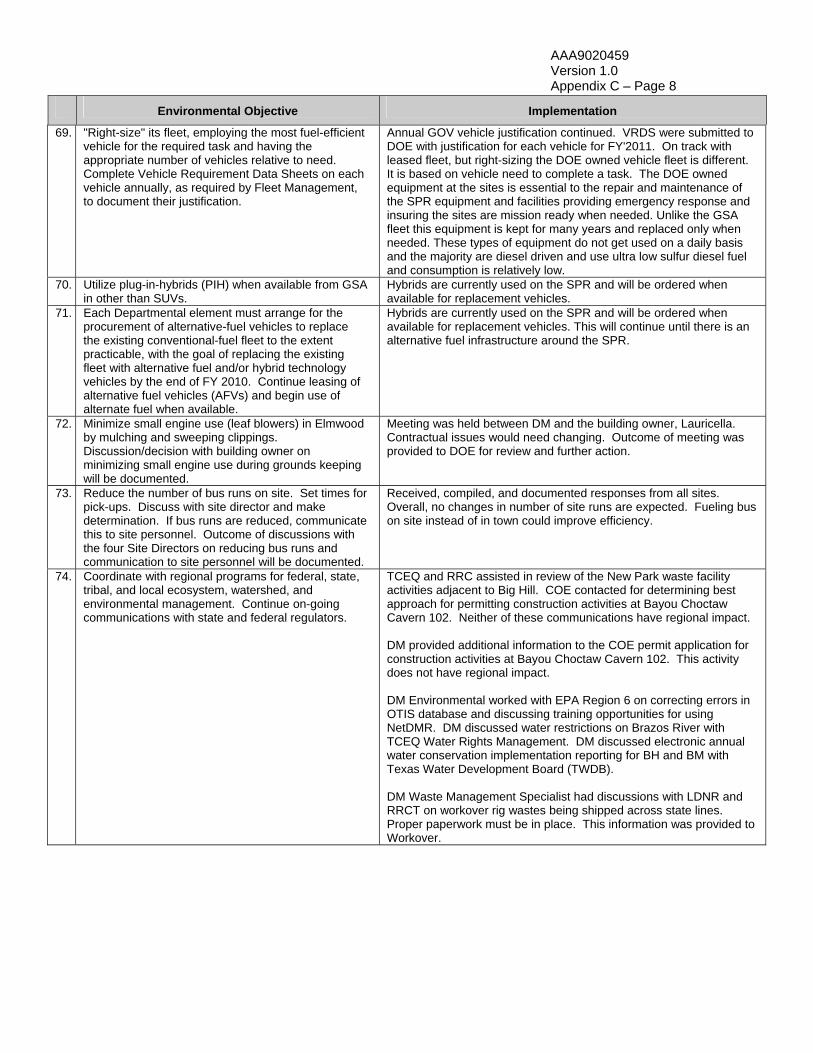
AAA9020459 Version 1.0 Appendix C – Page 8
Environmental Objective Implementation
69. "Right-size" its fleet, employing the most fuel-efficient vehicle for the required task and having the appropriate number of vehicles relative to need. Complete Vehicle Requirement Data Sheets on each vehicle annually, as required by Fleet Management, to document their justification.
Annual GOV vehicle justification continued. VRDS were submitted to DOE with justification for each vehicle for FY'2011. On track with leased fleet, but right-sizing the DOE owned vehicle fleet is different. It is based on vehicle need to complete a task. The DOE owned equipment at the sites is essential to the repair and maintenance of the SPR equipment and facilities providing emergency response and insuring the sites are mission ready when needed. Unlike the GSA fleet this equipment is kept for many years and replaced only when needed. These types of equipment do not get used on a daily basis and the majority are diesel driven and use ultra low sulfur diesel fuel and consumption is relatively low.
70. Utilize plug-in-hybrids (PIH) when available from GSA in other than SUVs.
Hybrids are currently used on the SPR and will be ordered when available for replacement vehicles.
71. Each Departmental element must arrange for the procurement of alternative-fuel vehicles to replace the existing conventional-fuel fleet to the extent practicable, with the goal of replacing the existing fleet with alternative fuel and/or hybrid technology vehicles by the end of FY 2010. Continue leasing of alternative fuel vehicles (AFVs) and begin use of alternate fuel when available.
Hybrids are currently used on the SPR and will be ordered when available for replacement vehicles. This will continue until there is an alternative fuel infrastructure around the SPR.
72. Minimize small engine use (leaf blowers) in Elmwood by mulching and sweeping clippings. Discussion/decision with building owner on minimizing small engine use during grounds keeping will be documented.
Meeting was held between DM and the building owner, Lauricella. Contractual issues would need changing. Outcome of meeting was provided to DOE for review and further action.
73. Reduce the number of bus runs on site. Set times for pick-ups. Discuss with site director and make determination. If bus runs are reduced, communicate this to site personnel. Outcome of discussions with the four Site Directors on reducing bus runs and communication to site personnel will be documented.
Received, compiled, and documented responses from all sites. Overall, no changes in number of site runs are expected. Fueling bus on site instead of in town could improve efficiency.
74. Coordinate with regional programs for federal, state, tribal, and local ecosystem, watershed, and environmental management. Continue on-going communications with state and federal regulators.
TCEQ and RRC assisted in review of the New Park waste facility activities adjacent to Big Hill. COE contacted for determining best approach for permitting construction activities at Bayou Choctaw Cavern 102. Neither of these communications have regional impact. DM provided additional information to the COE permit application for construction activities at Bayou Choctaw Cavern 102. This activity does not have regional impact. DM Environmental worked with EPA Region 6 on correcting errors in OTIS database and discussing training opportunities for using NetDMR. DM discussed water restrictions on Brazos River with TCEQ Water Rights Management. DM discussed electronic annual water conservation implementation reporting for BH and BM with Texas Water Development Board (TWDB). DM Waste Management Specialist had discussions with LDNR and RRCT on workover rig wastes being shipped across state lines. Proper paperwork must be in place. This information was provided to Workover.

AAA9020459 Version 1.0 Appendix C – Page 9
Environmental Objective Implementation
75. Where such products and services meet performance requirements, advance sustainable acquisition to ensure 95% of contract actions include task and delivery orders for products and services (except weapon systems) that are:
a) Energy efficient (Energy star or FEMP designated)
b) Water efficient c) Biobased d) Environmentally preferable e) Non-ozone depleting f) Contain recycled content g) non toxic or less toxic alternatives
Effort is ongoing. B IG (Buy It Green) website promotes and tracks non-DM procurements. DM acquisitions are tracked via SAP. Results are reported to HQ annually via the Pollution Prevention Tracking and Reporting System (PPTRS).
76. Ensure that the agency (i) when acquiring an electronic product to meet its requirements, meets at least 95% of those requirements with EPEAT registered electronic product, unless there is no EPEAT standard for such product.
SPR procurement of Energy Star and FEMP designated products is an ongoing requirement and has been successfully implemented.
77. Use environmentally sound practices with respect to disposition of agency electronic equipment that has reached the end of its useful life. Maintain current environmentally sound practices established by Property.
Ongoing LOE activity. 1) 312 items (CPUs, monitors, laptops, etc.) weighing 7331 lbs. were recycled 2) 103 items donated for reuse, weighing 952 lbs. 3) 21,136 lbs of non-segregated electronics were recycled.
78. 8.5 Data Centers. Reduce the energy consumption of data center and server operations by specifying the acquisition of energy efficient electronic equipment for data centers, operating the equipment to improve load management and server innovation, and configuring the cooling operations to maximize energy efficiency opportunities. Implement a feasibility study to analyze current SPR Data Center cooling system.
The SPR utilizes Thin Client application servers with thin client end devices and server virtualization. At least 90% server virtualization is utilized. A study was completed in September 2011 using the “Federal Energy Management Program Best Practices Guide for Energy-Efficient Data Center Design”, http://www1.eere.energy.gov/femp/pdfs/eedatacenterbestpractices.pdf and provided current benchmarks, SPR standings, and recommendations going forward. This study was posted to the DOE team site for viewing.
End of Appendix
AAA9020459 Version 1.0 Appendix D
Appendix D
SURFACE WATER QUALITY SURVEILLANCE MONITORING
DURING 2011
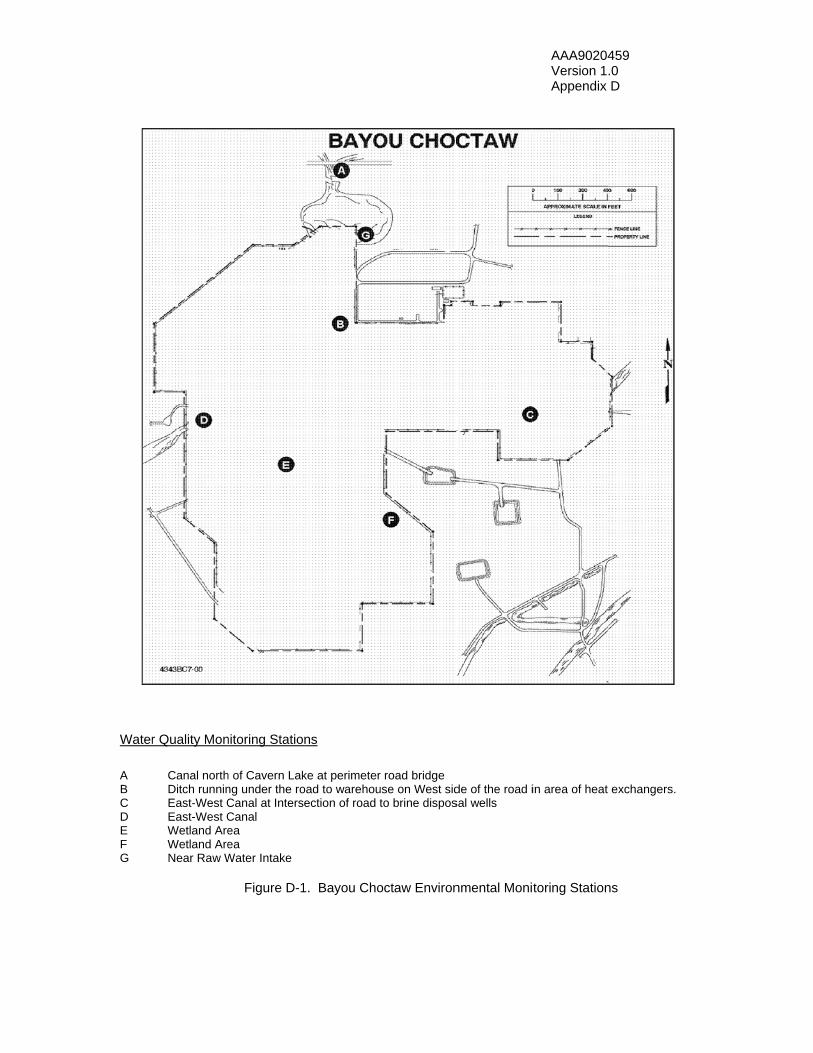
Water
A B C D E F G
r Quality Mon
Canal northDitch runninEast-West CEast-West CWetland AreWetland AreNear Raw W
nitoring Statio
h of Cavern Lakng under the roCanal at IntersCanal ea ea Water Intake
Figure D-1
ns
ke at perimeteroad to warehouection of road t
1. Bayou Cho
r road bridge use on West sidto brine dispos
octaw Environ
de of the road isal wells
nmental Moni
AAA90204Version 1Appendix
in area of heat
toring Station
459 .0 D
exchangers.
ns
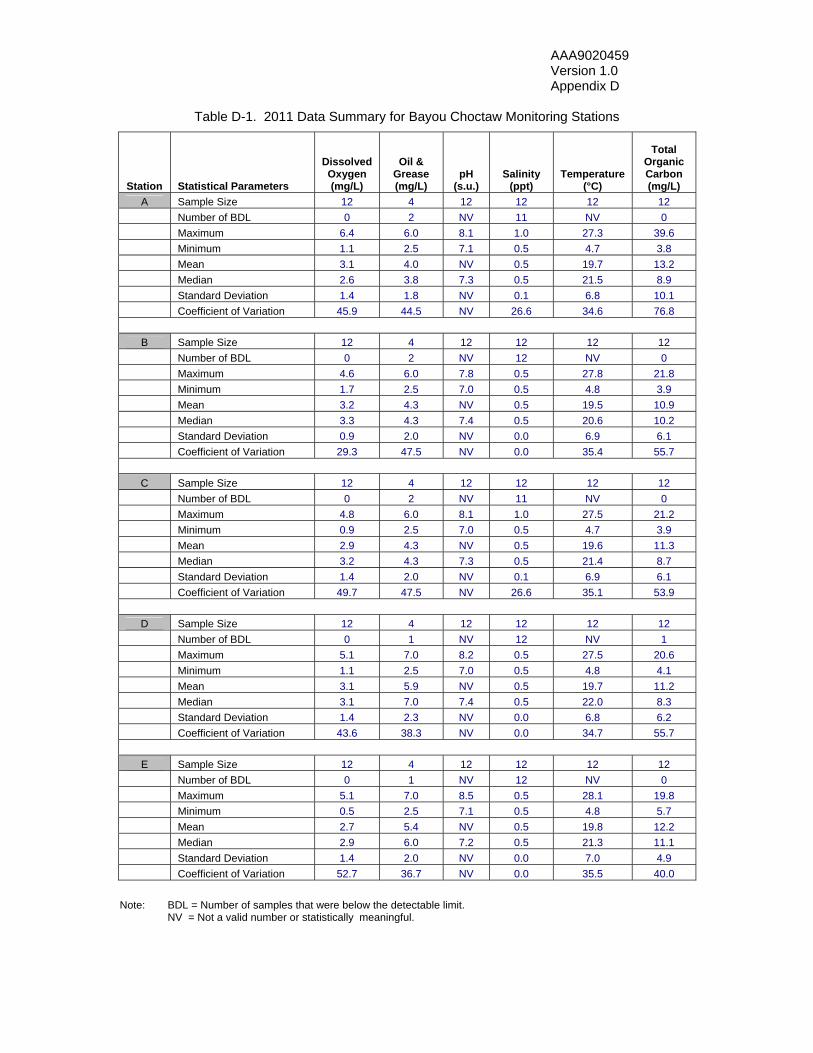
AAA9020459 Version 1.0 Appendix D
Table D-1. 2011 Data Summary for Bayou Choctaw Monitoring Stations
Station Statistical Parameters
Dissolved Oxygen (mg/L)
Oil & Grease (mg/L)
pH (s.u.)
Salinity (ppt)
Temperature (°C)
Total Organic Carbon (mg/L)
A Sample Size 12 4 12 12 12 12
Number of BDL 0 2 NV 11 NV 0
Maximum 6.4 6.0 8.1 1.0 27.3 39.6
Minimum 1.1 2.5 7.1 0.5 4.7 3.8
Mean 3.1 4.0 NV 0.5 19.7 13.2
Median 2.6 3.8 7.3 0.5 21.5 8.9
Standard Deviation 1.4 1.8 NV 0.1 6.8 10.1
Coefficient of Variation 45.9 44.5 NV 26.6 34.6 76.8
B Sample Size 12 4 12 12 12 12
Number of BDL 0 2 NV 12 NV 0
Maximum 4.6 6.0 7.8 0.5 27.8 21.8
Minimum 1.7 2.5 7.0 0.5 4.8 3.9
Mean 3.2 4.3 NV 0.5 19.5 10.9
Median 3.3 4.3 7.4 0.5 20.6 10.2
Standard Deviation 0.9 2.0 NV 0.0 6.9 6.1
Coefficient of Variation 29.3 47.5 NV 0.0 35.4 55.7
C Sample Size 12 4 12 12 12 12
Number of BDL 0 2 NV 11 NV 0
Maximum 4.8 6.0 8.1 1.0 27.5 21.2
Minimum 0.9 2.5 7.0 0.5 4.7 3.9
Mean 2.9 4.3 NV 0.5 19.6 11.3
Median 3.2 4.3 7.3 0.5 21.4 8.7
Standard Deviation 1.4 2.0 NV 0.1 6.9 6.1
Coefficient of Variation 49.7 47.5 NV 26.6 35.1 53.9
D Sample Size 12 4 12 12 12 12
Number of BDL 0 1 NV 12 NV 1
Maximum 5.1 7.0 8.2 0.5 27.5 20.6
Minimum 1.1 2.5 7.0 0.5 4.8 4.1
Mean 3.1 5.9 NV 0.5 19.7 11.2
Median 3.1 7.0 7.4 0.5 22.0 8.3
Standard Deviation 1.4 2.3 NV 0.0 6.8 6.2
Coefficient of Variation 43.6 38.3 NV 0.0 34.7 55.7
E Sample Size 12 4 12 12 12 12
Number of BDL 0 1 NV 12 NV 0
Maximum 5.1 7.0 8.5 0.5 28.1 19.8
Minimum 0.5 2.5 7.1 0.5 4.8 5.7
Mean 2.7 5.4 NV 0.5 19.8 12.2
Median 2.9 6.0 7.2 0.5 21.3 11.1
Standard Deviation 1.4 2.0 NV 0.0 7.0 4.9
Coefficient of Variation 52.7 36.7 NV 0.0 35.5 40.0
Note: BDL = Number of samples that were below the detectable limit. NV = Not a valid number or statistically meaningful.

AAA9020459 Version 1.0 Appendix D
Table D-1. 2011 Data Summary for Bayou Choctaw Monitoring Stations (continued)
Station Statistical Parameters
Dissolved Oxygen (mg/L)
Oil & Grease (mg/L)
pH (s.u.)
Salinity (ppt)
Temperature (°C)
Total Organic Carbon (mg/L)
F Sample Size 12 4 12 12 12 12
Number of BDL 0 1 NV 10 NV 0
Maximum 5.3 6.0 8.3 1.0 27.6 19.4
Minimum 0.8 2.5 7.1 0.5 5.0 5.6
Mean 2.9 5.1 NV 0.6 19.7 11.0
Median 3.0 6.0 7.3 0.5 21.0 8.5
Standard Deviation 1.7 1.8 NV 0.2 6.9 5.5
Coefficient of Variation 58.8 34.1 NV 33.4 35.1 49.9
G Sample Size 12 4 12 12 12 12
Number of BDL 0 1 NV 12 NV 0
Maximum 6.2 6.0 8.0 0.5 27.3 20.1
Minimum 1.7 2.5 7.2 0.5 5.9 4.2
Mean 4.0 5.1 NV 0.5 19.7 12.9
Median 3.9 6.0 7.6 0.5 21.9 11.5
Standard Deviation 1.3 1.8 NV 0.0 6.7 5.4
Coefficient of Variation 33.9 34.1 NV 0.0 33.8 41.8
Note: BDL = Number of samples that were below the detectable limit. NV = Not a valid number or statistically meaningful.
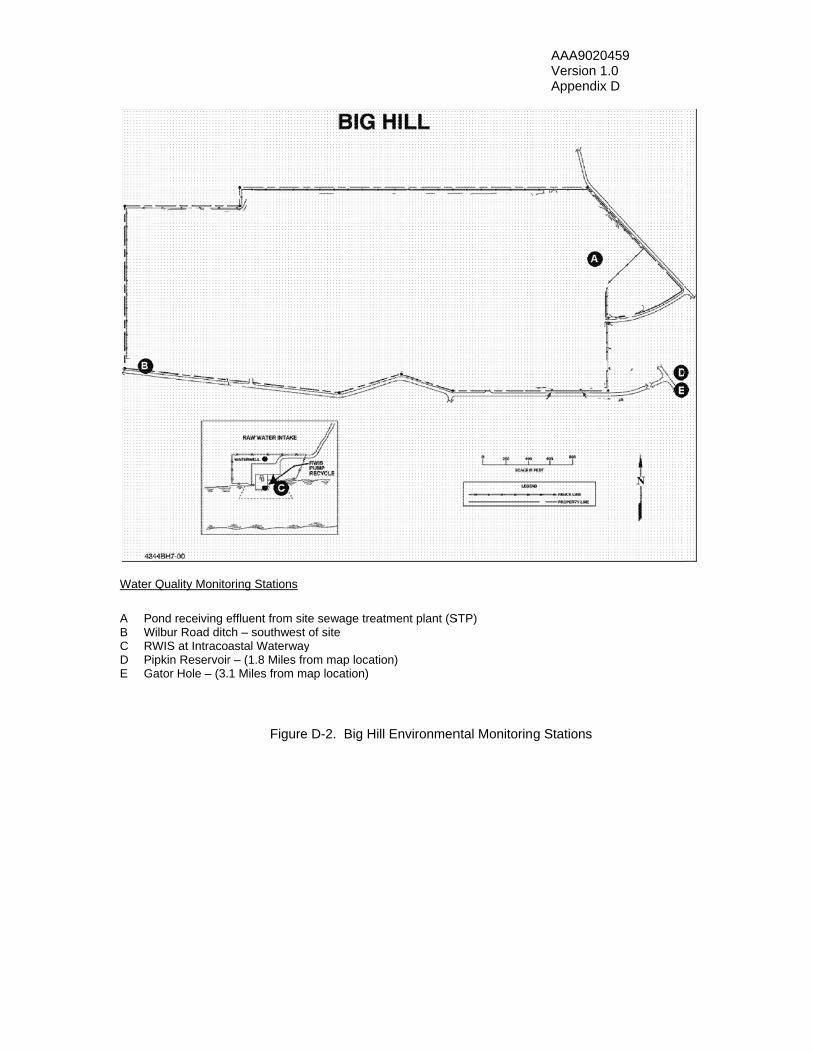
Water
A PB WC RD PE G
Quality Monito
ond receiving eWilbur Road ditcRWIS at Intraco
ipkin ReservoirGator Hole – (3.
oring Stations
effluent from sich – southwestastal Waterwayr – (1.8 Miles fr1 Miles from m
Figure
te sewage treat of site y rom map locati
map location)
e D-2. Big Hil
atment plant (S
on)
ll Environmen
STP)
ntal Monitorin
AAA90204Version 1Appendix
g Stations
459 .0 D

AAA9020459 Version 1.0 Appendix D
Table D-2. 2011 Data Summary for Big Hill Monitoring Stations
Station Statistical Parameters
Dissolved Oxygen (mg/L)
Oil & Grease (mg/L)
pH (s.u.)
Salinity (ppt)
Temperature (°C)
Total Organic Carbon (mg/L)
A Sample Size 3 2 4 3 4 3
Number of BDL 0 1 NV 3 NV 0
Maximum 9.4 2.7 7.9 0.5 23.0 28.2
Minimum 2.9 2.5 6.9 0.5 11.0 8.7
Mean 7.0 2.6 NV 0.5 17.3 21.6
Median 8.6 2.6 7.4 0.5 17.5 27.9
Standard Deviation 3.6 0.1 NV 0.0 5.1 11.2
Coefficient of Variation 51.4 5.4 NV 0.0 29.3 51.7
B Sample Size 12 4 12 12 12 12
Number of BDL 0 2 NV 2 NV 0
Maximum 8.2 5.0 8.2 11.7 29.0 55.5
Minimum 2.6 2.5 6.8 0.5 11.0 9.3
Mean 6.0 3.1 NV 4.9 22.4 30.6
Median 6.6 2.5 7.7 4.3 24.5 28.0
Standard Deviation 1.5 1.3 NV 3.9 6.2 14.8
Coefficient of Variation 25.3 40.0 NV 80.8 27.7 48.4
C Sample Size 10 4 11 11 11 11
Number of BDL 0 4 NV 0 NV 0
Maximum 7.8 2.5 7.8 29.7 31.0 13.5
Minimum 3.4 2.5 7.0 10.7 12.0 4.5
Mean 5.2 2.5 NV 20.8 22.8 7.3
Median 5.4 2.5 7.6 22.0 23.0 7.0
Standard Deviation 1.4 0.0 NV 6.6 6.7 2.8
Coefficient of Variation 27.0 0.0 NV 31.8 29.3 38.5
D Sample Size 10 4 10 10 10 10
Number of BDL 0 4 NV 0 NV 0
Maximum 9.0 2.5 8.4 21.9 30.0 70.1
Minimum 1.7 2.5 7.1 2.3 13.0 18.9
Mean 6.5 2.5 NV 7.4 22.8 39.2
Median 6.6 2.5 7.7 4.0 23.0 33.9
Standard Deviation 2.3 0.0 NV 6.4 5.4 16.7
Coefficient of Variation 35.3 0.0 NV 86.8 23.6 42.6
E Sample Size 12 4 12 12 12 12
Number of BDL 0 4 NV 0 NV 0
Maximum 9.1 2.5 8.1 35.7 30.0 43.0
Minimum 3.4 2.5 6.7 3.6 11.0 12.4
Mean 5.7 2.5 NV 19.2 22.7 22.6
Median 5.1 2.5 7.6 20.1 24.0 20.7
Standard Deviation 2.0 0.0 NV 11.8 5.9 10.1
Coefficient of Variation 35.0 0.0 NV 61.6 26.2 44.4 Note: BDL = Number of samples that were below the detectable limit. NV = Not a valid number or statistically meaningful.
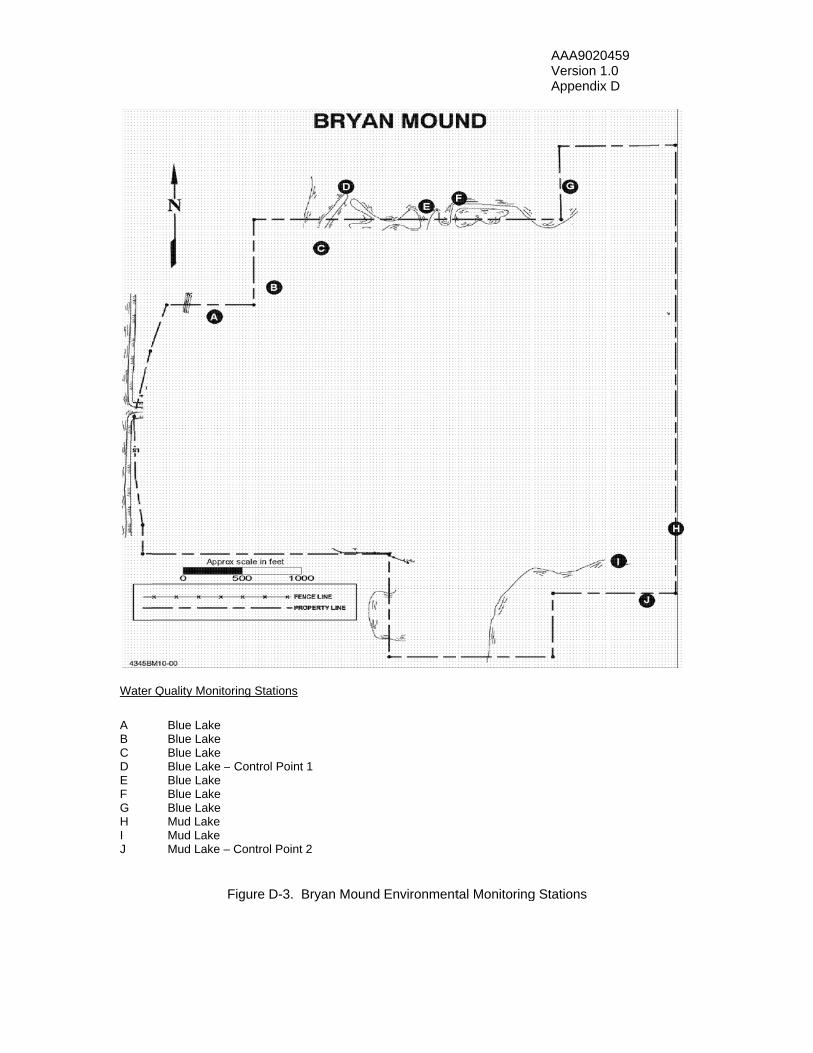
Water
A B C D E F G H I J
Quality Monito
Blue Lake Blue Lake Blue Lake Blue Lake –Blue Lake Blue Lake Blue Lake Mud Lake Mud Lake Mud Lake –
oring Stations
– Control Point
– Control Point
Figure D-3. B
1
2
Bryan Mound Environmenttal Monitoring
AAA90204Version 1Appendix
g Stations
459 .0 D

AAA9020459 Version 1.0 Appendix D
Table D-3. 2011 Data Summary for Bryan Mound Monitoring Stations
Station Statistical Parameters
Dissolved Oxygen (mg/L)
Oil & Grease (mg/L)
pH (s.u.)
Salinity (ppt)
Temperature (°C)
Total Organic Carbon (mg/L)
A Sample Size 5 3 5 5 5 5
Number of BDL 0 3 NV 0 NV 0
Maximum 4.9 2.5 8.2 5.6 27.0 29.9
Minimum 2.9 2.5 7.2 4.5 13.6 23.3
Mean 3.5 2.5 NV 5.0 20.5 27.7
Median 3.1 2.5 7.7 4.8 22.5 27.9
Standard Deviation 0.9 0.0 NV 0.5 6.3 2.7
Coefficient of Variation 24.4 0.0 NV 9.1 30.9 9.8
B Sample Size 5 3 5 5 5 5
Number of BDL 0 3 NV 0 NV 0
Maximum 4.0 2.5 8.3 5.5 27.7 29.3
Minimum 2.1 2.5 7.2 4.7 13.6 22.4
Mean 3.1 2.5 NV 5.0 20.5 26.6
Median 3.1 2.5 7.4 4.8 21.6 26.5
Standard Deviation 0.7 0.0 NV 0.4 6.5 2.6
Coefficient of Variation 21.6 0.0 NV 7.2 31.8 9.9
C Sample Size 5 3 5 5 5 5
Number of BDL 0 3 NV 0 NV 0
Maximum 4.7 2.5 8.3 5.5 28.0 28.5
Minimum 2.4 2.5 7.4 4.6 13.6 21.9
Mean 3.7 2.5 NV 5.0 20.4 26.3
Median 3.8 2.5 7.4 4.8 21.4 26.8
Standard Deviation 0.8 0.0 NV 0.4 6.7 2.6
Coefficient of Variation 22.4 0.0 NV 7.3 32.6 10.0
D Sample Size 5 3 5 5 5 5
Number of BDL 0 3 NV 0 NV 0
Maximum 4.1 2.5 7.6 5.4 28.0 29.7
Minimum 3.0 2.5 7.2 4.7 13.0 20.7
Mean 3.5 2.5 NV 5.0 20.3 26.0
Median 3.3 2.5 7.4 4.9 21.1 26.6
Standard Deviation 0.4 0.0 NV 0.3 6.8 3.3
Coefficient of Variation 12.9 0.0 NV 5.8 33.4 12.6
E Sample Size 5 3 5 5 5 5
Number of BDL 0 3 NV 0 NV 0
Maximum 4.9 2.5 7.6 5.5 27.8 29.8
Minimum 2.3 2.5 7.2 4.6 13.7 20.8
Mean 3.8 2.5 NV 5.0 20.6 26.0
Median 3.9 2.5 7.4 4.9 21.7 26.5
Standard Deviation 0.9 0.0 NV 0.3 6.6 3.3
Coefficient of Variation 24.2 0.0 NV 6.6 31.9 12.6
Note: BDL = Number of samples that were below the detectable limit. NV = Not a valid number or statistically meaningful.
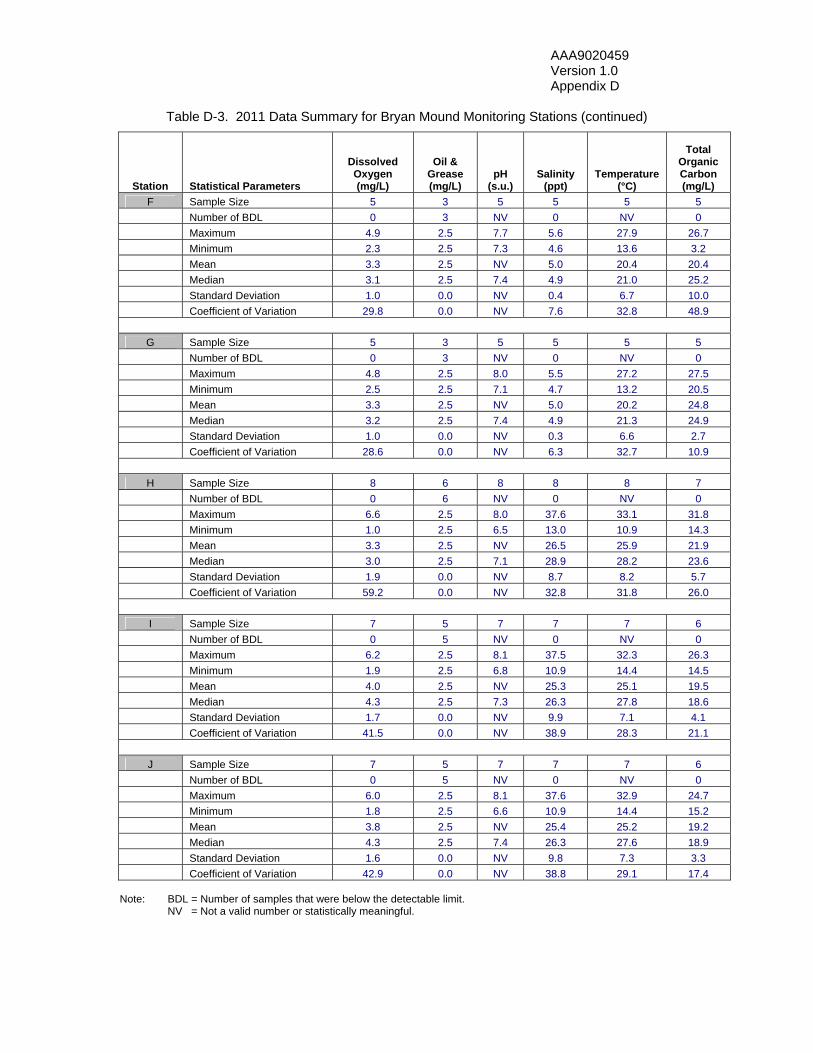
AAA9020459 Version 1.0 Appendix D
Table D-3. 2011 Data Summary for Bryan Mound Monitoring Stations (continued)
Station Statistical Parameters
Dissolved Oxygen (mg/L)
Oil & Grease (mg/L)
pH (s.u.)
Salinity (ppt)
Temperature (°C)
Total Organic Carbon (mg/L)
F Sample Size 5 3 5 5 5 5
Number of BDL 0 3 NV 0 NV 0
Maximum 4.9 2.5 7.7 5.6 27.9 26.7
Minimum 2.3 2.5 7.3 4.6 13.6 3.2
Mean 3.3 2.5 NV 5.0 20.4 20.4
Median 3.1 2.5 7.4 4.9 21.0 25.2
Standard Deviation 1.0 0.0 NV 0.4 6.7 10.0
Coefficient of Variation 29.8 0.0 NV 7.6 32.8 48.9
G Sample Size 5 3 5 5 5 5
Number of BDL 0 3 NV 0 NV 0
Maximum 4.8 2.5 8.0 5.5 27.2 27.5
Minimum 2.5 2.5 7.1 4.7 13.2 20.5
Mean 3.3 2.5 NV 5.0 20.2 24.8
Median 3.2 2.5 7.4 4.9 21.3 24.9
Standard Deviation 1.0 0.0 NV 0.3 6.6 2.7
Coefficient of Variation 28.6 0.0 NV 6.3 32.7 10.9
H Sample Size 8 6 8 8 8 7
Number of BDL 0 6 NV 0 NV 0
Maximum 6.6 2.5 8.0 37.6 33.1 31.8
Minimum 1.0 2.5 6.5 13.0 10.9 14.3
Mean 3.3 2.5 NV 26.5 25.9 21.9
Median 3.0 2.5 7.1 28.9 28.2 23.6
Standard Deviation 1.9 0.0 NV 8.7 8.2 5.7
Coefficient of Variation 59.2 0.0 NV 32.8 31.8 26.0
I Sample Size 7 5 7 7 7 6
Number of BDL 0 5 NV 0 NV 0
Maximum 6.2 2.5 8.1 37.5 32.3 26.3
Minimum 1.9 2.5 6.8 10.9 14.4 14.5
Mean 4.0 2.5 NV 25.3 25.1 19.5
Median 4.3 2.5 7.3 26.3 27.8 18.6
Standard Deviation 1.7 0.0 NV 9.9 7.1 4.1
Coefficient of Variation 41.5 0.0 NV 38.9 28.3 21.1
J Sample Size 7 5 7 7 7 6
Number of BDL 0 5 NV 0 NV 0
Maximum 6.0 2.5 8.1 37.6 32.9 24.7
Minimum 1.8 2.5 6.6 10.9 14.4 15.2
Mean 3.8 2.5 NV 25.4 25.2 19.2
Median 4.3 2.5 7.4 26.3 27.6 18.9
Standard Deviation 1.6 0.0 NV 9.8 7.3 3.3
Coefficient of Variation 42.9 0.0 NV 38.8 29.1 17.4 Note: BDL = Number of samples that were below the detectable limit. NV = Not a valid number or statistically meaningful.
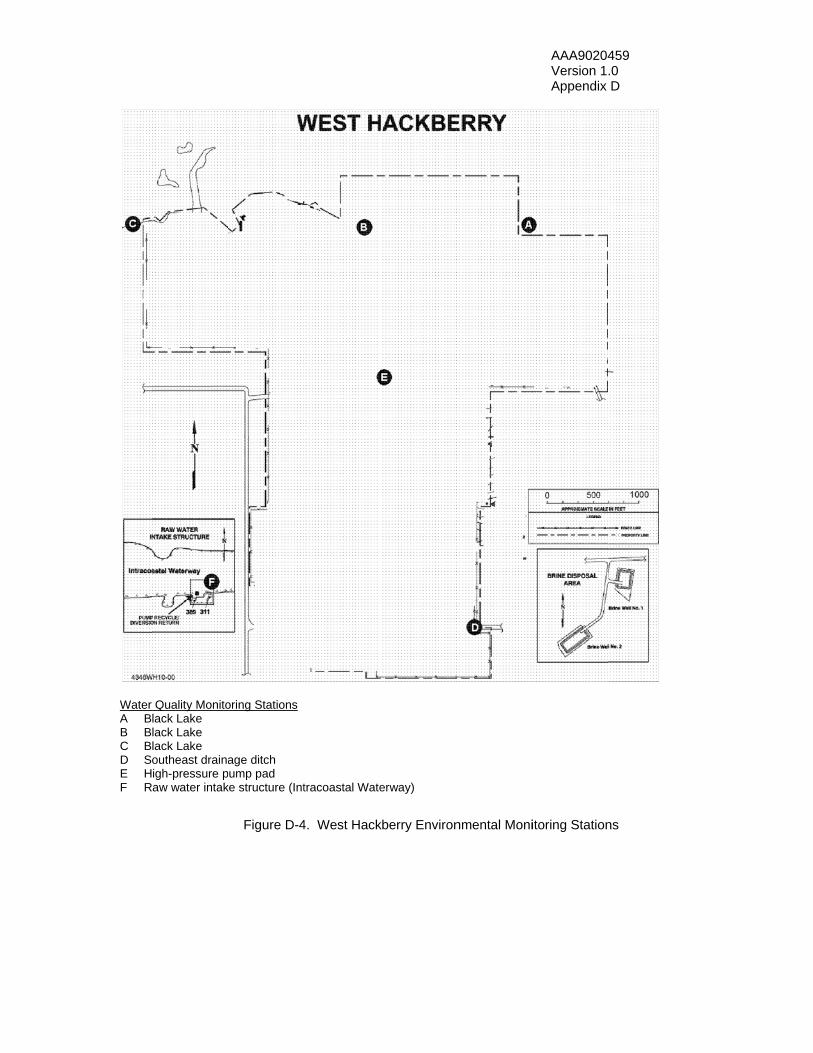
Water A BB BC BD SE HF R
Quality Monitolack Lake lack Lake lack Lake outheast drainaigh-pressure p
Raw water intak
oring Stations
age ditch pump pad ke structure (Int
Figure D-4
tracoastal Wate
4. West Hack
erway)
kberry Environnmental Moni
AAA90204Version 1Appendix
itoring Station
459 .0 D
ns
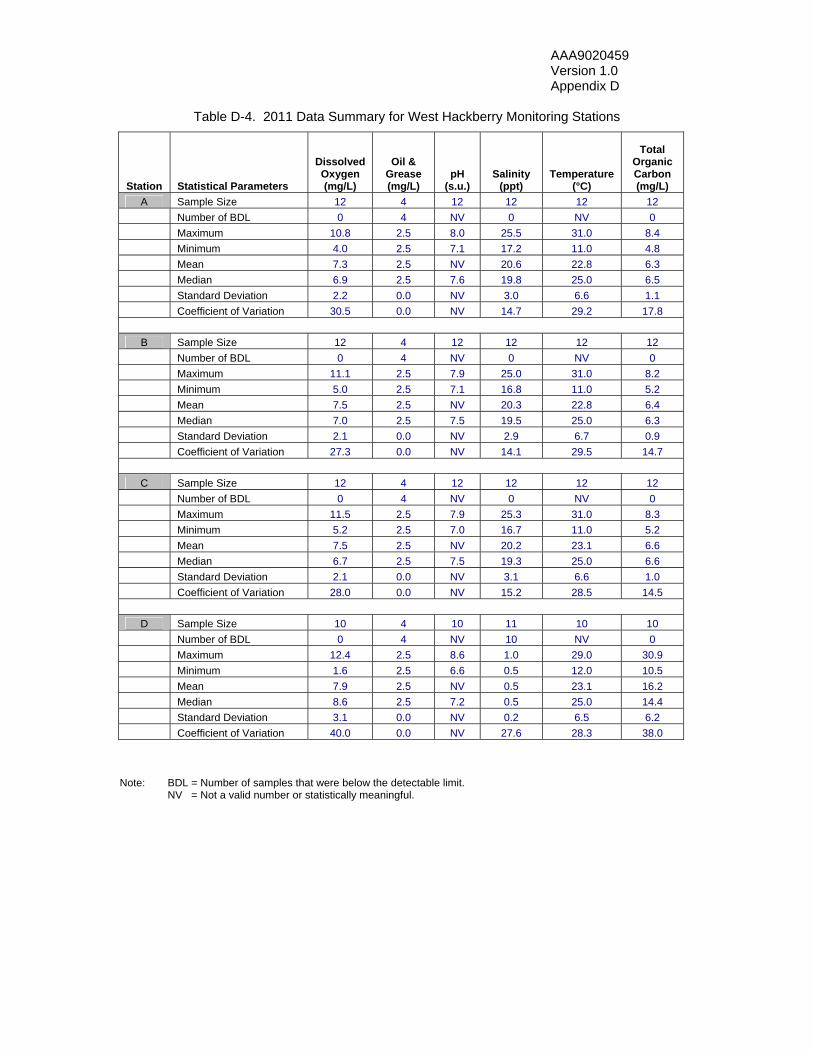
AAA9020459 Version 1.0 Appendix D
Table D-4. 2011 Data Summary for West Hackberry Monitoring Stations
Station Statistical Parameters
Dissolved Oxygen (mg/L)
Oil & Grease (mg/L)
pH (s.u.)
Salinity (ppt)
Temperature (°C)
Total Organic Carbon (mg/L)
A Sample Size 12 4 12 12 12 12
Number of BDL 0 4 NV 0 NV 0
Maximum 10.8 2.5 8.0 25.5 31.0 8.4
Minimum 4.0 2.5 7.1 17.2 11.0 4.8
Mean 7.3 2.5 NV 20.6 22.8 6.3
Median 6.9 2.5 7.6 19.8 25.0 6.5
Standard Deviation 2.2 0.0 NV 3.0 6.6 1.1
Coefficient of Variation 30.5 0.0 NV 14.7 29.2 17.8
B Sample Size 12 4 12 12 12 12
Number of BDL 0 4 NV 0 NV 0
Maximum 11.1 2.5 7.9 25.0 31.0 8.2
Minimum 5.0 2.5 7.1 16.8 11.0 5.2
Mean 7.5 2.5 NV 20.3 22.8 6.4
Median 7.0 2.5 7.5 19.5 25.0 6.3
Standard Deviation 2.1 0.0 NV 2.9 6.7 0.9
Coefficient of Variation 27.3 0.0 NV 14.1 29.5 14.7
C Sample Size 12 4 12 12 12 12
Number of BDL 0 4 NV 0 NV 0
Maximum 11.5 2.5 7.9 25.3 31.0 8.3
Minimum 5.2 2.5 7.0 16.7 11.0 5.2
Mean 7.5 2.5 NV 20.2 23.1 6.6
Median 6.7 2.5 7.5 19.3 25.0 6.6
Standard Deviation 2.1 0.0 NV 3.1 6.6 1.0
Coefficient of Variation 28.0 0.0 NV 15.2 28.5 14.5
D Sample Size 10 4 10 11 10 10
Number of BDL 0 4 NV 10 NV 0
Maximum 12.4 2.5 8.6 1.0 29.0 30.9
Minimum 1.6 2.5 6.6 0.5 12.0 10.5
Mean 7.9 2.5 NV 0.5 23.1 16.2
Median 8.6 2.5 7.2 0.5 25.0 14.4
Standard Deviation 3.1 0.0 NV 0.2 6.5 6.2
Coefficient of Variation 40.0 0.0 NV 27.6 28.3 38.0 Note: BDL = Number of samples that were below the detectable limit. NV = Not a valid number or statistically meaningful.

AAA9020459 Version 1.0 Appendix D
Table D-4. 2011 Data Summary for West Hackberry Monitoring Stations (continued)
Station Statistical Parameters
Dissolved Oxygen (mg/L)
Oil & Grease (mg/L)
pH (s.u.)
Salinity (ppt)
Temperature (°C)
Total Organic Carbon (mg/L)
E Sample Size 12 4 12 12 12 12
Number of BDL 0 4 NV 11 NV 0
Maximum 10.6 2.5 7.9 1.1 30.0 8.1
Minimum 4.1 2.5 6.6 0.5 13.0 2.0
Mean 6.5 2.5 NV 0.6 23.4 4.6
Median 6.1 2.5 7.4 0.5 25.0 4.6
Standard Deviation 2.1 0.0 NV 0.2 5.8 1.8
Coefficient of Variation 32.4 0.0 NV 31.5 24.9 38.9
F Sample Size 12 4 12 12 12 12
Number of BDL 0 4 NV 3 NV 0
Maximum 10.6 2.5 7.8 25.6 31.0 8.8
Minimum 5.0 2.5 6.7 9.1 12.0 3.4
Mean 7.4 2.5 NV 18.9 23.4 5.7
Median 7.0 2.5 7.4 19.0 25.5 5.7
Standard Deviation 1.9 0.0 NV 4.7 6.8 1.5
Coefficient of Variation 25.7 0.0 NV 24.6 29.1 26.9 Note: BDL = Number of samples that were below the detectable limit. NV = Not a valid number or statistically meaningful.
End of Appendix
AAA9020459 Version 1.0 Appendix E
Appendix E
GROUND WATER SURVEILLANCE MONITORING
DURING 2011

AAA9020459 Version 1.0 Appendix E
Figure E-1. Bayou Choctaw Ground Water Monitoring Stations

AAA9020459 Version 1.0 Appendix E
Figure E-2. Bayou Choctaw Ground Water Contoured Elevations Fall 2011
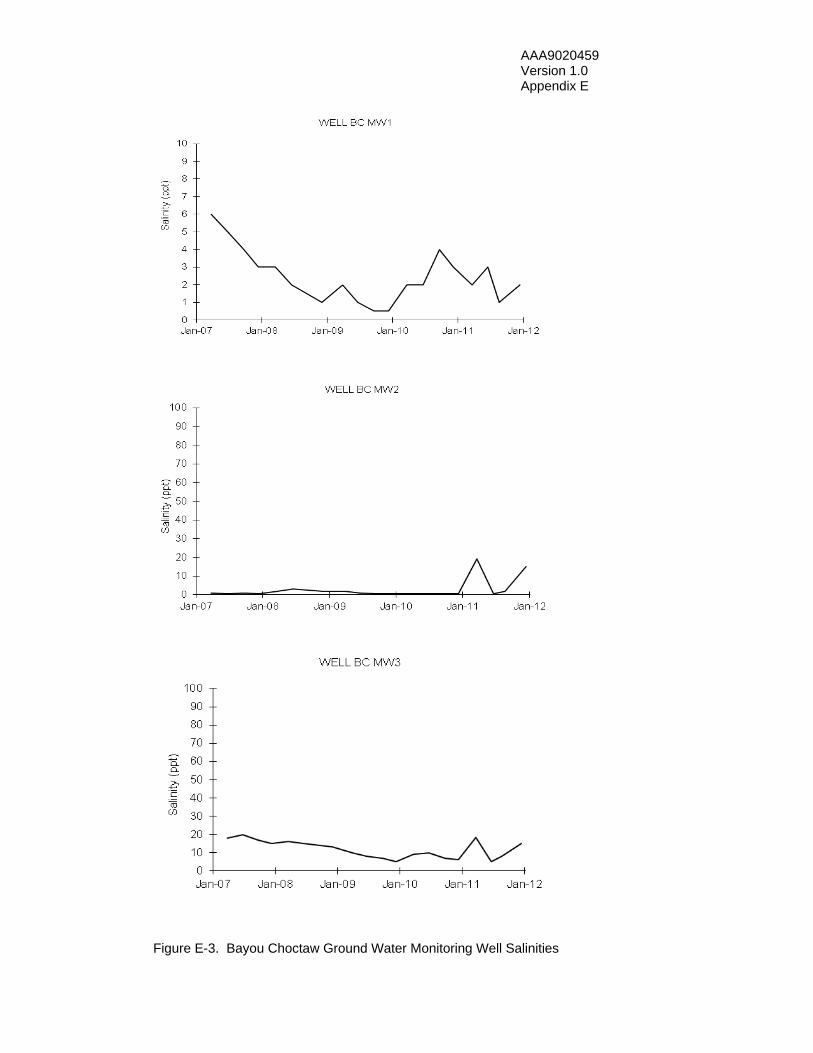
AAA9020459 Version 1.0 Appendix E
Figure E-3. Bayou Choctaw Ground Water Monitoring Well Salinities
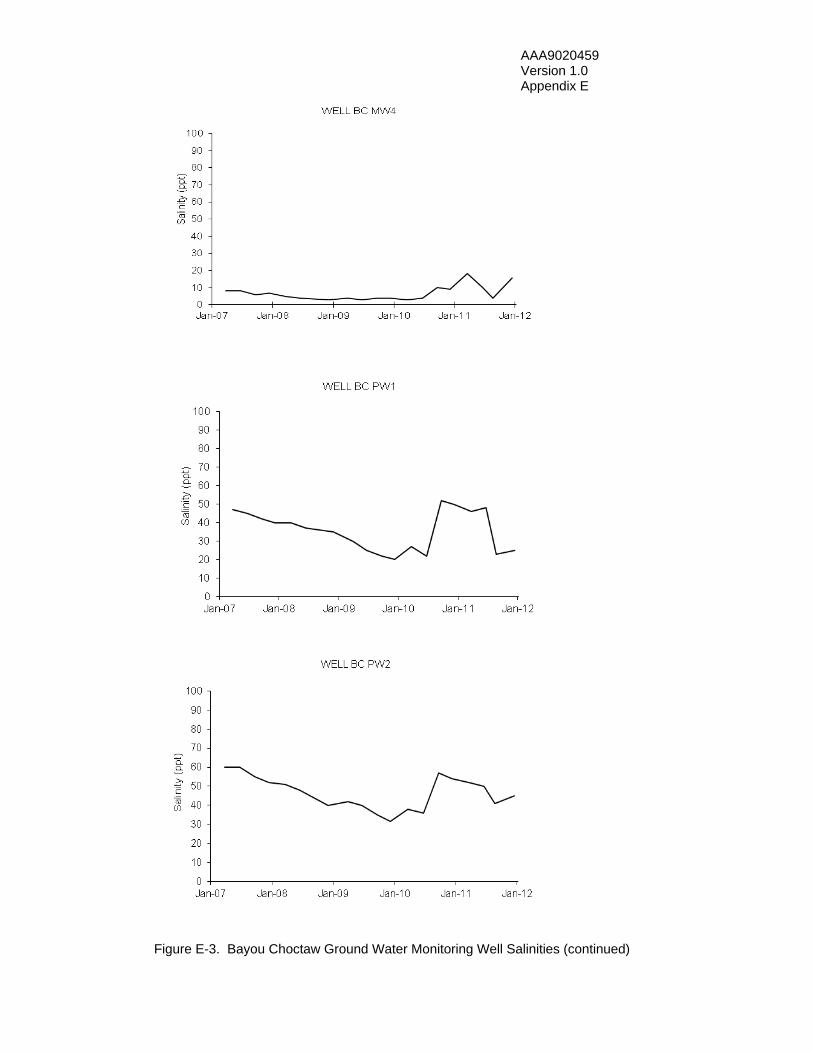
AAA9020459 Version 1.0 Appendix E
Figure E-3. Bayou Choctaw Ground Water Monitoring Well Salinities (continued)

AAA9020459 Version 1.0 Appendix E
Figure E-3. Bayou Choctaw Ground Water Monitoring Well Salinities (continued)

AAA9020459 Version 1.0 Appendix E
Figure E-3. Bayou Choctaw Ground Water Monitoring Well Salinities (continued)
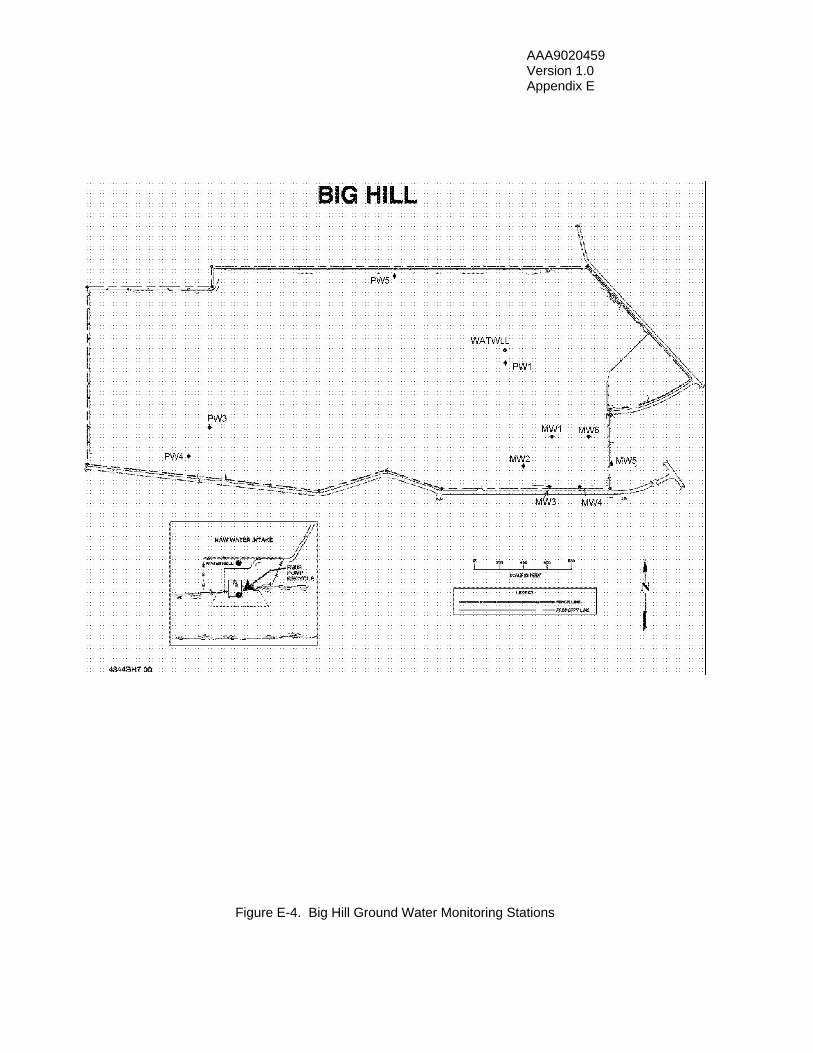
AAA9020459 Version 1.0 Appendix E
Figure E-4. Big Hill Ground Water Monitoring Stations
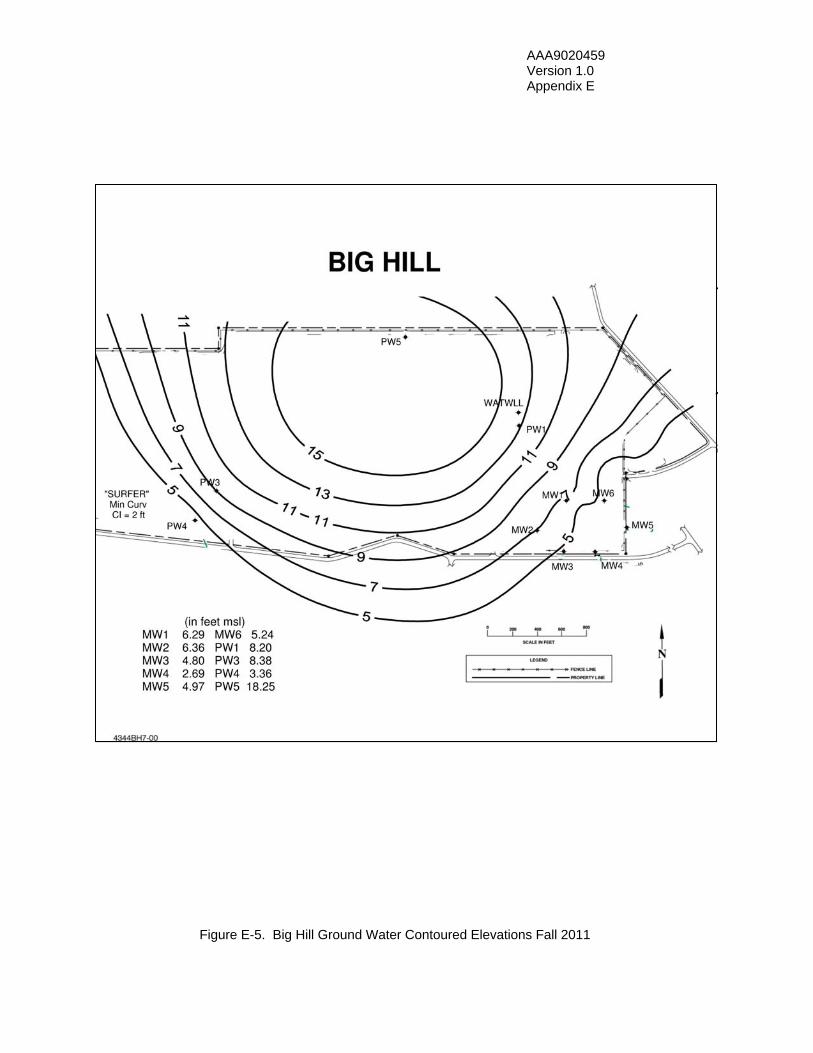
AAA9020459 Version 1.0 Appendix E
Figure E-5. Big Hill Ground Water Contoured Elevations Fall 2011

AAA9020459 Version 1.0 Appendix E
Figure E-6. Big Hill Ground Water Monitoring Well Salinities

AAA9020459 Version 1.0 Appendix E
Figure E-6. Big Hill Ground Water Monitoring Well Salinities (continued)

AAA9020459 Version 1.0 Appendix E
Figure E-6. Big Hill Ground Water Monitoring Well Salinities (continued)

AAA9020459 Version 1.0 Appendix E
Figure E-6. Big Hill Ground Water Monitoring Well Salinities (continued)

AAA9020459 Version 1.0 Appendix E
Figure E-7. Bryan Mound Ground Water Monitoring Stations, Deep and Shallow

AAA9020459 Version 1.0 Appendix E
Figure E-8. Bryan Mound Shallow Ground Water Zone Contoured Elevations Fall 2011
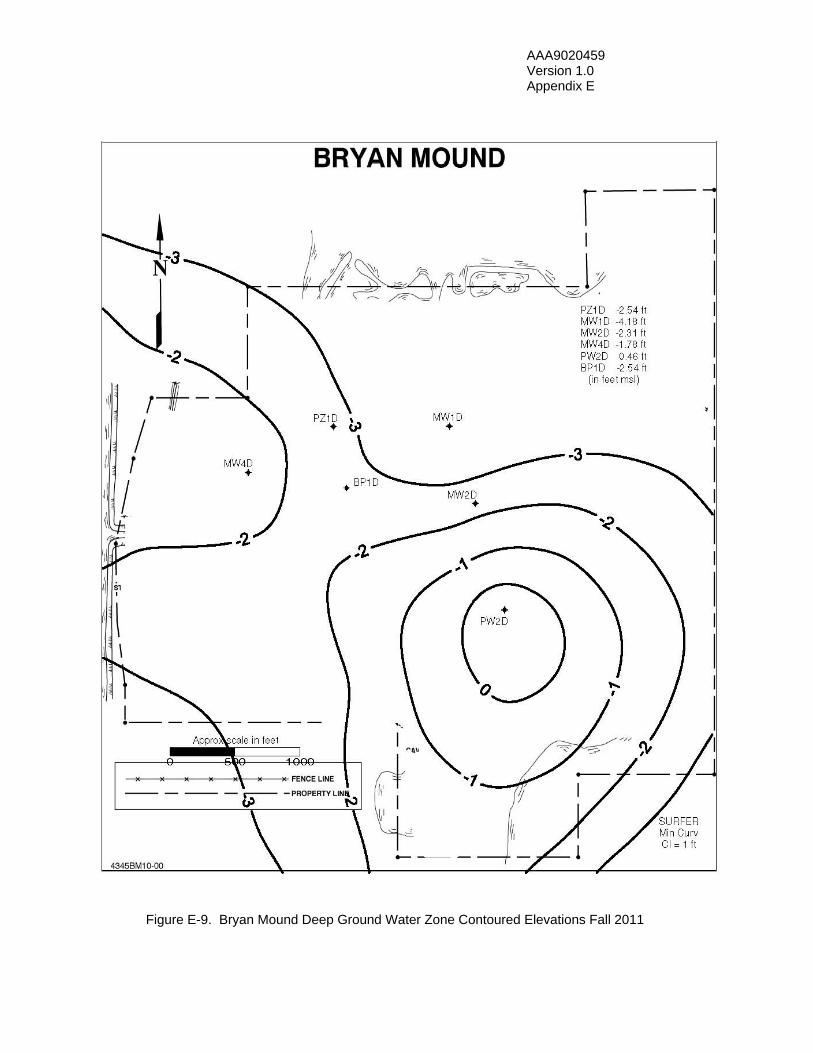
AAA9020459 Version 1.0 Appendix E
Figure E-9. Bryan Mound Deep Ground Water Zone Contoured Elevations Fall 2011

AAA9020459 Version 1.0 Appendix E
Figure E-10. Bryan Mound Ground Water Monitoring Well Salinities

AAA9020459 Version 1.0 Appendix E
Figure E-10. Bryan Mound Ground Water Monitoring Well Salinities (continued)
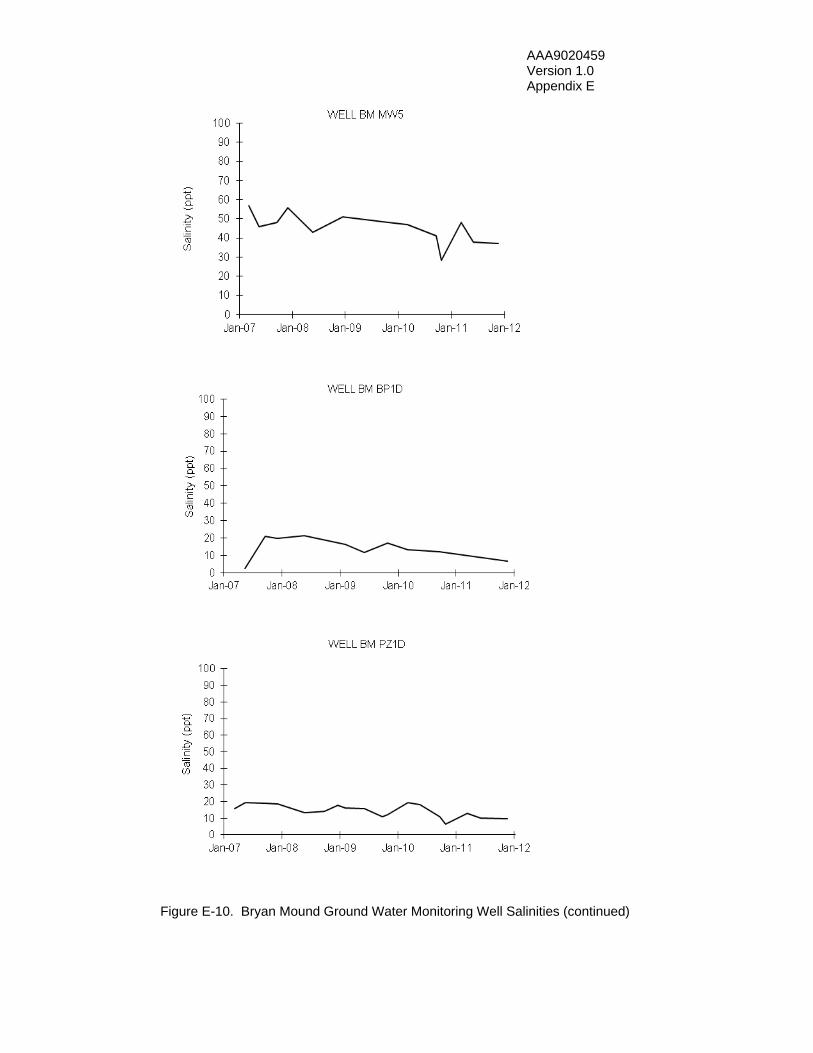
AAA9020459 Version 1.0 Appendix E
Figure E-10. Bryan Mound Ground Water Monitoring Well Salinities (continued)

AAA9020459 Version 1.0 Appendix E
Figure E-10. Bryan Mound Ground Water Monitoring Well Salinities (continued)
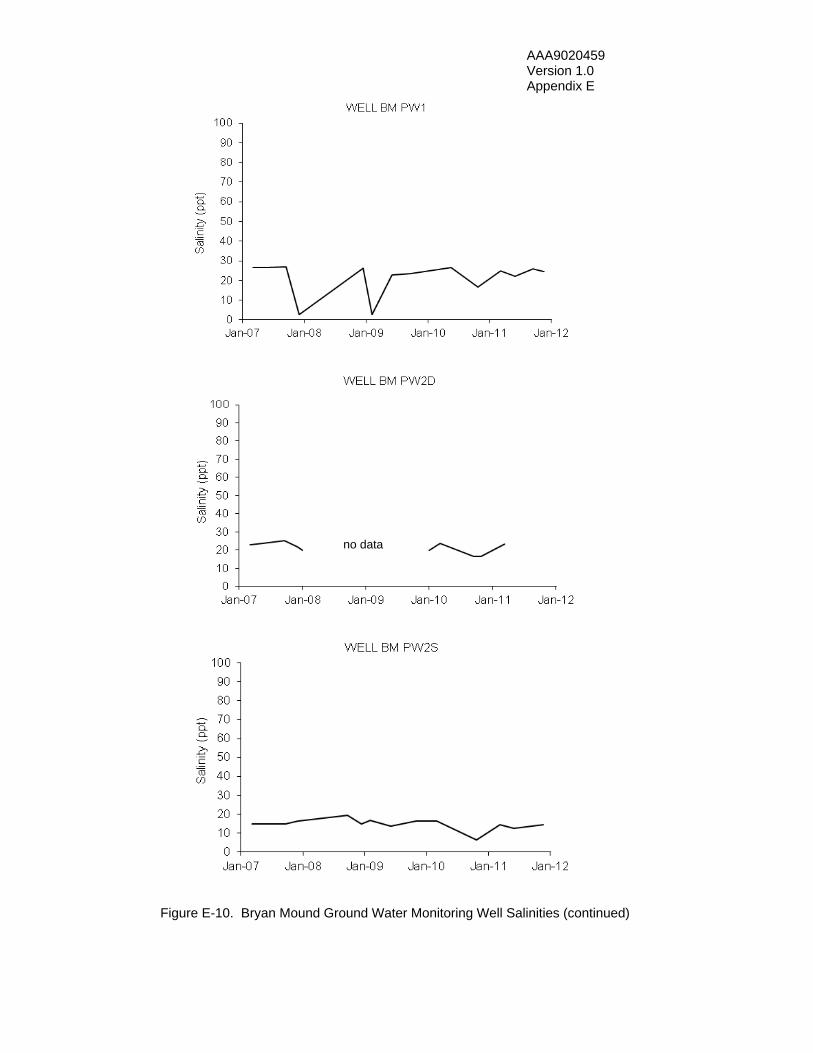
AAA9020459 Version 1.0 Appendix E
Figure E-10. Bryan Mound Ground Water Monitoring Well Salinities (continued)
no data

AAA9020459 Version 1.0 Appendix E
Figure E-10. Bryan Mound Ground Water Monitoring Well Salinities (continued)

AAA9020459 Version 1.0 Appendix E
Figure E-11. West Hackberry Ground Water Monitoring Stations, Deep and Shallow
0 1000500
PW4
PW5 P9P8
PW2
P13S, D
P2S, D
P12S, DP5S
P1S, DPW6 P6SRW1S, D RW2S, D
P4S, D
P3S, D
P11
RW3D
P6DRW5D
MW1D
RW4D

AAA9020459 Version 1.0 Appendix E
Figure E-12. West Hackberry Shallow Ground Water Zone Contoured Elevations Fall 2011
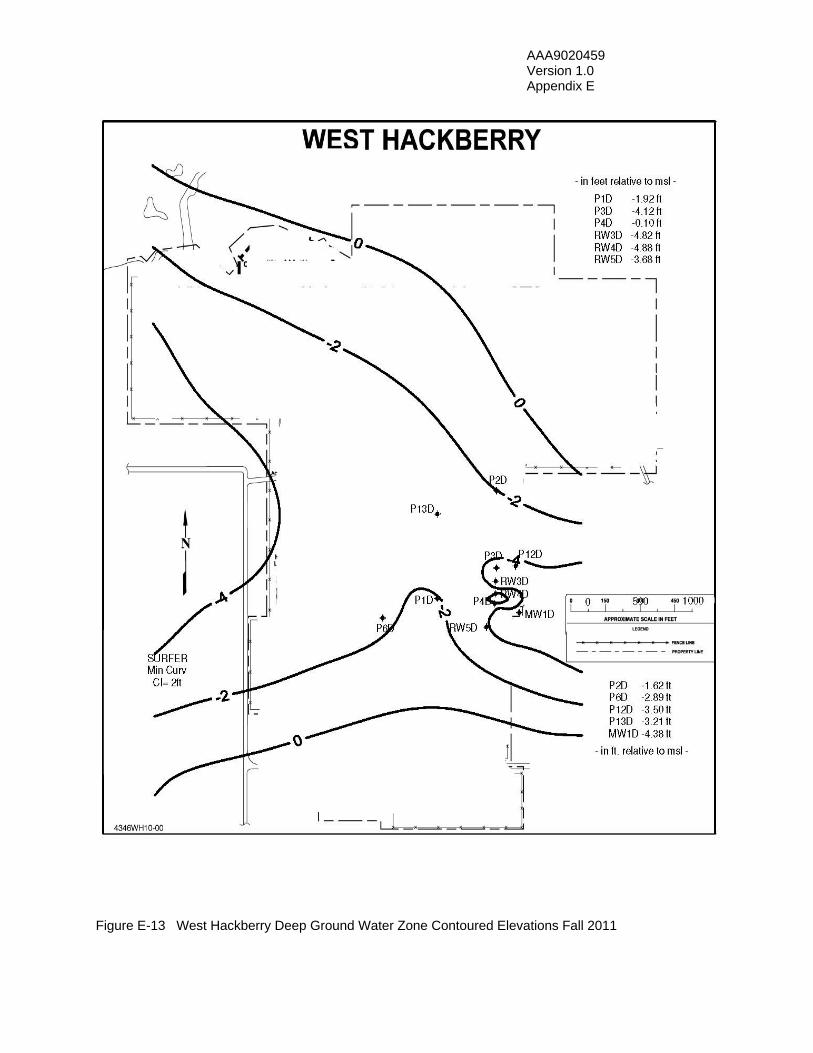
AAA9020459 Version 1.0 Appendix E
Figure E-13 West Hackberry Deep Ground Water Zone Contoured Elevations Fall 2011

AAA9020459 Version 1.0 Appendix E
Figure E-14. West Hackberry Ground Water Monitoring Well Salinities
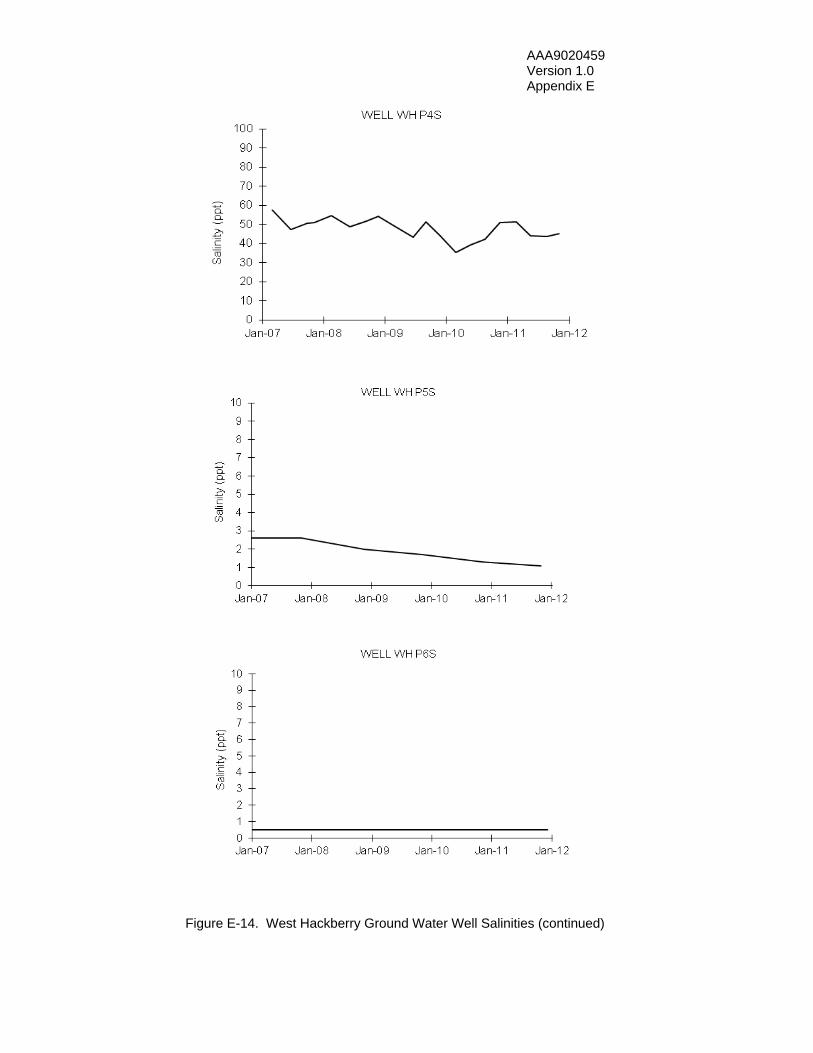
AAA9020459 Version 1.0 Appendix E
Figure E-14. West Hackberry Ground Water Well Salinities (continued)
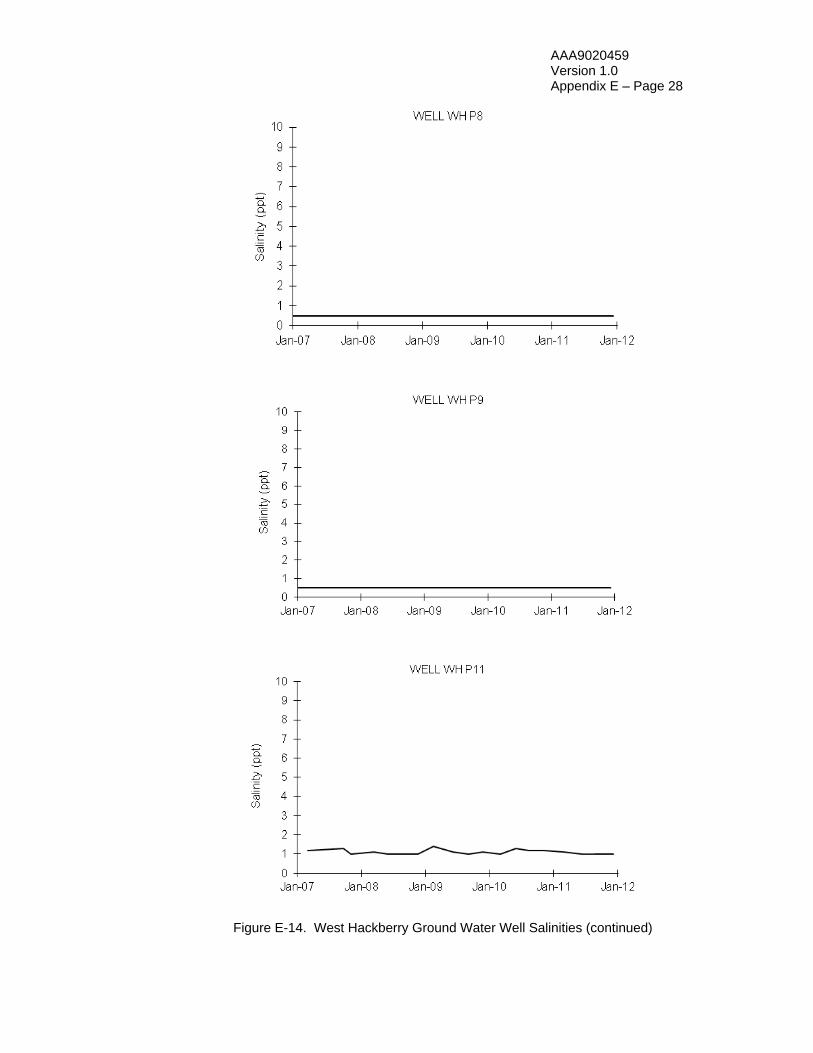
AAA9020459 Version 1.0 Appendix E – Page 28
Figure E-14. West Hackberry Ground Water Well Salinities (continued)
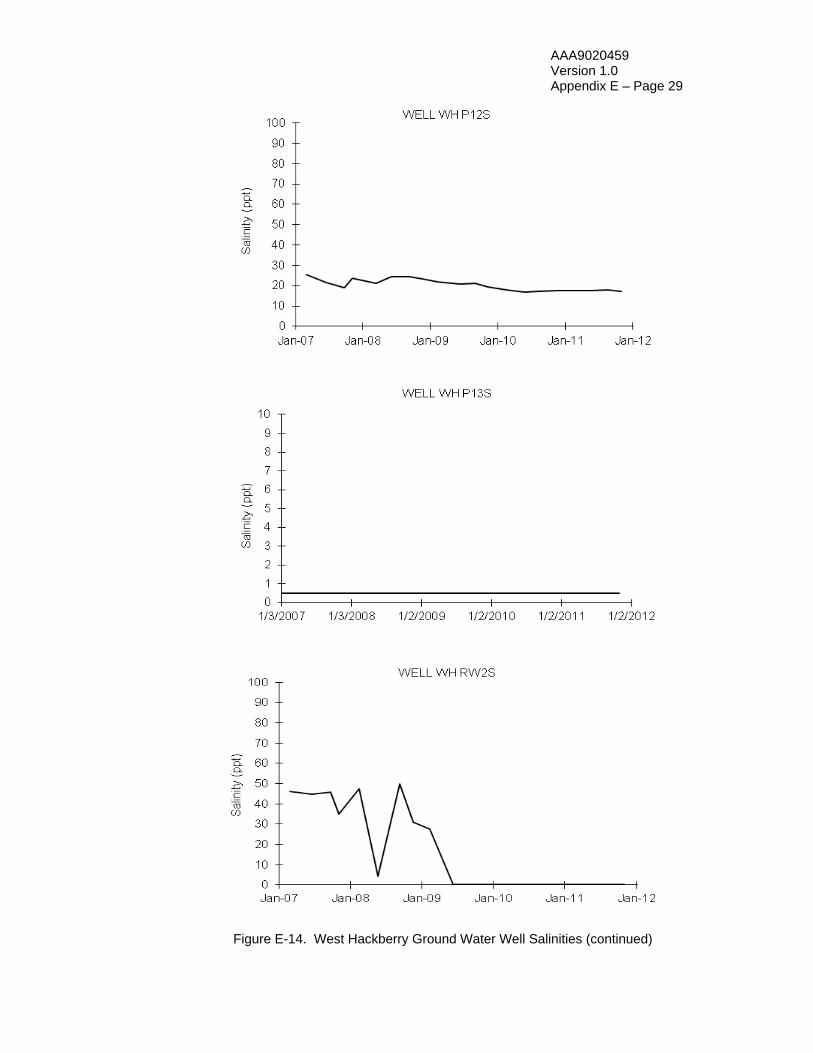
AAA9020459 Version 1.0 Appendix E – Page 29
Figure E-14. West Hackberry Ground Water Well Salinities (continued)
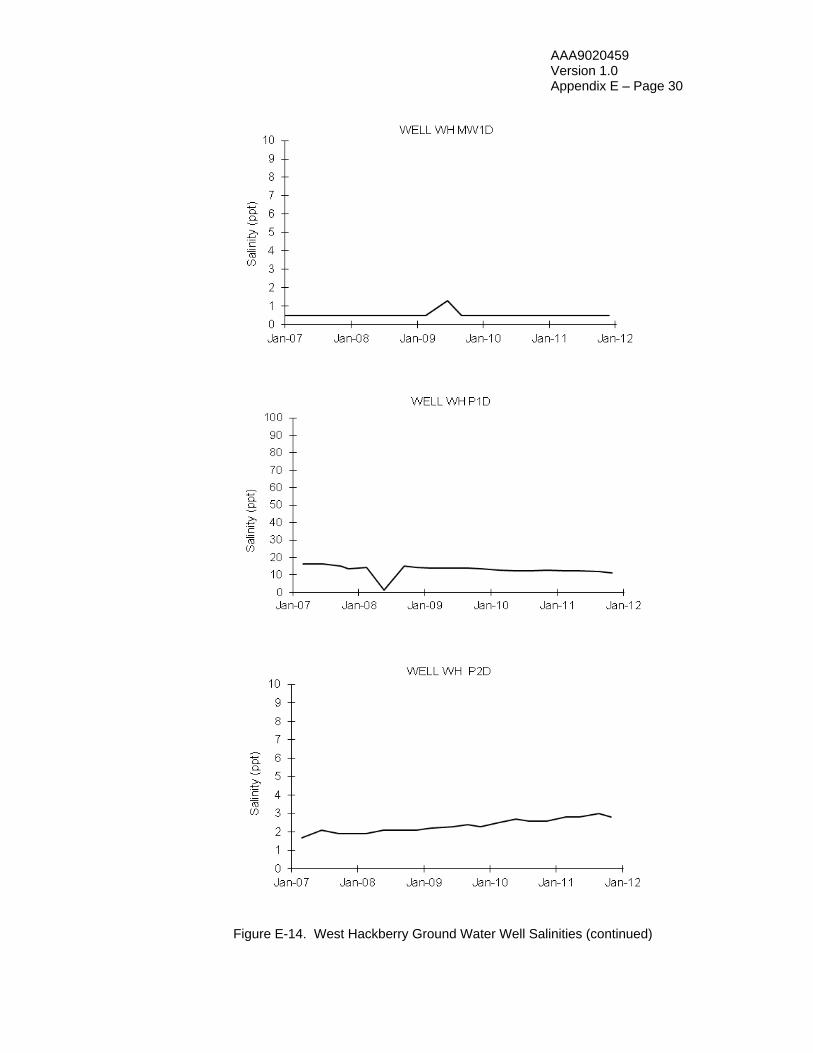
AAA9020459 Version 1.0 Appendix E – Page 30
Figure E-14. West Hackberry Ground Water Well Salinities (continued)
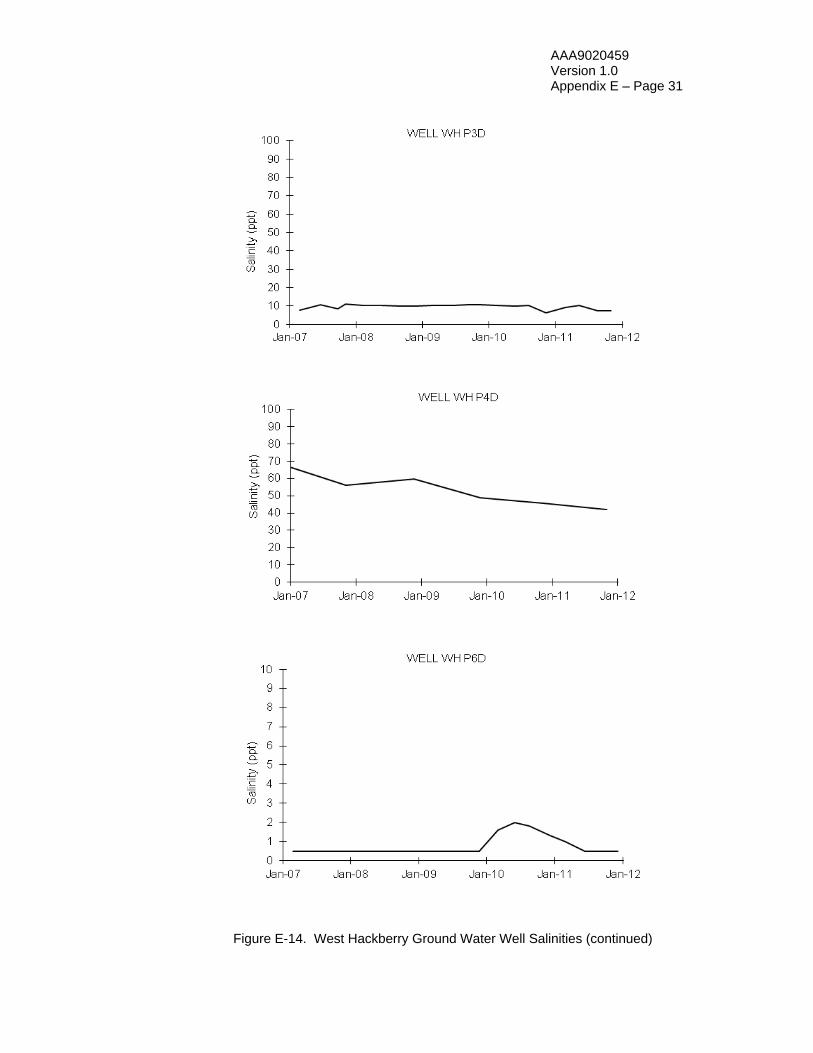
AAA9020459 Version 1.0 Appendix E – Page 31
Figure E-14. West Hackberry Ground Water Well Salinities (continued)

AAA9020459 Version 1.0 Appendix E – Page 32
Figure E-14. West Hackberry Ground Water Well Salinities (continued)

AAA9020459 Version 1.0 Appendix E – Page 33
Figure E-14. West Hackberry Ground Water Well Salinities (continued)

AAA9020459 Version 1.0 Appendix E – Page 34
Figure E-14. West Hackberry Ground Water Well Salinities (continued)
End of Appendix

AAA9020459 Version 1.0 References
REFERENCES American Public Health Association, American Water Works Association, and Water Pollution Control
Federation. Standard Methods for the Examination of Water and Wastewater. Washington, D.C.: American Public Health Association.
DynMcDermott Petroleum Operations Co. Emergency Management Plan and Implementing Procedures,
ASI5500.58. _____________. Emergency Response Procedures. All sites: BCI5500.3, Bayou Choctaw; BHI5500.4,
Big Hill; BMI5500.5, Bryan Mound; and, WHI5500.9, West Hackberry. _____________. ISO 14001 Environmental Management Systems Manual. ASI5400.55. _____________. Laboratory Programs and Procedures Manual, MSI7000.133. _____________. Pollution Prevention Plan, ASL5400.41. _____________. Spill Prevention Control and Countermeasures Plans. All sites: BCL5400.16, Bayou
Choctaw; BHL5400.21, Big Hill; BML5400.17, Bryan Mound; AAA4010.10, Stennis Warehouse; WHL5400.20, West Hackberry.
_____________. SPR Environmental Monitoring Plan, ASL5400.57. Faust, S. D., & Osman M. A.. Chemistry of Natural Waters. Ann Arbor: Ann Arbor Science Publishers,
1981. Geraghty & Miller, Inc. Environmental Services. Contamination Assessment Report and Remedial
Alternatives Analysis, Strategic Petroleum Reserve, West Hackberry, Louisiana. April 12, 1991. Louisiana Office of Water Resources. State of Louisiana Water Quality Standards. Oilfield Testers & Equipment Co., Contract S01M-035687. NORM Survey. March 25, 1991. Reid, George K. and Richard D. Wood. Ecology of Inland Waters and Estuaries. New York: D. Van
Nostrand Company. Sandia National Laboratories. Strategic Petroleum Reserve (SPR) Geological Site Characterization
Report Bryan Mound Salt Dome. SAND80-7111. October 1980; available from National Technical Information Service.
_____________. Strategic Petroleum Reserve (SPR) Geological Site Characterization Report Weeks
Island Salt Dome. SAND80-1323. October 1980; available from National Technical Information Service.
_____________. Strategic Petroleum Reserve (SPR) Geological Site Characterization Report West
Hackberry Salt Dome. SAND80-7131. October 1980; available from National Technical Information Service.
_____________. Strategic Petroleum Reserve (SPR) Geological Site Characterization Report Bayou
Choctaw Salt Dome. SAND80-7140. December 1980; available from National Technical Information Service.

AAA9020459 Version 1.0 References
_____________. Strategic Petroleum Reserve (SPR) Geological Site Characterization Report Big Hill Salt Dome. SAND81-1045. September 1981; available from National Technical Information Service.
Texas Department of Water Resources. Texas Surface Water Quality Standards. Texas Water Commission. Spill Response Map Series Coastal Region and Support Data, LP90-09,
August 1989. U. S. Department of Energy. Environmental Assessment of Oil Degasification at Four Strategic
Petroleum Reserve Facilities in Texas and Louisiana. July, 1994. U.S. Department of Energy. _____________. Environmental Assessment and Finding of No Significant Impact to Address the
Proposed Site Modifications at the Strategic Petroleum Reserve’s West Hackberry Raw Water Intake Structure Site, Cameron Parish, Louisiana. November 10, 2005.
_____________. FY 1997 - FY 2001 Strategic Petroleum Reserve Project Management Office
Environmental, Safety and Health Management Plan. May 25, 1995. U. S. Department of Energy.
_____________. Environmental Assessment on the Leasing of the Strategic Petroleum Reserve St.
James Terminal. January, 1995. U.S. Department of Energy. _____________. Environmental Assessment on the Leasing of the Strategic Petroleum Reserve Weeks
Island Facility. December, 1995. U.S. Department of Energy. _____________. Finding of No Significant Impact for Environmental Assessment of Oil Degasification
at Four Strategic Petroleum Reserve Facilities in Texas and Louisiana. September, 1994. U.S. Department of Energy.
_____________. Final Environmental Impact Statement, Strategic Petroleum Reserve, Seaway Group
Salt Domes. 3 vols. June 1978; available from National Technical Information Service. _____________. Final Environmental Impact Statement, Strategic Petroleum Reserve, Capline Group
Salt Domes. 4 vols. July 1978; available from National Technical Information Service. _____________. Final Environmental Impact Statement, Strategic Petroleum Reserve, Texoma Group
Salt Domes. 5 vols. November 1978; available from National Technical Information Service. _____________. Final Environmental Impact Statement, Site Selection for the Expansion of the Strategic
Petroleum Reserve. 2 volumes. December 2006, available from National Technical Information Service.
_____________. Final Supplement to Final Environmental Impact Statement, Strategic Petroleum
Reserve, Phase III Development, Texoma and Seaway Group Salt Domes. October 1981; available from National Technical Information Service.
_____________. Strategic Petroleum Reserve, Environmental Monitoring Plan. U. S. Department of
Energy. U. S. Environmental Protection Agency. Quality Criteria for Water; available from U.S. Government
Printing Office.
AAA9020459 Version 1.0 References
_____________. Handbook for Analytical Quality Control in Water and Wastewater Laboratories. EPA-600/4-79-019; Cincinnati, Ohio: Office of Research and Development.
_____________. Compilation of Air Pollutant Emission Factors, Supplement No. 12. April 1981;
Research Triangle Park, N.C.: Office of Air Quality Planning and Standards. _____________. Methods for Chemical Analysis of Water and Wastes EPA-600/4-79-020. Cincinnati,
Ohio: Office of Research and Development. _____________. Air Pollution Engineering Manual. Method AP-42; Research Triangle Park, N.C.:
Office of Air Quality Planning and Standards.
End of References

AAA9020459 Version 1.0 References
This page intentionally left blank
AAA9020459 Version 1.0 Distribution
This report is available on the World Wide Web at http://www.spr.doe.gov/esh/
DISTRIBUTION
This report is distributed widely by the Department of Energy's Strategic Petroleum Reserve
Project Management Office to local, state, and Federal government agencies, the Congress,
the public, and the news media.
End of Site Environmental Report


