86
Site Material Sampling Report Mojave Solar Project Harper Dry Lake San Bernardino County, California Prepared for: Mojave Solar LLC DOCKET 09-AFC-5 DATE RECD. APR 05 2010

Site Material Sampling Report Mojave Solar Project
Harper Dry Lake
San Bernardino County, California
Prepared for:
Mojave Solar LLC
DOCKET09-AFC-5
DATE RECD. APR 05 2010

2
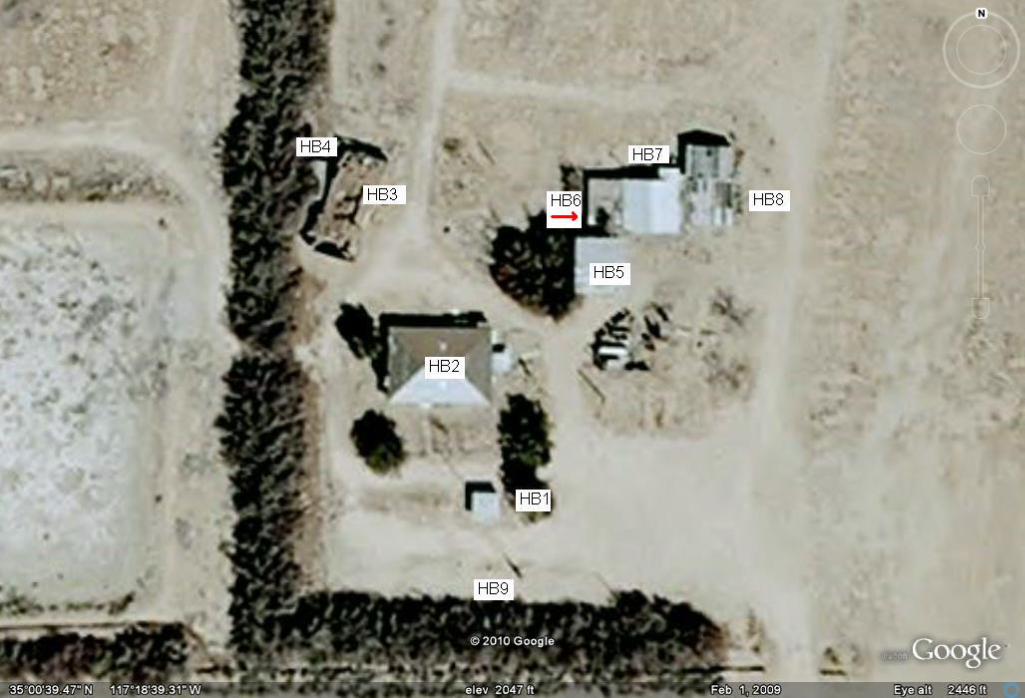
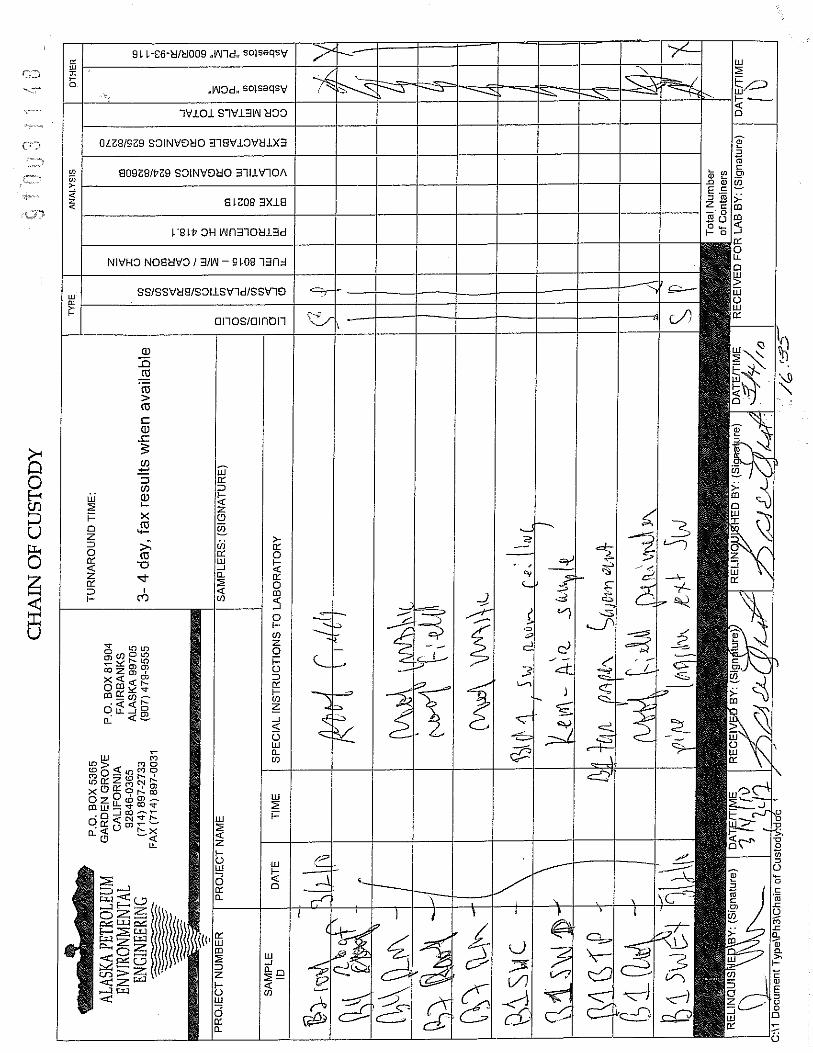
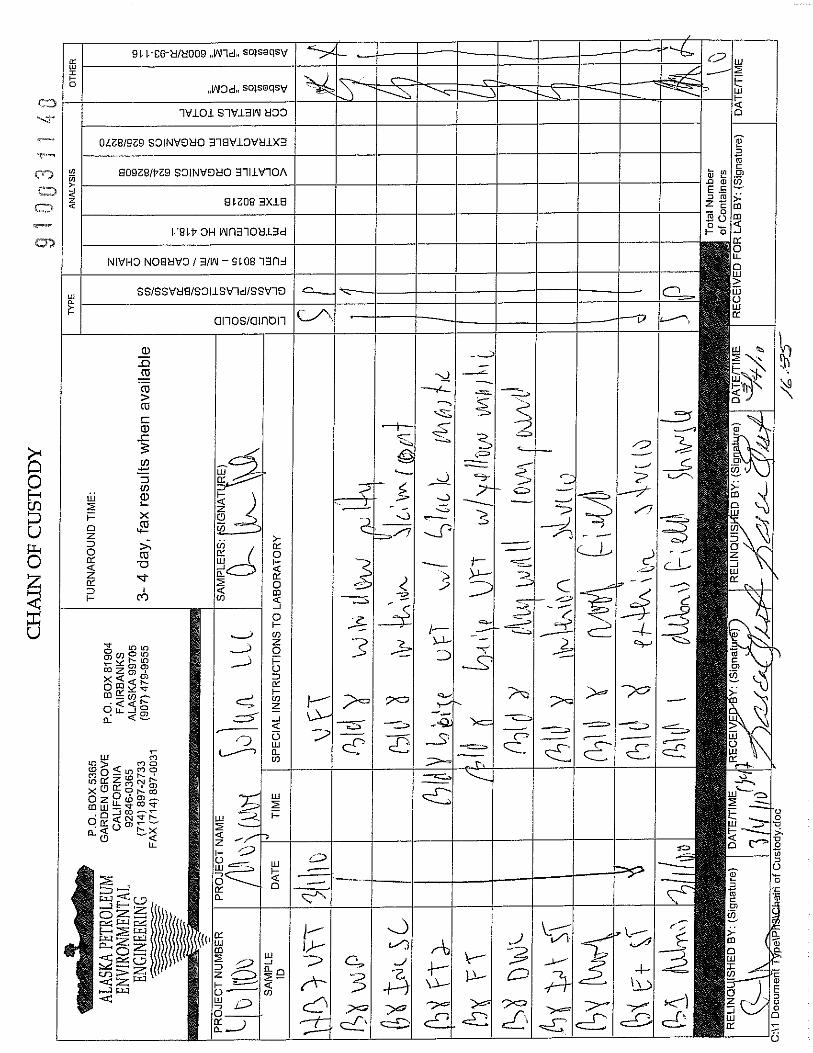
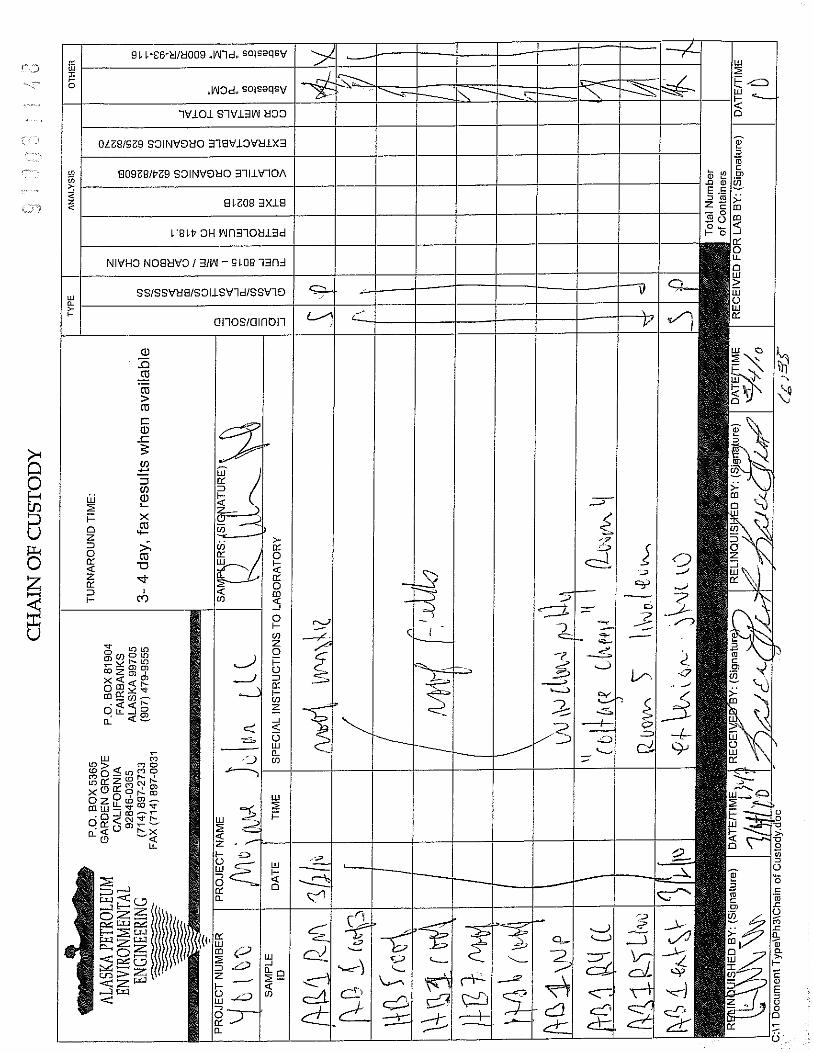
Introduction Mojave Solar, LLC, a Delaware limited liability company (herein “Mojave Solar”), is proposing to construct, own and operate the Mojave Solar Project (herein “Project”). The Project is a concentrating solar electric generating facility proposed on an approximately 1,765-acre site near Harper Dry Lake in San Bernardino County, California. Sampling Requirements As part of the “Application for Certification” process for the Project and at the request of the California Energy Commission (CEC), Mojave Solar performed a site sampling analysis of large, fallow agricultural fields and the existing, abandoned structures on the project site. These structures included various wood and concrete buildings, previous underground tank locations, and existing and abandoned well sites. The sampling and testing was outlined in the MSP Soil Sampling Plan approved by the CEC prior to the commencement of onsite sampling procedures. Sampling Procedures Field sampling was performed on March 1st and 2nd, 2010. Sampling was performed under the direction of state certified personnel at the site. Field sampling, testing, and observations were performed and material samples were obtained for further laboratory analysis. Soil samples for pesticide and herbicide analysis were collected in the locations identified on the plan map and composited for analysis. These samples were transported from the field to the certified lab location following standard sampling and testing procedures. Chain of Custody information for these samples is included with this report. Results of the field testing and observations are detailed on the “Field Asbestos and Lead Sampling Notes” included in this report. Laboratory Sampling Results The results of the laboratory testing of field samples from the site are attached to this report. Site maps of the existing structures and testing locations are included for reference to the laboratory data sheets. The assessor parcel numbers (APNs) for the testing locations are outlined on the original sampling plan proposal.
3
Conclusions and Recommendations The results of the field and laboratory analysis of the site samples are included in this report. While many samples came back as non-detectable, there were samples indicating the presence of asbestos containing materials (ACM), lead based paint (LBP), and hydrocarbon residue from previous underground fuel storage tanks located on the site. Sampling for pesticides and herbicides in the fallow agricultural areas indicated non-detectable results for pesticide and herbicide residue. Previous conversations with the county agricultural commissioner had indicated that the county did not expect any residues to be found due to the short half-life of normal chemicals used for this purpose. A pesticide sampling analysis provided by the sampling and testing agency is included in this report. As a follow-up, the following work should be completed prior to any demolition activities occurring on the site:
• All asbestos containing material ("ACM") has to be abated. Under Federal law, ACM is defined as material comprised of greater than 1% asbestos if it is or has the potential to become friable. Friable is defined as material that can be crumbled by hand pressure and releasing asbestos fibers, or asbestos fiber release is from mechanical means (i.e., "hard" demo).
• The lead-based paint ("LBP") has to be properly managed. This can be done
as a simple removal (e.g., door and door/window frames), or more detailed (i.e., exterior paint on former General Store). Upon demolition of this building some LBP will be released to the ground. The soil should be sampled to ensure it does not become impacted above regulatory action limits. This type of removal would be less expensive than LBP removal prior to demolition.
• The general store’s former fueling system should be investigated, as well as
the former aviation fuel ("AV") tank on the northern side of the building. Mitigation procedures should be interfaced with the appropriate governing agencies having jurisdiction over the project site.
• The hazardous materials/wastes located in the General Store's basement and
by Building 5 need to be properly managed and disposed/recycled. An abatement and remediation plan should be developed and instituted to properly dispose of the listed materials at the site. This plan should be prepared and instituted to complete this work in an orderly fashion and prior to the commencement of demolition and construction activities in the affected areas.

MOJAVE SOLAR PROJECT
SITE SAMPLING PLAN

Surface Soil Sampling The anticipated sample locations are shown on the attached Soil Sampling Plan and outlined in the attached soil sampling table. The sample locations were selected to give reasonable spatial coverage of the project site area. If present, soil contamination in the previously disturbed fallow agricultural areas is anticipated to be relatively shallow. Consequently, the focus of the proposed investigation for these areas is shallow soil. Soil samples for the fallow agriculture areas (labeled 1 through 12) will be collected from each quarter of the quarter sections at a depth of 0 to 8 inches. These surface samples will be collected using a trowel or appropriate hand equipment. The fallow agriculture samples will be consolidated and submitted for laboratory analysis of possible pesticide and/or herbicide residue per USEPA 8081A & USEPA 8151A Soil samples for the Phase I areas (labeled A through J) will be collected from the locations identified in the Phase I Environmental Site Assessment as showing evidence of surface staining from previous commercial and agricultural uses and locations of existing structures. Two soil samples will be collected from each location showing evidence of surface staining, a surface sample at 0 to 4 inches and a deeper sample at 20 to 24 inches. The surface sample will be collected using a trowel or appropriate hand equipment. The deeper sample will be collected using a hand auger or other appropriate equipment as necessary. These samples will be submitted for laboratory analysis of possible hydrocarbon residue per USEPA 8015M. Material samples will be collected in the locations of existing structures to test for evidence of lead and asbestos per EPA 6020 & USEPA 600/M4-82-020. Soil and Material Analysis The proposed analytical testing parameters and methods for soil and material samples will be performed by an independent, approved laboratory. Soil and material samples will be submitted for a combination of laboratory analysis. Analysis will be determined following consultation with and at the direction of the County of San Bernardino Environmental Health Department and the San Bernardino County Department of Agriculture.
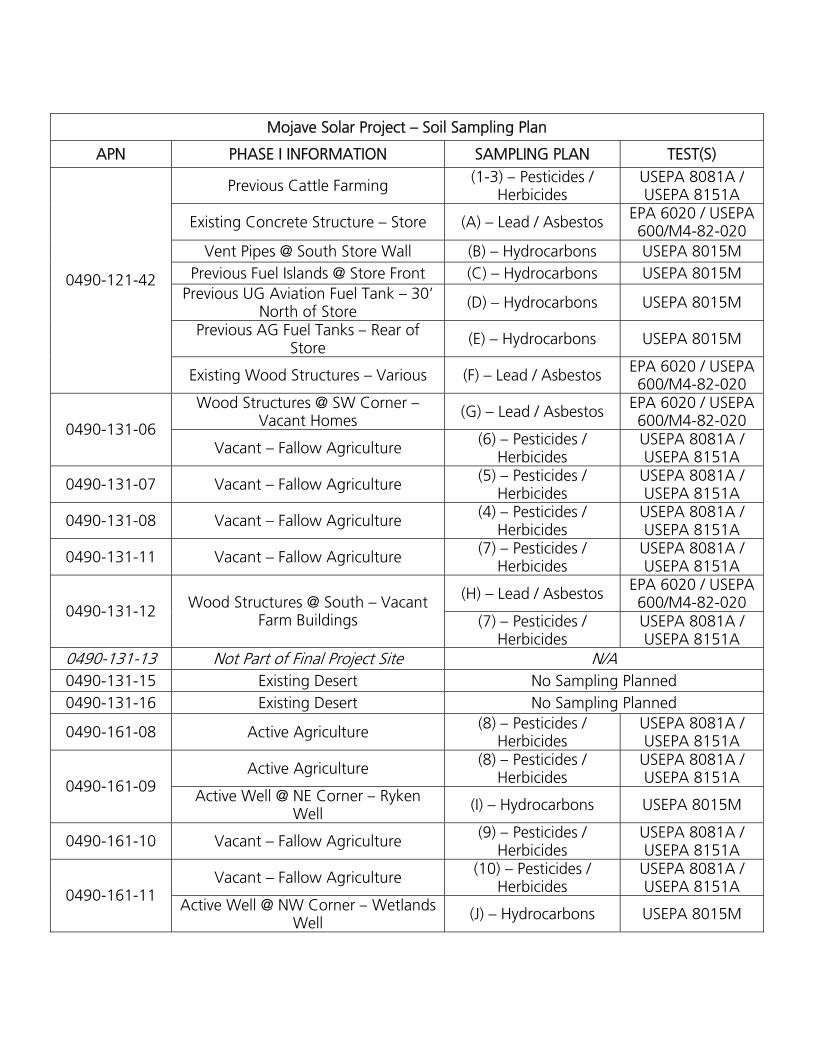
Mojave Solar Project – Soil Sampling Plan
APN PHASE I INFORMATION SAMPLING PLAN TEST(S)
Previous Cattle Farming (1-3) – Pesticides / Herbicides
USEPA 8081A / USEPA 8151A
Existing Concrete Structure – Store (A) – Lead / Asbestos EPA 6020 / USEPA 600/M4-82-020
Vent Pipes @ South Store Wall (B) – Hydrocarbons USEPA 8015M Previous Fuel Islands @ Store Front (C) – Hydrocarbons USEPA 8015M
Previous UG Aviation Fuel Tank – 30’ North of Store (D) – Hydrocarbons USEPA 8015M
Previous AG Fuel Tanks – Rear of Store (E) – Hydrocarbons USEPA 8015M
0490-121-42
Existing Wood Structures – Various (F) – Lead / Asbestos EPA 6020 / USEPA 600/M4-82-020
Wood Structures @ SW Corner – Vacant Homes (G) – Lead / Asbestos EPA 6020 / USEPA
600/M4-82-020 0490-131-06 Vacant – Fallow Agriculture (6) – Pesticides /
Herbicides USEPA 8081A / USEPA 8151A
0490-131-07 Vacant – Fallow Agriculture (5) – Pesticides / Herbicides
USEPA 8081A / USEPA 8151A
0490-131-08 Vacant – Fallow Agriculture (4) – Pesticides / Herbicides
USEPA 8081A / USEPA 8151A
0490-131-11 Vacant – Fallow Agriculture (7) – Pesticides / Herbicides
USEPA 8081A / USEPA 8151A
(H) – Lead / Asbestos EPA 6020 / USEPA 600/M4-82-020 0490-131-12 Wood Structures @ South – Vacant
Farm Buildings (7) – Pesticides / Herbicides
USEPA 8081A / USEPA 8151A
0490-131-13 Not Part of Final Project Site N/A 0490-131-15 Existing Desert No Sampling Planned 0490-131-16 Existing Desert No Sampling Planned
0490-161-08 Active Agriculture (8) – Pesticides / Herbicides
USEPA 8081A / USEPA 8151A
Active Agriculture (8) – Pesticides / Herbicides
USEPA 8081A / USEPA 8151A 0490-161-09
Active Well @ NE Corner – Ryken Well (I) – Hydrocarbons USEPA 8015M
0490-161-10 Vacant – Fallow Agriculture (9) – Pesticides / Herbicides
USEPA 8081A / USEPA 8151A
Vacant – Fallow Agriculture (10) – Pesticides / Herbicides
USEPA 8081A / USEPA 8151A 0490-161-11
Active Well @ NW Corner – Wetlands Well (J) – Hydrocarbons USEPA 8015M

0490-161-12 Vacant – Fallow Agriculture (12) – Pesticides / Herbicides
USEPA 8081A / USEPA 8151A
0490-161-13 Vacant – Fallow Agriculture (11) – Pesticides / Herbicides
USEPA 8081A / USEPA 8151A
0490-171-09 Not Part of Final Project Site N/A


RESULTS OF SOIL SAMPLING

SAMPLING LOCATIONS


SAMPLING RESULTS

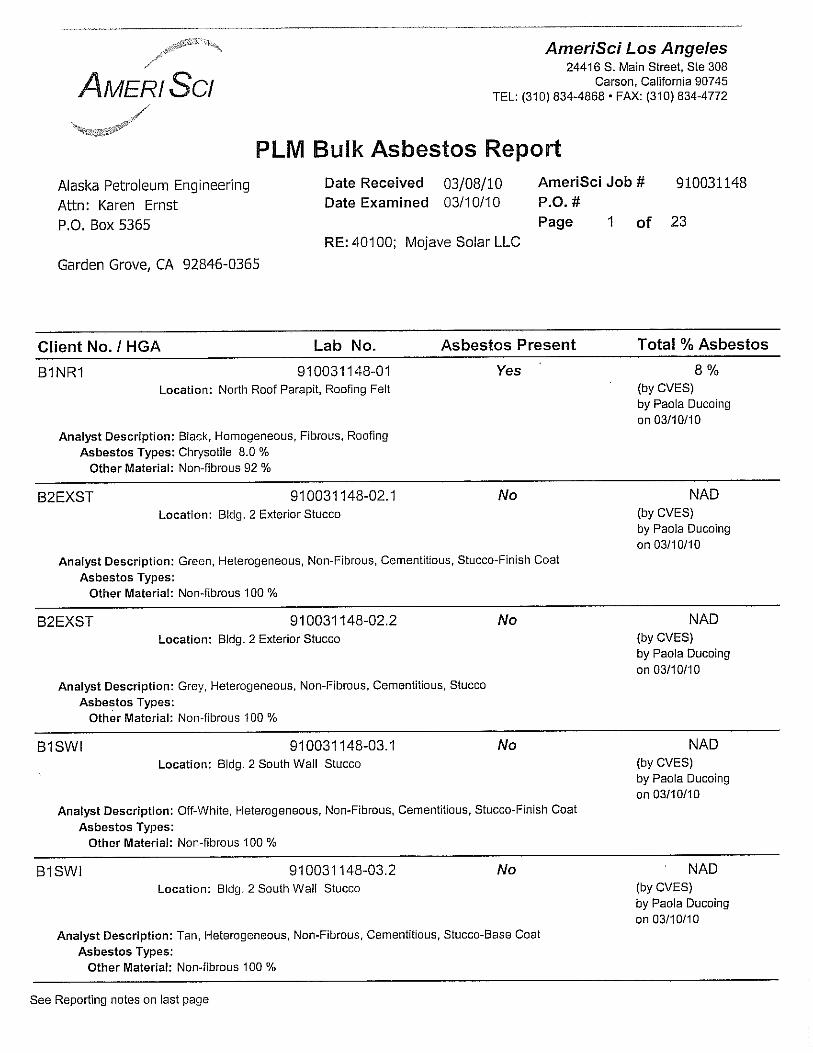
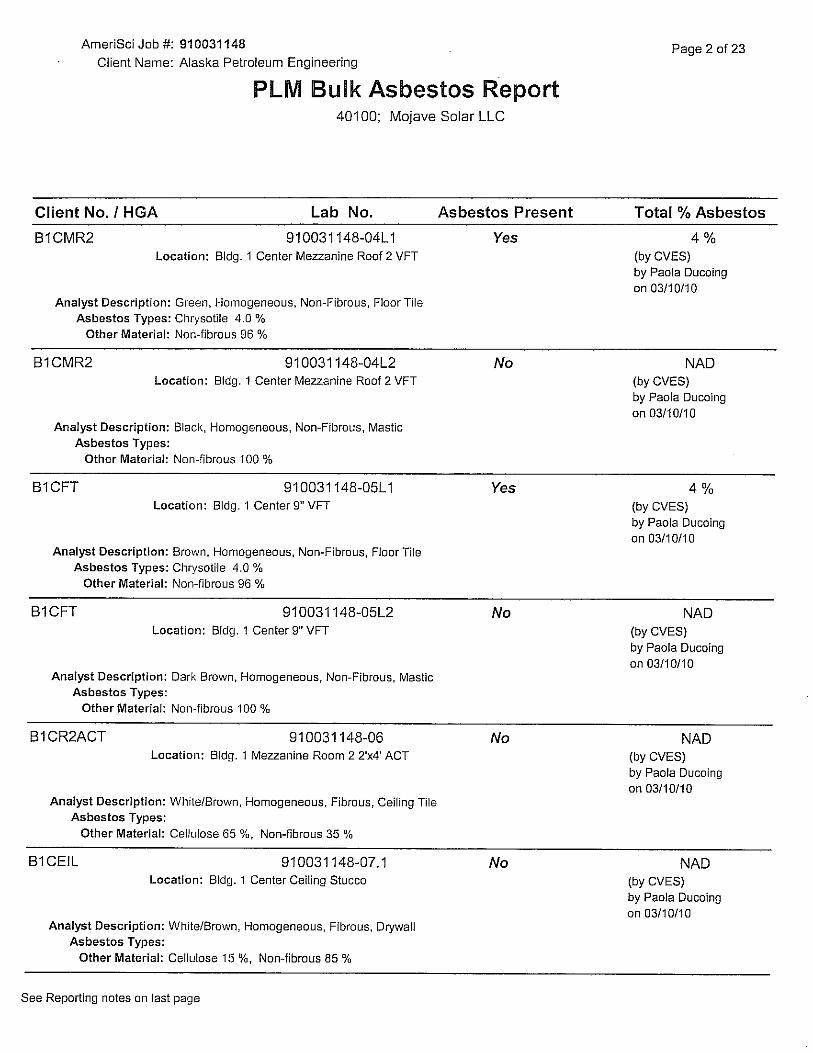
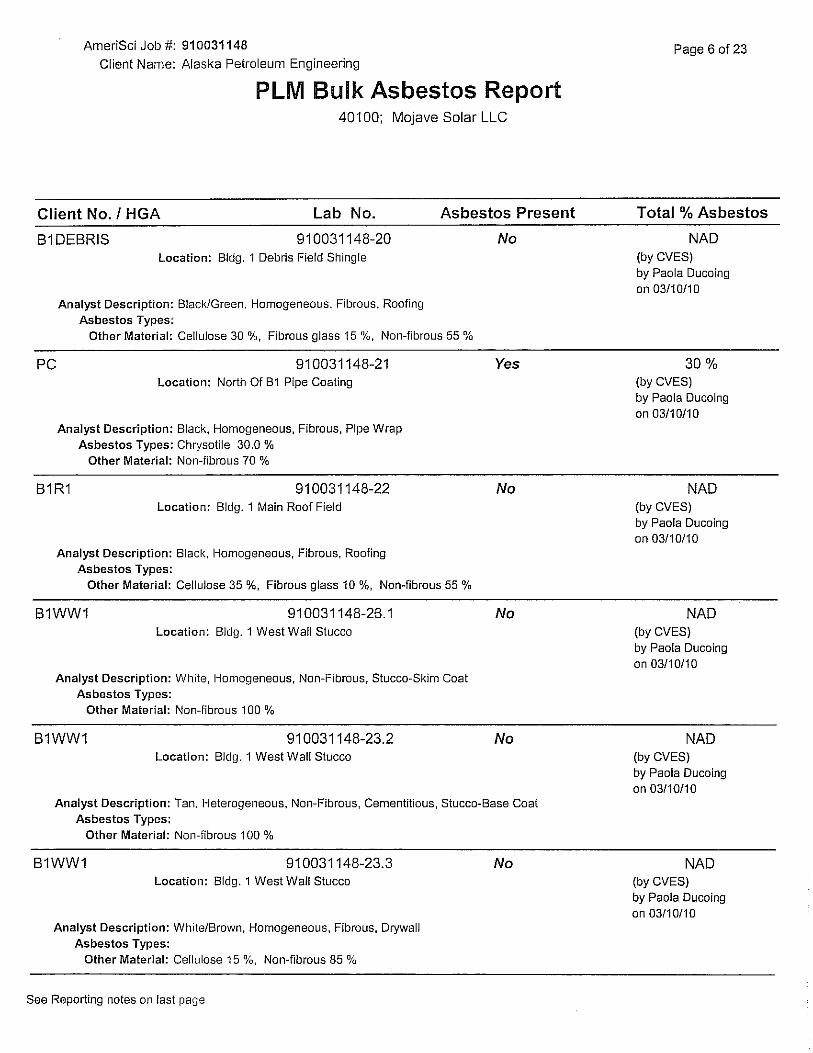
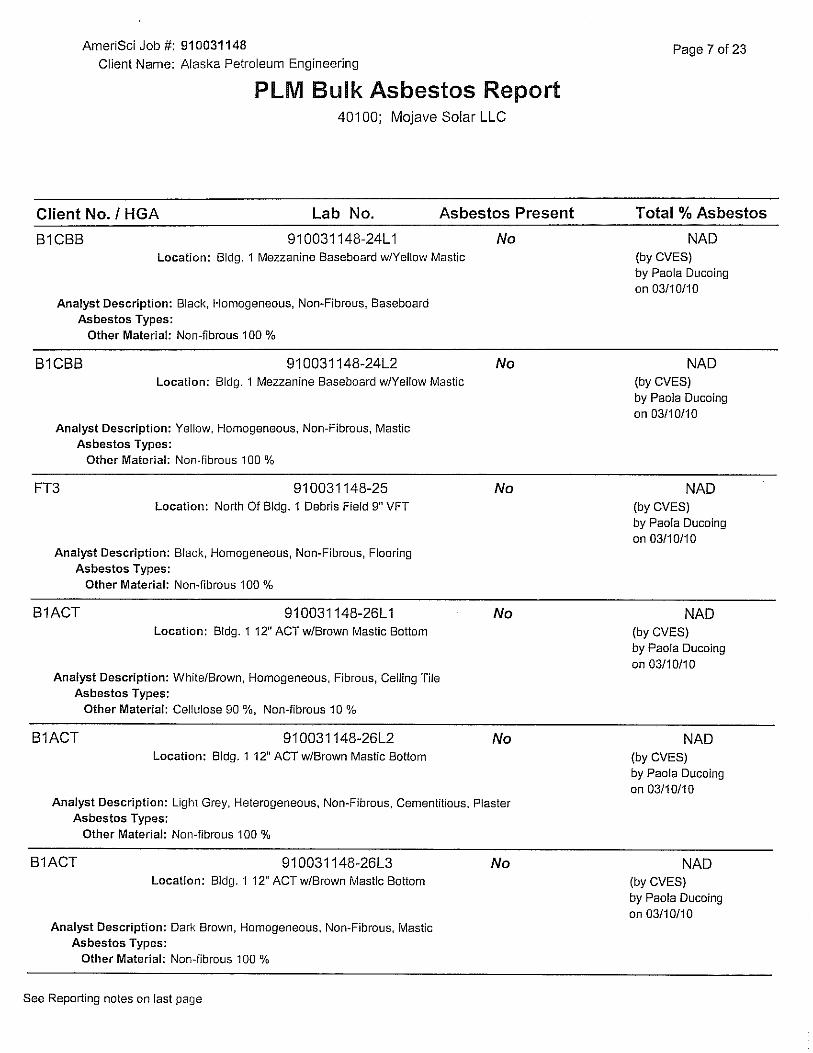
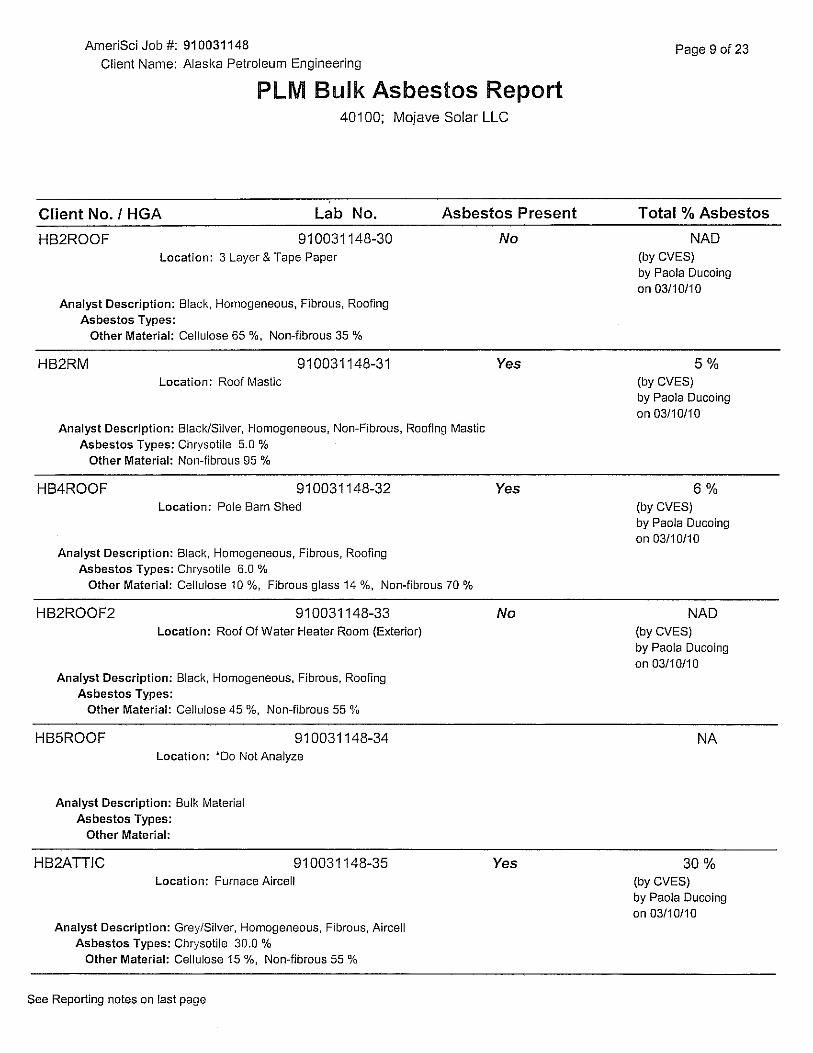
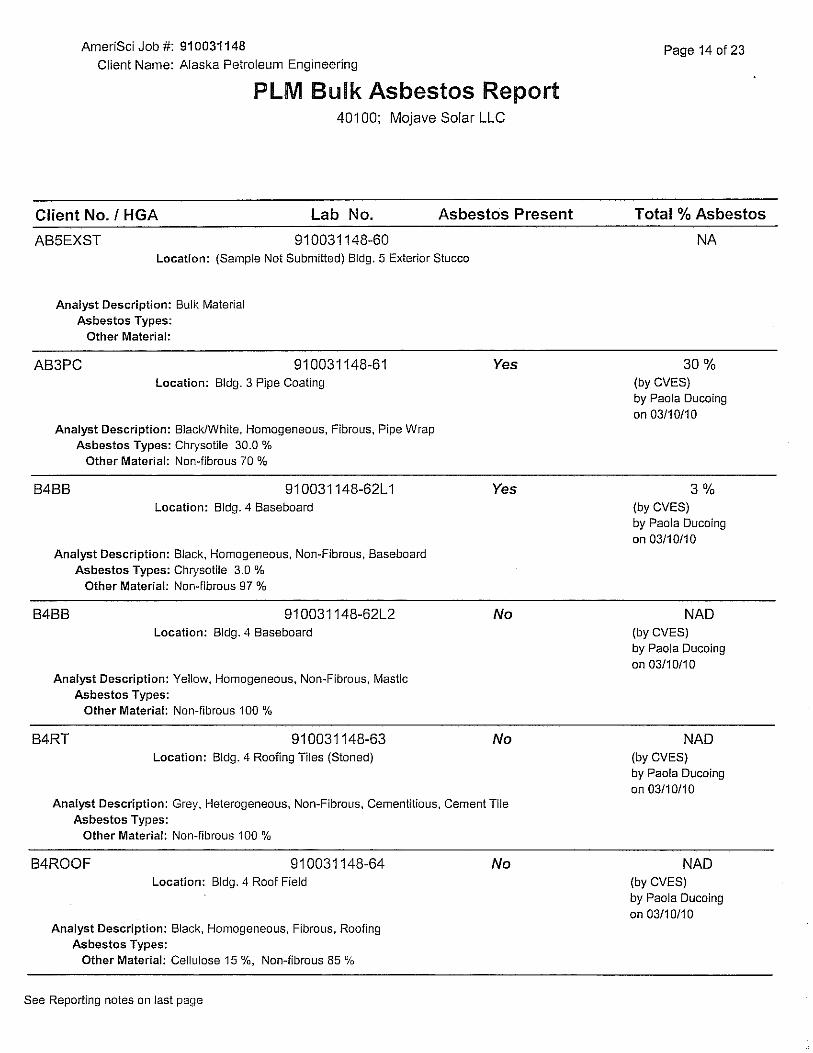
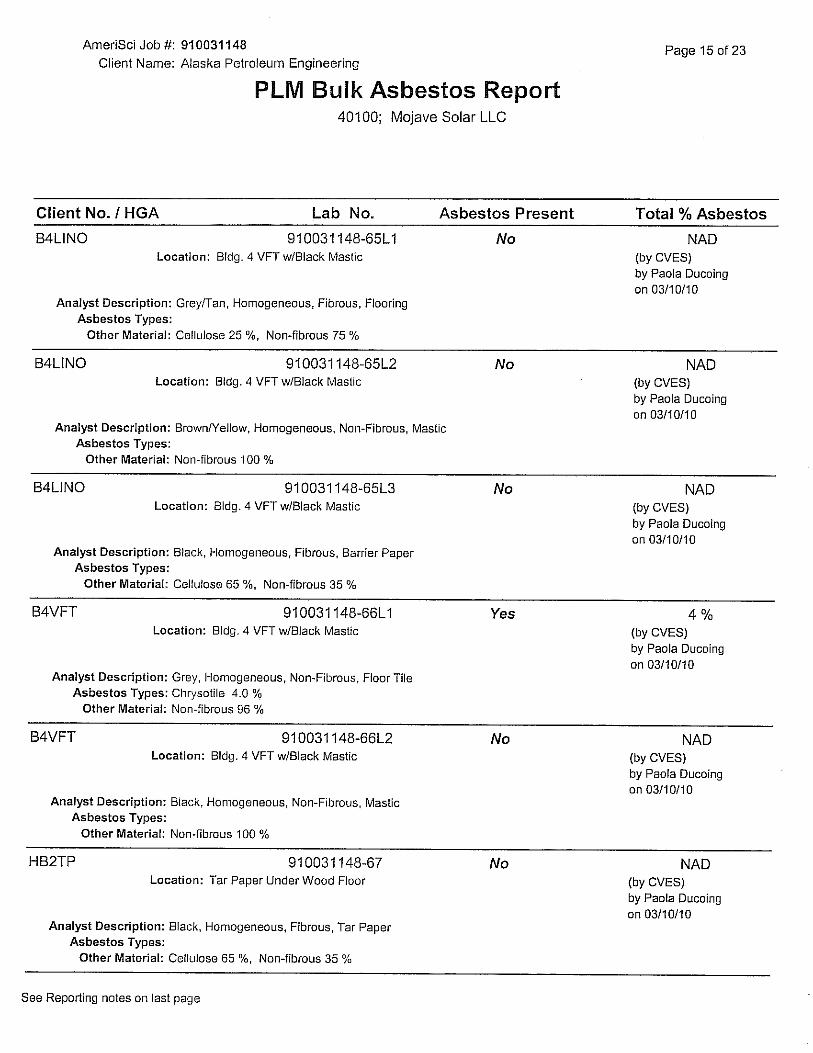
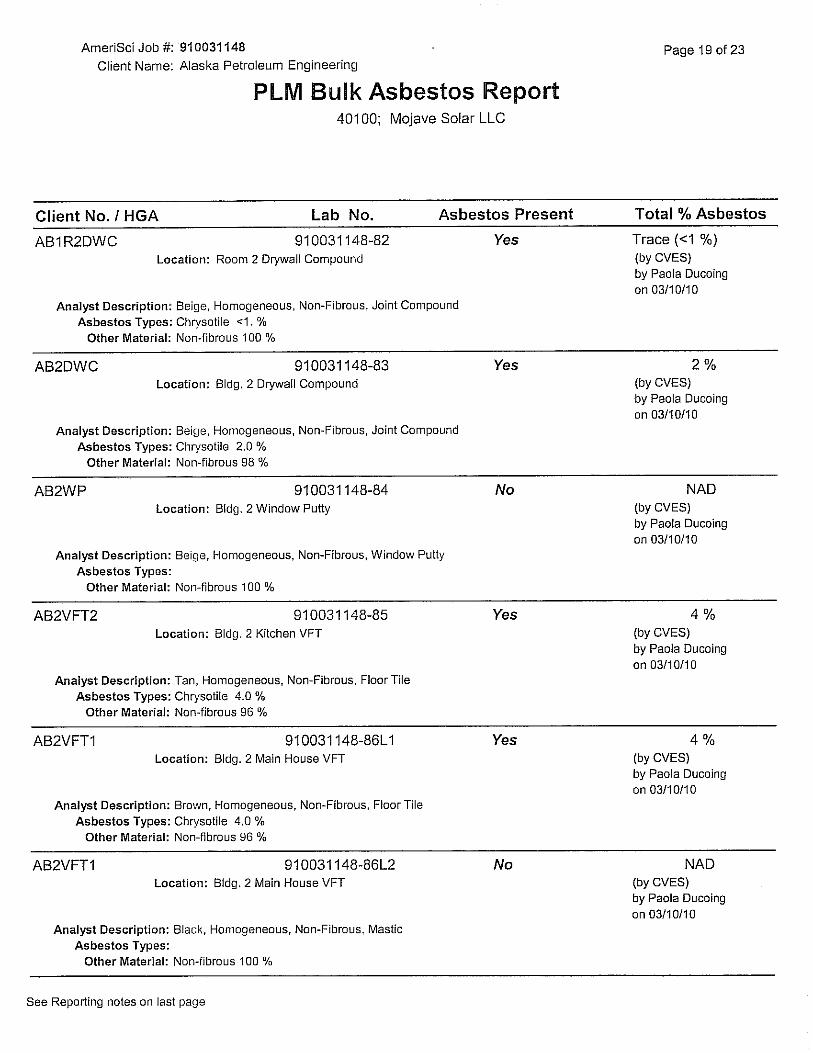
FIELD ASBESTOS & LEAD SAMPLING NOTES

General Store: 65 asbestos samples
Building Asbestos [1]
1 North exterior roof parapet roof field ExteriorMezzanine green 9" square vinyl floor tile (VFT)
Ground level and mezzanine brown 9" square VFTGround level brown 9" square VFT Interior
West from B1; pipe coatingWest from B1; broken 9" VFT in soil Mezzanine [7]
Ground level southern room, ceiling insulationBasement; 41 rolls of 6" x 100' tarpaper flashingSW exterior "closet"; pipe insulationWestern wall exterior window puttySouthern room green 9" VFT
2 Drywall joint compound
3 Exterior pipe wrap
4 Roof masticBaseboard9" VFT
5 Exterior broken Transite pipe piecesWindow putty
6 Exterior pipe wrapWindow puttyNorth exterior wall Transite pipe
7 Roof masticEastern exterior tan VFT in debris pile
8 None
9 None
10 Drywall joint compound
Northern room, eastern windowNorthern room, eastern door frame
Interior west wall (wood)
Lead - Based Paint [2]
North wallNorth wall, windows 6 - 10[3]
Room 1, 2, 3, 4, door jamb [4, 5]
Room 2, 3, 4, 6, 7, window [3, 5]
West wall
West wall, northern window
South wallSouth wall, window 7 [3]
South wall, doors 2 - 4 [4]
Room 5, door [5]
North wall
All exterior wallsSouthern window
Southern wall
Northern wall Room 7, 6, 5, 4, 3, 1, windowRoom 7, 5, 3, bath window
Interior eastern wall cabinets
All wallsDoor 2 [6]
South wall, southeastern room interior paints
Southern room
Main floor restrooms, ceramic tilesRoom 5, southern window
Hallway, just wood sills
Room 1, interior closet
Eastern Door

NOTES1 Fuel leak at former fuel dispenser island; entire piping should be investigated per County Fire regulations1 Fuel leak at former northern AV gas tank1 Transite piece exterior southwest corner1 Transite pieces exterior southwest corner1 Drum storage in basement1 West from building; two stage clarifier1 Potential for lead solder in 4" cast iron pipe joints1 Elevator brake shoes likely asbestos
All Fluorescent light ballasts need to be inspected for PCBs5 South exterior waste grease and oil drums6 Herbicide bag inside building8 West from building; potential former hydraulic lifts with hydrocarbon building-up
HB5 Potential former Mechanic's Pit in garage
[1] = analyzed to contain greater than 1% asbestos that is or may become friable during demolition
[2] = greater than 1.0 mg/cm 2 as measured with an XRF
[3] = Wall windows numbered sequentially from west to east
[4] = Door and/or door jambs numbered sequentially from west to east
[5] = Rooms numbered sequentially from west to east
[6] = Western walls doors numbered sequentially from north to south
[7] = General store's mezzanine rooms numbered sequentially from north to south

PRIMARY SAMPLING RESULTS

Alpha Scientific CorporationEnvironmental Laboratories
16760 Gridley Road, Cerritos, CA 90703 Phone: (562) 809-8880 Fax: (562) 809-88011
03-10-2010
Mr. Glenn StillmanAlaska Petroleum Environmental EngineeringP.O. Box 5365Garden Grove, CA 92846-0365
Project: 40100Project Site: Mojave Solar LLCSample Date: 03-01-2010Lab Job No.: AD003012
Dear Mr. Stillman:
Enclosed please find the analytical report for the sample(s) received by Alpha Scientific Corporation on 03-04-2010 and analyzed by the following EPA methods:
EPA 8015M (Total Petroleum Hydrocarbons)EPA 8260B (BTEX & Oxygenates by GC/MS)EPA 6010B/7471A for CAM MetalsEPA 8081A (Organochlorine Pesticides)EPA 8082 (PCBs)EPA 8151A (Chlorinated Herbicides)
EPA 8151A analyses were subcontracted to ABC Environmental Laboratories (ELAP # 2584).
All analyses have met the QA/QC criteria of this laboratory.
The sample(s) arrived in good conditions (i.e., chilled, intact) and with a chain of custody record attached.
Alpha Scientific Corporation is a CA DHS certified laboratory (Certificate Number 2633). Thank you for giving usthe opportunity to serve you. Please feel free to call me at (562) 809-8880 if our laboratory can be of further service toyou.
Sincerely,
Roger Wang, Ph. D.Laboratory Director
Enclosures
This cover letter is an integral part of this analytical report.
Alpha Scientific CorporationEnvironmental Laboratories
16760 Gridley Road, Cerritos, CA 90703 Phone: (562) 809-8880 Fax: (562) 809-88012
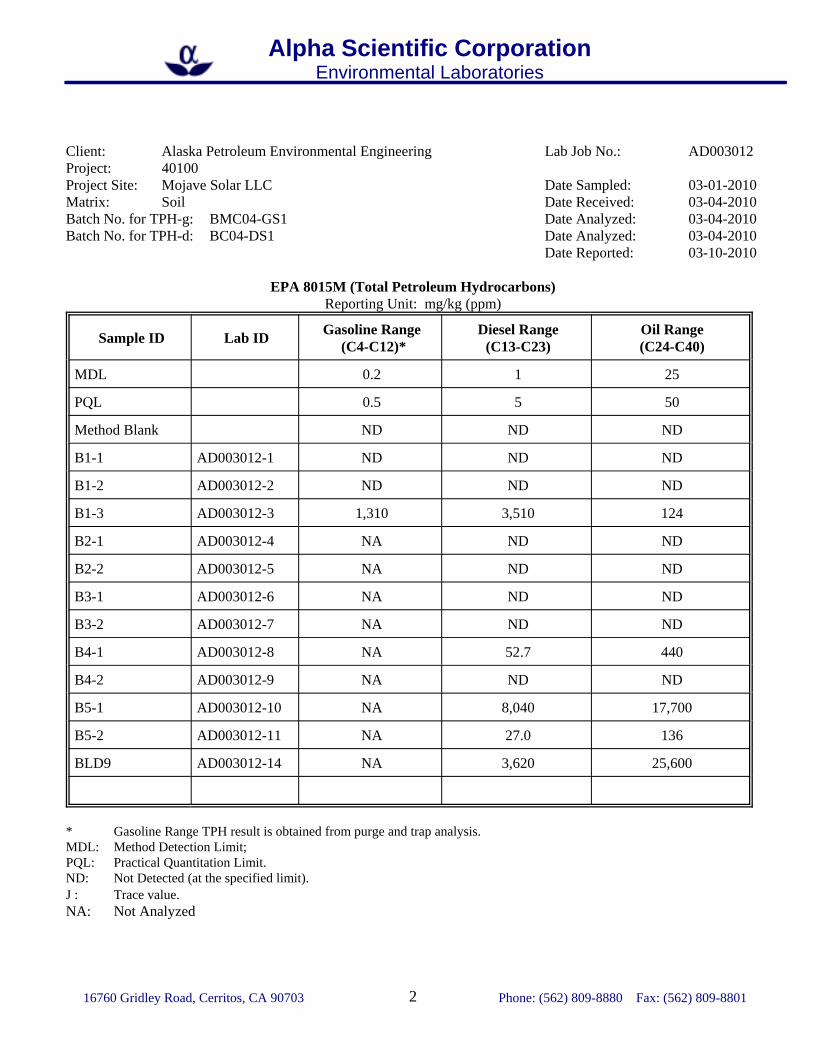
Client: Alaska Petroleum Environmental Engineering Lab Job No.: AD003012Project: 40100Project Site: Mojave Solar LLC Date Sampled: 03-01-2010Matrix: Soil Date Received: 03-04-2010Batch No. for TPH-g: BMC04-GS1 Date Analyzed: 03-04-2010Batch No. for TPH-d: BC04-DS1 Date Analyzed: 03-04-2010
Date Reported: 03-10-2010
EPA 8015M (Total Petroleum Hydrocarbons)Reporting Unit: mg/kg (ppm)
Sample ID Lab ID Gasoline Range (C4-C12)*
Diesel Range(C13-C23)
Oil Range(C24-C40)
MDL 0.2 1 25
PQL 0.5 5 50
Method Blank ND ND ND
B1-1 AD003012-1 ND ND ND
B1-2 AD003012-2 ND ND ND
B1-3 AD003012-3 1,310 3,510 124
B2-1 AD003012-4 NA ND ND
B2-2 AD003012-5 NA ND ND
B3-1 AD003012-6 NA ND ND
B3-2 AD003012-7 NA ND ND
B4-1 AD003012-8 NA 52.7 440
B4-2 AD003012-9 NA ND ND
B5-1 AD003012-10 NA 8,040 17,700
B5-2 AD003012-11 NA 27.0 136
BLD9 AD003012-14 NA 3,620 25,600
* Gasoline Range TPH result is obtained from purge and trap analysis.MDL: Method Detection Limit;PQL: Practical Quantitation Limit.ND: Not Detected (at the specified limit).J : Trace value. NA: Not Analyzed

Alpha Scientific CorporationEnvironmental Laboratories
16760 Gridley Road, Cerritos, CA 90703 Phone: (562) 809-8880 Fax: (562) 809-88013
03-10-2010
Client: Alaska Petroleum Environmental Engineering Lab Job No.: AD003012Project: 40100Project Site: Mojave Solar LLC Date Sampled: 03-01-2010Matrix: Soil Date Received: 03-04-2010Batch No: 0304-VOBS1 Date Analyzed: 03-04-2010
EPA 8260B (BTEX & Oxygenates by GC/MS)Reporting Units: mg/kg (ppm)
Lab ID MethodBlank
AD003012-3 MDL PQL
Sample ID B1-3
DF 1 100Benzene ND ND 0.001 0.002Toluene ND ND 0.001 0.002
Ethylbenzene ND 3.58 0.001 0.002Total Xylenes ND 34.8* 0.002 0.004
Ethanol ND ND 0.50 1.00MTBE ND ND 0.002 0.005ETBE ND ND 0.002 0.005DIPE ND ND 0.002 0.005
TAME ND ND 0.002 0.005TBA ND ND 0.002 0.005
MDL=Method Detection Limit; PQL=Practical Quantitation Limit; DF=Dilution Factor;ND=Not Detected (below DF × MDL); * Obtained from higher dilution.J=Trace value: result is lower than DF × PQL but higher than DF × MDL.

Alpha Scientific CorporationEnvironmental Laboratories
16760 Gridley Road, Cerritos, CA 90703 Phone: (562) 809-8880 Fax: (562) 809-88014
Client: Alaska Petroleum Environmental Engineering Lab Job No.: AD003012Project: 40100Project Site: Mojave Solar LLC Date Sampled: 03-01-2010Matrix: Soil Date Received: 03-04-2010Digestion Method: EPA 3050B Date Digested: 03-04-2010Batch No. for 6010B: 0305-MS1 Date Analyzed: 03-05-2010Batch No. for Hg: 0305-HgS1 Date Analyzed: 03-05-2010
Date Reported: 03-10-2010
EPA 6010B/7471A for Cam Metals (TTLC)Reporting Units: mg/kg (ppm)
ElementEPA Method
BlankAD003012-
13AD003012-
14 PQL
Method Slag BLD9Antimony (Sb) 6010B ND ND ND 2Arsenic (As) 6010B ND ND 2.2 0.5Barium (Ba) 6010B ND 74.2 32.1 2
Beryllium (Be) 6010B ND ND ND 2Cadmium (Cd) 6010B ND ND ND 2Chromium (Cr) 6010B ND 13.1 7.0 2
Cobalt (Co) 6010B ND 13.8 ND 2Copper (Cu) 6010B ND 15.7 15.8 2
Lead (Pb) 6010B ND 5.8 45.9 2Mercury (Hg) 7471A ND ND ND 0.05Molybdenum
(Mo) 6010B ND ND 2.0 2
Nickel (Ni) 6010B ND 25.9 5.3 2Selenium (Se) 6010B ND ND ND 0.5
Silver (Ag) 6010B ND ND 40.2 2Thallium (Tl) 6010B ND ND ND 2Vanadium (V) 6010B ND 127 21.4 2
Zinc (Zn) 6010B ND 52.3 123 1
PQL: Practical Quantitation Limit.ND: Not Detected (at the specified limit).

Alpha Scientific CorporationEnvironmental Laboratories
16760 Gridley Road, Cerritos, CA 90703 Phone: (562) 809-8880 Fax: (562) 809-88015
Client: Alaska Petroleum Environmental Engineering Lab Job No.: AD003012Project: 40100Project Site: Mojave Solar LLC Date Sampled: 03-01-2010Matrix: Soil Date Received: 03-04-2010Prep. Method: EPA 3550B Date Prepared: 03-04-2010Batch No. CC05-PS1 Date Analyzed: 03-05-2010
Date Reported: 03-10-2010
EPA 8081A (Organochlorine Pesticides)Reporting Unit: µg/kg (ppb)
LAB SAMPLE I.D. MB AD003012-12 CLIENT SAMPLE I.D. AG-1
DILUTION FACTOR COMPOUND MDL PQL
Alpha-BHC 3 5 ND NDGamma-BHC (Lindane) 3 5 ND NDHeptachlor 3 5 ND NDAldrin 3 5 ND NDBetta-BHC 3 5 ND NDDelta-BHC 3 5 ND NDHeptachlor Epoxide 3 5 ND NDEndosulfan I 3 5 ND ND4,4'-DDE 3 5 ND NDDieldrin 3 5 ND NDEndrin 3 5 ND ND4,4'-DDD 3 5 ND NDEndosulfan II 3 5 ND ND4,4'-DDT 3 5 ND NDEndrin Aldehyde 3 5 ND NDEndosulfan Sulfate 3 5 ND NDMethoxychlor 3 5 ND NDChlordane 15 25 ND NDToxaphene 60 100 ND ND
MDL=Method Detection Limit; PQL=Practical Quantitation Limit; MB=Method Blank; ND=Not Detected (below DF × MDL). J=Result is beween DF × MDL and DF × PQL; * Obtained from a higher dilution analysis.
Alpha Scientific CorporationEnvironmental Laboratories
16760 Gridley Road, Cerritos, CA 90703 Phone: (562) 809-8880 Fax: (562) 809-88016
03-10-2010
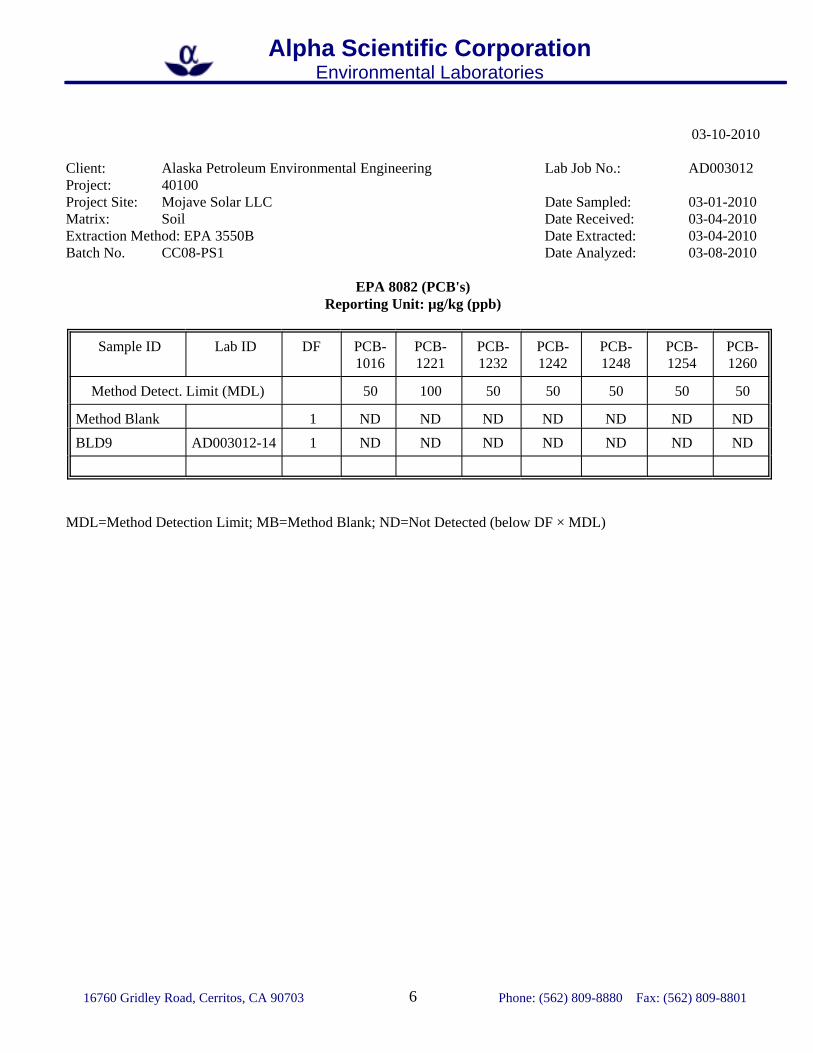
Client: Alaska Petroleum Environmental Engineering Lab Job No.: AD003012Project: 40100Project Site: Mojave Solar LLC Date Sampled: 03-01-2010Matrix: Soil Date Received: 03-04-2010Extraction Method: EPA 3550B Date Extracted: 03-04-2010Batch No. CC08-PS1 Date Analyzed: 03-08-2010
EPA 8082 (PCB's)Reporting Unit: µg/kg (ppb)
Sample ID Lab ID DF PCB-1016
PCB-1221
PCB-1232
PCB-1242
PCB-1248
PCB-1254
PCB-1260
Method Detect. Limit (MDL) 50 100 50 50 50 50 50
Method Blank 1 ND ND ND ND ND ND NDBLD9 AD003012-14 1 ND ND ND ND ND ND ND
MDL=Method Detection Limit; MB=Method Blank; ND=Not Detected (below DF × MDL)

Alpha Scientific CorporationEnvironmental Laboratories
16760 Gridley Road, Cerritos, CA 90703 Phone: (562) 809-8880 Fax: (562) 809-88017
03-10-2010
TPH-GasolineBatch QA/QC Report
Client: Alaska Petroleum Environmental Engineering Lab Job No.: AD003012Project: 40100Matrix: Soil Lab Sample ID: Q003011-1Batch No: BMC04-GS1 Date Analyzed: 03-04-2010
I. MS/MSD ReportUnit: ppb
Analyte SampleConc.
SpikeConc.
MS MSD MS %Rec.
MSD%Rec.
% RPD %RPDAccept.Limit
%RecAccept.Limit
TPH-g ND 1,000 1,180 1,250 118.0 125.0 5.8 30 70-130
II. LCS ResultUnit: ppb
Analyte LCS Value True Value Rec.% Accept. Limit
TPH-g 842 1,000 84.2 80-120
ND: Not Detected (at the specified limit).

Alpha Scientific CorporationEnvironmental Laboratories
16760 Gridley Road, Cerritos, CA 90703 Phone: (562) 809-8880 Fax: (562) 809-88018
03-10-2010
EPA 8015M (TPH)Batch QA/QC Report
Client: Alaska Petroleum Environmental Engineering Lab Job No.: AD003012Project: 40100Matrix: Soil Lab Sample ID: AD003012-1Batch No. for TPH-d: BC04-DS1 Date Analyzed: 03-04-2010
I. MS/MSD ReportUnit: ppm
Analyte SampleConc.
SpikeConc.
MS MSD MS %Rec.
MSD%Rec.
% RPD %RPDAccept.Limit
%RecAccept.Limit
TPH-D ND 200 218 219 109.0 109.5 0.5 30 70-130
II. LCS ResultUnit: ppm
Analyte LCS Report Value True Value Rec.% %RecAccept. Limit
TPH-D 217 200 108.5 80-120
ND: Not Detected (at the specified limit).
Alpha Scientific CorporationEnvironmental Laboratories
16760 Gridley Road, Cerritos, CA 90703 Phone: (562) 809-8880 Fax: (562) 809-88019
03-10-2010
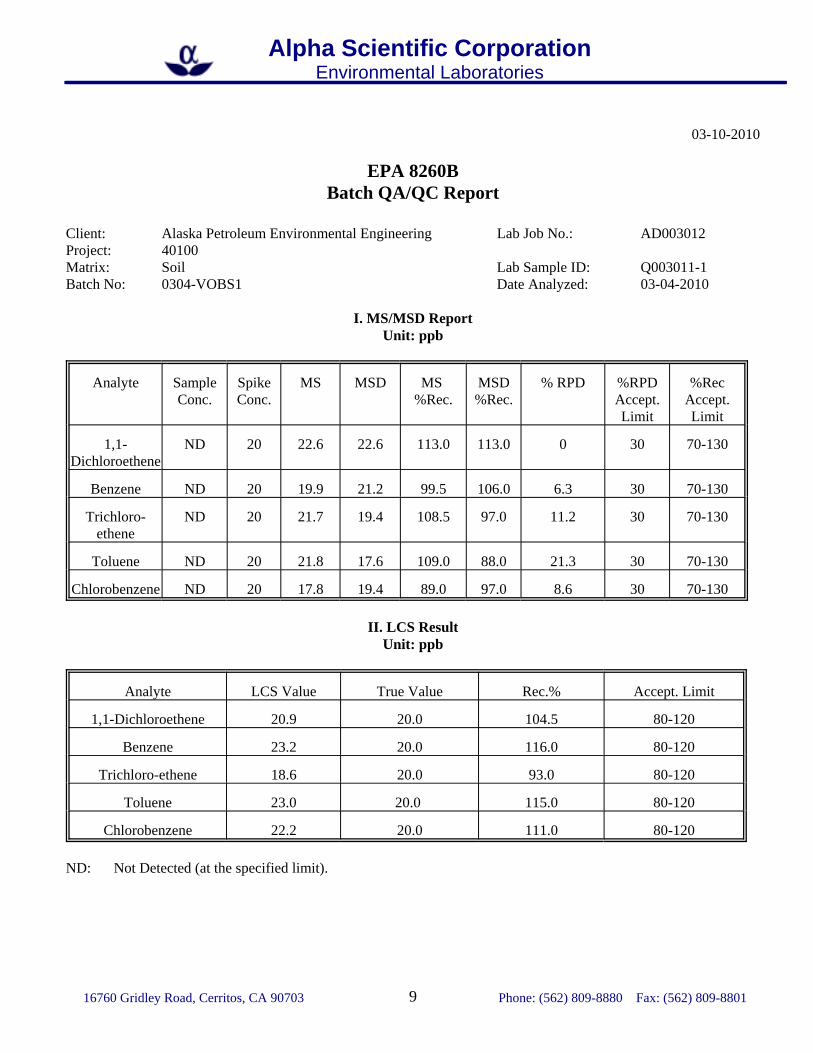
EPA 8260BBatch QA/QC Report
Client: Alaska Petroleum Environmental Engineering Lab Job No.: AD003012Project: 40100Matrix: Soil Lab Sample ID: Q003011-1Batch No: 0304-VOBS1 Date Analyzed: 03-04-2010
I. MS/MSD ReportUnit: ppb
Analyte SampleConc.
SpikeConc.
MS MSD MS %Rec.
MSD%Rec.
% RPD %RPDAccept.Limit
%RecAccept.Limit
1,1-Dichloroethene
ND 20 22.6 22.6 113.0 113.0 0 30 70-130
Benzene ND 20 19.9 21.2 99.5 106.0 6.3 30 70-130
Trichloro-ethene
ND 20 21.7 19.4 108.5 97.0 11.2 30 70-130
Toluene ND 20 21.8 17.6 109.0 88.0 21.3 30 70-130
Chlorobenzene ND 20 17.8 19.4 89.0 97.0 8.6 30 70-130
II. LCS ResultUnit: ppb
Analyte LCS Value True Value Rec.% Accept. Limit
1,1-Dichloroethene 20.9 20.0 104.5 80-120
Benzene 23.2 20.0 116.0 80-120
Trichloro-ethene 18.6 20.0 93.0 80-120
Toluene 23.0 20.0 115.0 80-120
Chlorobenzene 22.2 20.0 111.0 80-120
ND: Not Detected (at the specified limit).
Alpha Scientific CorporationEnvironmental Laboratories
16760 Gridley Road, Cerritos, CA 90703 Phone: (562) 809-8880 Fax: (562) 809-880110
03-10-2010
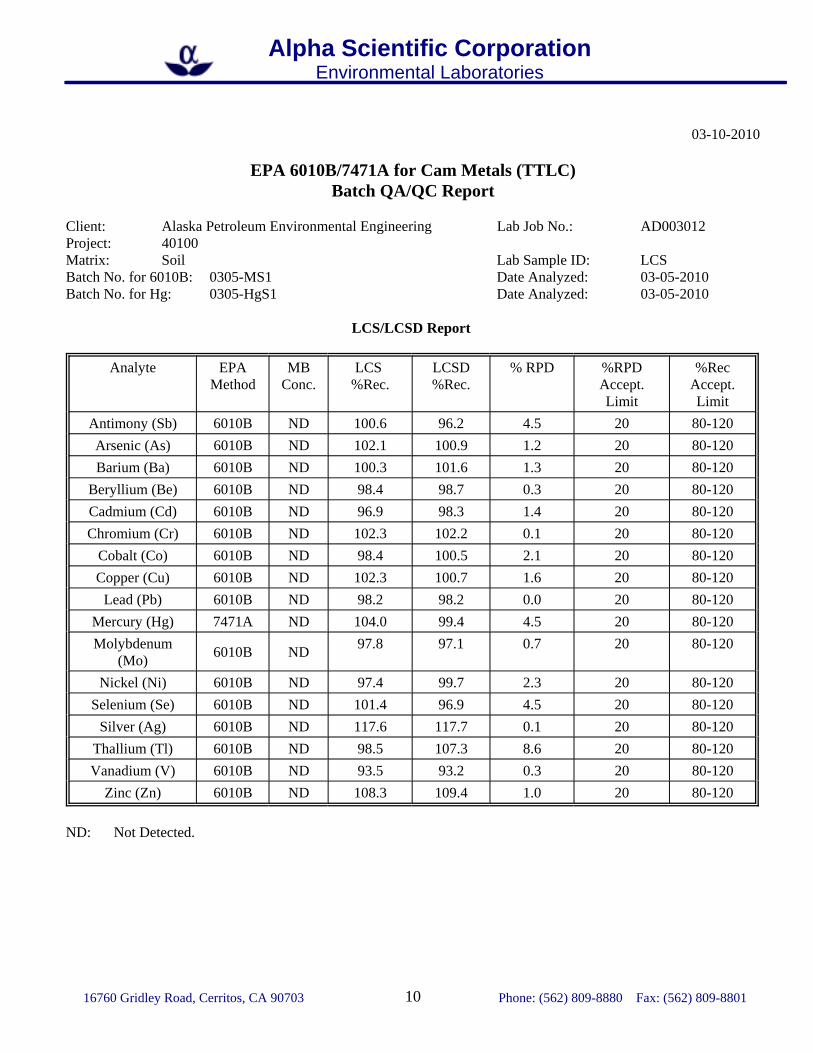
EPA 6010B/7471A for Cam Metals (TTLC)Batch QA/QC Report
Client: Alaska Petroleum Environmental Engineering Lab Job No.: AD003012Project: 40100Matrix: Soil Lab Sample ID: LCSBatch No. for 6010B: 0305-MS1 Date Analyzed: 03-05-2010Batch No. for Hg: 0305-HgS1 Date Analyzed: 03-05-2010
LCS/LCSD Report
Analyte EPAMethod
MBConc.
LCS %Rec.
LCSD%Rec.
% RPD %RPDAccept.Limit
%RecAccept.Limit
Antimony (Sb) 6010B ND 100.6 96.2 4.5 20 80-120Arsenic (As) 6010B ND 102.1 100.9 1.2 20 80-120Barium (Ba) 6010B ND 100.3 101.6 1.3 20 80-120
Beryllium (Be) 6010B ND 98.4 98.7 0.3 20 80-120Cadmium (Cd) 6010B ND 96.9 98.3 1.4 20 80-120Chromium (Cr) 6010B ND 102.3 102.2 0.1 20 80-120
Cobalt (Co) 6010B ND 98.4 100.5 2.1 20 80-120Copper (Cu) 6010B ND 102.3 100.7 1.6 20 80-120
Lead (Pb) 6010B ND 98.2 98.2 0.0 20 80-120Mercury (Hg) 7471A ND 104.0 99.4 4.5 20 80-120Molybdenum
(Mo) 6010B ND 97.8 97.1 0.7 20 80-120
Nickel (Ni) 6010B ND 97.4 99.7 2.3 20 80-120Selenium (Se) 6010B ND 101.4 96.9 4.5 20 80-120
Silver (Ag) 6010B ND 117.6 117.7 0.1 20 80-120Thallium (Tl) 6010B ND 98.5 107.3 8.6 20 80-120Vanadium (V) 6010B ND 93.5 93.2 0.3 20 80-120
Zinc (Zn) 6010B ND 108.3 109.4 1.0 20 80-120
ND: Not Detected.
Alpha Scientific CorporationEnvironmental Laboratories
16760 Gridley Road, Cerritos, CA 90703 Phone: (562) 809-8880 Fax: (562) 809-880111
03-10-2010
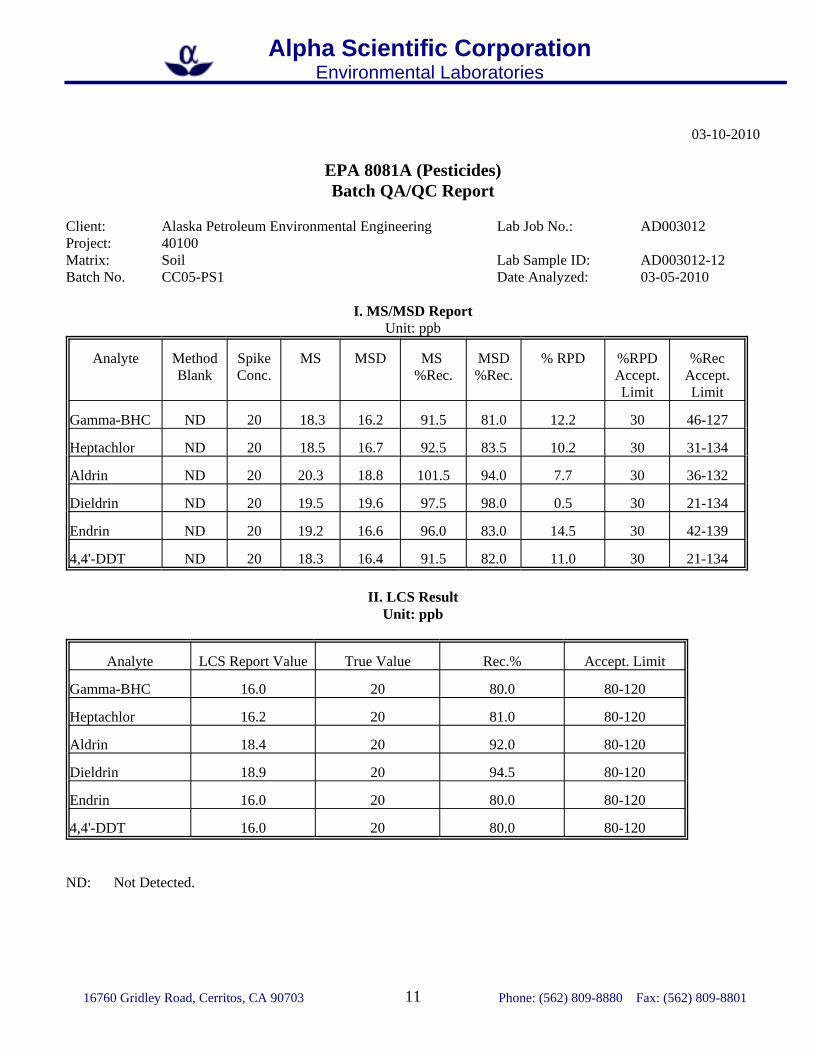
EPA 8081A (Pesticides)Batch QA/QC Report
Client: Alaska Petroleum Environmental Engineering Lab Job No.: AD003012Project: 40100Matrix: Soil Lab Sample ID: AD003012-12Batch No. CC05-PS1 Date Analyzed: 03-05-2010
I. MS/MSD ReportUnit: ppb
Analyte MethodBlank
SpikeConc.
MS MSD MS %Rec.
MSD%Rec.
% RPD %RPDAccept.Limit
%RecAccept.Limit
Gamma-BHC ND 20 18.3 16.2 91.5 81.0 12.2 30 46-127
Heptachlor ND 20 18.5 16.7 92.5 83.5 10.2 30 31-134
Aldrin ND 20 20.3 18.8 101.5 94.0 7.7 30 36-132
Dieldrin ND 20 19.5 19.6 97.5 98.0 0.5 30 21-134
Endrin ND 20 19.2 16.6 96.0 83.0 14.5 30 42-139
4,4'-DDT ND 20 18.3 16.4 91.5 82.0 11.0 30 21-134
II. LCS ResultUnit: ppb
Analyte LCS Report Value True Value Rec.% Accept. Limit
Gamma-BHC 16.0 20 80.0 80-120
Heptachlor 16.2 20 81.0 80-120
Aldrin 18.4 20 92.0 80-120
Dieldrin 18.9 20 94.5 80-120
Endrin 16.0 20 80.0 80-120
4,4'-DDT 16.0 20 80.0 80-120
ND: Not Detected.

Alpha Scientific CorporationEnvironmental Laboratories
16760 Gridley Road, Cerritos, CA 90703 Phone: (562) 809-8880 Fax: (562) 809-880112
03-10-2010
EPA 8082Batch QA/QC Report
Client: Alaska Petroleum Environmental Engineering Lab Job No.: AD003012Project: 40100Matrix: Soil Lab Sample ID: LCSBatch No. CC08-PS1 Date Analyzed: 03-08-2010
LCS/LCSD ReportUnit: ppb
Analyte MethodBlank
SpikeConc.
LCS LCSD LCS %Rec.
LCSD%Rec.
% RPD %RPDAccept.Limit
%RecAccept.Limit
1016 ND 500 483 513 96.6 102.6 6.0 30 46-127
1260 ND 500 467 495 93.4 99.0 5.8 30 31-134
ND: Not Detected (at the specified limit).

ASBESTOS SAMPLING RESULTS


HERBICIDES & PESTICIDES

ABC Environmental Laboratories
Dr. Wang 3/9/2010Alpha Scientific Corporation16760 Gridley RoadCerritos, CA 90703
Project: AD003012Project Site: Mojave Solar LLCSample Date: 3/1/2010Lab Job No.: AS10C010
Dear Dr. Wang:
Enclosed please find the analytical report for the samples received by ABC Environmental Laboratories on 3/6/2010 and analyzed by the following EPA method:
EPA 8151A (Chlorinated Herbicides)
All analyses have met the QA/QC criteria of this laboratory.
The sample(s) arrived in good conditions (i.e., chilled, intact) and with a chain of custody record attached.
ABC Environmental Laboratories is certified by the CA DHS (Certificate No.2584). Thank you for giving us the opportunity to serve you.
Please feel free to call me at (909) 923-8628 if our laboratory can be of further service toyou.
Respectfully,
ABC Environmental Laboratories, Inc.
Ken Zheng, M.S.Laboratory Director
Enclosures
This cover letter is an integral part of this analytical report.
1640 S. Grove Ave., Suite BOntario, CA 91761
Tel: (909)923-8628(562)413-8343
Fax: (909)923-8628

ABC Environmental Laboratories
Client: Alpha Scientific Corporation Lab Job No.: AS10C010Project: AD003012 Date Sampled: 3/1/2010Project Site: Mojave Solar LLC Date Received: 3/6/2010Matrix: Soil Date Extracted: 3/6/2010Batch No.: 0309-HES-S Date Analyzed: 3/9/2010
Date Reported 3/9/2010
EPA 8151A (Chlorinated Herbicides) Reporting Unit: μg/kg (PPB)
Lab Sample I.D. Method Blank AS10C010-1Client Sample I.D. AG-1
Compound RL
2,4-DB 10 ND ND2,4-D 5 ND NDDalapon 5 ND NDDicamba 5 ND NDDichloroprop 5 ND NDDinoseb 5 ND NDMCPA 200 ND NDMCPP 200 ND ND4-Nitrophenol 5 ND NDPentachlorophenol 5 ND NDSilvex 5 ND ND
ND: Not Detected (Below RL).RL: Reporting Limit.
1640 S. Grove Ave., Suite BOntario, CA 91761
Tel: (909)923-8628(562)413-8343
Fax: (909)923-8628

ABC Environmental Laboratories
EPA 8151A Batch QA/QC Report
Client: Alpha Scientific Corporation Lab Job No.: AS10C010
Project: AD003012 Lab Sample ID: AS10C010-1
Matrix: Soil Date Analyzed: 3/9/2010
Batch No.: 0309-HES-S Date Reported 3/9/2010
I. MS/MSD Report Unit: µg/kg
Compound Sample Spike MS MSD MS MSD %RPD %RPD %Rec.
Conc. Conc. %Rec. %Rec. Accept Accept
Limit Limit
Dicamba ND 50.0 43.1 42.5 86 85 1 ≤30 45-198
Silvex ND 50.0 40.3 39.5 81 79 2 ≤30 38-198
2,4,5-T ND 50.0 41.6 45.2 83 90 8 ≤30 62-176
II. LCS ReportUnit:µg/kg
Compound MB Report Value True Value Rec. % Accept Limit
Dicamba ND 47.6 50 95 50 -180
Silvex ND 43.5 50 87 42 -180
2,4,5-T ND 45.1 50 90 68 -160
ND: Not Detected (Below Reporting Limit).
MB : Method Blank.
1640 S. Grove Ave., Suite BOntario, CA 91761
Tel: (909)923-8628(562)413-8343
Fax: (909)923-8628

CHAIN OF CUSTODY

{
diaa\
ooF(nDUfJ.iozFf{
U
<I I l-e6-u/u009 "y!-ld, solsaqsv
vt9t8 / v1808 sepptqreH/septc|lsed
IVIO] S-tVl_3y\J ucc
0 Lzg t9z9 sc I NVcuo 3-l8VlCVUIX3
Or; ) o: l? c \
3.\i J8 \tr
fl0928 t VZg SCt NV9UO 3'] u-Vton
r.'8rr cH yIn3"toul_3d
lNrvHc Nosuvq | =M - 9 t08 -l3nj
s s/s svu E/sc u. sv] d/s s\r'l o
o)-osG
(!
co-c3a=
J
oui O
F XA $2: jY $
& $- ) l
t r c a
E.
F
t
J
F
azoF(Jft-azJ
IJJ
a
+
=
, ' l( o
s'i
X rrl.rlg s t Hx *? *; E ; :; { { t rv t ' | - J xo - < V
U J E3 : < , ^ 3 9
i sEg IaO z Y o o r
:$sxsl
d < . ̂i L v
o z . *fv,fr) E
E=E#5=< 2 . *Fl Lrl
-lJ
I44
2 - '? . O

AN
d$
?\)Aq
aoF(npUfr.iozFF
U
@v..N
\T
vt9lg / vl .80g sepptqJeH/sepprsad
0 Lzg t9z9 sc I Nveuo 3l8vlcvurxl
1V10J_ S1V13y{ U3C
sao9z8 tvzg scr Nveuo 3-l tr\no^
r'8tr cH y!n310ur.3d
lNvHc Noswd taM- grog'r inl
q)-osG
(!
c0)
-c3o=foot-
Xoj$'o
$I
(f)
t
F
E
oIoFU)zotr:)vFqzJ
t!
a
i^\)
BG'q.
Y-1'ix$s
H E ; 1; ( { \L , T L J X
o- <Y '
rrr 53 : < , ^ 3 99gEETu3u=x3ia $ " 5 I
i i { . -i F - r v
6 > =c'tr&).+,F= = !--!c-a^z
a s a< , 2 -FJ f- ]
.)
Jc4
r)

SUBCONTRACTOR CHAIN OF CUSTODY


PESTICIDE & HERBICIDE
SAMPLING EVALUATION

Pesticide Use Evaluation Hinkley, CA March 2010
Table of Contents Section Page
Alaska Petroleum Environmental Engineering, Inc. Page i
1.0 Introduction 1 1.1 Hypothetical Basis for Evaluation ...........................................................................1 1.2 Worst Case Scenario ................................................................................................1 1.3 Subject Property and Potential Pesticide Use .........................................................2 1.4 Purpose and Objectives............................................................................................2
2.0 Nature of Pesticides 2
3.0 Historical Use of Pesticides in Orchards 3
4.0 Regulatory Basis for Sampling Agricultural Use Properties 4 4.1 Sampling Protocols in Agricultural Fields for School Sites....................................5 4.2 Sampling Protocols for Soil Import to “Sensitive” Sites.........................................5
5.0 Technical Evaluation 5
6.0 Conclusion 8 Attachments
Attachment 1 “Interim Guidance for Sampling Agricultural Soils”, California Environmental Protection Agency - Department of Toxic Substances Control (“DTSC”), June 28, 2000
Attachment 2 Interim Guidance for Sampling Agricultural Properties (Third
Revision), DTSC, April 30, 2008.
Attachment 3 Information Advisory: Clean Imported Fill Material, DTSC, October 2001

Pesticide Use Evaluation Hinkley, CA March 2010
Table of Contents Section Page
Alaska Petroleum Environmental Engineering, Inc. Page ii
Attachment 4 California Code of Regulations – Title 22, Metals Regulatory Action Limits, and United States Environmental Protection Agency - Region IX (“USEPA”) Regional Screening Levels (“RSLs”), April 2004

Pesticide Use Evaluation Hinkley, CA March 2010
Alaska Petroleum Environmental Engineering, Inc. Page 1
1.0 Introduction
1.1 Hypothetical Basis for Evaluation
The following evaluation is based on a hypothetical analysis of pesticide use on an agricultural use property. As part of this analysis, the proposed Mojave Solar LLC project (hereafter referred to as the “Site”) is considered as being historically used for an orchard (rationale of this designation further explained below). From scores of site characterizations that Alaska Petroleum Environmental Engineering, Inc. has conducted in southern California in Kern, Los Angeles, Orange, Riverside, Ventura, and San Bernardino counties, organochlorine pesticides (OCPs”) have only been detected above residential regulatory action limits in:
• Orchards and former orchards, and
• Storage areas and related spills (i.e., one residential site where commercial flower farming was conducted and pesticides were mixed, stored and over applied; and the Los Angeles County Agricultural Commissions field office where pesticides and herbicides for the entire county were stored and mixed (i.e., spills).
Thousands of acres have been investigated upon which grains, vegetables/fruits (e.g., strawberries, etc.), and animal feedstock has been grown. Pesticides/herbicides have not been detected above regulatory action limits.
1.2 Worst Case Scenario
OCPs were first introduced into California agriculture in 1944 and reached their peak usage in the 1960s. In 1974, the use of DDT, an (OCP), was banned in California for agricultural purposes, and the elimination of remaining OCPs quickly followed.
For this evaluation, DDT is being considered as it was primarily used in fruit orchards [information obtained from the Los Angeles County Agricultural Commission, Department of Pesticides]. DDT has one of the longest pesticide/ herbicide “half-lives” (“half-life” is defined in Section 2.0). Therefore, in this worst case scenario analysis, the following assumptions were used:
• DDT was used following the manufacturer’s application rates, and
• it is calculated that the residual DDT concentration would be currently below all regulatory action limits or human health based risk goals,
Pesticide Use Evaluation Hinkley, CA March 2010
Alaska Petroleum Environmental Engineering, Inc. Page 2
then any other pesticide/herbicide that may have been applied, which are all known to have shorter “half-lives”, would also pose no environmental or health effects as the residual concentration(s) would be even less than DDT.
1.3 Subject Property and Potential Pesticide Use
The Site is approximately 1,800 acres in size. It had been used for agricultural purposes (i.e., grains, alfalfa, etc.) and it is known that pesticide(s) were used in the agricultural operations.
1.4 Purpose and Objectives
The intent of this review is to determine if sampling for pesticides was warranted. Fruit orchards are being used in this analysis as they typically had the highest pesticide application rates.
2.0 Nature of Pesticides
“Half-life” is a measure of the persistence of a pesticide in soil; it is the amount of time required for one-half of the material to degrade. Based upon degradation rates, pesticides can be categorized as:
non-persistent: “half-life” less than 30 days,
moderately persistent: “half-life” 30 to 100 days, or
persistent: “half-life” greater than 100 days.
A "typical” soil “half-life" value is an approximation and may vary greatly because persistence is sensitive to variations in a site’s soil, climate, etc. The sorption coefficient (“Koc”) describes the tendency of a pesticide to bind to soil particles and is derived from laboratory data. Sorption retards movement, and may also increase persistence because the pesticide is protected from degradation. The higher the Koc, the greater the sorption potential. Many soil and pesticide factors may influence the actual sorption of a pesticide to soil.
The Groundwater Ubiquity Score (“GUS”) is an empirically derived value that relates pesticide persistence (half-life) and sorption in soil (Koc). The GUS may be used to rank pesticides for their potential to vertically migrate to groundwater:
GUS = log10 (“half-life”) x [4 - log10 (Koc)]
Pesticide Use Evaluation Hinkley, CA March 2010
Alaska Petroleum Environmental Engineering, Inc. Page 3
The pesticide movement rating is derived from the GUS. Movement ratings range from “extremely low” to “very high”. Pesticides with a GUS less than 0.1 are considered to have an extremely low potential to migrate towards groundwater. Values of:
• 1.0 - 2.0 are “low”
• 2.0 - 3.0 are “moderate”,
• 3.0 - 4.0 are “high”, and
• values greater than 4.0 have a “very high” potential to migrate towards groundwater.
Solubility describes the amount of pesticide that will dissolve in a known volume of water. The higher the solubility, the more soluble the pesticide. Highly soluble pesticides are more likely to be removed from the soil by runoff (e.g., from stormwater, excessive irrigation, etc.) or by moving below the plant’s root zone with excess water.
3.0 Historical Use of Pesticides in Orchards
For this discussion, chemical compounds included under the general classification of “pesticides” are herbicides, insecticides, rodenticides, fungicides, and “others”. The likelihood of finding elevated concentrations of pesticides would be greater on properties where the chemical usage was higher due to the type of crops that were planted such as fruit orchards as compared to grains (e.g., alfalfa, etc.). A copy of that portion of the “Interim Guidance for Sampling Agricultural Soils”, California Environmental Protection Agency - Department of Toxic Substances Control (“DTSC”), June 28, 2000 pertaining to the analyses and “half-life” of commonly used pesticides/herbicides (i.e., degradation rates) is included as Attachment 1. According to the Los Angeles Agricultural Commission, Department of Pesticides (Mr. Jahan Motakef), the most commonly used pesticides in fruit orchards before the 1970s were DDT and Carbaryl (trade name of “Sevin”). With respect to the aforementioned criterion pertaining to the nature of pesticides, the following applies to these chemicals [Pesticide Properties Database, Kerle & Jenkins, 07/24/94].

Pesticide Use Evaluation Hinkley, CA March 2010
Alaska Petroleum Environmental Engineering, Inc. Page 4
Pesticide Movement Rating
Soil Half-Life (days)
Water Solubility
(mg/l)
Sorption Coefficient (soil Koc)
DDT Extremely Low 2,000 0.0055 2,000,000 Carbaryl (“Sevin”)
Low 10 120 300
DDT is commonly used as a benchmark in determining if residual pesticides may be a concern on a property because it has one of the longest “half-lifes”. Therefore, if the concentration of DDT were low all other pesticides would have degraded earlier since they have a shorter half-life.
4.0 Regulatory Basis for Sampling Agricultural Use Properties
Pesticide sampling strategies utilized in California are conservative since they were developed for new or expansion of existing, school sites. These strategies were expanded to ensure that inappropriate fill material was not imported onto other “sensitive” land use properties such as day care centers, homes, hospitals, etc. Included in the pesticide guidelines are sampling strategies pertaining to the presence of regulated “heavy” metals which were used in both pesticides and fertilizers formulations. In addition to pesticides/herbicides and regulated “heavy” metals, other constituents of concern (“COC”) are addressed in these guidelines which may be present at concentrations above regulatory action levels or applicable health-based risk goals in imported soils. COCs also typically include asbestos and hydrocarbons. Specifically for agricultural use properties the DTSC guidance document, (1) “does not apply to disturbed land, such as, land that has been graded in
preparation for construction, areas where imported soil has been brought in, or any other activity that would redistribute the soil, other than normal disking and plowing”;
(2) “is not applicable to areas where pesticides were mixed, stored, disposed, or
areas where pesticides may have accumulated, such as ponds and drainage ditches”;

Pesticide Use Evaluation Hinkley, CA March 2010
Alaska Petroleum Environmental Engineering, Inc. Page 5
(3) states that “animal facilities such as cattle and poultry barns, settling ponds, and manure piles” are excluded; and
(4) indicates that agricultural usage on properties “ending prior to 1950” do not
need to be evaluated for pesticides; however, “arsenical pesticides and herbicides predates 1950” and should be evaluated.
The USEPA RSLs have been established for various chemical and inorganic compounds (e.g., regulated “heavy” metals), which pertain to residential and industrial properties. A RSL is defined as that constituent concentration that is acceptable to remain in-place. 4.1 Sampling Protocols in Agricultural Fields for School Sites
Please note that this sampling strategy presents a “worse-case” scenario, as it pertains to school sites; the Site will be a concentrating solar plant (electrical generation). Therefore, the human exposure pathways (e.g., ingestion, inhalation and dermal contact) are short-term and are only applicable for an on-Site construction worker.Samples should be collected at each location at the surface (zero to six inches) and from two to three feet below ground surface and analyzed for pesticides. For a property over 50 acres in size, the DTSC should be contacted in order to determine the suggested minimum number of sample locations.
In addition, a minimum of four on-Site “background” soil samples should be collected for regulated “heavy” metal analysis. DTSC limited the regulated “heavy” metal analysis to the 17 California Assessment Manual (“CAM”) metals. A list of the 17 CAM metals and the applicable USEPA RSLs for residential use properties is presented in Attachment 4. Included in this attachment is also the RSL for DDT.
4.2 Sampling Protocols for Soil Import to “Sensitive” Sites
No information was made available if any soil will be imported to the Site. If this may happen, there are regulatory guidelines for soil sampling to ensure that the import source is “clean”. The DTSC developed the following sampling strategies.
Recommended Fill Material Sampling Schedule
Sample Frequency Area of Individual Borrow Area (acres) Samples Requirements 2 or less Minimum of 4 samples 2 to 4 Minimum of 1 sample every ½ acre 4 to 10 Minimum of 8 samples Greater than 10 Minimum of 8 locations with 4 sub-samples per

Pesticide Use Evaluation Hinkley, CA March 2010
Alaska Petroleum Environmental Engineering, Inc. Page 6
location Sample Frequency (cubic yards [“cy”]) Volume of Borrow Area Stockpile (cy) Samples per Volume Less than 1,000 1 sample per 250 cy 1,001 to 5,000 4 samples for first 1,000 cy, plus 1 sample for each
additional 500 cy 5,000+ 12 samples for the first 5,000 cy, plus 1 sample per
each additional 1,000 cy
5.0 Technical Evaluation
• The DTSC sampling guidelines pertaining to agricultural properties (i.e., for pesticides and regulated “heavy” metals) do not apply because the Site will:
(1) not be developed into a school facility, and
(2) will be graded for construction purposes.
• The DTSC sampling guidelines pertaining to soil imported to “sensitive” sites does apply, only if the grading plans call:
(1) for import, and the import comes from an past or present agricultural use property, or potentially if,
(2) there is export of the Site soil to another “sensitive” use site.
• If DDT and/or Carbayl (“Sevin”) were used at the Site, DDT would be the predominant COC. DDT has a high sorption coefficient, which retards movement within the soil matrix, thereby making it more persistent in nature, and its half-life is approximately 5.5 years (2,000 days). Therefore, given the following Site information regarding DDT use:
in the interim time period from 1974 (when DDT was banned for use on
agricultural properties) and 2010, DDT would have degraded by 6.6 half-lives;
the USEPA residential RSL for DDT is 1.7 parts per million (“ppm”);
the typical application rate for DDT over two treated acres of fruit
groves would be anywhere between a few ounces to a few pounds; without knowing the application rates and duration of treatment the potential residual amount of DDT in the soil cannot be determined.
Pesticide Use Evaluation Hinkley, CA March 2010
Alaska Petroleum Environmental Engineering, Inc. Page 7
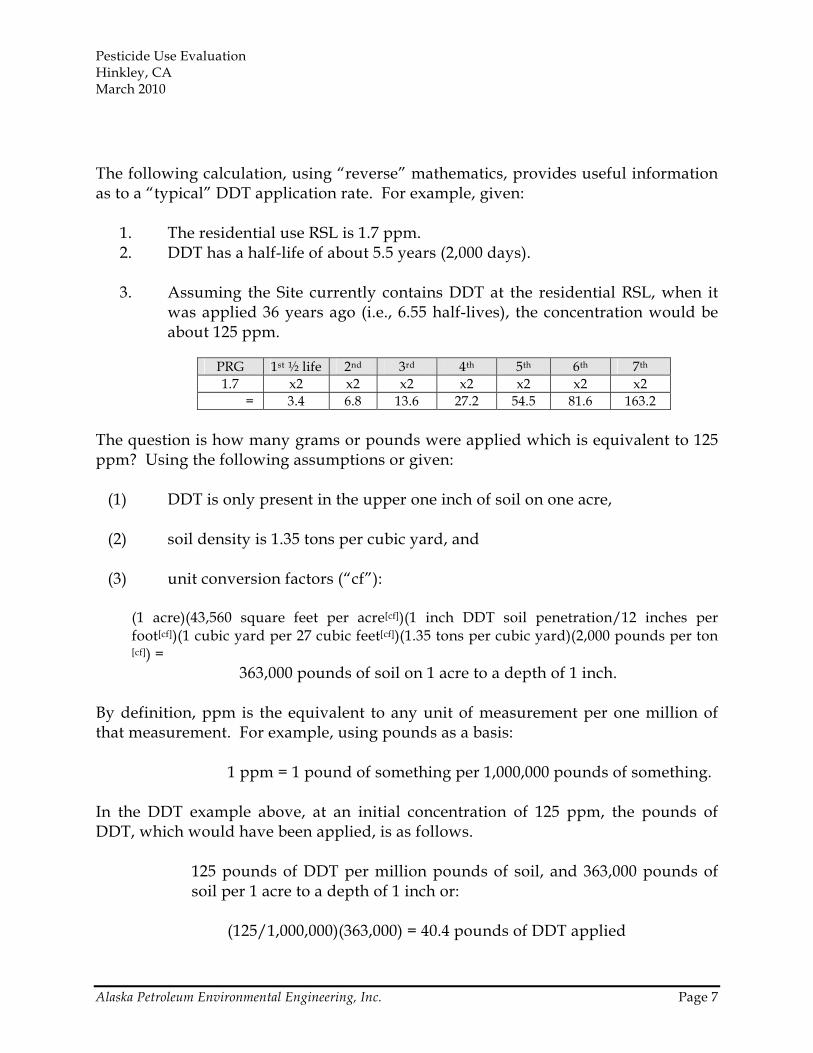
The following calculation, using “reverse” mathematics, provides useful information as to a “typical” DDT application rate. For example, given:
1. The residential use RSL is 1.7 ppm. 2. DDT has a half-life of about 5.5 years (2,000 days). 3. Assuming the Site currently contains DDT at the residential RSL, when it
was applied 36 years ago (i.e., 6.55 half-lives), the concentration would be about 125 ppm.
PRG 1st ½ life 2nd 3rd 4th 5th 6th 7th 1.7 x2 x2 x2 x2 x2 x2 x2
= 3.4 6.8 13.6 27.2 54.5 81.6 163.2 The question is how many grams or pounds were applied which is equivalent to 125 ppm? Using the following assumptions or given:
(1) DDT is only present in the upper one inch of soil on one acre,
(2) soil density is 1.35 tons per cubic yard, and
(3) unit conversion factors (“cf”):
(1 acre)(43,560 square feet per acre[cf])(1 inch DDT soil penetration/12 inches per foot[cf])(1 cubic yard per 27 cubic feet[cf])(1.35 tons per cubic yard)(2,000 pounds per ton [cf]) = 363,000 pounds of soil on 1 acre to a depth of 1 inch.
By definition, ppm is the equivalent to any unit of measurement per one million of that measurement. For example, using pounds as a basis:
1 ppm = 1 pound of something per 1,000,000 pounds of something.
In the DDT example above, at an initial concentration of 125 ppm, the pounds of DDT, which would have been applied, is as follows.
125 pounds of DDT per million pounds of soil, and 363,000 pounds of soil per 1 acre to a depth of 1 inch or:
(125/1,000,000)(363,000) = 40.4 pounds of DDT applied

Pesticide Use Evaluation Hinkley, CA March 2010
Alaska Petroleum Environmental Engineering, Inc. Page 8
This is about 40 times higher than what is considered the maximum DDT application rate (i.e., a few pounds per two acres). Therefore, the likelihood of finding DDT above the residential RSL is very low after 6.5 half-lives. NOTE: the commercial property use (i.e., the Site) RSL is 7.0 ppm. Therefore, higher concentrations of OCPs would be “acceptable”.
6.0 Conclusion
No other pertinent data can be determined due to the datagaps cited above; specifically, regarding: • types of pesticides potentially used, • pesticide application rates, and • the duration of the treatment (i.e., how many years). In general, the aforementioned data should clarify the possibility of soil toxicity based upon the Site’s historical agricultural usage. Based upon the aforementioned pesticide analysis and State guidelines, it appears that the use of pesticides should not be an issue with respect to any proposed development.


