40
Schrödinger Press SiteMap User Manual SiteMap 2.3 User Manual

SiteMap User Manual
SiteMap 2.3
User Manual
Schrödinger Press

SiteMap User Manual Copyright © 2009 Schrödinger, LLC. All rights reserved.
While care has been taken in the preparation of this publication, Schrödinger
assumes no responsibility for errors or omissions, or for damages resulting from
the use of the information contained herein.
Canvas, CombiGlide, ConfGen, Epik, Glide, Impact, Jaguar, Liaison, LigPrep,
Maestro, Phase, Prime, PrimeX, QikProp, QikFit, QikSim, QSite, SiteMap, Strike, and
WaterMap are trademarks of Schrödinger, LLC. Schrödinger and MacroModel are
registered trademarks of Schrödinger, LLC. MCPRO is a trademark of William L.
Jorgensen. Desmond is a trademark of D. E. Shaw Research. Desmond is used with
the permission of D. E. Shaw Research. All rights reserved. This publication may
contain the trademarks of other companies.
Schrödinger software includes software and libraries provided by third parties. For
details of the copyrights, and terms and conditions associated with such included
third party software, see the Legal Notices for Third-Party Software in your product
installation at $SCHRODINGER/docs/html/third_party_legal.html (Linux OS) or
%SCHRODINGER%\docs\html\third_party_legal.html (Windows OS).
This publication may refer to other third party software not included in or with
Schrödinger software ("such other third party software"), and provide links to third
party Web sites ("linked sites"). References to such other third party software or
linked sites do not constitute an endorsement by Schrödinger, LLC. Use of such
other third party software and linked sites may be subject to third party license
agreements and fees. Schrödinger, LLC and its affiliates have no responsibility or
liability, directly or indirectly, for such other third party software and linked sites,
or for damage resulting from the use thereof. Any warranties that we make
regarding Schrödinger products and services do not apply to such other third party
software or linked sites, or to the interaction between, or interoperability of,
Schrödinger products and services and such other third party software.
June 2009

Contents
Document Conventions ...................................................................................................... v
Chapter 1: Introduction to SiteMap ............................................................................ 1
1.1 SiteMap Overview...................................................................................................... 1
1.2 Running Schrödinger Software .............................................................................. 2
1.3 Citing SiteMap in Publications................................................................................ 2
Chapter 2: How SiteMap Works ................................................................................... 3
2.1 Finding Sites .............................................................................................................. 3
2.2 Mapping the Sites...................................................................................................... 4
2.2.1 Hydrophilic Map .................................................................................................. 5
2.2.2 Hydrophobic Map................................................................................................ 5
2.2.3 Donor, Acceptor, and Metal-Binding Regions ..................................................... 6
2.2.4 Surface Map........................................................................................................ 6
2.3 Evaluating the Sites .................................................................................................. 6
Chapter 3: Running SiteMap ........................................................................................ 11
3.1 Running SiteMap from Maestro ............................................................................ 11
3.1.1 Specifying the Task ........................................................................................... 12
3.1.2 Setting Other Options ....................................................................................... 13
3.1.3 Running the Job................................................................................................ 14
3.1.4 Viewing the Results .......................................................................................... 15
3.2 Sample Site Maps .................................................................................................... 16
3.3 Running SiteMap from the Command Line ........................................................ 16
3.3.1 Command Options ............................................................................................ 16
3.3.2 SiteMap Output ................................................................................................. 22
3.4 Adapting SiteMap .................................................................................................... 22
3.4.1 Adjusting the Closeness of the Map to the Protein ........................................... 22
3.4.2 Tailoring the Definition of Hydrophobicity.......................................................... 22
3.4.3 Finding Shallow Sites........................................................................................ 23
3.4.4 Obtaining Only the SiteMap Properties ............................................................ 23
SiteMap 2.3 User Manual iii

Contents
iv
3.4.5 Specifying a Reference Ligand Without Restricting the Mapping Region......... 23
3.4.6 Controlling the Merging of Sites........................................................................ 23
Chapter 4: SiteMap Results .......................................................................................... 25
Getting Help ............................................................................................................................. 27
References ................................................................................................................................ 31
SiteMap 2.3 User Manual

Document Conventions
In addition to the use of italics for names of documents, the font conventions that are used inthis document are summarized in the table below.
Links to other locations in the current document or to other PDF documents are colored likethis: Document Conventions.
In descriptions of command syntax, the following UNIX conventions are used: braces { }
enclose a choice of required items, square brackets [ ] enclose optional items, and the barsymbol | separates items in a list from which one item must be chosen. Lines of commandsyntax that wrap should be interpreted as a single command.
File name, path, and environment variable syntax is generally given with the UNIX conven-tions. To obtain the Windows conventions, replace the forward slash / with the backslash \ inpath or directory names, and replace the $ at the beginning of an environment variable with a% at each end. For example, $SCHRODINGER/maestro becomes %SCHRODINGER%\maestro.
In this document, to type text means to type the required text in the specified location, and toenter text means to type the required text, then press the ENTER key.
References to literature sources are given in square brackets, like this: [10].
Font Example Use
Sans serif Project Table Names of GUI features, such as panels, menus,menu items, buttons, and labels
Monospace $SCHRODINGER/maestro File names, directory names, commands, envi-ronment variables, and screen output
Italic filename Text that the user must replace with a value
Sans serifuppercase
CTRL+H Keyboard keys
SiteMap 2.3 User Manual v

vi
SiteMap 2.3 User Manual
SiteMap User Manual
Chapter 1
Chapter 1: Introduction to SiteMap
1.1 SiteMap Overview
The location of the primary binding site on a receptor such as a protein is often known from thestructure of a co-crystallized complex. Efforts to design better ligands for these receptors canprofit from an understanding of how well the known ligands complement the receptor, and howextension of the ligands into adjacent regions could promote binding. Determining whetherthere are nearby sites that might be useful for allosteric binding can also be important.
In some cases, however, the location of a binding site for protein-ligand or protein-proteininteractions is not known in advance, even though the protein structures are available. Here,computational studies can help to suggest likely binding sites, and even to predict whether agiven protein is likely to bind ligands tightly. Many such approaches have been explored; forreferences, see the recent paper by Nayal and Honig [1].
SiteMap generates information on the character of binding sites using novel search and anal-ysis facilities, and provides information to Maestro for visualization of the sites. A SiteMapcalculation begins with an initial search stage that determines one or more regions on or nearthe protein surface, called sites, that may be suitable for binding of a ligand to the receptor. Thesearch uses a grid of points, called site points, to locate the sites. In the second stage, contourmaps (site maps) are generated, producing hydrophobic and hydrophilic maps. The hydrophilicmaps are further divided into donor, acceptor, and metal-binding regions. The evaluation stage,which concludes the calculation, assesses each site by calculating various properties, which areadded to the Maestro project.
Site maps can aid in the design of better ligands, by revealing “targets of opportunity”—forexample, hydrophobic regions that have room to accommodate a larger hydrophobic group.Site maps can also be used to select the target for ligand docking with Glide and to evaluatedocking hits, by showing the how well the poses display proper complementarity to thereceptor. The regions that are neither hydrophobic nor hydrophilic are important because theyshow places in which it may be possible to improve the physical properties of the ligand—forexample, by changing the solubility—with minimal effect on the binding affinity.
In contrast to techniques that color-code the receptor surface to represent hydrophilicity orhydrophobicity, site maps depend on the site as a whole, not just the character of the nearestreceptor atom. Moreover, site maps explicitly show the shape and extent of philic and phobicregions, something a surface-based display cannot do.
SiteMap 2.3 User Manual 1

Chapter 1: Introduction to SiteMap
2
The most important property generated by SiteMap is an overall SiteScore, which has provento be effective at identifying known binding sites in co-crystallized complexes. Other proper-ties characterize the binding site in terms of:
• the size of the site,• the degrees of enclosure by the protein and exposure to solvent,• the tightness with which the site points interact with the receptor,• the hydrophobic and hydrophilic character of the site and the balance between them,• the degree to which a ligand might donate or accept hydrogen bonds.
SiteMap can be run either from Maestro or from the command line. A SiteMap calculationtypically takes a few minutes for proteins having up to 5000 atoms. Version 2.3 of SiteMapcontains many improvements over the original SiteMap, which is still available from theSurfaces submenu of the Display menu in Maestro, as Hydrophobic/philic.
1.2 Running Schrödinger Software
To run any Schrödinger program on a UNIX platform, or start a Schrödinger job on a remotehost from a UNIX platform, you must first set the SCHRODINGER environment variable to theinstallation directory for your Schrödinger software. To set this variable, enter the followingcommand at a shell prompt:
Once you have set the SCHRODINGER environment variable, you can start Maestro with thefollowing command:
$SCHRODINGER/maestro &
It is usually a good idea to change to the desired working directory before starting Maestro.This directory then becomes Maestro’s working directory. For more information on startingMaestro, including starting Maestro on a Windows platform, see Section 2.1 of the MaestroUser Manual.
1.3 Citing SiteMap in Publications
The use of this product should be acknowledged in publications as:
SiteMap, version 2.3, Schrödinger, LLC, New York, NY, 2009.
csh/tcsh: setenv SCHRODINGER installation-directory
bash/ksh: export SCHRODINGER=installation-directory
SiteMap 2.3 User Manual

SiteMap User Manual
Chapter 2
Chapter 2: How SiteMap Works
SiteMap 2.3 represents an expansion of the original SiteMap facility in Maestro. As in the orig-inal procedure [3], site mapping operates in a manner analogous to Goodford’s GRID algo-rithm [4]. A SiteMap calculation has three stages. First, a grid is set up, and the points aregrouped into sets according to various criteria to define the sites. Second, the sites are mappedon another grid to produce files for visualization of the maps. Finally, properties are evaluatedand sites are written in a Maestro-readable form. Each stage is accomplished by running anImpact job. The three stages are described in the sections below.
2.1 Finding Sites
The first stage of a SiteMap calculation is to locate the sites. A site is defined by a set of sitepoints on a grid that are either contiguous or bridged by short gaps in solvent-exposed regions.The site-finding algorithm begins by placing a 1-Å grid of possible site points around the entireprotein or around a placeholder species, such as a ligand. Identifying the sites involves severalsteps.
The first step is to classify the grid points as being either “inside” or “outside” the protein. Thedistance from each grid point to nearby protein atoms is compared to the van der Waals radiusof each protein atom. If the ratio of the squares of these distances is larger than a giventhreshold, the point is considered to be outside the protein.
In the next step, the “outside” points are examined to determine which ones are in sufficientlygood van der Waals contact with the receptor and sufficiently enclosed by the receptor to serveas site points. Enclosure is defined by sampling all possible directions from the grid point anddetermining the fraction of these directions (“rays”) that strike the surface within a givendistance. If the fraction is larger than a given threshold, the point is sufficiently enclosed and istherefore a candidate site point. The contact with the receptor is determined by a cutoff on thevan der Waals interaction energy at the site point: if the interaction energy is too small inmagnitude, the point is rejected. Points that meet all criteria are added to the list of site points.
The third step combines site points into distinct site-point groups. For a site point to be consid-ered for membership in a group, it must have a minimum number of candidate site pointswithin a given distance. Site points that do not have this minimum number are discarded. Theprocess starts by assigning a site point to a group, then adding all candidate site points within aprescribed minimum distance. The addition process is repeated for each new site point. When
SiteMap 2.3 User Manual 3

Chapter 2: How SiteMap Works
4
no further site points can be added, the group is considered complete and another site-pointgroup is initiated. The process continues until all site points have been examined.
The final step merges site-point groups when the gap between them is relatively small andoccurs in a solvent-exposed region. The merge is controlled by user-adjustable thresholds thatdetermine how close two site-point groups must be for them to be considered for merging andwhether the gap between them could plausibly be bridged by ligand atoms. The final groupsconstitute the sites.
The sites are written in order of the number of site points they contain to a Maestro file. Eachsite point is represented by a dummy atom, and zero-order bonds are used to join the site pointsfor each site into a “structure” that Maestro recognizes as a single molecule.
2.2 Mapping the Sites
The second stage of a SiteMap calculation generates the various “maps” that define the sites. Amap is defined by a set of values of a property on a given 3D grid. First, SiteMap uses the sitepoints from the preceding stage to position a mapping box for each site. This box defines a gridwith a given spacing, and extends beyond the site by a given amount.
Van der Waals and distance-dependent electrostatic-interactions of a probe placed at each ofthe grid points are then used to generate van der Waals and electric-field grids. The probe simu-lates a water molecule, and is represented by a van der Waals sphere of radius 1.6 Å, a welldepth of 0.13 kcal/mol, and a point dipole moment of 2.4 Debye. To form the electrostatic-fieldgrid, the probe’s point dipole is oriented along the electric field and is offset by 0.15 Å from thevan der Waals sphere toward the center of an optimally oriented O–H bond.
To more accurately represent the expected contact positions and interaction energies of donorand acceptor atoms, the force field is first modified by adjusting van der Waals radii and byreducing formal-charge contributions to the partial atomic charges by 50%. The reduction informal charges, like the one employed in Glide [6], is used to keep regions around formallycharged groups from inappropriately dominating the maps, which are meant to reflect interac-tions in solvent, not in the gas phase.
The resultant van der Waals and electric-field grids are then used to generate the phobic andphilic potentials. Using these potentials, SiteMap partitions the accessible space in each siteinto the following three basic types of regions:
• Hydrophobic—regions that are favorable for occupancy by hydrophobic ligand groups
• Hydrophilic—regions that are favorable for occupancy by hydrophilic ligand groups
• Neither hydrophobic nor hydrophilic—regions that are of mixed character or are farenough from the receptor surface to be similar to bulk water
SiteMap 2.3 User Manual

Chapter 2: How SiteMap Works
The hydrophilic regions are further subdivided into hydrogen-bond donor, hydrogen-bondacceptor, and metal-binding regions. The hydrophobic and hydrophilic regions (or maps) areobtained by contouring the computed phobic and philic potentials at specified threshold values.The “neither” regions are implicit: these are regions that lie outside the protein but are notmarked as being either hydrophobic or hydrophilic. The methods for obtaining the maps aredescribed in more detail in the sections below.
For each site, the five maps—hydrophilic, hydrophobic, donor, acceptor, and surface—arewritten to files (.grd files and .vis files) that can be used by Maestro to display the surfaces.If there is a metal, the metal-binding map is also written out.
2.2.1 Hydrophilic Map
SiteMap constructs a measure of hydrophilicity by adding an “electric-field reward” term tothe van der Waals energy:
Grid_philic = vdW_energy + oriented-dipole_energy
where the oriented-dipole energy is necessarily negative. Hydrophilic regions are those withinwhich the sum of the two terms is more negative than a given threshold, which by default is–8 kcal/mol.
2.2.2 Hydrophobic Map
The quantity representing hydrophobicity is constructed by adding an “electric-field penalty”(positive) term to the van der Waals term:
Grid_phobic = vdW_energy – 0.30 * oriented-dipole_energy
Hydrophobic regions thus are regions where something would like to be, but water would not.The starting point for defining the hydrophobic regions is to consider the regions within whichthe sum of the two terms is more negative than a given threshold.
SiteMap offers several alternatives for the definition of hydrophobic regions. The least restric-tive definition uses a threshold of –0.75 kcal/mol, and includes all site points that lie within thisregion. This is not the default behavior, but represents the original SiteMap definition. Themore restrictive definitions involve two possible modifications to the hydrophobic region.
In the first, grid points that border on too many assigned philic points, that have too fewphobic-point or “inside-protein” neighbors, or that border on too many free-space “outside”points are reclassified as non-phobic.
In the second, for each phobic grid point the fraction of radial rays that intersect the proteinsurface within a given distance (default 6 Å) is calculated, and the phobic potential is then
SiteMap 2.3 User Manual 5

Chapter 2: How SiteMap Works
6
multiplied by this fraction. By scaling down the phobic potential, exposed regions are lessfavored than regions that are sheltered from the solvent, like the Glide XP detection of “phobicenclosure” [6]. The threshold for defining the phobic region is also reduced, to –0.50 kcal/mol.This modification considers the nature of the site beyond the immediate vicinity of the gridpoint, in a way that the first modification cannot.
The default behavior is to include both of these modifications.
2.2.3 Donor, Acceptor, and Metal-Binding Regions
The hydrophilic map is further partitioned into separate hydrogen-bond donor and acceptormaps. When there is interaction with a metal center other than Ca2+, which (as in Glide XP) isnot considered to be a metal-binding center, a separate metal-binding map is also formed.Metal-binding grid points are philic grid points that lie within 3 Å of a qualifying metal center.Classification of the remaining philic points as donor or acceptor points is made by displacingthem in the direction of the local electrostatic field and recomputing the value of the field.Donor and acceptor points are assigned depending on whether this displacement increases ordecreases the magnitude of the field.
2.2.4 Surface Map
The surface map is obtained by removing attractive regions of the van der Waals grid and thencontouring the repulsive part of this grid at a positive threshold value, which is set to +1 kcal/mol by default.
2.3 Evaluating the Sites
This stage uses the site-point groups produced in the site-finding stage and the grids producedin the mapping stage to evaluate the sites in terms of a number of properties. The same modifi-cations to van der Waals radii and formal-charge contributions and the same definition ofhydrophobicity are used as in the mapping stage. The properties for each site are added to theMaestro file for the site and recorded in the log file.
To minimize grid errors, the contact, phil, and don/acc SiteMap properties are calculatedexplicitly as average values computed at the site-point positions (including extension points),but the more complicated phob property is obtained by interpolation from the phobic grid fileproduced in the site-visualization step.
To make it easy to recognize sites that appear to be unusually favorable or deficient, key prop-erties are expressed relative to the average value found for a large number of tight-binding (≤ 1µM) sites. The procedure by which this average was obtained is described in Chapter 4. Theproperties and their use are described below.
SiteMap 2.3 User Manual

Chapter 2: How SiteMap Works
SiteScore. The SiteScore is based on a weighted sum of several of the properties that arediscussed below:
SiteScore = 0.0733 sqrt(n) + 0.6688 e - 0.20 p
where n is the number of site points (capped at 100), e is the enclosure score, and p is thehydrophilic score, and is capped at 1.0 to limit the impact of hydrophilicity in charged andhighly polar sites. This score is constructed and calibrated so that the average SiteScore for 157investigated submicromolar sites is 1.0. Thus, a score of greater than 1 suggests a site of partic-ular promise. A SiteScore of 0.80 has been found to accurately distinguish between drug-binding and non-drug-binding sites (see Chapter 4).
Druggability Score, Dscore. Dscore uses the same properties as SiteScore but different coeffi-cients:
Dscore = 0.094 sqrt(n) + 0.60 e - 0.324 p
For Dscore, the hydrophilic score is not capped. This one of the keys for distinguishing “diffi-cult” and “undruggable” targets from “druggable” ones [7]. The use of different functions forbinding-site identification and for classifying druggability is justified because these aredifferent, and sometimes conflicting, tasks. For example, ligands that bind to the PTP1B phos-phate pocket with nanomolar, and even subnanomolar, affinity are known [8]. But these highlyactive ligands have charge structures like those of the natural phosphate substrate and are notdrug-like. SiteMap should recognize that such a site can bind ligands tightly but should not rateit as druggable.
Number of Site Points. The number of site points that make up the site is a measure of the sizeof the site. As a rough rule of thumb, 2 to 3 site points typically correspond to each atom of thebound ligand, including hydrogens. The size of the site is often a good indicator of thepreferred binding site.
Exposure and Enclosure. These two properties provide different measures of how open thesite is to solvent.
To evaluate the exposure property, “extension” site points are added on the 1-Å grid. Thesepoints must lie within a given distance in x, y, or z from an original site point (by default 3 Å),and must make good contact with the receptor or lie at least 4 Å from the nearest protein atom.The value of the property is the ratio of the number of extension points to the number of orig-inal plus extension points. A shallow, open site would allow many more site points to be added,giving a high exposure score. The lower the score, the better; the average for the tight-bindingsites investigated is 0.49.
To evaluate the enclosure property, radial rays are drawn from the site points to sample allpossible directions. The enclosure score is the fraction of rays that strike the receptor surface
SiteMap 2.3 User Manual 7

Chapter 2: How SiteMap Works
8
within a distance of 10 Å, averaged over the original and the extension site points used in theexposure evaluation. The receptor surface is the same surface that was used to classify gridpoints as outside or inside the protein in the site-finding step. Here, higher scores are better,with the average enclosure score for a tight-binding site being 0.78.
Contact. The contact property measures how strongly the average site point interacts with thesurrounding receptor via van der Waals nonbonded interactions, when the site point is givennominal van der Waals parameters. The contact score has been calibrated so that the averagescore for a tight-binding site is 1.0.
Hydrophobic and hydrophilic character, and Balance. These properties, labeled “phob” and“phil”, measure the relative hydrophobic and hydrophilic character of the site. The “balance”property expresses the ratio of the two. The phobic and philic scores have been calibrated sothat the average score for a tight-binding site is 1.0. The average balance score for the investi-gated tight-binding sites, on the other hand is 1.6, not 1.0, because sites that have high phobicand low philic scores make large contributions to the average.
Donor/Acceptor character. This property, labeled “don/acc”, indicates the degree to which awell-structured ligand might be expected to donate, rather than accept, hydrogen bonds, asinferred from the sizes and intensities of donor and acceptor SiteMap regions.
Reference distance properties. When a supplied ligand or other species is used to define theregion of the receptor to be mapped, “refdist” and “refmin” properties are also computed. Thefirst of these specifies the distance between the centroid of the site points and the centroid ofthe reference ligand. The second specifies the closest approach of a site point to a ligand atom.Both are given in angstroms.
In some cases, a small refmin value (typically < 1 Å) is accompanied by a moderately largerefdist of 5 – 10 Å. These are cases in which the site extends asymmetrically beyond the refer-ence ligand in one or more directions. In an endoprotease, such extensions may well map thechannels that bind the N-terminal and C-terminal strands of the peptide undergoing cleavage,and hence are to be expected. These extensions are of interest because they may representregions that a tight-binding ligand might usefully probe.
Site Volume. The volume of a protein site is well defined when the site is fully enclosed by theprotein. More commonly, however, the site is open to solution on one or more sides. To assignthe volume in such a case, what needs to be decided, as one proceeds outward from the proteinsurface, is where to stop counting. Understandably, different criteria will yield different sitevolumes.
SiteMap’s approach approximates the “shrink-wrap” volume of the site by excluding regionsthat protrude too far into the solvent. This is accomplished by first identifying all points on thecubic mapping grid that lie within 4 Å of any site point and are outside the protein surface. By
SiteMap 2.3 User Manual

Chapter 2: How SiteMap Works
default, the grid spacing is 0.7 Å. A large number of radial rays are then drawn from eachcandidate volume point, and those for which fewer than 60% of the rays strike the proteinsurface within 8 Å are removed. The volume of the site is then computed from the number ofremaining volume points and the grid-box volume, which is (0.7 Å)3 in the default case.
If you run calculations from the command line, the mapping points considered to lie within theshrink-wrap can be saved by including the option -keepvolpts. This option returns a pdb-format file for each site that contains the calculated volume points. You can then visualizethese points by importing the file.
SiteMap 2.3 User Manual 9

10
SiteMap 2.3 User Manual
SiteMap User Manual
Chapter 3
Chapter 3: Running SiteMap
SiteMap can be run from within an existing Maestro session or from the command line. Theoriginal SiteMap facility is now accessible from the Surfaces submenu of the Display menu asHydrophobic/philic.
3.1 Running SiteMap from Maestro
SiteMap calculations can be set up and run from the SiteMap panel, which is shown inFigure 3.1. To open this panel, choose SiteMap from the Applications menu. The panel isdivided into two sections, Specify task and Settings, which are described below. When youhave finished making settings, click Start to start the job.
Figure 3.1. SiteMap panel showing options for mapping an entire protein.
SiteMap 2.3 User Manual 11

Chapter 3: Running SiteMap
12
Figure 3.2. SiteMap panel showing options for mapping a region defined by a set ofatoms.
3.1.1 Specifying the Task
In the Specify task section, you can choose between two tasks:
• Identify top-ranked potential receptor binding sites• Evaluate a single binding site region
For each task, the structure to be used must be displayed in the Workspace.
If you choose the first task, Identify top-ranked potential receptor binding sites, SiteMap looksfor binding sites on the entire protein structure. The protein structure must be displayed in theWorkspace, and should consist only of the protein—no ligand, waters, or cofactors. Figure 3.1shows the SiteMap panel when this task is chosen.
SiteMap 2.3 User Manual

Chapter 3: Running SiteMap
If you choose the second task, Evaluate a single binding site region, SiteMap restricts thesearch for binding sites on the protein to a region around a specified structure. When you selectthis option, the controls below it become available. Figure 3.2 shows the SiteMap panel whenthis task is chosen.
For this task, you must pick a single molecule or entry in the Workspace to define the bindingsite, by choosing Molecule or Entry from the Pick menu in the Select non-receptor atomsdefining region to evaluate section., and picking an atom in the Workspace. The ASL text boxabove the Pick menu displays the ASL expression for the selected structure. You can clear theselection by clicking the X button, to the right of the ASL text box. The structure that you pickmust not be the protein, and the contents of the Workspace must include only the protein andthe structure you select to define the binding site.
If you want to include more than one molecule in the region for mapping (for example, aligand and a cofactor), you should create an entry that includes only the molecules you want touse, and another entry for the receptor. You can then display both entries, and pick the entrythat contains the two molecules to define the region.
The region to be added around the selected reference molecule or entry extends out from thereference by 6 Å, by default. If you want to change the extent of the region, you can enter avalue in the Region about selected atoms plus n Å buffer will be examined text box.
3.1.2 Setting Other Options
In the Settings section, you can make the following choices to control the calculations:
• Require at least n site points per reported site—Enter a value to set the minimum numberof site points required in the initial site-finding stage to define a site. The default value of15 site points should allow even relatively small sites to be detected. The average numberof site points found for the tight-binding sites investigated in the calibration studies (seeChapter 4) is about 150.
SiteMap always reports at least one site as long as that site contains at least 3 site points,which is the minimum number required to recognize a site. Thus, only the second andsubsequent sites, ranked in order of the number of site points, must satisfy this threshold.Normally, this setting is not relevant when a molecule or entry is used to restrict thesearch region. However, SiteMap could find more than a single site even in this case if theregion is large or contains subsites that SiteMap is unable to combine into a single site.
• Report up to n sites—Enter the maximum number of sites to report, ranked in order ofdecreasing size (number of site points). The default for this setting is to report up to the 5largest sites found in the initial site-finding stage. This setting is not active when a ligandor other species is used to restrict the size and location of the mapping region.
SiteMap 2.3 User Manual 13

Chapter 3: Running SiteMap
14
• Use type definition of hydrophobicity—Choose the definition of hydrophobicity to use inthe calculation. The choices are labeled more restrictive and less restrictive. The lessrestrictive definition corresponds closely to the definition used in the original version ofSiteMap. The more restrictive definition eliminates points that are adjacent to definedhydrophilic regions and assigns reduced hydrophobicity to solvent-exposed regions.1 SeeSection 2.2.2 on page 5 for more information. The more restrictive definition is thedefault choice.
• Use type grid—Choose the size of the grid to use in computing the displayed site maps.The choices are coarse, standard, and fine, corresponding to grid spacings of 1.0 Å,0.7 Å, and 0.35 Å. The default is standard.
It should be emphasized that the choice of grid increment has no effect on the site-findingor site-evaluation stages of the algorithm, which always position the site points on a 1-Ågrid.
• Crop SiteMaps at n Å from nearest site point—Enter the distance from the nearest sitepoint at which to crop the individual site maps for display in Maestro. The default is 4 Å.No data is lost when the map is cropped. This option merely affects the truncation of thedisplayed surface, and the distance can be altered during the Maestro session.
• Use the type force field—Choose the variant of the OPLS-AA force field to be used. Thedefault is OPLS_2005; the alternative is OPLS_2001.
3.1.3 Running the Job
To start the SiteMap job, click Start, make settings in the Start dialog box, and click Start in thedialog box. You can set the job name, the host, the user name, and the number of processors touse, and you can specify how to incorporate the results.
When a SiteMap job finishes, the site points and site maps are automatically incorporated intothe current Maestro project, and associated with the receptor. The sites are returned in order ofSiteScore, and each site is incorporated as a separate entry in the Project Table. By default,files that are not needed for incorporation into Maestro are removed. However, the file cleanup(and the SiteMap job) is aborted if a problem is found with an Impact job step, so that the logfile is available for inspection.
If you choose not to incorporate a job, or you run a job from the command line, you can importthe results using the Import panel. When you do so, ensure that you select the option Importassociated data files.
1. This definition favors enclosed phobic regions, like the Glide XP definition of hydrophobic enclosure. However,SiteMap’s definition is not as restrictive as is the Glide XP definition, which has geometric elements that neednot be met by the SiteMap definition.
SiteMap 2.3 User Manual

Chapter 3: Running SiteMap
3.1.4 Viewing the Results
When the results are incorporated, the Surface Table panel is opened. You can use the controlsin this panel to change the display attributes of the various maps. The accptr, donor, and phobmaps are displayed by default; the phil and surf maps are not displayed by default.
The default appearance of the six map types is as follows:
• Hydrophobic map—yellow mesh• Hydrophilic map—green mesh• Hydrogen-bond donor map—blue mesh• Hydrogen-bond acceptor map—red mesh• Metal-binding map—pink mesh• Surface map—gray surface, 50% transparency
Thus, a red ligand oxygen atom that accepts a hydrogen bond from the receptor or coordinateswith a metal center should appear in a red acceptor or pink metal-binding region, and a polarhydrogen on a blue amide nitrogen should appear in a blue donor region. (Red and blue are thedefault colors for oxygen and nitrogen.)
You can change the cropping of any of the maps with the following procedure:
1. Select the map in the table.
2. Click Limit.
3. In the Limit dialog box, select Molecule from the Pick menu.
4. Pick a site point.
5. Enter the new distance in the Distance text box.
6. Click OK.
Note: Do not change the molecular representation. Changing representations affects thedisplay of the site points, and cannot be reversed without restarting Maestro.
You can change the value at which the maps are contoured (the isovalue), as follows:
1. Display the desired map, and undisplay all the others.
2. Adjust the Isovalue slider, or enter a value in the adjacent text box.
The other display properties of these surfaces, such as color or representation can also bechanged. For more information, see Section 11.4 of the Maestro User Manual.
SiteMap 2.3 User Manual 15

Chapter 3: Running SiteMap
16
3.2 Sample Site Maps
To illustrate a typical application, Figure 3.3 and Figure 3.4 show the co-crystallized ligand forthe thrombin 1ett receptor and the generated site points (white) in the context of the receptorstructure and of the gray, translucent SiteMap surface. Figure 3.3 focuses on relatively exposedregions of the site, while Figure 3.4 profiles the buried specificity pocket. Figure 3.5 andFigure 3.6, taken from the same viewpoints, display the hydrophobic (yellow) and thehydrogen-bond donor (blue) and acceptor (red) maps, but for clarity suppress the receptorsurface. The hydrophobic groups on the ligand can clearly be seen occupying hydrophobicregions, and the donors and acceptors of the ligand are located in or very close to the appro-priate donor and acceptor regions.
3.3 Running SiteMap from the Command Line
SiteMap can be run from the command line with the sitemap command. The syntax of thesitemap command is as follows:
$SCHRODINGER/sitemap [options] -j jobname -prot file.mae
The principal arguments are described below.
3.3.1 Command Options
The options for the sitemap command are given in Table 3.1. These options are classified intothe common options, additional options, and advanced options. The common options includethe ones that are set from the SiteMap panel in Maestro. The sitemap command also acceptsthe standard Job Control options, which are given in Section 2.3 of the Job Control Guide. Youcan use the -HOST option to distribute the job over multiple processors, for example.
-j jobname Specify the job name. jobname is used to make some file names unique.
-prot file.mae Specify protein file in Maestro format. Required.
SiteMap 2.3 User Manual

Chapter 3: Running SiteMap
Figure 3.3. SiteMap surface and site points for 1ett, exterior of pocket
Figure 3.4. SiteMap surface and site points for 1ett, inside pocket
SiteMap 2.3 User Manual 17

Chapter 3: Running SiteMap
18
Figure 3.5. Hydrophobic, donor, and acceptor maps for 1ett, exterior of pocket
Figure 3.6. Hydrophobic, donor, and acceptor maps for 1ett, inside pocket
SiteMap 2.3 User Manual
Chapter 3: Running SiteMap
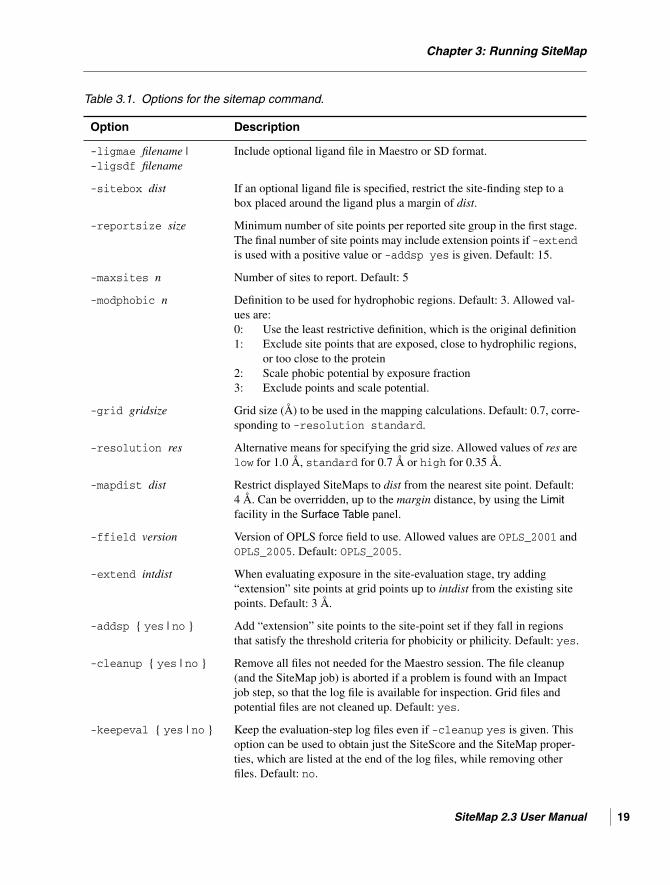
Table 3.1. Options for the sitemap command.
Option Description
-ligmae filename |-ligsdf filename
Include optional ligand file in Maestro or SD format.
-sitebox dist If an optional ligand file is specified, restrict the site-finding step to abox placed around the ligand plus a margin of dist.
-reportsize size Minimum number of site points per reported site group in the first stage.The final number of site points may include extension points if -extendis used with a positive value or -addsp yes is given. Default: 15.
-maxsites n Number of sites to report. Default: 5
-modphobic n Definition to be used for hydrophobic regions. Default: 3. Allowed val-ues are:0: Use the least restrictive definition, which is the original definition1: Exclude site points that are exposed, close to hydrophilic regions,
or too close to the protein2: Scale phobic potential by exposure fraction3: Exclude points and scale potential.
-grid gridsize Grid size (Å) to be used in the mapping calculations. Default: 0.7, corre-sponding to -resolution standard.
-resolution res Alternative means for specifying the grid size. Allowed values of res arelow for 1.0 Å, standard for 0.7 Å or high for 0.35 Å.
-mapdist dist Restrict displayed SiteMaps to dist from the nearest site point. Default:4 Å. Can be overridden, up to the margin distance, by using the Limitfacility in the Surface Table panel.
-ffield version Version of OPLS force field to use. Allowed values are OPLS_2001 andOPLS_2005. Default: OPLS_2005.
-extend intdist When evaluating exposure in the site-evaluation stage, try adding“extension” site points at grid points up to intdist from the existing sitepoints. Default: 3 Å.
-addsp { yes | no } Add “extension” site points to the site-point set if they fall in regionsthat satisfy the threshold criteria for phobicity or philicity. Default: yes.
-cleanup { yes | no } Remove all files not needed for the Maestro session. The file cleanup(and the SiteMap job) is aborted if a problem is found with an Impactjob step, so that the log file is available for inspection. Grid files andpotential files are not cleaned up. Default: yes.
-keepeval { yes | no } Keep the evaluation-step log files even if -cleanup yes is given. Thisoption can be used to obtain just the SiteScore and the SiteMap proper-ties, which are listed at the end of the log files, while removing otherfiles. Default: no.
SiteMap 2.3 User Manual 19

Chapter 3: Running SiteMap
20
-keeplogs { yes | no } Keep the log files from all stages even if -cleanup yes is given. Sets orresets keepeval to yes. This option is set to yes if the value of the–verbosity option is greater than 1. Default: no.
-keepvolpts Keep the pdb-format files that contain the points that are summed tocompute the volume property assigned for the site.
-keepvdw Compute and keep grid-format (.grd) file of van der Waals potentials.
-keepelec Compute and keep grid-format (.grd) file of electrostatic potentials.
-writepot Write (x,y,z,potential) files that specify the phobic, philic, acceptor,donor, vdW, electrostatic, metal, and surface potentials computed bySiteMap. The file names are phobic.smpot, philic.smpot,accptr.smpot, donor.smpot, vdw.smpot, elec.smpot,metal.smpot, and surface.smpot.
Additional options
-enclosure fraction Fraction of ray directions from a grid point that must intersect the pro-tein within a specified distance for that grid point to be considered as apotential site point. Default: 0.5.
-maxdist dist Distance within which a directional ray from a candidate grid point mustintersect the protein surface. Default: 8 Å.
-maxvdw vdw-energy Maximum van der Waals interaction energy (kcal/mol) for a grid pointto be excluded as a potential site point. This quantity is the negative ofthe computed interaction energy, so the argument supplied must be posi-tive. Default: 1.1.
-verbosity {0|1|2|3} Control level of detail in output log files. Default: 0.
-margin margin Grid-box margin (Å) to be used in the SiteMap calculations. Default:6 Å.
-addphob thresh Threshold for adding phobic points. Default: –0.50 if -modphobicoption is 2 or 3, otherwise –0.75.
-addphil thresh Threshold for adding philic points. Default: –8 kcal/mol
-h Print brief usage summary.
-help Print full usage summary.
Table 3.1. Options for the sitemap command. (Continued)
Option Description
SiteMap 2.3 User Manual

Chapter 3: Running SiteMap
Advanced options
-dvscale ratio Squared distance ratio for determining whether a site point is inside oroutside the protein. A site point is outside the protein if the ratio of thesquare of the protein-atom/site point distance to the protein-atom vander Waals radius is larger than this value for all protein atoms. Default:2.5 Å2.
-nthresh n Minimum number of candidate site-point neighbors required to bewithin a given distance for a candidate site point to be eligible for inclu-sion in a site-point group. The square of the distance is specified by–dthresh. Default: 3.
-d2thresh value Squared distance used in -nthresh test. Default: 3.1 Å2.
-kmax n Maximum sum of differences in grid indices to nearest site pointallowed to add a candidate site point to a site-point group. Default: 3.
-kmax2 n Maximum sum of squares of differences in grid indices to nearest sitepoint allowed for a candidate site point to be added to a site-point groupDefault: 5.
-mingroup n Minimum number of points in a site-point group required to constitute asite. Default: 3.
-dthresh value Threshold for the minimum distance separating site points in two site-point groups for them to be considered for merging into a single group.If the minimum distance is larger than this value, the groups will not bemerged. Default: 6.5 Å.
-rthresh value Threshold for the ratio of the distance between the centroids of two site-point groups to the effective sizes of the groups for groups to be consid-ered for merging. Default: 5.
-r2thresh value Threshold for determining whether two site-point groups being consid-ered for merging have successfully been interconnected by solvent-exposed bridging points. The squared distance from a bridging pointbetween the groups to any site point must be less than value for thegroups to be merged. Default: 4.1 Å2.
-cutoff cutdist Restrict the calculation of van der Waals and electrostatic potentials toprotein atoms that lie within cutdist angstroms of a grid point.Default: 20 Å.
-modvdw { yes | no } Adjust van der Waals radii to improve the accuracy with which preferredlocations of hydrogen donors and heavy-atom acceptors are representedin the site maps. Default: yes.
-modcharges { yes |no }
Scale down formal-charge contributions to the protein partial atomiccharges by 50%. Default: yes.
Table 3.1. Options for the sitemap command. (Continued)
Option Description
SiteMap 2.3 User Manual 21

Chapter 3: Running SiteMap
22
3.3.2 SiteMap Output
The following output is generated by SiteMap:
• Site-point files (in Maestro format) and map files (.vis and .grd). These files are readby Maestro to display the SiteMaps. For each site, a set of five or six map files is pro-duced, containing the hydrophobic, hydrophilic, donor, acceptor, surface, and metal-bind-ing maps. Sites are returned in order of SiteScore.
• Log files. These are removed by default when the job finishes successfully. The options–keeplogs and –keepeval can be used to control which log files are kept.
If you do not supply a project name with the sitemap command, the site maps are not auto-matically loaded into Maestro and displayed. To view the site maps in an existing Maestrosession, you can import the results using the Import panel. When you do so, ensure that youselect the option Import associated data files.
3.4 Adapting SiteMap
SiteMap provides control over many aspects of the calculations through command-lineoptions, so that you can adapt SiteMap to the systems that you are interested in. The followingsubsections describe a number of different scenarios with the relevant command options.
3.4.1 Adjusting the Closeness of the Map to the Protein
The -dvscale option can be used to increase or decrease the number of grid points that lieoutside the protein. The default value of 2.5 already allows fairly close approach to the protein.A value of 4 corresponds to the minimum-energy van der Waals distance for a homonuclearcontact.
3.4.2 Tailoring the Definition of Hydrophobicity
Four -modphobic options are provided to tailor the definition of phobicity. Of these, Maestroemploys the -modphobic 3 (“more restrictive”) and -modphobic 0 (“less restrictive”)options. It should be noted that the phobic-property score is calibrated such that the averagephobic score and the average SiteScore for the previously discussed tight-binding complexesare 1.0, whichever phobic option is chosen. Thus, while the size and shape, and sometimeslocation, of displayed phobic regions will depend on the option selected, the average contribu-tion of phobicity to the overall SiteScore for the tight-binding sites does not. What happens isthat phobicity becomes more important for some binding sites and less important for others asthe definition changes.
SiteMap 2.3 User Manual

Chapter 3: Running SiteMap
3.4.3 Finding Shallow Sites
If you are interested in finding relatively shallow sites, you can use the -enclosure,–maxdist, and -maxvdw options to make the site-finding step more receptive to finding rela-tively shallow sites. In particular, additional site-point positions will be recognized as validcandidates for inclusion in a site if some combination of the following is done:
• Make the threshold on the van der Waals energy for accepting points, set with -maxvdw,smaller than the default value of 1.1 kcal/mol.
• Make the maximum distance from a point to the protein, set with -maxdist, greater thanthe default value of 8 Å.
• Make the enclosure fraction, set with -enclosure, smaller than the default of 0.5.
You may need to explore these modifications of the default parameters to find sites appropriatefor protein-protein interactions, for example.
3.4.4 Obtaining Only the SiteMap Properties
If you only want the values of the Maestro properties from the SiteMap calculation and not themaps, you can use the option -keepeval yes. The Maestro properties are listed in the finallines of the evaluation-step log files.
3.4.5 Specifying a Reference Ligand Without Restricting theMapping Region
If a molecule or entry is used to restrict the mapping box, Maestro sets both the -ligmae and–sitebox options. From the command line, you can use -ligmae (or -ligsdf) withoutusing –sitebox to specify a species that is to serve as a positional reference withoutrestricting the region to be mapped. The refdist and refmin properties are generated in thiscase. This approach makes it easy to determine which receptor site, if any, corresponds to thereference site.
3.4.6 Controlling the Merging of Sites
You can control how sites are merged when they are separated by a short distance that couldplausibly be bridged by a ligand in a solvent-exposed region. There are two measures of howclose two groups must be to be considered for merging: the distance between the nearest sitepoints in the two groups, and the ratio of the distance between the centroids of the groups totheir effective size. The threshold for the first is set by -dthresh, and the threshold for thesecond is set by –rthresh. Both must be satisfied.
SiteMap 2.3 User Manual 23

Chapter 3: Running SiteMap
24
In addition to these two measures, there is a measure of whether two site-point groups beingconsidered for merging have successfully been interconnected by solvent-exposed bridgingpoints. The threshold for this measure is set by -r2thresh. When two groups are consideredfor merging, a bridging point is “grown” from one group. If it is sufficiently close to the nearestpoint in the other group, the groups are merged. The threshold is the minimum squareddistance between the bridging point and the nearest point in the second group.
SiteMap 2.3 User Manual

SiteMap User Manual
Chapter 4
Chapter 4: SiteMap Results
To calibrate and characterize the SiteMap properties, SiteMap has been applied to an extensiveset of 230 proteins, which were taken either from the Glide database-enrichment suite or fromthe PDBbind database [5]. These proteins bind ligands of molecular weight at least 150 withaffinities of at least 100 µM. Of the 230 proteins, 155 have binding affinities of 1 µM or less.The proteins were prepared using standard Schrödinger techniques. To avoid prejudicing thesearch, all crystallographic water was removed.
The entire data set was used to optimize the contributions to the overall SiteScore of theSiteMap properties described in Section 2.3. The criterion for the optimization was that the sitewith the best SiteScore corresponded to the co-crystallized site as often as possible. The tight-binding set was further used to calibrate SiteScore and its contact, phobic, and philic compo-nents so that the average value for each of these quantities is 1.0. The most significant termsare the size of the site as measured by the number of site points, the relative openness of thesite as measured by the exposure and enclosure properties, and the tightness of the site asmeasured by the contact property. The phobicity of the site plays a smaller role, and the sitephilicity plays a small enough role that it could have been excluded.
Table 4.1 summarizes SiteMap’s accuracy in locating the primary (co-crystallized) binding sitefor the 230 proteins and for the 155 submicromolar binders. As Nayal and Honig [1] find forScreen and report for other methods, size is a fairly good predictor of the ligand-binding site.However, SiteScore is a better predictor, correctly locating the primary binding site in 96.5%of the proteins in the full set and 98.1% in the tight-binding set.
Table 4.1. Performance in Locating the Primary Binding Site in Proteins
Comparison
230 Proteins 155 Tight Binders
Number Percent Number Percent
Primary site not found 0 0.0 0 0.0
Largest site scores best 203 88.3 139 89.7
Largest site is correct 201 87.4 139 89.7
Best-scoring site is correct 222 96.5 152 98.1
Largest or best-scoring site is correct 224 97.4 153 98.7
SiteMap 2.3 User Manual 25
Chapter 4: SiteMap Results
26
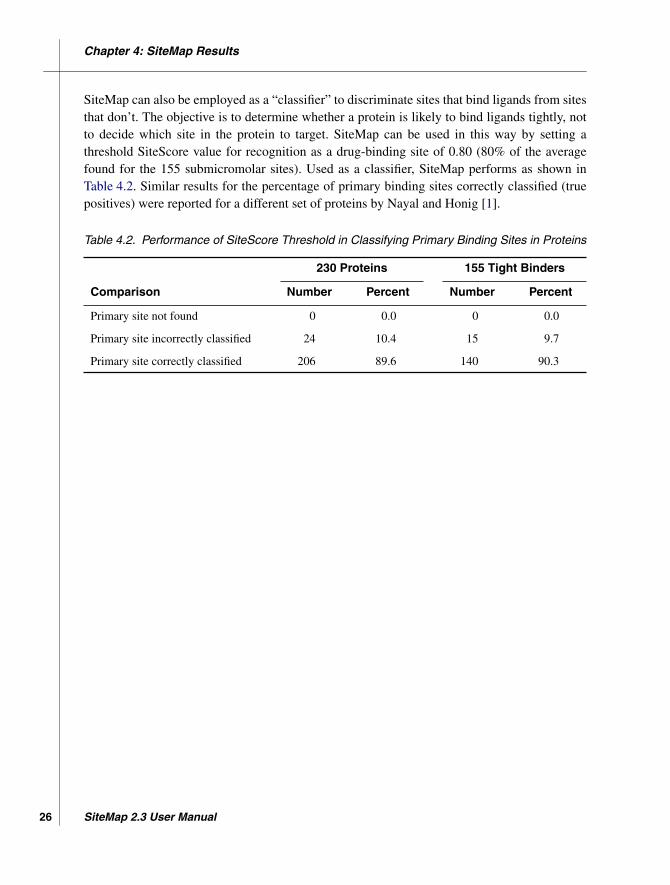
SiteMap can also be employed as a “classifier” to discriminate sites that bind ligands from sitesthat don’t. The objective is to determine whether a protein is likely to bind ligands tightly, notto decide which site in the protein to target. SiteMap can be used in this way by setting athreshold SiteScore value for recognition as a drug-binding site of 0.80 (80% of the averagefound for the 155 submicromolar sites). Used as a classifier, SiteMap performs as shown inTable 4.2. Similar results for the percentage of primary binding sites correctly classified (truepositives) were reported for a different set of proteins by Nayal and Honig [1].
Table 4.2. Performance of SiteScore Threshold in Classifying Primary Binding Sites in Proteins
Comparison
230 Proteins 155 Tight Binders
Number Percent Number Percent
Primary site not found 0 0.0 0 0.0
Primary site incorrectly classified 24 10.4 15 9.7
Primary site correctly classified 206 89.6 140 90.3
SiteMap 2.3 User Manual
SiteMap User Manual
Getting Help
Schrödinger software is distributed with documentation in PDF format. If the documentation isnot installed in $SCHRODINGER/docs on a computer that you have access to, you should installit or ask your system administrator to install it.
For help installing and setting up licenses for Schrödinger software and installing documenta-tion, see the Installation Guide. For information on running jobs, see the Job Control Guide.
Maestro has automatic, context-sensitive help (Auto-Help and Balloon Help, or tooltips), andan online help system. To get help, follow the steps below.
• Check the Auto-Help text box, which is located at the foot of the main window. If help isavailable for the task you are performing, it is automatically displayed there. Auto-Helpcontains a single line of information. For more detailed information, use the online help.
• If you want information about a GUI element, such as a button or option, there may beBalloon Help for the item. Pause the cursor over the element. If the Balloon Help doesnot appear, check that Show Balloon Help is selected in the Maestro menu of the mainwindow. If there is Balloon Help for the element, it appears within a few seconds.
• For information about a panel or the tab that is displayed in a panel, click the Help buttonin the panel, or press F1. The help topic is displayed in your browser.
• For other information in the online help, open the default help topic by choosing OnlineHelp from the Help menu on the main menu bar or by pressing CTRL+H. This topic is dis-played in your browser. You can navigate to topics in the navigation bar.
The Help menu also provides access to the manuals (including a full text search), the FAQpages, the New Features pages, and several other topics.
If you do not find the information you need in the Maestro help system, check the followingsources:
• Maestro User Manual, for detailed information on using Maestro• Maestro Command Reference Manual, for information on Maestro commands• Maestro Overview, for an overview of the main features of Maestro• Maestro Tutorial, for a tutorial introduction to basic Maestro features• SiteMap Frequently Asked Questions pages, at
https://www.schrodinger.com/SiteMap_FAQ.html• Known Issues pages, available on the Support Center.
SiteMap 2.3 User Manual 27

Getting Help
28
The manuals are also available in PDF format from the Schrödinger Support Center. Localcopies of the FAQs and Known Issues pages can be viewed by opening the fileSuite_2009_Index.html, which is in the docs directory of the software installation, andfollowing the links to the relevant index pages.
Information on available scripts can be found on the Script Center. Information on availablesoftware updates can be obtained by choosing Check for Updates from the Maestro menu.
If you have questions that are not answered from any of the above sources, contact Schrödingerusing the information below.
E-mail: [email protected]: Schrödinger, 101 SW Main Street, Suite 1300, Portland, OR 97204Phone: (503) 299-1150Fax: (503) 299-4532WWW: http://www.schrodinger.comFTP: ftp://ftp.schrodinger.com
Generally, e-mail correspondence is best because you can send machine output, if necessary.When sending e-mail messages, please include the following information:
• All relevant user input and machine output• SiteMap purchaser (company, research institution, or individual)• Primary SiteMap user• Computer platform type• Operating system with version number• SiteMap version number• Maestro version number• mmshare version number
On UNIX you can obtain the machine and system information listed above by entering thefollowing command at a shell prompt:
$SCHRODINGER/utilities/postmortem
This command generates a file named username-host-schrodinger.tar.gz, which youshould send to [email protected]. If you have a job that failed, enter the followingcommand:
$SCHRODINGER/utilities/postmortem jobid
where jobid is the job ID of the failed job, which you can find in the Monitor panel. Thiscommand archives job information as well as the machine and system information, andincludes input and output files (but not structure files). If you have sensitive data in the job
SiteMap 2.3 User Manual

Getting Help
launch directory, you should move those files to another location first. The archive is namedjobid-archive.tar.gz, and should be sent to [email protected] instead.
If Maestro fails, an error report that contains the relevant information is written to the currentworking directory. The report is named maestro_error.txt, and should be sent [email protected]. A message giving the location of this file is written to the terminalwindow.
More information on the postmortem command can be found in Appendix A of the JobControl Guide.
On Windows, machine and system information is stored on your desktop in the fileschrodinger_machid.txt. If you have installed software versions for more than onerelease, there will be multiple copies of this file, named schrodinger_machid-N.txt,where N is a number. In this case you should check that you send the correct version of the file(which will usually be the latest version).
If Maestro fails to start, send email to [email protected] describing the circumstances,and attach the file maestro_error.txt. If Maestro fails after startup, attach this file and thefile maestro.EXE.dmp. These files can be found in the following directory:
%USERPROFILE%\Local Settings\Application Data\Schrodinger\appcrash
SiteMap 2.3 User Manual 29

30
SiteMap 2.3 User Manual
SiteMap User Manual
References
1. Nayal, M.; Honig, B. On the nature of cavities on protein surfaces: Application to theidentification of drug-binding sites. Proteins 2006, 63, 892.
2. Friesner, R. A., Murphy, R. B., Repasky, M. P., Frye, L. L., Greenwood, J. R., Halgren,T. A., Sanschagrin, P. C., Mainz, D. T. Extra Precision Glide: Docking and ScoringBased on a New Theory of Molecular Recognition. J. Med. Chem. 2006, 49, 6177.
3. Weber, A.; Halgren, T. A. et al. Design and Synthesis of P2-P1’-Linked MacrocyclicHuman Renin Inhibitors. J. Med. Chem. 1991, 34, 2692.
4. Goodford, P. J. A Computational Procedure for Determining Energetically FavorableBinding Sites on Biologically Important Macromolecules. J. Med. Chem. 1985, 28, 849.
5. Wang, R.; Fang, X.; Lu, Y.; Yang, C.-Y.; Wang, S. The PDBbind Database: Methodolo-gies and updates. J. Med. Chem. 2005, 48, 4111.
6. Friesner, R. A.; Banks, J. L.; Murphy, R. B.; Halgren, T. A.; Klicic, J. J.; Mainz, D. T.;Repasky, M. P.; Knoll, E. H.; Shelley, M.; Perry, J. K.; Shaw, D. E.; Francis, P.; Shenkin,P. S. Glide: A New Approach for Rapid, Accurate Docking and Scoring. 1. Method andAssessment of Docking Accuracy. J. Med. Chem. 2004, 47, 1739.
7. Halgren, T. A. Identifying and Characterizing Binding Sites and Assessing Drugga-bility, J. Chem. Info. Model., in press.
8. Therien, M.; Skorey, K.; Zamboni, R.; Li, C. S.; Lau, C. K.; LeRiche, T.; Truong, V. L.;Waddleton, D,; Ramachandran, C. Synthesis of a novel peptidic photoaffinity probe forthe PTP-1B enzyme. Bioorg. Med. Chem. Lett. 2004, 14, 2319.
SiteMap 2.3 User Manual 31

32
SiteMap 2.3 User Manual

120 West 45th Street, 29th Floor
New York, NY 10036
101 SW Main Street, Suite 1300
Portland, OR 97204
8910 University Center Lane, Suite 270
San Diego, CA 92122
Zeppelinstraße 13
81669 München, Germany
Dynamostraße 13
68165 Mannheim, Germany
Quatro House, Frimley Road
Camberley GU16 7ER, United Kingdom
SCHRÖDINGER ®


