45
Six Sigma Green Belt Part 7 Root Cause Analysis 7-1 © 2013 Institute of Industrial Engineers

Six Sigma Green Belt
Part 7
Root Cause Analysis
7-1 © 2013 Institute of Industrial Engineers

Cost and Value
In the economic battle of competition between organizations producing similar products or services cost is the ultimate measure.
Green Belts must be cost conscious and value oriented to perform in the best interests of the organization.
7-2 © 2013 Institute of Industrial Engineers
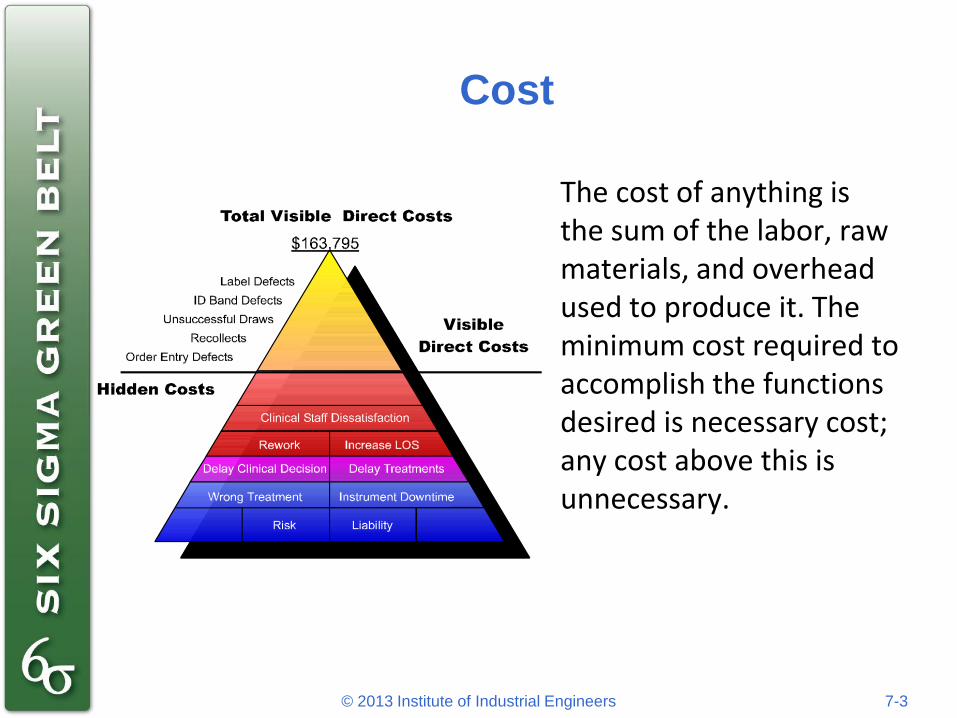
Cost
The cost of anything is the sum of the labor, raw materials, and overhead used to produce it. The minimum cost required to accomplish the functions desired is necessary cost; any cost above this is unnecessary.
7-3 © 2013 Institute of Industrial Engineers

Variable Costs
• Variable cost is directly associated with the production of a product:
Direct labor
Direct materials
$0.00
$200.00
$400.00
$600.00
$800.00
$1,000.00
$1,200.00
$1,400.00
0 50 100 150 200
Units Produced
Co
st
7-4 © 2013 Institute of Industrial Engineers
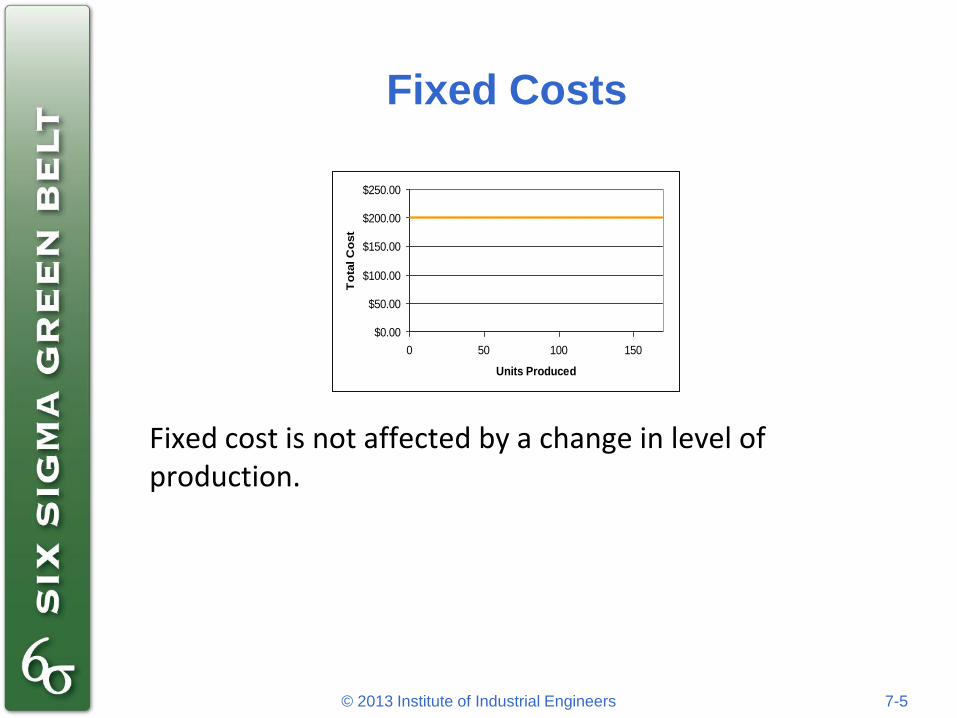
Fixed Costs
Fixed cost is not affected by a change in level of production.
$0.00
$50.00
$100.00
$150.00
$200.00
$250.00
0 50 100 150
Units Produced
To
tal C
ost
7-5 © 2013 Institute of Industrial Engineers

Total Costs
$0.00
$200.00
$400.00
$600.00
$800.00
$1,000.00
$1,200.00
$1,400.00
$1,600.00
0 50 100 150
Units Produced
To
tal C
ost
7-6 © 2013 Institute of Industrial Engineers

Revenue
Income received from each unit sold.
$0.00
$200.00
$400.00
$600.00
$800.00
$1,000.00
$1,200.00
$1,400.00
$1,600.00
$1,800.00
0 50 100 150
Units Sold
Re
ve
nu
e
7-7 © 2013 Institute of Industrial Engineers

Break Even
Point at which total costs equals total revenue.
$0.00
$200.00
$400.00
$600.00
$800.00
$1,000.00
$1,200.00
$1,400.00
$1,600.00
$1,800.00
0 50 100 150
Units
Breakeven
Point
Surplus
Loss
7-8 © 2013 Institute of Industrial Engineers
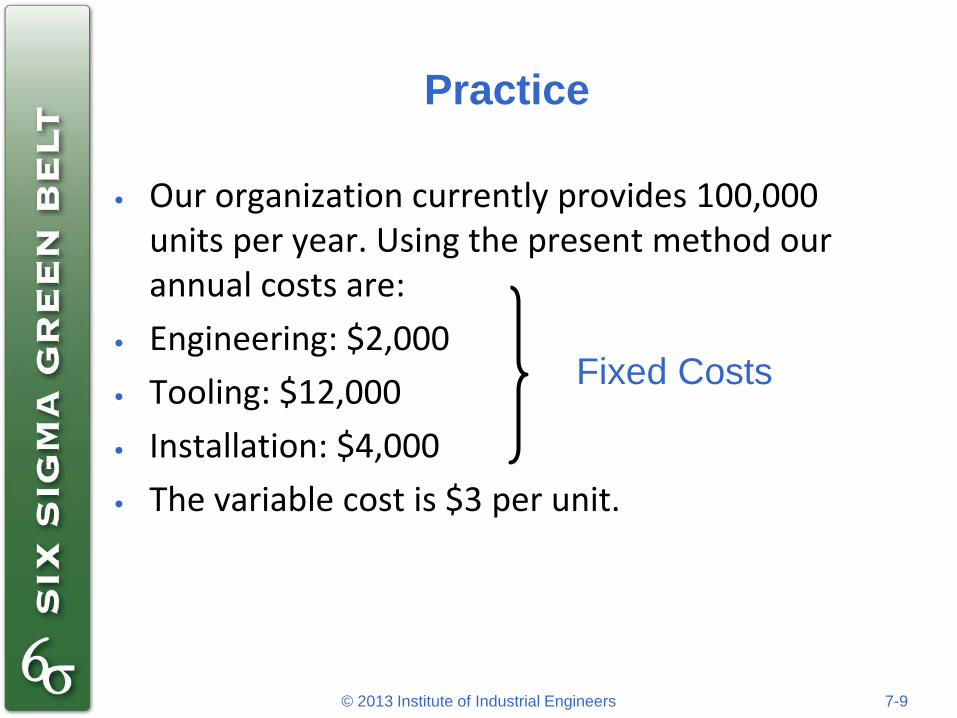
Practice
• Our organization currently provides 100,000 units per year. Using the present method our annual costs are:
• Engineering: $2,000
• Tooling: $12,000
• Installation: $4,000
• The variable cost is $3 per unit.
Fixed Costs
7-9 © 2013 Institute of Industrial Engineers

Practice Continued
• A six sigma green belt has suggested a modification based on DMAIIC. This is designed to replace the current process. The costs are as follows:
• Engineering: $25,000
• Special Equipment: $35,000
• Training: $5,000
• Re-layout: $10,000
• The Variable cost per unit using this method is $2.05 per unit.
Fixed Costs
7-10 © 2013 Institute of Industrial Engineers

Practice Question
a. Which is the better alternative under current conditions?
b. Determine the break over point between the two alternatives.
c. What assumptions are we making?
d. How much more do we make at the same production/sales level (if anything) with the improved method?
7-11 © 2013 Institute of Industrial Engineers

Root Cause Analysis
All organizations have problems that plague their operations, reduce profits, and create customer dissatisfaction. We called many of these special causes of variation. Most organizations try to fix these problems quickly without ever finding what caused them in the first place, making the problems reappear. Root cause analysis is the process of finding and eliminating the cause, which would prevent the problem from returning. Only when the root cause is identified and eliminated can the problem be solved.
7-12 © 2013 Institute of Industrial Engineers

Process Definition
A process is a set of conditions or set of causes which work together to produce a given result. It includes: Inputs, Outputs, Transformations, and Feedback.
A process is any work that meets the four criteria: it is recurrent; it affects some aspect of organizational capability; it can be accomplished differently so as to make contribution to customer or/and profit; it involves co-ordination.
SIPOC Model
Suppliers
Customers
Inputs Outputs Process
7-13 © 2013 Institute of Industrial Engineers

SIPOC
A method to assist in developing the flow on a process map is SIPOC
Suppliers: Who supplies the inputs to do the job?
Inputs: What are the products/services that your suppliers give you?
Process/Sequence: What are the steps to convert the inputs to outputs?
Outputs (products or services): What products or services are produced?
Customers: Who receives your products and services? What do they need? What are their requirements?
7-14 © 2013 Institute of Industrial Engineers

Flowcharts
• A flowchart is a graphical representation of a process
• The first step in many process improvement projects is to create a flowchart
7-15 © 2013 Institute of Industrial Engineers

Flow Charts
• Map of the process showing elements such as
– Operations
– Decisions
– Delays
– Storages
– Handling
– Information
Flow
7-16 © 2013 Institute of Industrial Engineers

Process Analysis Using Flow Chart
Questions to ask:
a. Why
b. When
c. Where
d. Who
e. How
f. Why
???
7-17 © 2013 Institute of Industrial Engineers

Swim Lane Flow Chart
Value
Stream Map
7-18 © 2013 IIE and Aft Systems, Inc.
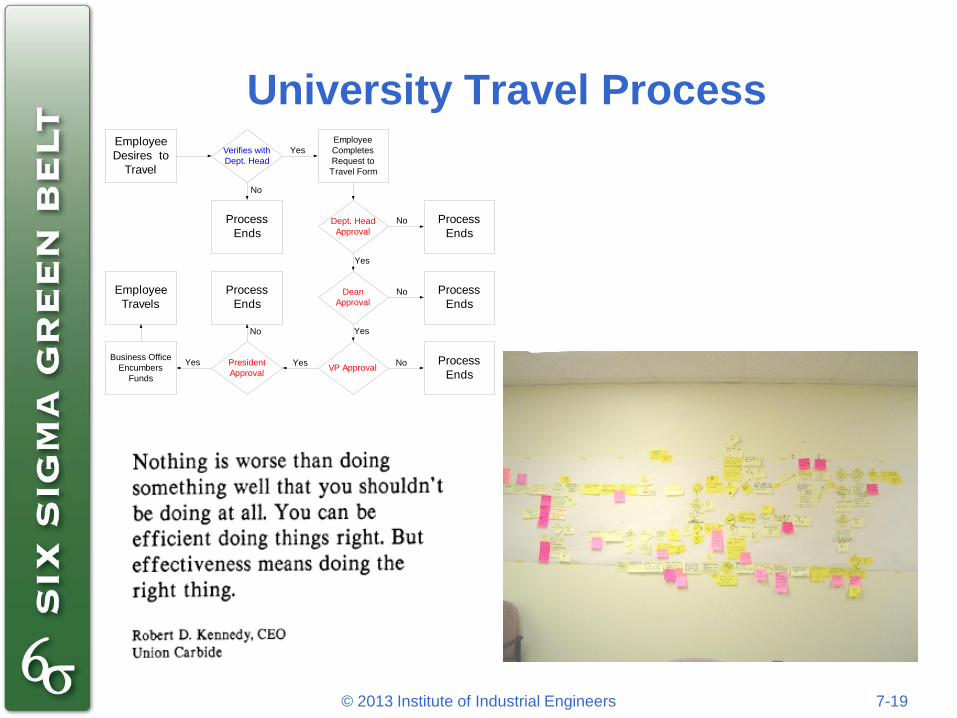
University Travel Process Employee
Desires to
Travel
Verifies with
Dept. Head
Employee
Completes
Request to
Travel Form
Process
EndsDept. Head
Approval
Dean
Approval
VP ApprovalPresident
Approval
Process
Ends
Business Office
Encumbers
Funds
Employee
Travels
Process
Ends
Process
Ends
Process
Ends
No
No
No
No
No
Yes
Yes
Yes
YesYes
7-19 © 2013 Institute of Industrial Engineers

Check Sheets
• Check sheets are used to record data.
• They are simple to use. They are:
– Visual
– Easy to Interpret
– Organize Data Collection
• Check sheets are designed, structured formats for recording process data in a manner that can reveal underlying patterns
7-20 © 2013 Institute of Industrial Engineers

Check Sheets
• Check Sheets are data gathering tools that can be used in forming histograms and Pareto charts
• Check sheets are a form used to record the frequency of occurrence of certain product or service characteristics
• Check sheets can be either tabular or schematic
7-21 © 2013 Institute of Industrial Engineers

Standard Check Sheet Design
This check sheet helps to gather data on quality problems actually experienced
Characteristic Performance Measurement Tally Total
(What Could Go Wrong) Standard Frequency
7-22 © 2013 Institute of Industrial Engineers

Sample Check Sheet Apparel Manufacturing
Potential Problem Observed Defective Frequency
Inside out 210 13 0.062
Machine broken 21 0 0.000
No operator 21 0 0.000
No raw material 21 0 0.000
No thread 21 0 0.000
Side seam mismatch 168 32 0.190
Thread color 336 44 0.131
Torn material 168 21 0.125
Upside down 210 10 0.048
Wrong needle 168 1 0.006
7-23 © 2013 Institute of Industrial Engineers

Sample Check Sheet Incoming Calls
Date:
Time Tally Total
9:00-10:00
10:00-11:00
11:00-12:00
12:00-1:00
1:00-2:00
2:00-3:00
3:00-4:00
4:00-5:00
7-24 © 2013 Institute of Industrial Engineers

Sample Check Sheet
7-25 © 2013 Institute of Industrial Engineers

Pareto Analysis
0
10
20
30
40
50
60
H B G A I D F E C
Problem
• Pareto Analysis reflects the frequency or impact of problems. The actual analysis can appear either as a table or as a bar chart
• It is a guide to selecting opportunities and prioritizing
7-26 © 2013 Institute of Industrial Engineers

Pareto Principle
• Derives from the 80-20 Rule: 80% of the problems are due to 20% of the causes
• Identify problems to study
• Identify most likely causes
• Point out significant frequencies or costs
• Based upon Juran’s work
» Significant Few and the Trivial Many
7-27 © 2013 Institute of Industrial Engineers

Cause-Effect Diagram
• Tool for organizing team’s knowledge about a process – in effect it is organized or structured brainstorming
• Graphical picture of what is known about the process
• Communication tool
• Named after Dr. Ishikawa
7-28 © 2013 Institute of Industrial Engineers

Ishikawa Diagram
The cause and effect diagram assists in reaching a common understanding of the problem and exposes the potential drivers of the problem
7-29 © 2013 Institute of Industrial Engineers

Typical Categories for Branches
Manufacturing
– Methods
– Materials
– Equipment
– People
– Environment
Service
– Procedures
– Processes
– Policies
– People
7-30 © 2013 Institute of Industrial Engineers

Sample Cause Effect Diagram
METHODS MACHINE Operator
Mat'l ID Training Tension Information
Placement Set Up
Specs Wrong Clearance Calibration
Missing Pattern Tools
None Cutting Tools
Fixtures Volume Capacity
Cutting Direction Maintenance
Over use
Speed
Dull Knife Standards
Incentives
Maintenance Wrong Size
Cut
Parts
Space Time Available Stress
Light Storage Schedule Schedule
Environ. Substitute Standards Attitudes
Temperature Wages
Finish Specs Motivation
Humidity
Strength Composition Discipline
Static Electricity Loose Trainers
Spread Incorrect
Shrinkage Tight Training
None
ENVIRONMENT MATERIALS PEOPLE Cost
7-31 © 2013 Institute of Industrial Engineers

Scatter Diagram
• Graph of one sample variable versus another
• May show cause and effect relationships
• May show strong correlation with a cause and effect relationship
0
5
10
15
20
25
1 3 5 7 9 11 13 15 17 19
X Values
Y V
alu
es
•A correlation of +1 indicates a
perfect positive relationship
•A correlation of –1 indicates a
perfect negative relationship
•A correlation of 0 means no
significant relationship
7-32 © 2013 Institute of Industrial Engineers

Using a Scatter Diagram
• Vary over normal operating range
• Extrapolate with care – don’t go beyond the limits of the observed data
• Stratify or sort by classification, such as shift, to find interactions
• Beware of happenstance or hidden variable data in which there may appear to be a strong correlation but no valid reason for it
7-33 © 2013 Institute of Industrial Engineers
FMEA Definition
A procedure by which each potential failure mode in a system is analyzed to determine the results of effects thereof on the system and to classify each potential failure mode according to its severity, the likelihood of it occurring, and the ability of the system to prevent it from occurring.
7-34 © 2013 Institute of Industrial Engineers

Background
The failure mode and effects analysis (FMEA) is the most widely used analysis procedure in practice at the initial stages of system development.
The FMEA is usually performed during the conceptual
and initial design phases of the system in order to assure that all possible failure modes have been considered and that proper provisions have been made to eliminate all the potential failures.
7-35 © 2013 Institute of Industrial Engineers

History of FMEA
• Created by the aerospace industry in the 1960s.
• Ford began using FMEA in 1972.
• Incorporated by the “Big Three” in 1988.
• Automotive Industry Action Group and American Society for Quality Control copyright standards in 1993.
7-36 © 2013 Institute of Industrial Engineers
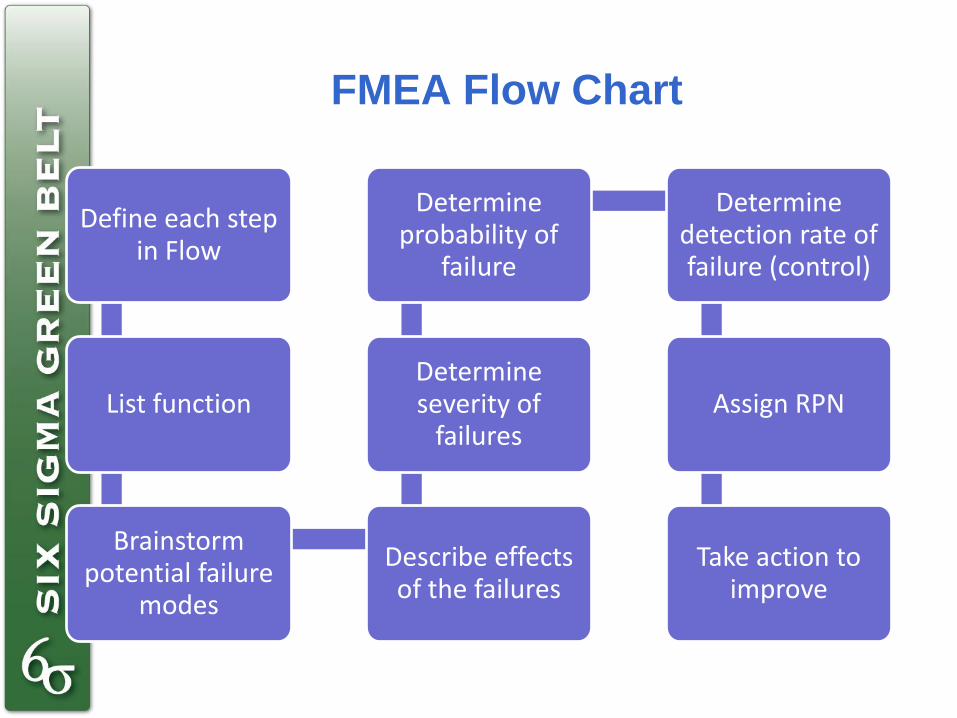
FMEA Flow Chart
Define each step in Flow
List function
Brainstorm potential failure
modes
Describe effects of the failures
Determine severity of
failures
Determine probability of
failure
Determine detection rate of failure (control)
Assign RPN
Take action to improve

Tracking Form
Process FMEA
Part/Process Suppliers Affected: Prepared by:
Name:
Manufacturing Model Year: FMEA Date:
Reponsibility:
Other Areas: Release Date: Key ProductionDate:
Process Purpose Potential Potential Severity Class Potential Occur Current Detect RPN Recom Respon Actions
Failure Effects Cause Controls Actions
Mode
7-38 © 2013 Institute of Industrial Engineers

Additional RCA Tools and Techniques
7-39 © 2013 Institute of Industrial Engineers

TRIZ - Inventive
Problem Solving
The theory of inventive problem solving is based upon extensive research
into real inventions. The research focused on the most significant of those
inventions - where the solution to the problem was not entirely obvious
and required no trade-offs. The results of which revealed that inventors
worldwide sub-consciously applied a common technique - TRIZ brings
together these techniques and combines them with very practical
methods.
Scientific approach to new
solutions to engineering
problems.
Brainstorming
(Osborne)
This is a classic tool recognised by many, but it is not that successful at
generating new ideas. As a method it is not efficient at generating new
ideas - Life is just too short! Limited to smaller groups - can create
problems with group dynamics.
Generating new
associations.
Brainstorming -
Catalogue
Techniques
Participants Use pictorial matter (Catalogues, photos, etc.) as triggers.
More structure than the classic - slightly more efficient as well.
Competitive analysis, new
features.
Card / Post-it
Systems
Participants Use slips to write ideas down - requires little management
intervention or leadership skills - It can be used successfully on large
groups. A variation of this technique is 'pass it on' where participants pass
on a single card adding ideas to the list.
Idea generation for large
groups
Brain writing -
Trigger / Cascade
Similar to classic brainstorming - without the disadvantages. More efficient
at generating new ideas. Participants use post-it pads to provide triggers
for discussion.
Ideal for new teams.
Knowledge Trees Structured brainstorming and reference technique for generation of new
products. Highly effective when used by cross functional teams. Can be
applied to virtually all aspects in the product design phase. The method
was developed by IPM and is used on a regular basis.
Generating specifications.
Sharing product knowledge
and general understanding.
Parametric
Analysis
Parameter based analysis - Quantitative, Qualitative, Categorical. An
existing (or competitor) product is used as a benchmark with particular
attention being paid to specific parameters. It is then indicated how these
parameters would have to be different to enhance satisfaction.
Developing an existing
product or product portfolio.
Semantic
Processes -
Random
Matching
Random word-to-word to trigger new associations General purpose tool
Semantic
Processes - Idea
Search Matrix
Checklists of questions to trigger new thoughts and ideas General purpose tool
7-40 © 2013 Institute of Industrial Engineers

Excursion
Technique
Using words and situations to lead away from the problem and
reality. Switching back when a new idea or association is seen.
Often closes on one idea
General purpose tool
Problem
Abstraction -
Why?Why?....
Problem Abstraction or Semantic Processes (redefinition)
attempts to reduce problems to their most basic level - problem
goals and boundaries are then set. The procedure then follows a
series of Why? questions followed by a subsequent Alternative?
Good Team exercise.
Developing existing
portfolio. Identifying
market opportunities for
new products.
Ideas Book Simple technique but can reap good results - Ideas are entered
into a dedicated book from anyone who wishes (and at any time) -
a relaxed approach to new ideas and suggestions. Can fall quickly
into disrepute if not part of an evaluations procedure.
Good when no time limit
is present. Ongoing
suggestions.
Orthographic
Analysis
Orthographic analysis is a way of arranging several attributes of a
problem in a graphical representation of corresponding
dimensions. A general purpose version of orthographic analysis
takes a product and represents its Material, Manufacturing
Processes and its Market along three orthographic axes.
Portfolio enhancement.
Specific solutions to
known market
requirements.
SCAMPER -
Stretch Matrix
Substitute, Combine, Adapt, Magnify ( or Minify), Put to other
uses, Eliminate, Re-arrange (or Reverse) - Together they make
up a checklist of possible product modifications.
Product improvements
and enhancements.
Analogies A particular form of thinking or reasoning in which the properties
of one object are thought of in terms of a second object which is
different but does have elements in common with the former.
Ideas may come from nature or other similar products.
New product features.
Evaluation -
PIPS
Phases of Integrated Problem Solving - Is a numerical scoring tool
that divides the problem (or opportunity) and processes into
individual stages and evaluates individually.
Products and Processes
Clichés and
Proverbs
A technique to jog the mind out of conventional thinking (out of a
rut). Armed with a list of common Clichés and Proverbs ask how
each one may apply or be applied to the subject or problem.
General Use
7-41 © 2013 Institute of Industrial Engineers
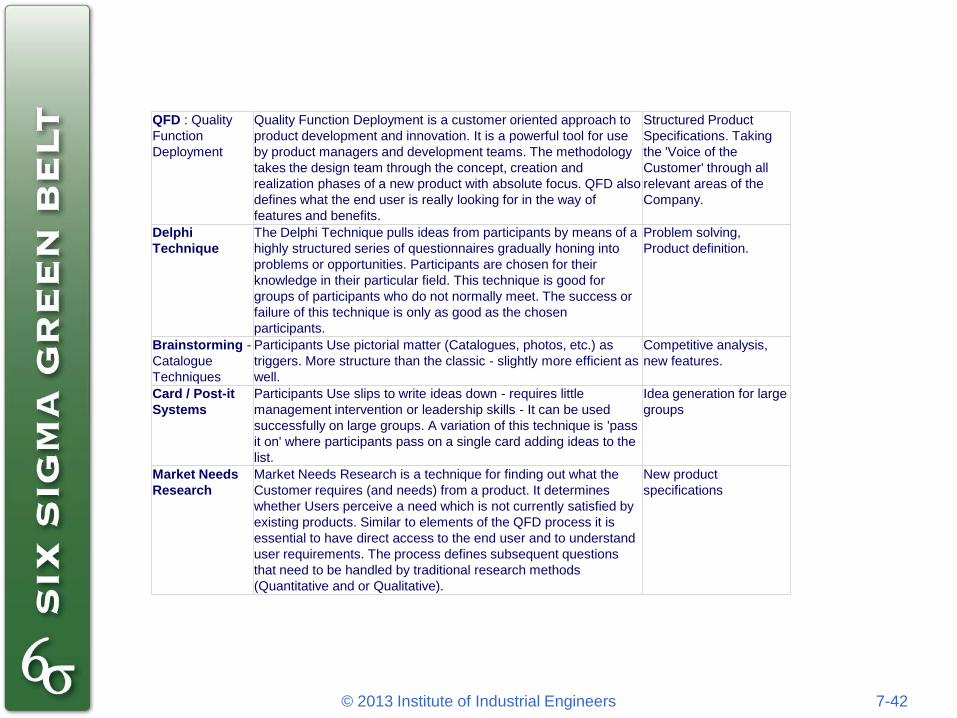
QFD : Quality
Function
Deployment
Quality Function Deployment is a customer oriented approach to
product development and innovation. It is a powerful tool for use
by product managers and development teams. The methodology
takes the design team through the concept, creation and
realization phases of a new product with absolute focus. QFD also
defines what the end user is really looking for in the way of
features and benefits.
Structured Product
Specifications. Taking
the 'Voice of the
Customer' through all
relevant areas of the
Company.
Delphi
Technique
The Delphi Technique pulls ideas from participants by means of a
highly structured series of questionnaires gradually honing into
problems or opportunities. Participants are chosen for their
knowledge in their particular field. This technique is good for
groups of participants who do not normally meet. The success or
failure of this technique is only as good as the chosen
participants.
Problem solving,
Product definition.
Brainstorming -
Catalogue
Techniques
Participants Use pictorial matter (Catalogues, photos, etc.) as
triggers. More structure than the classic - slightly more efficient as
well.
Competitive analysis,
new features.
Card / Post-it
Systems
Participants Use slips to write ideas down - requires little
management intervention or leadership skills - It can be used
successfully on large groups. A variation of this technique is 'pass
it on' where participants pass on a single card adding ideas to the
list.
Idea generation for large
groups
Market Needs
Research
Market Needs Research is a technique for finding out what the
Customer requires (and needs) from a product. It determines
whether Users perceive a need which is not currently satisfied by
existing products. Similar to elements of the QFD process it is
essential to have direct access to the end user and to understand
user requirements. The process defines subsequent questions
that need to be handled by traditional research methods
(Quantitative and or Qualitative).
New product
specifications
7-42 © 2013 Institute of Industrial Engineers

Opportunity
Specification
A concise specification document describing the market need for a
proposed new product. It is a good tool for screening new ideas (products)
against the companys' capabilities. It describes the business opportunity of
the proposed product in terms of core benefits. It also justifies the business
opportunity in terms of commercial viability.
Concise business
justification, market
opportunities, product
identification
Knowledge Trees Structured brainstorming and reference technique for generation of new
products. Highly effective when used by cross functional teams. Can be
applied to virtually all aspects in the product design phase. The method
was developed by IPM and is used on a regular basis.
Generating specifications.
Sharing product knowledge
and general understanding.
Visual Mapping Series of matrices position product features and attributes in a visual way -
Simple but powerful technique to share new product features with a multi
disciplinary team
Product definition - Aids in
the communication between
Development, Marketing,
Industrial design.
Product Function
Analysis or
(FAST)
Function Analysis Systematic Technique is a method of systematically
analysing the functions performed by a product. Once again intimate
knowledge of the customers needs and wants with regards to product
features and functions. A function tree answers the questions of How and
Why functions are required.
Good for analysing both
new and existing products,
the results of which being
used in methodologies like
QFD, VAVE, FMEA etc.
FMEA Failure Mode Effect Analysis - Highlights the problem areas (safety related)
of a design - Severity and Probability analysis.
Screening for potential
problems (safety or
reliability related) with new
products.
VAVE Value Analysis Value Engineered - Primarily an engineering /
manufacturing tool to optimise design features in the most cost effective
way
Optimised cost effective
design prior to manufacture.
7-43 © 2013 Institute of Industrial Engineers

The 6s Process
ID Customer Expectations
Process Flow Analysis
Root Cause Analysis
(Cause & Effect, Pareto)
Key Process Identified Data Collection Strategy
•Histogram
•Scatter Diagram
•Run Chart
•Control Chart
Baseline Measures
Propose Improvement Plan
Implement Plan
Collect & Analyze Data
Compare with Previous Results
Document & Standardize
Monitor
Causes Identified?
No
Objectives Met?
YES
No
YES
Define Measure and Analyze Improve, Implement
and Control
7-44 © 2013 Institute of Industrial Engineers
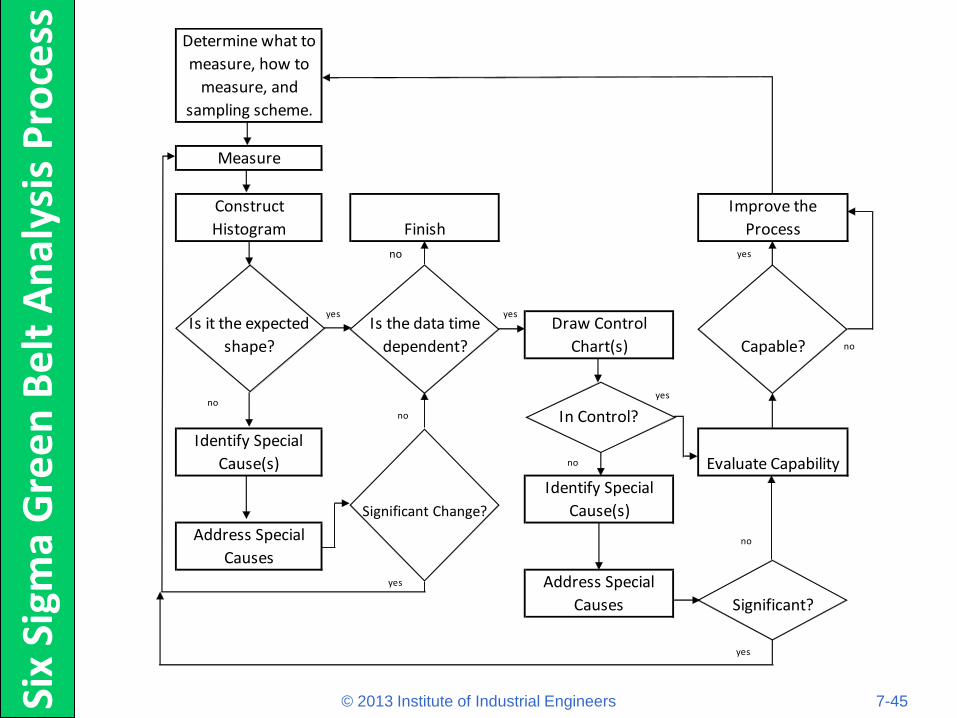
Six
Sigm
a G
ree
n B
elt
An
alys
is P
roce
ss
Determine what to
measure, how to
measure, and
sampling scheme.
Measure
Construct
Histogram Finish
Improve the
Process
no
Is it the expected
shape?
Is the data time
dependent?
Draw Control
Chart(s) Capable?
In Control?
Identify Special
Cause(s) Evaluate Capability
Significant Change?
Identify Special
Cause(s)
Address Special
Causes
Address Special
Causes Significant?
yes yes
yes
yes
yes
no
no
no
yes
no
no
7-45 © 2013 Institute of Industrial Engineers


