13
Six sigma very basic concise explanation and use of it Skorkovský KPH_ESF_MU BRNO_Czech Republic
| Date post: | 12-Jan-2016 |
| Category: |
Documents |
| Upload: | arthur-cooper |
| View: | 215 times |
| Download: | 0 times |

Six sigma very basic concise explanation and use of it
SkorkovskýKPH_ESF_MU BRNO_Czech Republic

Six Sigma method
• Motorola 1985• Use in order to produce better products nad
less problem processes • PPM- parts per million ->4,4 defects /million
opportunities• Six-Sigma-DMAIC methodology

Where Six Sigma method can be applied

Normal distribution
Normal distribution curve that illustrates standard deviations. Each band has 1 standard deviation, and the labels indicate the approximate proportion of area (note: these add up to 99.8%, and not 100% due to rounding for presentation.)

SIX SIGMA Statistical background
Target = m
Some Key measure
Resource : Pro-Enbis
+/ - 3s
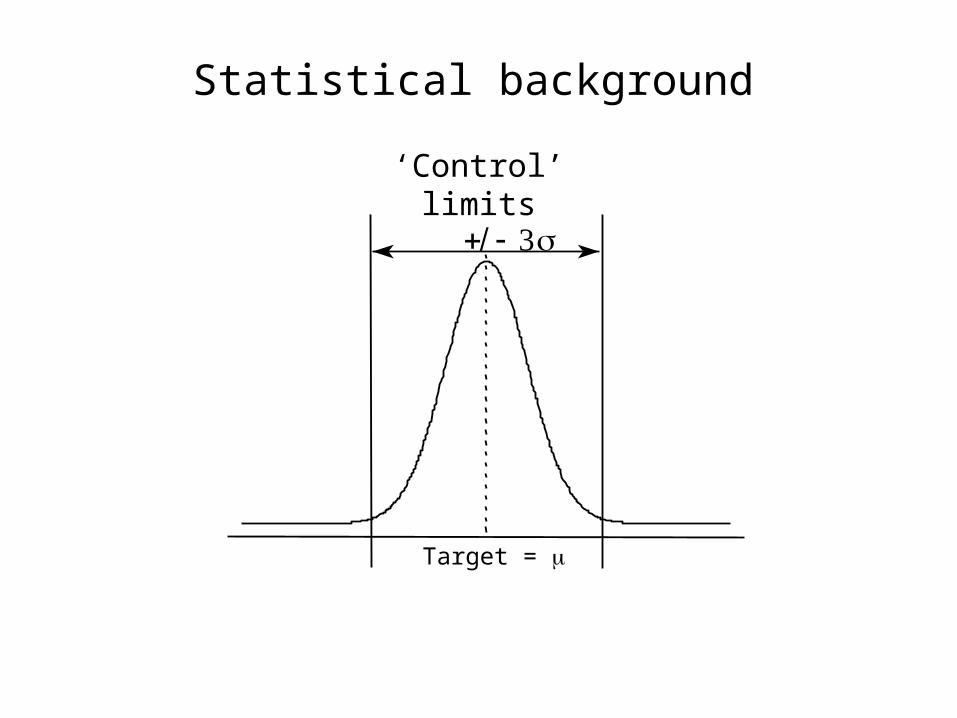
Statistical background
Target = m
‘Control’ limits

+/ - 3s
LSL USL
Statistical background
Required Tolerance
Target = m
Lower specification level Upper specification level

+/ - 3s
+/ - 6s
LSL USL
Statistical background
Tolerance
Target = m
Six-Sigma

+/ - 3s
+/ - 6s
LSL USL
ppm1350
ppm1350
Statistical background
Tolerance
Target = m
Ppm= parts per million

+/ - 3s
+/ - 6s
LSL USL
ppm0.001
ppm1350
ppm1350
ppm0.001
Statistical background
Tolerance
Target = m

Statistical background
• Six-Sigma allows for un-foreseen ‘problems’ and longer term issues when calculating failure error or re-work rates
• Allows for a process ‘shift’ (1,5 σ)

LSL
0 ppm ppm3.4
1.5s USL
ppm3.4ppm
66803
m
+/ - 6s
Statistical background
Tolerance

Performance Standards
23456
30853766807
62102333.4
PPM
69.1%93.3%99.38%99.977%99.9997%
Yield
Processperformance
Processperformance
Defects permillion
Defects permillion
Long term yield
Long term yield
Current standardCurrent standard
World ClassWorld Class


