Sixteen 40 Ar/39 Ar geochronology analyses from southeastern Arizona by Lisa Peters New Mexico Geochronological Research Laboratory Charles A. Ferguson, Jon E. Spencer, and Tim R. Orr Arizona Geological Survey and William R. Dickinson University of Arizona Arizona Geological Survey Open File Report 03-02 May 2003 Arizona Geological Survey 416 W. Congress St., #100, Tucson, Arizona 85701 Research partially supported by the Us. Geological Survey, National Cooperative Geologic Mapping Program, under USGS award numbers 99HQAG0171, OOHQAG0149, and OIHQAG0098. The views and conclusions contained in this document are those of the authors and should not be interpreted as necessarily representing the official policies, either expressed or implied, of the u.s. Government.
Transcript
Sixteen 40 Ar/39 Ar geochronology analyses from southeastern
Arizona by
Lisa Peters New Mexico Geochronological Research Laboratory
Charles A. Ferguson, Jon E. Spencer, and Tim R. Orr Arizona Geological Survey
and William R. Dickinson University of Arizona
Arizona Geological Survey Open File Report 03-02
May 2003
Arizona Geological Survey 416 W. Congress St., #100, Tucson, Arizona 85701
Research partially supported by the Us. Geological Survey, National Cooperative Geologic Mapping Program, under USGS award numbers
99HQAG0171, OOHQAG0149, and OIHQAG0098. The views and conclusions contained in this document are those of the authors and should not be
interpreted as necessarily representing the official policies, either expressed or implied, of the u.s. Government.
Introduction
The results of 40 Ar/39 Ar analyses of 15 samples of rhyolitic ash-flow tuffs and one sample of a dacitic dome from Mid-Tertiary and Cretaceous volcanic successions in the Tucson area are presented in this report. Most of the samples were collected from variably tilted Mid-Tertiary supracrustal successions surrounding the Catalina metamorphic core complex in the Tortolita Mountains, Black Mountain, San Pedro trough, and Cienega Gap areas. Four samples of Upper Cretaceous ash-flow tuffs from the Santa Rita and Roskruge Mountains were also collected. Ten samples (FO-660, FO-927, FL-354, FK-1336, FK-1702, FK-1706, FK-1707, FK-1832, FK-3062 and FK-3277) were submitted in the fall of 200 1. Sanidine was separated from all but samples FK-3062 and FK-3277 from which biotite was separated (sample preparation in Table 1). In May of 2002, six additional rhyolites were submitted (CAF-02-1680, CAF-02-3628, T02-715, JES-3-26-02-1, WRD-CPH-l and WRD-CPH-2). Sanidine was separated from all of these samples.
Units sampled are described and analytical data are summarized in Table A, and UTM grid locations of the samples are listed in Table B.
40 Ar/39 Ar Analytical Methods and Results
Ten to twenty-six crystals of each sanidine separate were analyzed by the single-crystal laser fusion method. The biotite separates were heated in two steps with a C02 laser. The age data are displayed on probability distribution diagrams (Deino and Potts, 1992). Abbreviated analytical methods for the dated samples are given in Table 1, and details of the overall operation of the New Mexico Geochronology Research Laboratory are provided in the Appendix. The argon isotopic results are summarized in Table 1 and listed in Tables 2, 3, 4, and 5.
Of the samples submitted in 2001, five were from the lower part of the upper Pantano Fonnation in the Cienega Gap area. Sanidine from FK-1706 yielded a Gaussian distribution and a weighted mean age of 26.52±0.07 Ma (Figure 1 and Table 2). Six crystals with KlCa ratios indicative of plagioclase have been eliminated from this dataset. The remaining four samples (FK-1336, FK-1707. FK-1832 and FK-1702) yield single populations with MSWD values ranging from 2.24 to 5.60, after the elimination of plagioclase crystals and in the case ofFK-1336 a crystal with a very low radiogenic yield (Figures 2-5 and Table 2).
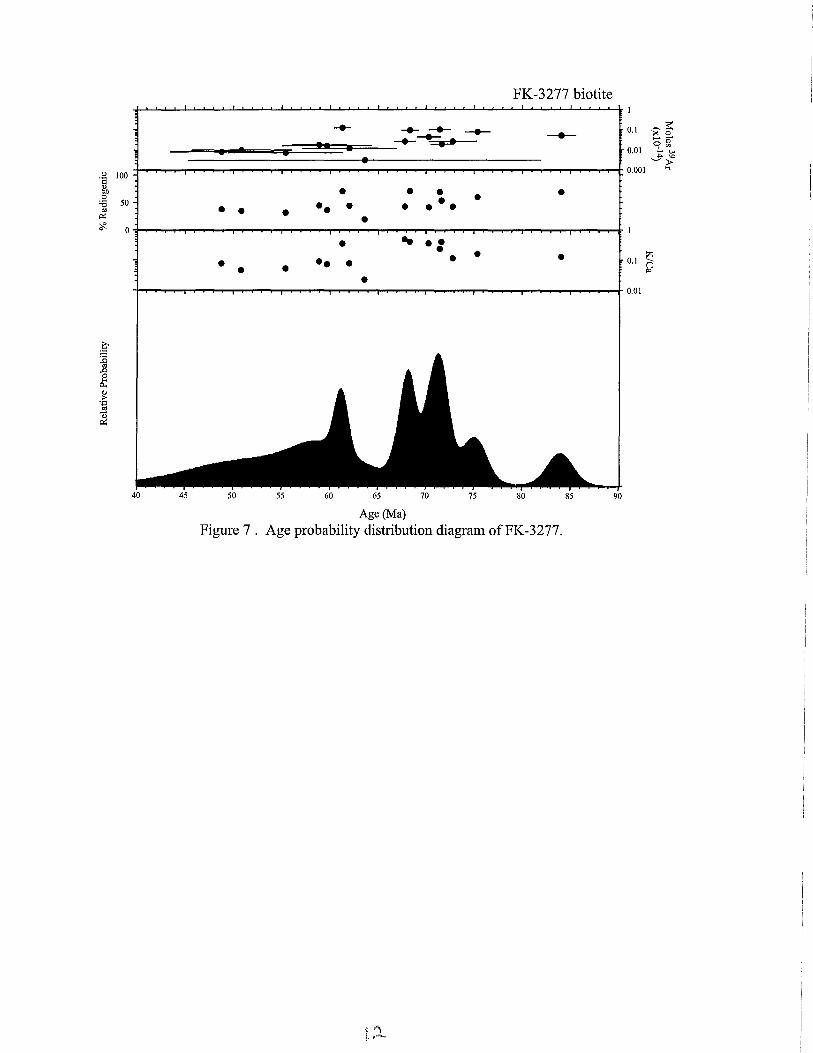
Single crystals of biotite from FK-3062, a dacite dome from the Empire Mountains thought to be correlative in age with Pantano Formation, and FK-3277, a welded, phenocryst-rich rhyolite ash-flow tuff from the intracaldera sequence of the rhyolite ofMt Fagan in the northern Santa Rita Mtns, were step-heated (Tables 3 and 4) with the CO2
laser. The lower power A steps were used to drive off the atmospheric Ar and increase the precision of the B step. The B steps are shown plotted on Figures 6 and 7. All ten analyzed crystals of FK-3062 were used to calculate the weighted mean age of26.59±0.13 Ma. The seventeen crystals ofFK-3277 yield low concentrations of radiogenic 40Ar and ages that range from 48.78±5.07 Ma to 141.01±31.52 Ma. The youngest age (48.78±5.07 Ma) is assigned as a maximum age for this sample.
Two samples of the tuff of Sharp Peak (FO-660, FO-927), and one from the Confidence Peak Tuff (FL-354) are from a succession of Cretaceous volcanic rocks in the southern Roskruge Mountains. After elimination of four sanidine crystals with radiogenic yields less than 90%, sample FO-660 yields one population with a MSWD of 1.43 and a weighted mean age of72.56±0.19 Ma (Figure 8). A rough correlation between increasing radiogenic yields and increasing ages is revealed by the single crystal analyses of sample FO-927, suggesting alteration and accompanying Ar loss (Figure 9). Crystals with radiogenic yields lower than 98% were eliminated from the dataset and a weighted mean age of 72.71±0.27 Ma is calculated for this sample. A weighted mean age of73.07±0.20 Ma is calculated for FL-354 after the elimination of two outliers (Figure 10).
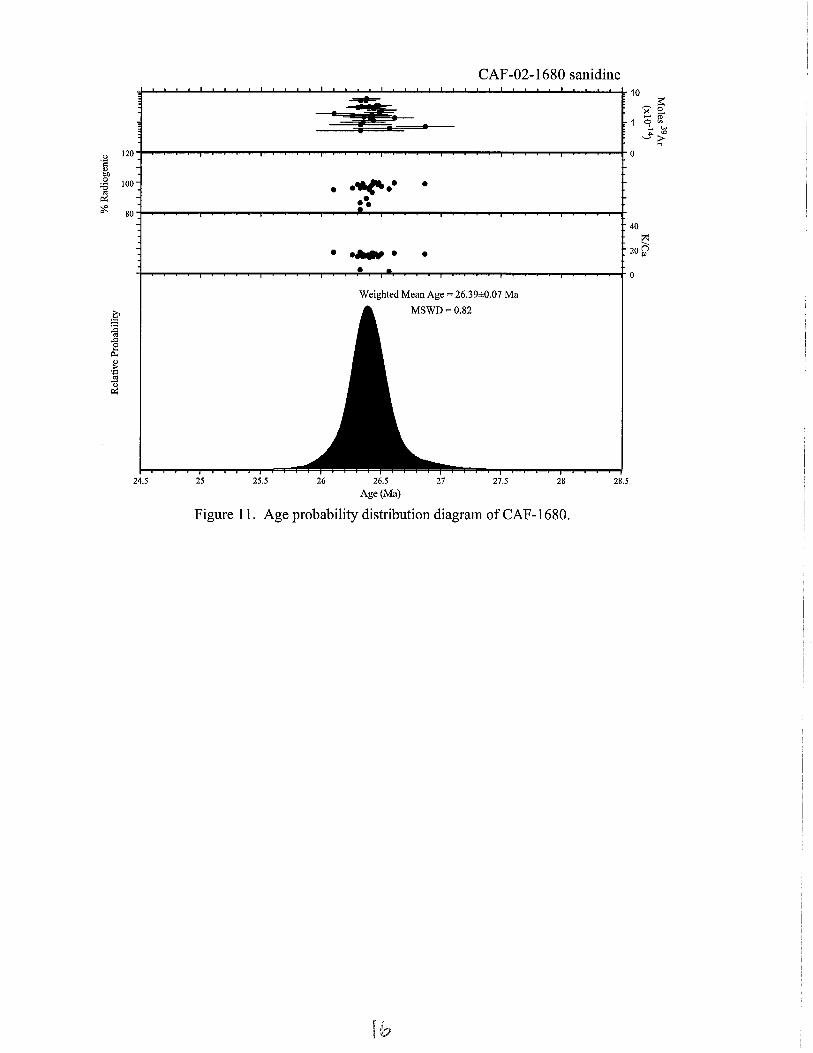
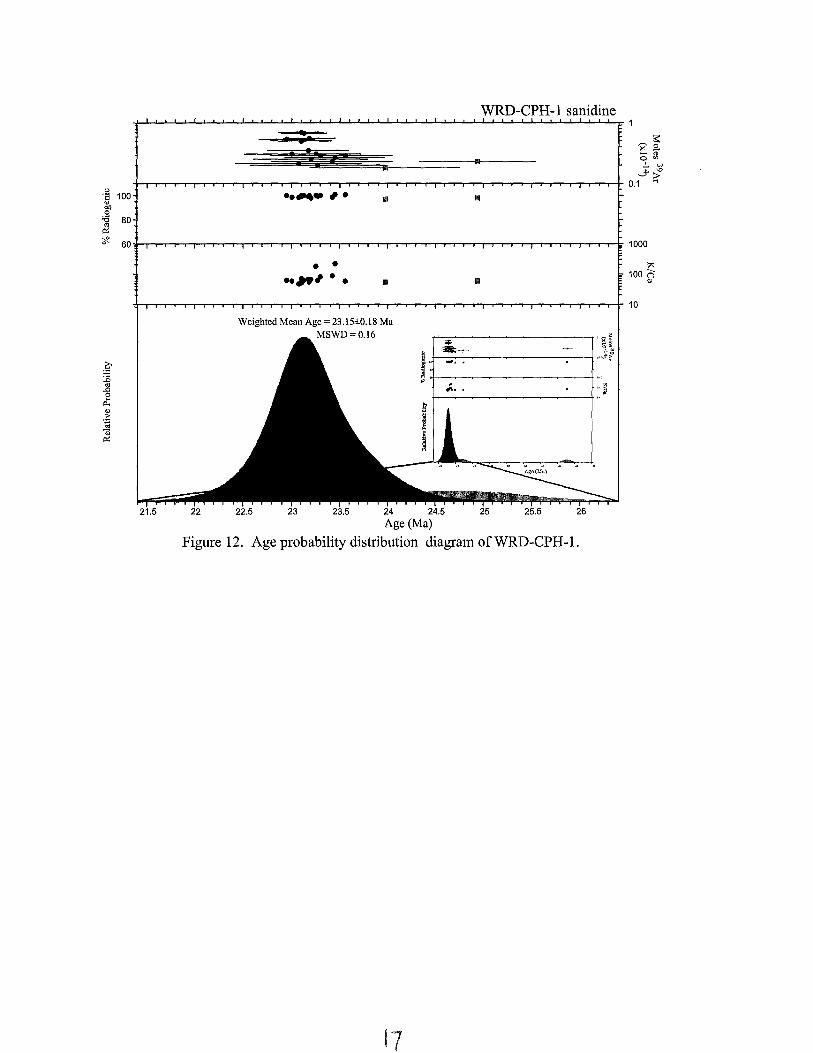
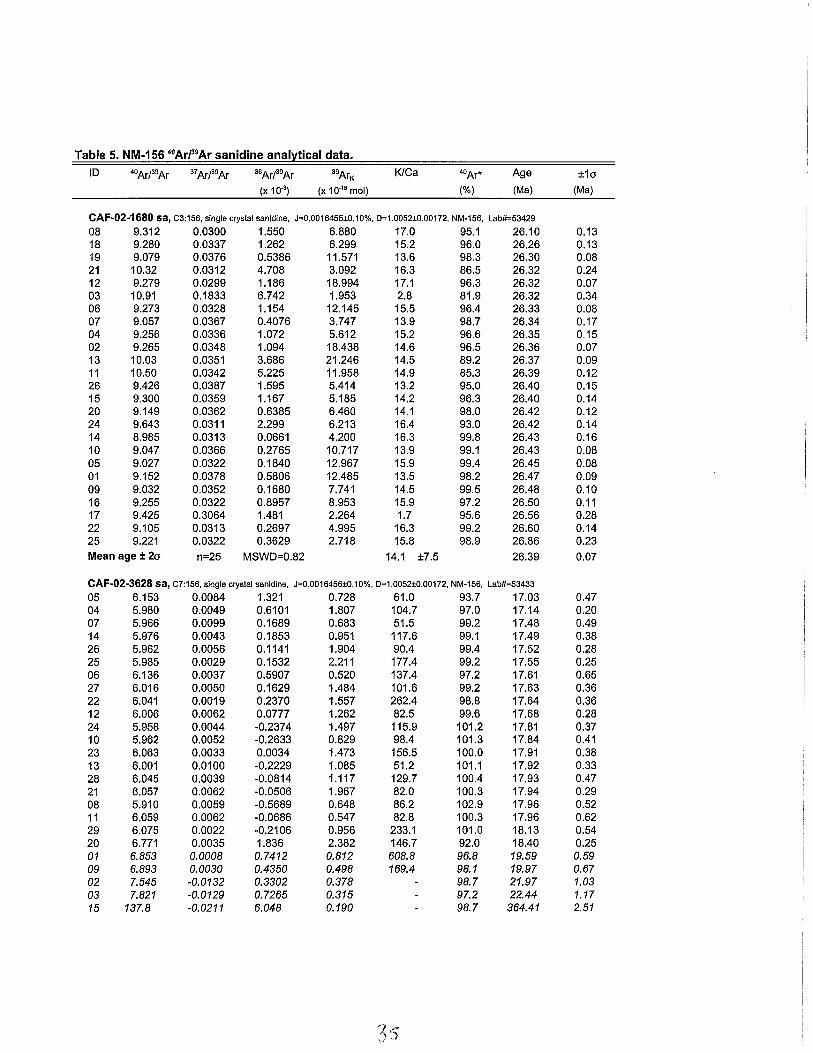
Four of the six samples submitted from the Tortolita Mountains and San Pedro trough area in May 2002 yielded tightly grouped Gaussian distributions (CAF-02-1680, WRD-CPH-l, WRD-CPH-2, and CAF-02-3628, Figures 11-14). Twenty-five sanidine crystals ofCAF-02-1680 were analyzed and used to calculate the weighted mean age of 26.39±0.07 Ma. Xenocrysts were eliminated from the datasets ofWRD-CPH-l, WRD-CPH-2 and CAF-02-3628 before the calculation of the weighted mean ages, 23.15±0.18 Ma, 22.92±0.17 Ma, and 17.69±0.17 Ma respectively. MSWD values for the crystals used to calculate weighted-mean ages for these four samples are low, ranging from 0.16 to 1.16.
Results from two samples from the Black Mountain area, submitted in May 2002, have near Gaussian distributions, but are somewhat less well grouped than results from the four samples described above. One xenocryst was eliminated from the weighted mean calculation for sample T02-715 (26.33±0.10 Ma, MSWD = 2.44). Seven
xenocrystic contaminants were eliminated before the calculation of the weighted mean age for JES-3-26-02-1 (19.68±0.30 Ma, MSWD = 3.18).
Discussion
Five of the six samples from nonwelded tuffs in the upper Pantano Formation in the Cienega Gap area provide precise eruption ages for the tuffs from which they were sampled (FK-1706, 26.52±0.07 Ma; FK-1336, 26.44±0.09 Ma; FK-1707, 27.50±0.09 Ma; FK-1832, 26.46±0.10 Ma; FK-1702, 26.44±0.11 Ma). All of these samples, except FK-1706 and FK-1707, were collected from isolated exposures of what appears to be a single nonwelded tuff unit interbedded with conglomerate and pebbly sandstone of the upper Pantano Formation. Samples FK-1706 and FK-1707 were collected from a sequence of conglomerate in which FK-1707 appears to underlie FK-1706. However, since the two samples are petrographically similar, a fault repeat of the tuffwas also considered a possibility. The analyses show that FK-1707 is from an older tuff. The dacite dome in the nearby Empire Mountains (FK-3062, 26.59±0.13 Ma) is not considered a source for any of the tuffs sampled in the upper Pantano Formation. The sample from the rhyolite ofMt. Fagan in the northern Santa Rita Mountains, FK-3277, contained altered biotite (as suggested by the low radiogenic yields) with a wide range of apparent ages that fail to define a precise eruption age. While the maximum age of 48.78±5.07 Ma assigned to FK-3277 is consistent with know stratigraphic relationships, the age provides no new information.
The ages assigned to the samples from the Roskruge Mountains are consistent with known stratigraphic relationships. Samples FO-660 and FO-927 are both from the tuff of Sharp Peak, and the ages assigned to them agree within error (FO-660, 72.56±0.19 Ma; FO-927, 72.71±0.27 Ma). We suggest that the sanidine from sample FO-660 appears less affected by Ar loss and that it provides both a more precise and accurate age for the Sharp Peak Tuff. The slightly older age assigned the Confidence Peak Tuff (FL-354, 73.07±0.20 Ma) is consistent with its stratigraphic position below the tuff of Sharp Peak. These ages are shown plotted on Figure 18.
All six samples submitted from the Tortolita Mountains, Black Mountain, and San Pedro trough areas in May 2002 provided precise eruption ages. It is noted that the ages assigned to T02-715 and CAF-02-1680 (26.33±0.1O Ma and 26.36±0.07 Ma, respectively) and to WRD-CPH-l and WRD-CPH-2 (23.15±0.18 Ma and 22.92±0.17, Ma respectively) agree within error (Figure 19). It is also noted that the age for the rhyolite ash-flow tuff sampled in the Chief Butte area (CAF-02-1680, 26.36±0.07 Ma) indicates that the volcanic succession in this area is probably significantly older than the widespread Miocene lava field that extends across much of the area to the southwest in the Sawtooth Mts and Samaniego Hills (Ferguson et aI., 1999).
References Cited
Deino, A, and Potts, R., 1990. Single-Crystal 4°Ar;J9 Ar dating of the Olorgesailie Formation, Southern Kenya Rift, J. Geophys. Res., 95, 8453-8470.
Deino, A, and Potts, R, 1992. Age-probability spectra from examination ofsingle-crystaI 4oAr;J9 Ar dating results: Examples from Olorgesailie, Southern Kenya Rift, Quat. International, 13/14,47-53.
Ferguson, C. A, Gilbert, W. G., Klawon, J. E., and Pearthree, P. A, 1999, Geologic map of the Sawtooth Mountains and the north end of West Silver Bell Mountains, Pinal and Pima Counties, Arizona: Arizona Geological Survey Open-file Report 99-16,25 pp., 1:24,000 scale map.
Mahon, KI., 1996. The New "York" regression: Application of an improved statistical method to geochemistry, International Geology Review, 38, 293-303.
Samson, S.D., and, Alexander, B.c., Jr., 1987. Calibration of the interlaboratory 4°Arr Ar dating standard, Mmhb-l, Chern. Geol., 66,27-34.
Steiger, R.H., and Jager, E., 1977. Subcommission on geochronology: Convention on the use of decay constants in geo- and cosmochronology. Earth and Planet. Sci. Lett., 36, 359-362.
Taylor, J.R, 1982. An Introduction to Error Analysis: The Study of Uncertainties in Physical Measurements,. Univ. Sci. Books, Mill Valley, Calif., 270 p.
Table A. 4oArP9Ar laser total-fusion geochronologic data, southeastern Arizona.
Lab Date 2 sigma Field Sample# Sample# Material # crystals (m.y.) uncertainty Description and comments
Tortolita Mountains - Black Mountain area
Nonwelded white tuff interbedded with gently tilted conglomerate and pebbly CAF-02-3628 53433 sanidine 20 17.69 0.17 sandstone on the northwest peidmont of the Tortolita Mountains
Tuff, approximately 10 cm thick, in Coronado Wash about 1.3 km west of east edge of Chief Butte 7 1/2' Quadrangle. Tuff is horizontal (322, 1 degree NE), and like surrounding conglomerate, dips are slightly eastward or nearly horizontal, generally not 2-3 degrees westward like wash floor and Quaternary sediments. Rock avalanche deposits southwest of Black Mountain and just north of dated tuff are at about the same stratigraphic position and are probably tilted similarly. The date on this tuff is here interpreted to approximately date the rock avalanche deposit and movement on the normal fault at the foot of Black Mountain, both of which are thus inferred to be middle
JES-3-26-02-1 53435 sanidine 9 19.68 0.3 Miocene.
Tuff in Hackberry Wash facies of Cloudburst Formation. Tuff lens in distal fan deposits < 1 m thick and < 10m lateral extent. Beside small wash. About 175-200 m above
luJ WRD-CPH-1 53434 sanidine 15 23.15 0.18 depositional base of Cloudburst Formation. (Sample collected by W.R. Dickinson.)
Tuff in Hackberry Wash facies of Cloudburst Formation. About 1 m thick tuff, 100 m extent along strike, in distal fan deposit. Within 10m of depositional base of
Tuff bed that is tilted 70-80 degrees and interbedded with lower Cloudburst Formation, T02-715 53431 sanidine 12 26.33 0.1 southeastern Star Flat area (original sample #TRO-02-0715).
Tuff within volcanic rocks in Chief Butte area, north edge of Tortolita Mountains Quad. Thought to be correlative with tuff in eastern Chief Butte quadrangle and in Star Flat
CAF-02-1680 53429 sanidine 25 26.39 0.07 area on the east side of Black Mountain(T02-715}.
Roskruge Mountains
FO-0660 53080 sanidine 11 72.56 0.19 Tuff of Sharp Peak, north edge of San Pedro Quad
FO-0927 53082 sanidine 6 72.71 0.27 Tuff of Sharp Peak, northeast of Martina Mountain
FL-0354 I 53083 sanidine 12 73.07 0.2 Confidence Peak Tuff, Bell Mountain
Table A. continued. 40 ArP9 Ar laser total-fusion geochronologic data, southeastern Arizona.
Lab Date 2 sigma Field Sample# SampJe# Material # crystals (m.y.) uncertainty Description and comments
Cienega Gap, Empire Mts, Santa Rita Mts.
Younger of two nonwelded tuffs interbedded with conglomerate and pebbly FK-1336 53085 sanidine 12 26.44 0.09 sandstone of the upper Pantano Formation
Younger of two nonwelded tuffs interbedded with conglomerate and pebbly FK-1702 53086 sanidine 9 26.44 0.11 sandstone of the upper Pantano Formation
Younger of two nonwelded tuffs interbedded with conglomerate and pebbly FK-1706 53087 sanidine 9 26.52 0.07 sandstone of the upper Pantano Formation
Older of two nonwelded tuffs interbedded with conglomerate and pebbly FK-1707 53088 sanidine 15 27.5 0.09 sandstone of the upper Pantano Formation
Younger of two nonwelded tuffs interbedded with conglomerate and pebbly FK-1832 53089 sanidine 5 26.46 0.1 sandstone of the upper Pantano Formation
FK-3062 53090 biotite 10 26.59 0.13 Dacitic dome in southern Empire Mountains
FK-3277 53091 biotite - 48.8 5.1 Date from altered biotite in rhyolite of Mt Fagan intracaldera sequence - ~-
Table B. Sample locations Grid
Field Sample# Zone UTME UTMN NAD Quadrangle Date
Tortolita Mountains, Black Mountain, San Pedro trough areas
Figure 15. Age probability distribution diagram ofWRD-CPH-2.
2-D
10 ~ 0>
17.5
•
•
•
18 18.5 19
JES-3-26-02-1 sanidine
• " . Ii •
• ... • • •
• • • • • • • •
Weighted Mean Age = 19.6S±O.30 Ma
19.5
MSWD=3.1S
20
Age (Ma) 20.5 21 21.5 22 22.5
Figure 16. Age probability distribution diagram of JES-3-26-02-1.
2\
80
e: 40 Q
0
FK-3062 • ~al11ple age I
FK-1336
FK-1832
FK-1702 I «I I
FK-1706
FK-1707
25.5 26 26.5 27 27.5 28
sample age (Ma)
Figure 17. Summary of the apparent ages assigned to samples from Cienega Gap and the Empire Mountains.
fit smnp Ie age I
fit FL-354
I-< 1)
"S • ;::::i FO-927 I=l
1) -0..
~ C/)
fit
FO-660
71 71.5 72 72.5 73 73.5 74
sample age (Ma)
Figure 18. Summary of the apparent ages assigned to samples from the Roskruge Mountains.
23
T02-715 • sample age I
CAF-02-1680 • WRD-CPH-I
WRD-CPH-2
JES-3-26-02-1
CAF-023628
16 18 20 22 24 26 28
sample age (Ma)
Figure 19. Summary of the apparent ages assigned to samples from the Tortolita Mountains, Black Mountain, and San Pedro trough areas.
Table 1. Summary of 411 Arf' Ar results and analytical methods
age Sample Unit Location Lab # Irradiation minerai analysis # of crystals Age ±2a comments FK-1706 Santa Rita Mountains 53087 NM-151 sanidine laser lotal fusion 9 26.52 0.07 FK-1336 Sanla Rita Mountains 53085 NM-151 sanidine laser total fusion 7 26.44 0.09 FK-1707 Santa Rita Mountains 53088 NM-151 sanidine laser total fusion 15 27.50 0.09 FK-1832 Santa Rita Mountains 53089 NM-151 sanidine laser total fusion 5 26.46 0.10 FK-1702 Santa Rita Mountains 53086 NM-151 sanidine laser total fusion 9 26.44 O.ll FK-3062 Santa Rita Mountains 53090 NM-151 biotite laser step-heat )0 26.59 0.13 FK-3277 Santa Rita Mountains 53091 NM-151 biotite laser step-heat 48.8 5.1 maximum age, apparent age of youngest crystal FO·660 Roskruge Mountains 53080 NM-151 sanidine laser total fusion 11 72.56 0.19 FO-927 Roskruge Mountains 53082 NM-151 sanidine laser total fusion 6 72.71 0.27 FL-354 Roskruge Mountains 53083 NM-151 sanidine laser total fusion 12 73.07 0.20 CAF-02-1680 53429 NM-156 sanidine laser total fusion 25 26.39 0.07 WRD·CPH-l 53434 NM-156 sanidine laser total fusion 15 23.15 0.18 WRD-CPH-2 53437 NM-156 sanidine laser total fusion 7 22.92 0.17 T02-715 53431 NM-156 sanidine laser total fusion 12 26.33 0.10 JES-3-26-02-1 53435 NM-156 sanidine laser total fusion 9 19.68 0.30 CAF-02-3628 53433 NM-156 sanidine laser lotal fusion 20 17.69 0.17
Sample preparation and irradiation: Sanidine and biotite separated with standard heavy liquid, Franz Magnetic and hand-picking techniques. Samples were loaded into a machined Al disc and irradiated for 7 hours (NM-151) or 15.33 hours (NM-156) in 0-3 position, Nuclear Science Center, College Station, TX. Neutron flux monitor Fish Canyon Tuffsanidine (FC-l). Assigned age = 27.84 Ma (Deino and POlts, 1990) relative to Mmhb-l at 520.4 Mn (Samson and Alexander, 1987).
Instrumentation: Mass Analyzer Products 215-50 mass spectrometer on line with automated aU-metal extraction system. Single crystal sanidine were fused by a 50 watt Synrad CO: laser. Reactive gases removed during a 2 minute reaction with 2 SAES GP-50 getters, 1 operated at .-..450°C and
1 at 20°C. Gas also exposed to a W ftlament operated at ..... 2000°C and a cold finger operated at -140°C. Single cryslal biotite were step-heated by a 50 wall Synrad COl laser. Reactive gases removed during a 5 minute reaction with 2 SAES GP-50 getters, I operated at .-..450°C and
1 at 20°C. Gas also exposed 10 a W filament operated at ..... 2QOODC and a cold finger operated at ~140°C.
Analytical parameters: Electron multiplier sensitivity averaged 1.06 x 10⁻¹~moleslpAfor sanidine and FK~3062 biotite from NM-151, 1.17 x 10⁻¹⁶ moles/pA for FK-3277 biotite from NM~ 151 and 1.29 x 10⁻¹⁶ moles/pA for sanidine from NM-156. Total system blank and background averaged 348,1.3, 0.3,1.1,1.9 x l{tlx moles for sanidine and 908, 7.7, 0.2, 6.1, 3.2 x 10⁻¹⁸ for biotite analyses at masses 40, 39, 38, 37 and 36, respectively. l-factors determined 10 a precision of ± 0.1 % by COl laser-fusion of 4 single crystals from each of 4 radial positions mound Ihe irradiation tray. Correction factors for interfering nuclear reactions were determined using K-glass and CnFl and are as follows:
Notes: Isotopic ratios corrected for blank, radioactive decay, and mass discrimination. not corrected for interferring reactions. Ages calculated ralative to FC-1 Fish Canyon Tuff sanidine interlaboratory standard at 27.84 Ma. Errors quoted for individual analyses include analytical error only, without interferring reaction or J uncertainties. Mean age is weighted mean age ofTaylor (1982). Mean age error is weighted error
of the mean (Taylor. 1982), multiplied by the root of the MSWD where MSWD>1, and also incorporates uncertainty in J factors and irradiation correction uncertainties.
Decay constants and isotopic abundances after Steiger and Jaeger (1977). # symbol preceding sample ID denotes analyses excluded from mean age calculations.
FK·3277 bi, 612:151, single crystal biotite, J=O.0007606±O.10%, D=1.00531±O.00118, NM-151, Lab#=53091-22
A 2 156.8 0.3179 350.0 0.41 1.6 34.1 85.8 71.8 1.6 B 10 97.00 5.970 183.2 0.058 0.085 44.7 100.0 58.8 2.7 Integrated age ± 20
Plateau ± 20 steps A-B
n=2 n=2
MSWD=17.55 0.46
MSWD=17.55 0.46 1.4
70.2
100.0 68.4
FK·3277 bi, 612:151, single crystal biotite, J=O.0007606±O.10%, D=1.00531±O.00118, NM-151, Lab#=53091-39
A 2 172.0 0.2774 413.0 0.40 1.8 29.0 49.2 B 10 76.42 2.148 79.69 0.36 0.24 69.4 100.0 Integrated age ± 20
Plateau ± 20 steps A-B
n=2 n=2
MSWD=5.03 0.76
MSWD=5.03 0.76 1.1 100.0
FK·3277 bi, 612:151, single crystal biotite, J=O.0007606±O.10%, D=1.00531±O.00118, NM-151, Lab#=53091-41
A 2 128.2 0.3820 264.9 0.293 1.3 39.0 88.6 B 10 109.0 11.04 245.9 0.033 0.046 34.2 100.0 Integrated age ± 20
Plateau ± 20 steps A-B
n=2
n=2
MSWD=10.18 0.326 MSWD=10.18 0.326 1.2 100.0
67.3 71.47 69.3
70.5
67.3 50.8 65.6 66.0
2.9 11.5
1.6 0.88 2.0
3.5
1.4 5.0 2.8
8.7
ID Temp
('C)
39ArK K1Ca 40Ar* 39Ar
(x 10.15 mol) (%) (%)
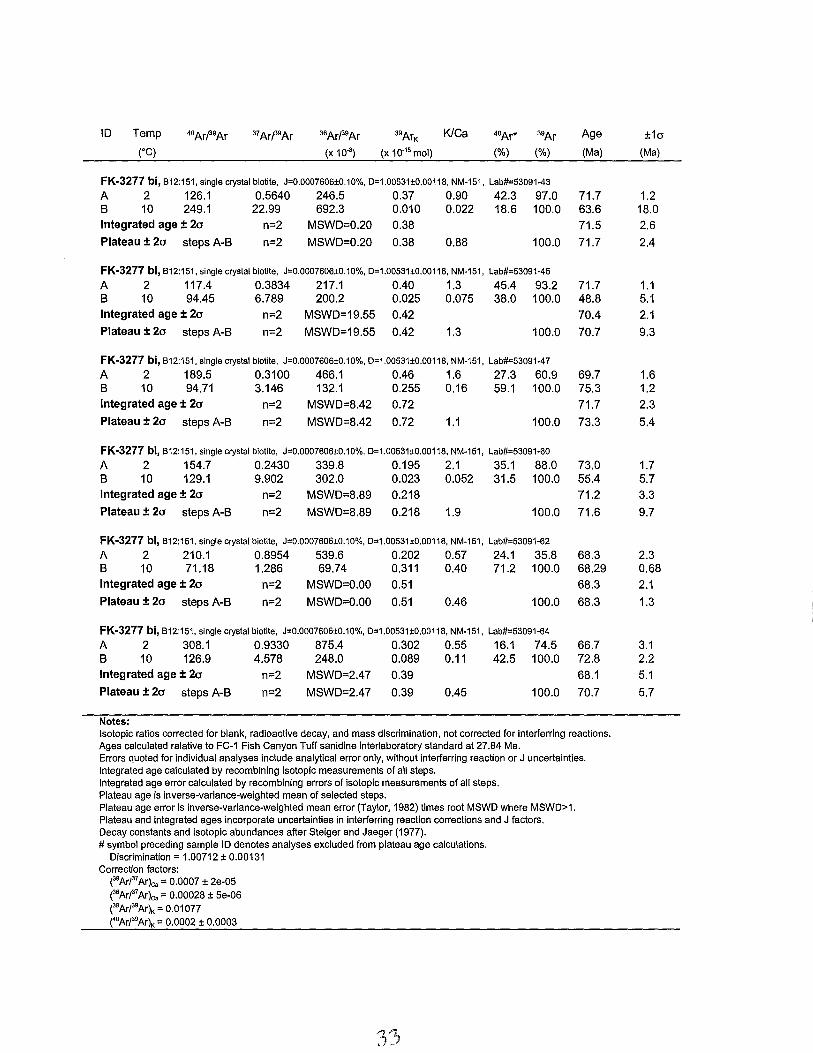
FK-3277 bi, 812:151. single crystal biotite. J=O.0007606±O.10%. D=1.00531±O.00118. NM-151. Lab#=53091-43
A 2 126.1 0.5640 246.5 0.37 0.90 42.3 97.0 B 10 249.1 22.99 692.3 0.010 0.022 18.6 100.0
Age
(Ma)
71.7 63.6 71.5 Integrated age ± 20'
Plateau ± 20 steps A-B
n=2
n=2
MSWD=0.20
MSWD=0.20
0.38
0.38 0.88 100.0 71.7
FK-3277 bi, 812:151. single crystal biotite. J=O.0007606±O.10%. D=1.00531±O.00118. NM-151. Lab#=53091-45
A 2 117.4 0.3834 217.1 0.40 1.3 45.4 93.2 B 10 94.45 6.789 200.2 0.025 0.075 38.0 100.0
MSWD=19.55 0.42
71.7 48.8 70.4 Integrated age ± 20
Plateau ± 20 steps A-B
n=2
n=2 MSWD=19.55 0.42 1.3 100.0 70.7
FK-3277 bi, 812:151. single crystal biotite. J=O.0007606±O.10%. D=1.00531±O.00118. NM-151. Lab#=53091-47
A 2 189.5 0.3100 466.1 0.46 1.6 27.3 60.9 B 10 94.71 3.146 132.1 0.255 0.16 59.1 100.0 Integrated age ± 20
Plateau ± 20 steps A-B
n=2
n=2
MSWD=8.42
MSWD=8.42
0.72
0.72 1.1 100.0
FK-3277 bi, 812:151. single crystal biotite. J=O.0007606±O.10%. D=1.00531±O.00118. NM-151. Lab#=53091-60
A 2 154.7 0.2430 339.8 0.195 2.1 35.1 88.0 B 10 129.1 9.902 302.0 0.023 0.052 31.5 100.0
69.7 75.3
71.7
73.3
73.0 55.4 71.2 Integrated age ± 20'
Plateau ± 20 steps A-B
n=2
n=2
MSWD=8.89
MSWD=8.89
0.218
0.218 1.9 100.0 71.6
FK-3277 bi, 812:151. single crystal biotite. J=O.0007606±O.10%. D=1.00531±O.00118. NM-151. Lab#=53091-62
A 2 210.1 0.8954 539.6 0.202 0.57 24.1 35.8 B 10 71.18 1.286 69.74 0.311 0.40 71.2 100.0 Integrated age ± 20'
Plateau ± 20 steps A-B
n=2
n=2
MSWD=O.OO
MSWD=O.OO
0.51
0.51 0.46 100.0
FK-3277 bi, 812:151. single crystal biotite. J=O.0007606±O.10%. D=1.00531±O.00118. NM-151. Lab#=53091-64
A 2 308.1 0.9330 875.4 0.302 0.55 16.1 74.5 B 10 126.9 4.578 248.0 0.089 0.11 42.5 100.0 Integrated age ± 20
Plateau ± 20 steps A-B
Notes:
n=2
n=2
MSWD=2.47
MSWD=2.47
0.39
0.39 0.45 100.0
68.3 68.29 68.3
68.3
66.7 72.8
68.1
70.7
Isotopic ratios corrected for blank. radioactive decay, and mass discrimination, not corrected for interferring reactions. Ages calculated ralative to FC-1 Fish Canyon Tuff sanidine interlaboratory standard at 27.84 Ma. Errors quoted for individual analyses include analytical error only, without interferring reaction or J uncertainties. Integrated age calculated by recombining isotopic measurements of all steps. Integrated age error calculated by recombining errors of isotopic measurements of all steps. Plateau age is inverse-variance-weighted mean of selected steps. Plateau age error is inverse-variance-weighted mean error (Taylor, 1982) times root MSWD where MSWD>1. Plateau and integrated ages incorporate uncertainties in interferring reaction corrections and J factors. Decay constants and isotopic abundances after Steiger and Jaeger (1977). # symbol preceding sample ID denotes analyses excluded from plateau age calculations.
Notes: Isotopic ratios corrected for blank. radioactive decay, and mass discrimination, not corrected for interferring reactions. Ages calculated ralative to FC-1 Fish Canyon Tuff sanidine interlaboratory standard at 27.84 Ma. Errors quoted for individual analyses include analytical error only, without interferring reaction or J uncertainties. Mean age is weighted mean age of Taylor (1982). Mean age error is weighted error
of the mean (Taylor, 1982), multiplied by the root of the MSWD where MSWD>1, and also incorporates uncertainty in J factors and irradiation correction uncertainties.
Decay constants and isotopic abundances after Steiger and Jaeger (1977). # symbol preceding sample ID denotes analyses excluded from mean age calculations.
Mean age ± 20' n=14 MSWO=2.44 13.8 ±6.9 26.33 0.10
Notes: Isotopic ratios corrected for blank, radioactive decay, and mass discrimination, not corrected for interferring reactions. Ages calculated ralative to FC-1 Fish Canyon Tuff sanidine interlaboratory standard at 27.84 Ma. Errors quoted for individual analyses include analytical error only, without interferring reaction or J uncertainties. Mean age is weighted mean age of Taylor (1982). Mean age error is weighted error
of the mean (Taylor, 1982), multiplied by the root of the MSWD where MSWD>1, and also incorporates uncertainty in J factors and irradiation correction uncertainties.
Decay constants and isotopic abundances after Steiger and Jaeger (1977). # symbol preceding sample ID denotes analyses excluded from mean age calculations.
Procedures of the New Mexico Geochronology Research Laboratory
For the Period June 1998 - present
Matthew Heizler William C. McIntosh Richard Esser Lisa Peters
4°ArP9 Ar and K-Ar dating
Often, large bulk samples (either minerals or whole rocks) are required for K-Ar dating
and even small amounts ofxenocrystic, authigenic, or other non-ideal behavior can lead to
inaccuracy. The K-Ar technique is susceptible to sample inhomogeneity as separate aliquots are
required for the potassium and argon determinations. The need to determine absolute quantities
(i.e. moles of 4°Ar* and 4°K) limits the precision of the K-Ar method to approximately 1% and
also, the technique provides limited potential to evaluate underlying assumptions. In the 40 Ar/39 Ar
variant of the K-Ar technique, a sample is irradiated with fast neutrons thereby converting 39K to
39 Ar through a (n,p) reaction. Following irradiation, the sample is either fused or incrementally
heated and the gas analyzed in the same manner as in the conventional K-Ar procedure, with one
exception, no argon spike need be added.
Some of the advantages of the 4°ArP9 Ar method over the conventional K-Ar technique are:
1. A single analysis is conducted on one aliquot of sample thereby reducing the sample size and eliminating sample inhomogeneity.
2. Analytical error incurred in determining absolute abundances is reduced by measuring only isotopic ratios. This also eliminates the need to know the exact weight of the sample.
3. The addition of an argon spike is not necessary. 4. The sample does not need to be completely fused, but rather can be incrementally heated.
The 40 Arr Ar ratio (age) can be measured for each fraction of argon released and this allows for the generation of an age spectrum.
The age of a sample as determined with the 40 ArP9 Ar method requires comparison of the
measured 40 ArP9 Ar ratio with that of a standard of known age. Also, several isotopes of other
elements (Ca, K, CI, Ar) produce argon during the irradiation procedure and must be corrected
for. Far more in-depth details of the determination of an apparent age via the 4°ArP9 Ar method
are given in Dalrymple et al. (1981) and McDougall and Harrison (1988).
2
Analytical techniques
Sample Preparation and irradiation details
Mineral separates are obtained in various fashions depending upon the mineral of
interest, rock type and grain size. In almost all cases the sample is crushed in a jaw crusher and
ground in a disc grinder and then sized. The size fraction used generally corresponds to the
largest size possible which will permit obtaining a pure mineral separate. Following sizing, the
sample is washed and dried. For plutonic and metamorphic rocks and lavas, crystals are
separated using standard heavy liquid, Franz magnetic and hand-picking techniques. For
volcanic sanidine and plagioclase, the sized sample is reacted with 15% HF acid to remove glass
andlor matrix and then thoroughly washed prior to heavy liquid and magnetic separation. For
groundmass concentrates, rock fragments are selected which do not contain any visible
phenocrysts.
The NMGRL uses either the Ford reactor at the University of Michigan or the Nuclear
Science Center reactor at Texas A&M University. At the Ford reactor, the L67 position is used
(unless otherwise noted) and the D-3 position is always used at the Texas A&M reactor. All of
the Michigan irradiations are carried out underwater without any shielding for thermal neutrons,
whereas the Texas irradiations are in a dry location which is shielded with B and Cd. Depending
upon the reactor used, the mineral separates are loaded into either holes drilled into Al discs or
into 6 mm I.D. quartz tubes. Various Al discs are used. For Michigan, either six hole or twelve
hole, 1 cm diameter discs are used and all holes are of equal size. Samples are placed in the 0,
120 and 240° locations and standards in the 60, 180 and 300° locations for the six hole disc. For
the twelve hole disc, samples are located at 30,60, 120, 150,210,240,300, and 330° and
standards at 0, 90, 180 and 270 degrees. If samples are loaded into the quartz tubes, they are
wrapped in Cu foil with standards interleaved at -0.5 cm intervals. For Texas, 2.4 cm diameter
discs contain either sixteen or six sample holes with smaller holes used to hold the standards. For
the six hole disc, sample locations are 30, 90, 150,210,270 and 330° and standards are at 0,60,
120, 180,240 and 300°. Samples are located at 18, 36, 54, 72, 108, 126, 144, 162, 198,216,234,
252, 288, 306, 324, 342 degrees and standards at 0, 90, 180 and 270 degrees in the sixteen hole
disc. Following sample loading into the discs, the discs are stacked, screwed together and sealed
3
in vacuo in either quartz (Michigan) or Pyrex (Texas) tubes.
Extraction Line and Mass Spectrometer details
The NMGRL argon extraction line has both a double vacuum Mo resistance furnace and
a CO2 laser to heat samples. The Mo furnace crucible is heated with a W heating element and the
temperature is monitored with a W-Re thermocouple placed in a hole drilled into the bottom of
the crucible. A one inch long Mo liner is placed in the bottom of the crucible to collect the
melted samples. The furnace temperature is calibrated by either/or melting Cu foil or with an
additional thermocouple inserted in the top of the furnace down to the liner. The CO2 laser is a
Synrad lOW laser equipped with a He-Ne pointing laser. The laser chamber is constructed from a
3 3/8" stainless steel conflat and the window material is ZnS. The extraction line is a two stage
design. The first stage is equipped with a SAES GP-50 getter, whereas the second stage houses
two SAES GP-50 getters and a tungsten filament. The first stage getter is operated at 450°C as is
one of the second stage getters. The other second stage getter is operated at room temperature
and the tungsten filament is operated at ~2000°C. Gases evolved from samples heated in the
furnace are reacted with the first stage getter during heating. Following heating, the gas is
expanded into the second stage for two minutes and then isolated from the first stage. During
second stage cleaning, the first stage and furnace are pumped out. After gettering in the second
stage, the gas is expanded into the mass spectrometer. Gases evolved from samples heated in the
laser are expanded through a cold finger operated at -140°C and directly into the second stage.
Following cleanup, the gas in the second stage and laser chamber is expanded into the mass
spectrometer for analysis.
The NMGRL employs a MAP-215-50 mass spectrometer which is operated in static
mode. The mass spectrometer is operated with a resolution ranging between 450 to 600 at mass
40 and isotopes are detected on a Johnston electron multiplier operated at ~2.1 kV with an
overall gain of about 10,000 over the Faraday collector. Final isotopic intensities are determined
by linear regression to time zero of the peak height versus time following gas introduction for
each mass. Each mass intensity is corrected for mass spectrometer baseline and background and
the extraction system blank.
Blanks for the furnace are generally determined at the beginning of a run while the
furnace is cold and then between heating steps while the furnace is cooling. Typically, a blank is
4
run every three to six heating steps. Periodic furnace hot blank analysis reveals that the cold
blank is equivalent to the hot blank for temperatures less than about 1300°C. Laser system
blanks are generally determined between every four analyses. Mass discrimination is measured
using atmospheric argon which has been dried using a Ti-sublimation pump. Typically, 10 to 15
replicate air analyses are measured to determine a mean mass discrimination value. Air pipette
analyses are generally conducted 2-3 times per month, but more often when samples sensitive to
the mass discrimination value are analyzed. Correction factors for interfering nuclear reactions
on K and Ca are determined using K-glass and CaF2, respectively. Typically, 3-5 individual
pieces of the salt or glass are fused with the CO2 laser and the correction factors are calculated
from the weighted mean of the individual determinations.
Data acquisition, presentation and age calculation
Samples are either step-heated or fused in a single increment (total fusion). Bulk samples
are often step-heated and the data are generally displayed on an age spectrum or isochron
diagram. Single crystals are often analyzed by the total fusion method and the results are
typically displayed on probability distribution diagrams or isochron diagrams.
The Age Spectrum Diagram
Age spectra plot apparent age of each incrementally heated gas fraction versus the
cumulative % 39 ArK released, with steps increasing in temperature from left to right. Each
apparent age is calculated assuming that the trapped argon (argon not produced by in situ decay
of4°K) has the modern day atmospheric 4°ArP6Ar value of 295.5. Additional parameters for
each heating step are often plotted versus the cumulative %39 ArK released. These auxiliary
parameters can aid age spectra interpretation and may include radiogenic yield (percent of4°Ar
which is not atmospheric), K/Ca (determined from measured Ca-derived 37 Ar and K-derived
39 Ar) and/or K/Cl (determined from measured Cl-derived 38Ar and K-derived 39 Ar). Incremental
heating analysis is often effective at revealing complex argon systematics related to excess
argon, alteration, contamination, 39 Ar recoil, argon loss, etc. Often low-temperature heating
steps have low radiogenic yields and apparent ages with relatively high errors due mainly to
5
loosely held, non-radiogenic argon residing on grain surfaces or along grain boundaries. An
entirely or partially flat spectrum, in which apparent ages are the same within analytical error,
may indicate that the sample is homogeneous with respect to K and Ar and has had a simple
thermal and geological history. A drawback to the age spectrum technique is encountered when
hydrous minerals such as micas and amphiboles are analyzed. These minerals are not stable in
the ultra-high vacuum extraction system and thus step-heating can homogenize important details
of the true 40 Ar distribution. In other words, a flat age spectrum may result even if a hydrous
sample has a complex argon distribution.
The Isochron Diagram
Argon data can be plotted on isotope correlation diagrams to help assess the isotopic
composition of Ar trapped at the time of argon closure, thereby testing the assumption that
trapped argon isotopes have the composition of modern atmosphere which is implicit in age
spectra. To construct an "inverse isochron" the 36Ar/40Ar ratio is plotted versus the 39 Ar/4°Ar ratio.
A best fit line can be calculated for the data array which yields the value for the trapped argon
(Y-axis intercept) and the 4°Ar*/39 ArK value (age) from the X-axis intercept. Isochron analysis is
most useful for step-heated or total fusion data which have a significant spread in radiogenic
yield. For young or low K samples, the calculated apparent age can be very sensitive to the
composition of the trapped argon and therefore isochron analysis should be preformed routinely
on these samples (cf. Heizler and Harrison, 1988). For very old (>Mesozoic) samples or
relatively old sanidines (>mid-Cenozoic) the data are often highly radiogenic and cluster near the
X-axis thereby making isochron analysis oflittle value.
6
The Probability Distribution Diagram
The probability distribution diagram, which is sometimes referred to as an ideogram, is a
plot of apparent age versus the summation of the normal distribution of each individual analysis
(Deino and Potts, 1992). This diagram is most effective at displaying single crystal laser fusion
data to assess the distribution of the population. The KlCa, radiogenic yield, and the moles of
39 Ar for each analysis are also often displayed for each sample as this allows for visual ease in
identifying apparent age correlations between, for instance, plagioclase contamination, signal
size and/or radiogenic concentrations. The error (1cr) for each age analysis is generally shown by
the horizontal lines in the moles of 39 Ar section. Solid symbols represent the analyses used for
the weighted mean age calculation and the generation of the solid line on the ideogram, whereas
open symbols represent data omitted from the age calculation. If shown, a dashed line represents
the probability distribution of all of the displayed data. The diagram is most effective for
displaying the form of the age distribution (i.e. gaussian, skewed, etc.) and for identifying
xenocrystic or other grains which fall outside of the main population.
Error Calculations
For step-heated samples, a plateau for the age spectrum is defined by the steps indicated.
The plateau age is calculated by weighting each step on the plateau by the inverse of the variance
and the error is calculated by either the method of Samson and Alexander (1987) or Taylor
(1982). A mean sum weighted deviates (MSWD) value is determined by dividing the Chi
squared value by n-l degrees of freedom for the plateau ages. If the MSWD value is outside the
95% confidence window (cf. Mahon, 1996; Table 1), the plateau or preferred age error is
multiplied by the square root of the MSWD.
For single crystal fusion data, a weighted mean is calculated using the inverse of the
variance to weight each age determination (Taylor, 1982). Errors are calculated as described for
the plateau ages above.
Isochron ages, 40 ArP6 Ari values and MSWD values are calculated from the regression
results obtained by the York (1969) method.
7
References cited
Dalrymple, G.B., Alexander, E.C., Jr., Lanphere, M.A., and Kraker, G.P., 1981. Irradiation of
samples for 4°Ar/39 Ar dating using the Geological Survey TRIGA reactor. U.S.G.S., Prof.
Paper, 1176.
Deino, A., and Potts, R., 1990. Single-Crystal 4°ArP9 Ar dating of the Olorgesailie Formation,
Southern Kenya Rift, I Geophys. Res., 95, 8453-8470.
Deino, A., and Potts, R, 1992. Age-probability spectra from examination of single-crystal
40 Ar/39 Ar dating results: Examples from Olorgesailie, Southern Kenya Rift, Quat.
International, 13114,47-53.
Fleck, RI, Sutter, J.F., and Elliot, D.H., 1977. Interpretation of discordant 4°ArP9 Ar age-spectra
of Mesozoic tholieiites from Antarctica, Geochim. Cosmochim. Acta, 41, 15-32.
Heizler, M. T., and Harrison, T. M., 1988. Multiple trapped argon components revealed by
4°Arr Ar analysis, Geochim. Cosmochim. Acta, 52, 295-1303.
Mahon, KI., 1996. The New "York" regression: Application of an improved statistical method
to geochemistry, International Geology Review, 38, 293-303.
McDougall, I., and Harrison, T.M., 1988. Geochronology and thermo chronology by the 4°Ar_
39 Ar method. Oxford University Press.
Samson, S.D., and, Alexander, E.C., Jr., 1987. Calibration of the interlaboratory 4°Ar/39 Ar dating
standard, Mmhb-l, Chern. Geol., 66, 27-34.
Steiger, RH., and Jager, E., 1977. Subcommission on geochronology: Convention on the use of
decay constants in geo- and cosmochronology. Earth and Planet. Sci. Lett., 36, 359-362.
Taylor, IR., 1982. An Introduction to Error Analysis: The Study of Uncertainties in Physical
Measurements,. Univ. Sci. Books, Mill Valley, Calif., 270 p.
York, D., 1969. Least squares fitting of a straight line with correlated errors, Earth and Planet.