Sixth Grade Spiraling Review Week 1 of Fifth Six Weeks
Advanced Preparation: Spiraling Review Cards (See Sixth Grade 3rd Six Weeks Spiraling Review – 2 sheets per table group exclude the decimal)
Note: Record all work in your math journal.
Day 1
Spiraling review cards
Each table group will need a deck of Spiraling Review Cards. a) Draw two cards and arrange the cards to create an improper fraction. b) Transform each improper fraction to a mixed number. c) Order the mixed numbers from greatest to least.
Example: 3
5 = 1
3
2 5 ÷ 3 = 1 with a remainder of 2 = 1
3
2
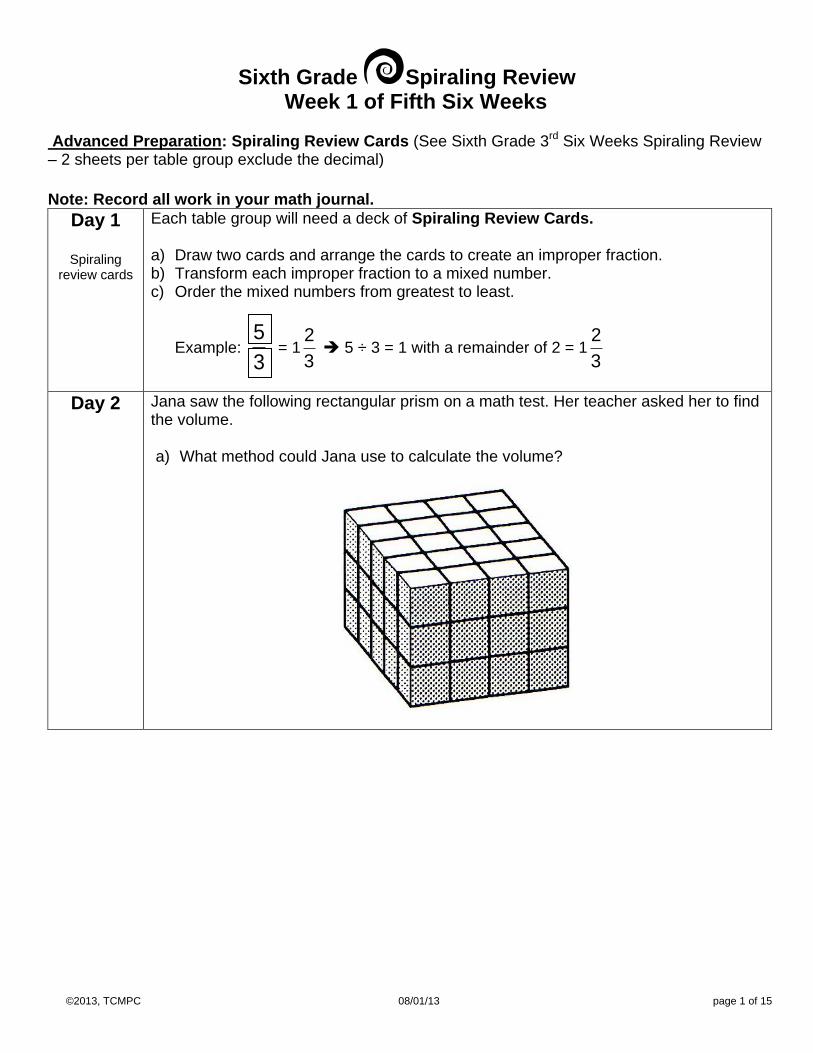
Day 2 Jana saw the following rectangular prism on a math test. Her teacher asked her to find the volume. a) What method could Jana use to calculate the volume?
Sixth Grade Spiraling Review Week 1 of Fifth Six Weeks (cont.)
Note: Record all work in your math journal.
Day 3
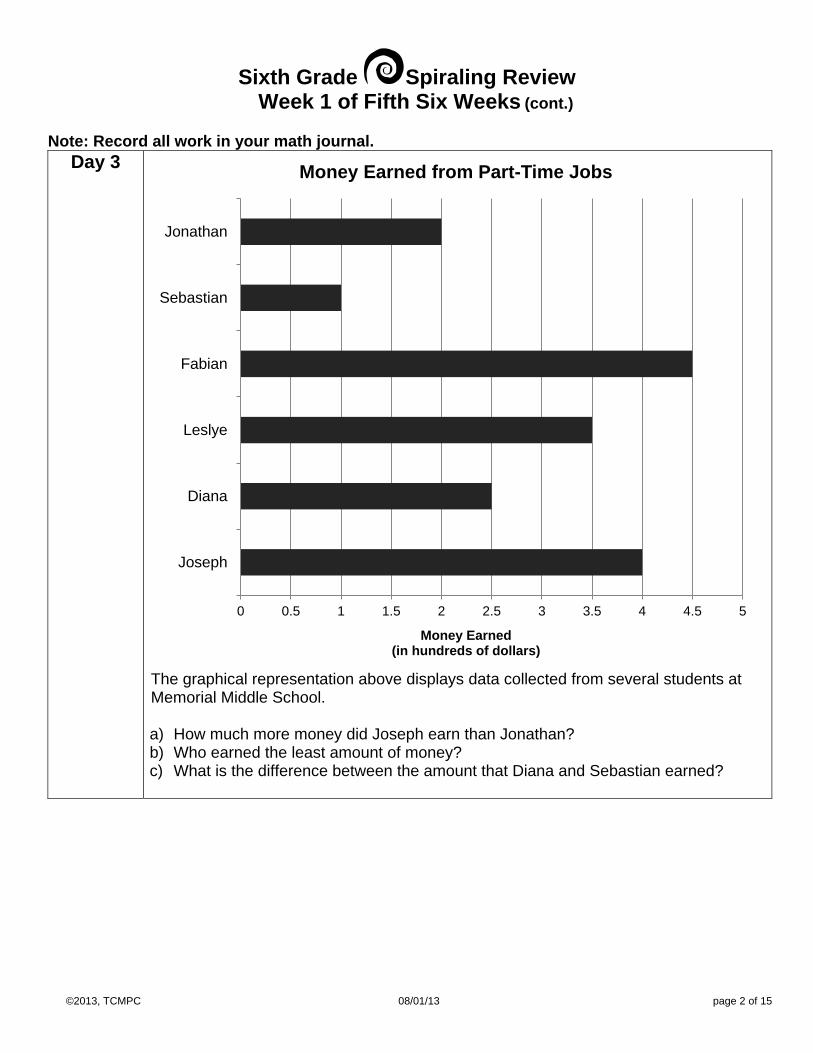
The graphical representation above displays data collected from several students at Memorial Middle School. a) How much more money did Joseph earn than Jonathan? b) Who earned the least amount of money? c) What is the difference between the amount that Diana and Sebastian earned?
Sixth Grade Spiraling Review Week 1 of Fifth Six Weeks (cont.)
Note: Record all work in your math journal.
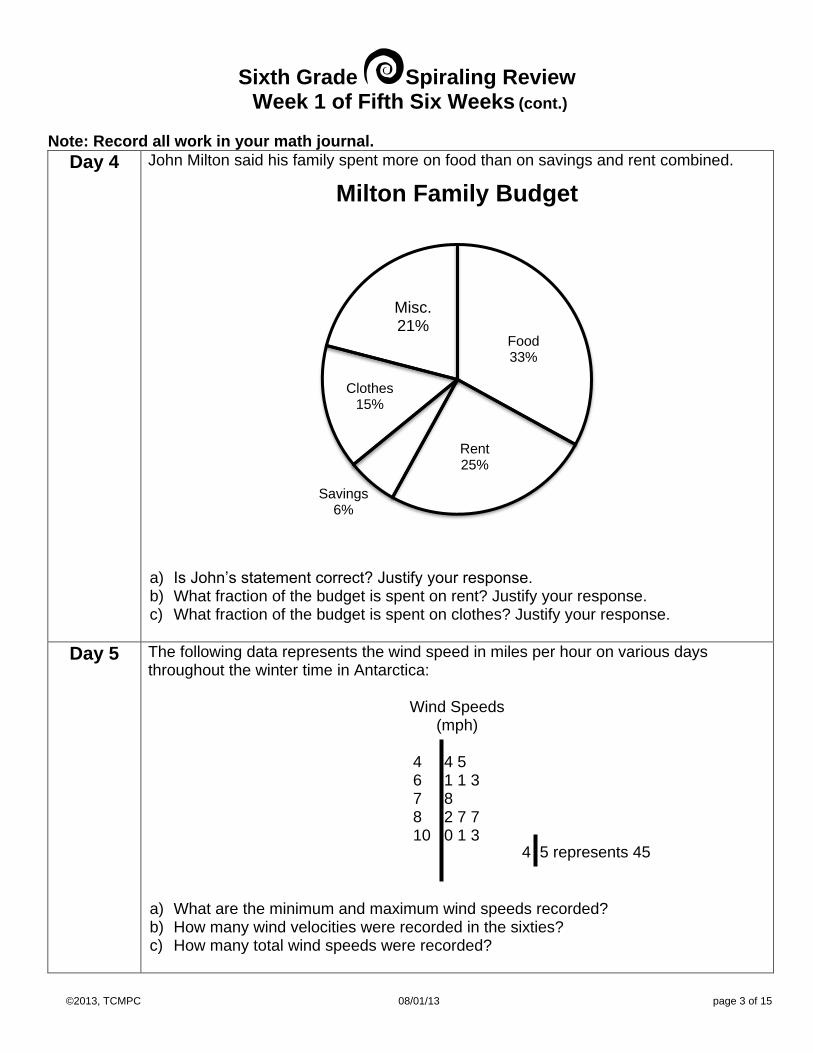
Day 4 John Milton said his family spent more on food than on savings and rent combined.
a) Is John’s statement correct? Justify your response. b) What fraction of the budget is spent on rent? Justify your response. c) What fraction of the budget is spent on clothes? Justify your response.
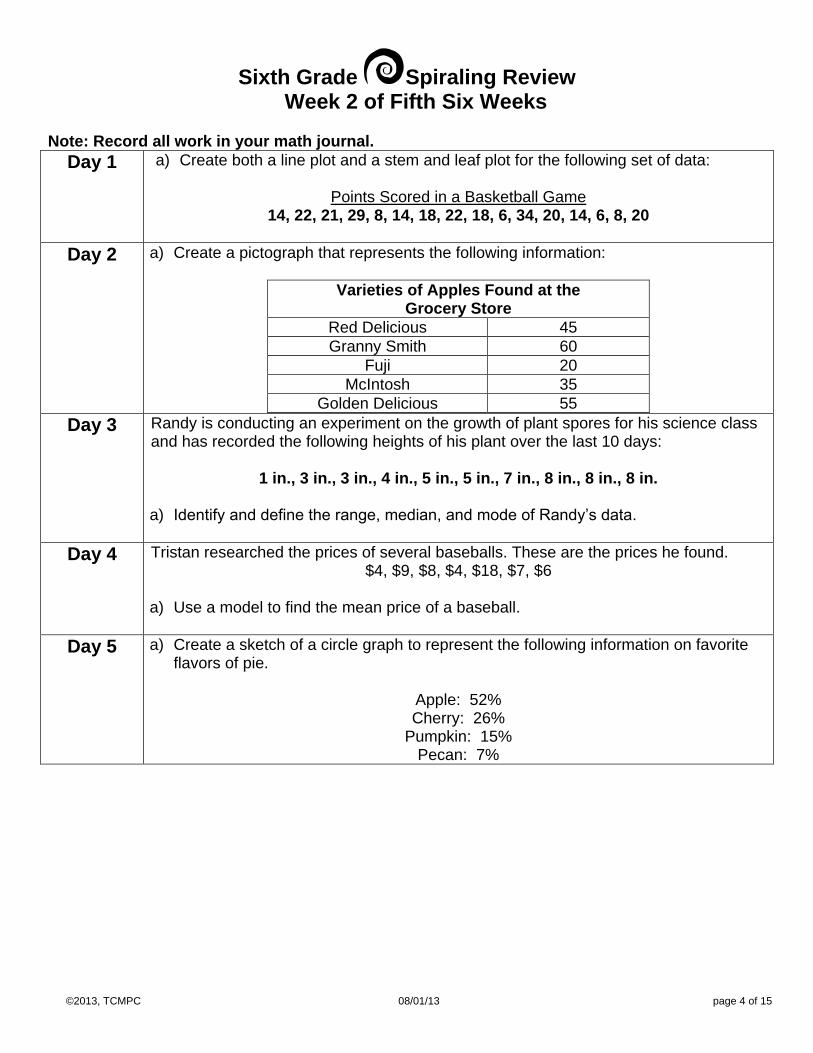
Day 5 The following data represents the wind speed in miles per hour on various days throughout the winter time in Antarctica:
Wind Speeds (mph)
4 4 5 6 1 1 3 7 8 8 2 7 7 10 0 1 3
a) What are the minimum and maximum wind speeds recorded? b) How many wind velocities were recorded in the sixties? c) How many total wind speeds were recorded?
Sixth Grade Spiraling Review Week 2 of Fifth Six Weeks
Note: Record all work in your math journal.
Day 1 a) Create both a line plot and a stem and leaf plot for the following set of data:
Points Scored in a Basketball Game 14, 22, 21, 29, 8, 14, 18, 22, 18, 6, 34, 20, 14, 6, 8, 20
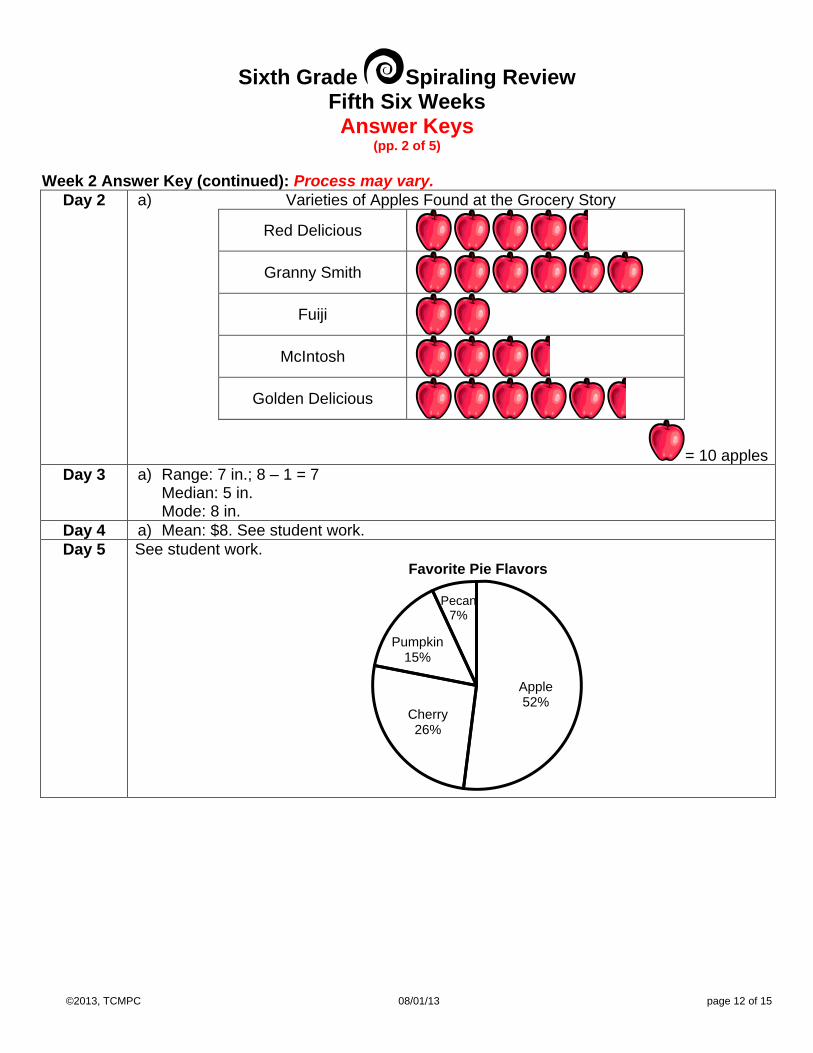
Day 2 a) Create a pictograph that represents the following information:
Varieties of Apples Found at the Grocery Store
Red Delicious 45
Granny Smith 60
Fuji 20
McIntosh 35
Golden Delicious 55
Day 3 Randy is conducting an experiment on the growth of plant spores for his science class and has recorded the following heights of his plant over the last 10 days:
Sixth Grade Spiraling Review Week 3 of Fifth Six Weeks
Note: Record all work in your math journal.
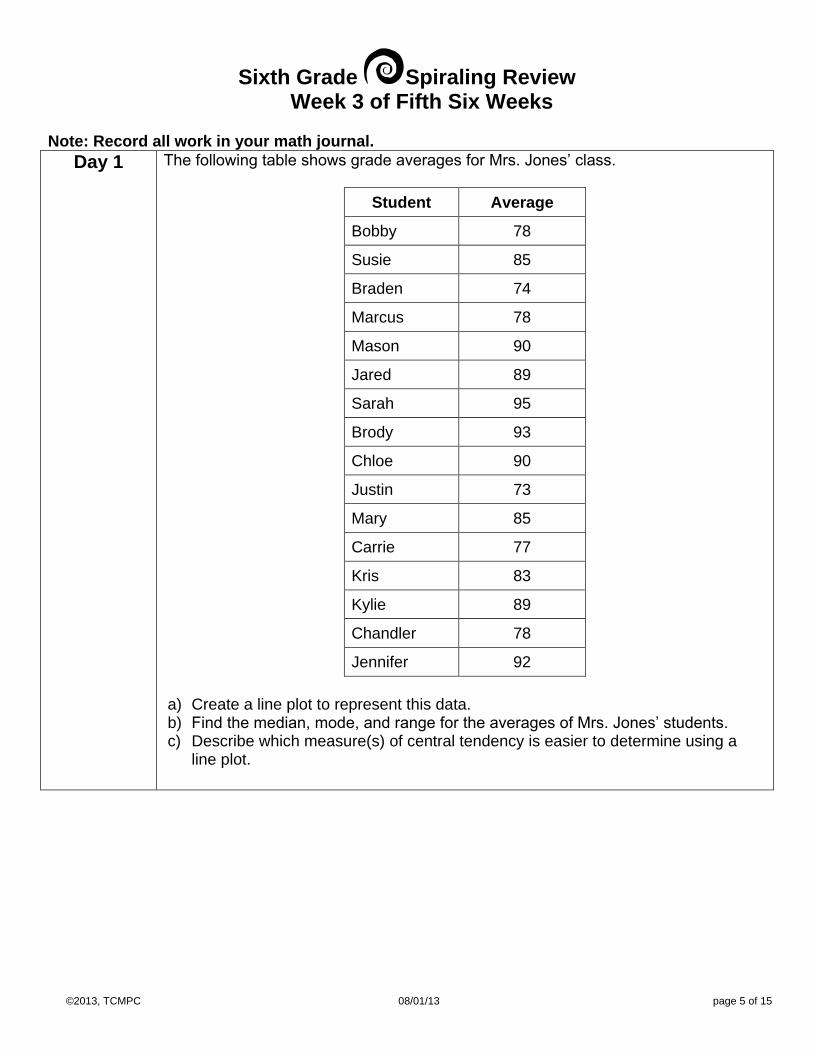
Day 1 The following table shows grade averages for Mrs. Jones’ class.
Student Average
Bobby 78
Susie 85
Braden 74
Marcus 78
Mason 90
Jared 89
Sarah 95
Brody 93
Chloe 90
Justin 73
Mary 85
Carrie 77
Kris 83
Kylie 89
Chandler 78
Jennifer 92
a) Create a line plot to represent this data. b) Find the median, mode, and range for the averages of Mrs. Jones’ students. c) Describe which measure(s) of central tendency is easier to determine using a
Sixth Grade Spiraling Review Week 3 of Fifth Six Weeks (cont.)
Note: Record all work in your math journal.
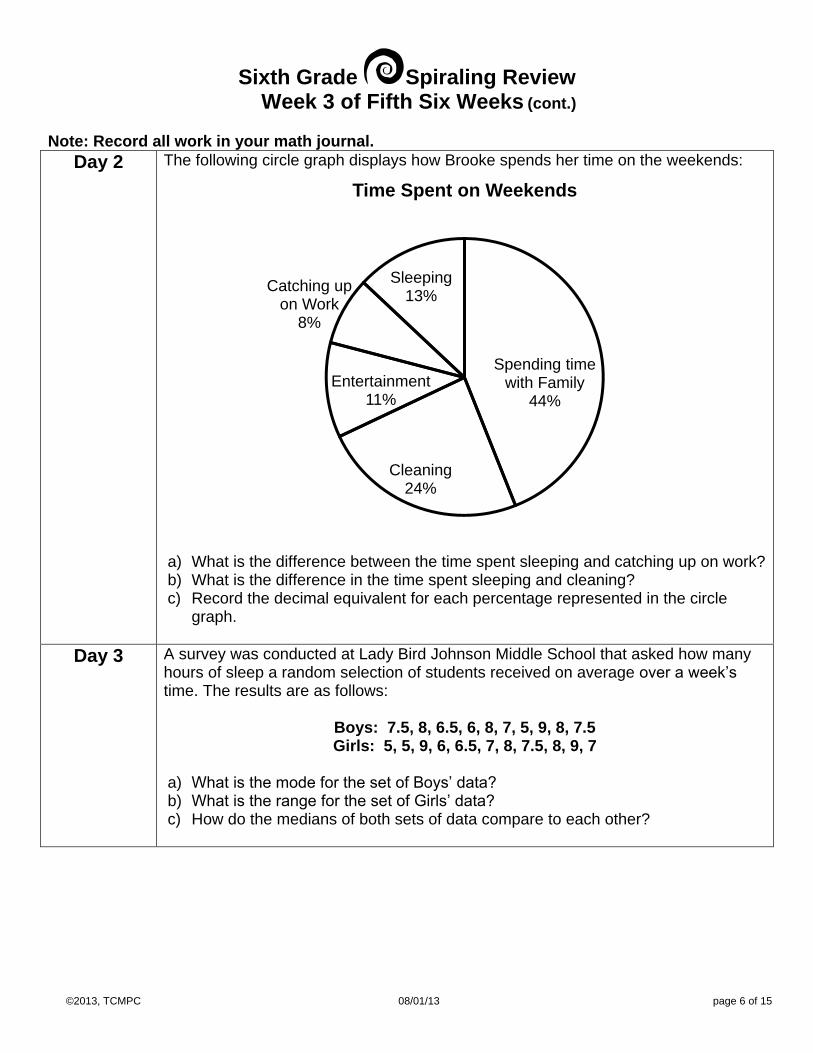
Day 2 The following circle graph displays how Brooke spends her time on the weekends:
a) What is the difference between the time spent sleeping and catching up on work? b) What is the difference in the time spent sleeping and cleaning? c) Record the decimal equivalent for each percentage represented in the circle
graph.
Day 3 A survey was conducted at Lady Bird Johnson Middle School that asked how many hours of sleep a random selection of students received on average over a week’s time. The results are as follows:
a) What is the mode for the set of Boys’ data? b) What is the range for the set of Girls’ data? c) How do the medians of both sets of data compare to each other?
Sixth Grade Spiraling Review Week 3 of Fifth Six Weeks (cont.)
Note: Record all work in your math journal.
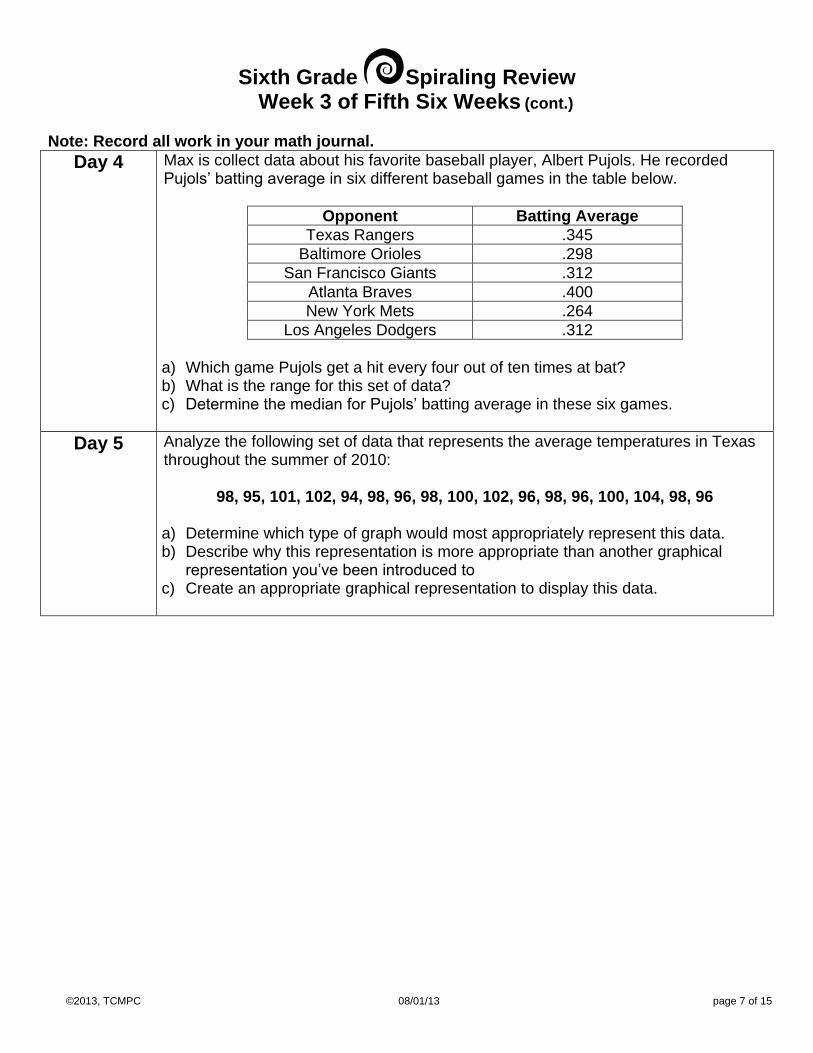
Day 4 Max is collect data about his favorite baseball player, Albert Pujols. He recorded Pujols’ batting average in six different baseball games in the table below.
Opponent Batting Average
Texas Rangers .345
Baltimore Orioles .298
San Francisco Giants .312
Atlanta Braves .400
New York Mets .264
Los Angeles Dodgers .312
a) Which game Pujols get a hit every four out of ten times at bat? b) What is the range for this set of data? c) Determine the median for Pujols’ batting average in these six games.
Day 5
Analyze the following set of data that represents the average temperatures in Texas throughout the summer of 2010:
98, 95, 101, 102, 94, 98, 96, 98, 100, 102, 96, 98, 96, 100, 104, 98, 96 a) Determine which type of graph would most appropriately represent this data. b) Describe why this representation is more appropriate than another graphical
representation you’ve been introduced to c) Create an appropriate graphical representation to display this data.
Sixth Grade Spiraling Review Week 4 of Fifth Six Weeks
Note: Record all work in your math journal.
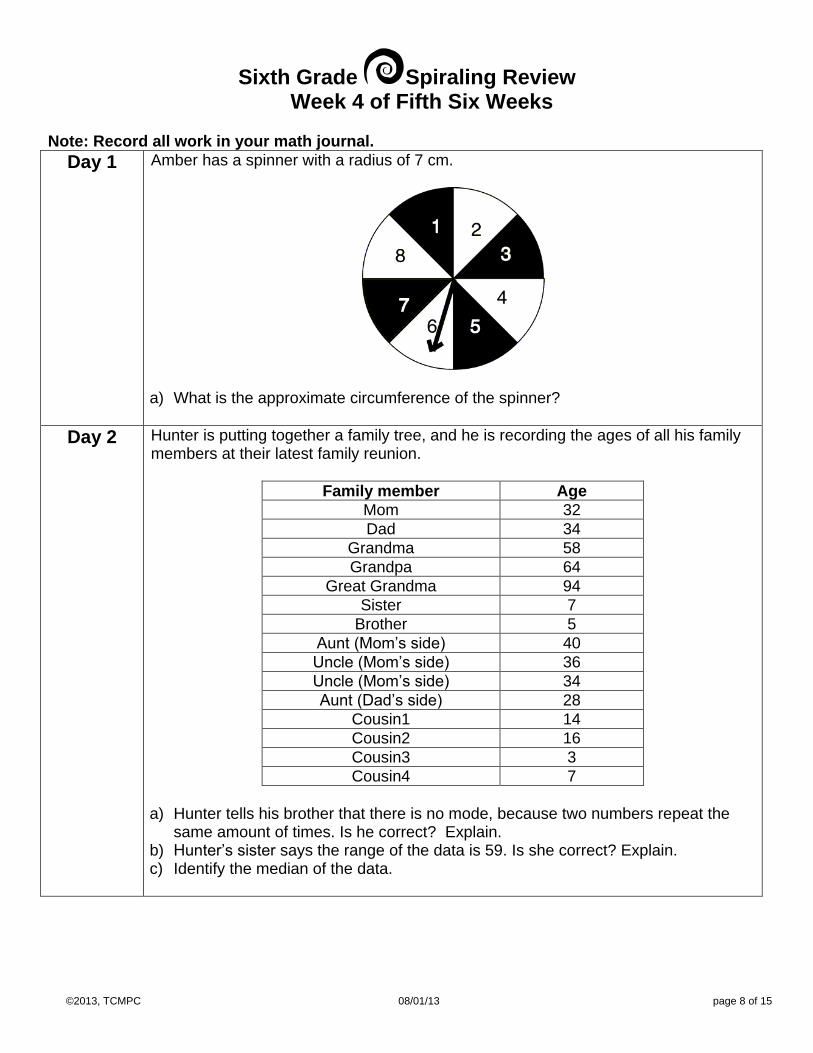
Day 1 Amber has a spinner with a radius of 7 cm.
a) What is the approximate circumference of the spinner?
Day 2 Hunter is putting together a family tree, and he is recording the ages of all his family members at their latest family reunion.
Family member Age
Mom 32
Dad 34
Grandma 58
Grandpa 64
Great Grandma 94
Sister 7
Brother 5
Aunt (Mom’s side) 40
Uncle (Mom’s side) 36
Uncle (Mom’s side) 34
Aunt (Dad’s side) 28
Cousin1 14
Cousin2 16
Cousin3 3
Cousin4 7
a) Hunter tells his brother that there is no mode, because two numbers repeat the
same amount of times. Is he correct? Explain. b) Hunter’s sister says the range of the data is 59. Is she correct? Explain. c) Identify the median of the data.
Sixth Grade Spiraling Review Week 4 of Fifth Six Weeks (cont.)
Note: Record all work in your math journal.
Day 3 Diego is trying to sort his closet into three categories: socks, shirts, and pants. He has one pair of black socks, one pair of brown socks, and one pair of white socks. He has one red shirt, one green shirt, one blue shirt, and one black shirt. He has one pair of khakis, and one pair of slacks. a) Construct the sample space for this information.
Day 4 The following is a sampling of the ingredients you can include on your sandwich at Dezeray’s restaurant:
Dezeray’s Sandwich Shop Bread Meat Cheese
Rye Turkey American Wheat Ham Swiss White Roast Beef Cheddar a) Create a tree diagram arranging all the combinations of sandwiches at Dezeray’s
Sandwich Shop
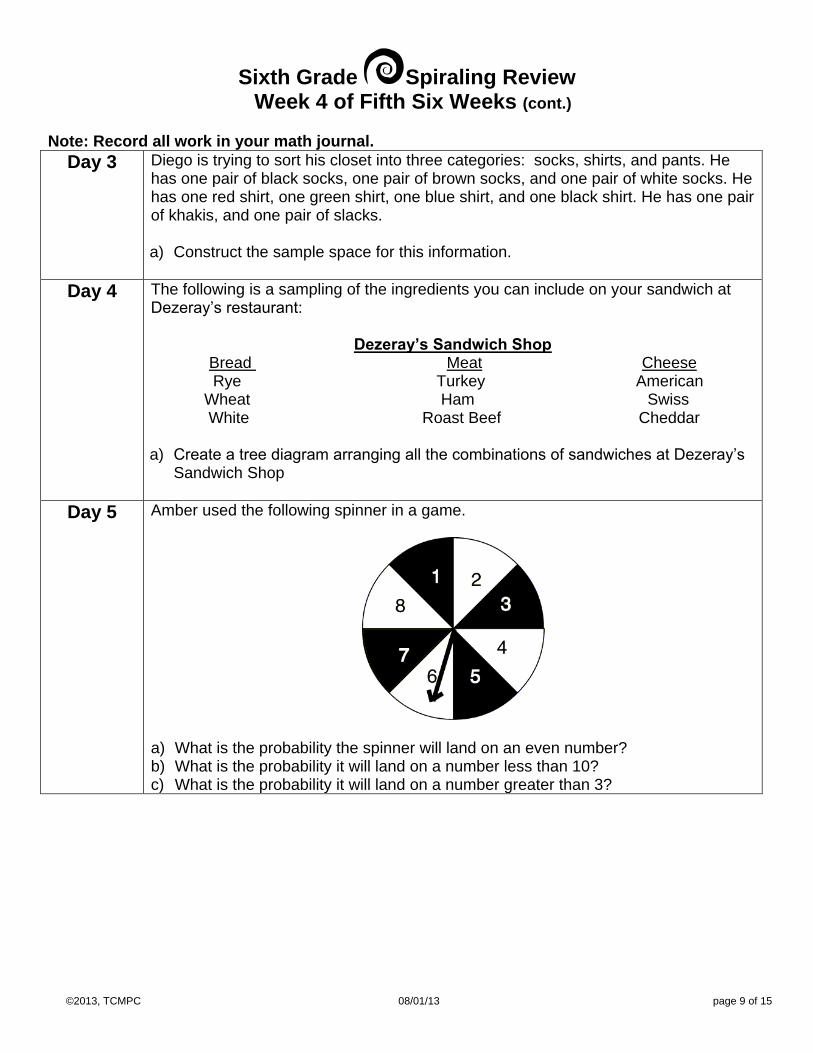
Day 5 Amber used the following spinner in a game.
a) What is the probability the spinner will land on an even number? b) What is the probability it will land on a number less than 10? c) What is the probability it will land on a number greater than 3?
Sixth Grade Spiraling Review Week 5 of Fifth Six Weeks
Note: Record all work in your math journal.
Day 1 Ana is drawing marbles out of a bag that include 5 black, 4 blue, 3 red, and 2 green marbles. a) What is the probability of drawing a blue marble? b) What is the probability of drawing a red or green marble?
Day 2 Ms. Seifert’s math class is rolling numbered cubes to investigate probability. a) What is the probability of rolling a number less than 5? b) How would this ratio be represented as a decimal? c) How would this ratio be represented as a percent?
Day 3 Rafael is spinning a spinner with 5 equal sections of color: blue, yellow, green, red, and black. a) Determine the probability of landing on a green, red, or black space b) What is the decimal equivalent of this? c) What is the probability of landing on anything but yellow?
Day 4 A deck has 52 cards in it, with thirteen cards from each of the four suits: hearts, spades, clubs, and diamonds. a) What is the probability of drawing a spade from the deck of cards? b) Write and evaluate and expression that could be used to find the complement of
drawing any card other than a diamond c) What is the probability of drawing a red card?
Day 5
The letters to the word photosynthesis are all placed into a bag. P H O T O S Y N T H E S I S a) Determine P(E) b) Determine P(S) c) What is the decimal equivalent of the probability of selecting a T? d) What is the percent equivalent to the P(N) e) What is the decimal and percent equivalent of selecting any letter other than O?
Sixth Grade Spiraling Review Fifth Six Weeks Answer Keys
(pp. 3 of 5)
Week 3 Answer Key: Process may vary.
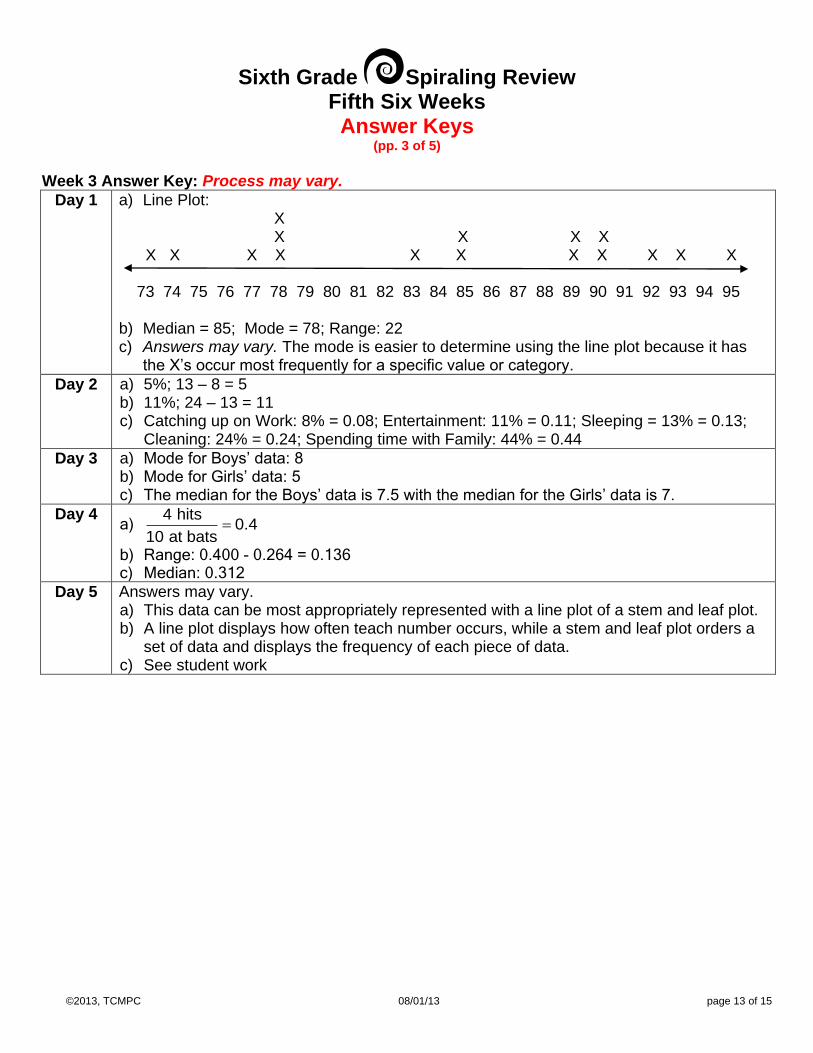
Day 1
a) Line Plot: X X X X X X X X X X X X X X X X 73 74 75 76 77 78 79 80 81 82 83 84 85 86 87 88 89 90 91 92 93 94 95 b) Median = 85; Mode = 78; Range: 22 c) Answers may vary. The mode is easier to determine using the line plot because it has
the X’s occur most frequently for a specific value or category.
Day 2 a) 5%; 13 – 8 = 5 b) 11%; 24 – 13 = 11 c) Catching up on Work: 8% = 0.08; Entertainment: 11% = 0.11; Sleeping = 13% = 0.13;
Cleaning: 24% = 0.24; Spending time with Family: 44% = 0.44
Day 3 a) Mode for Boys’ data: 8 b) Mode for Girls’ data: 5 c) The median for the Boys’ data is 7.5 with the median for the Girls’ data is 7.
Day 4 a)
4 hits0.4
10 at bats
b) Range: 0.400 - 0.264 = 0.136 c) Median: 0.312
Day 5
Answers may vary. a) This data can be most appropriately represented with a line plot of a stem and leaf plot. b) A line plot displays how often teach number occurs, while a stem and leaf plot orders a
set of data and displays the frequency of each piece of data. c) See student work
Sixth Grade Spiraling Review Fifth Six Weeks Answer Keys
(pp. 4 of 5)
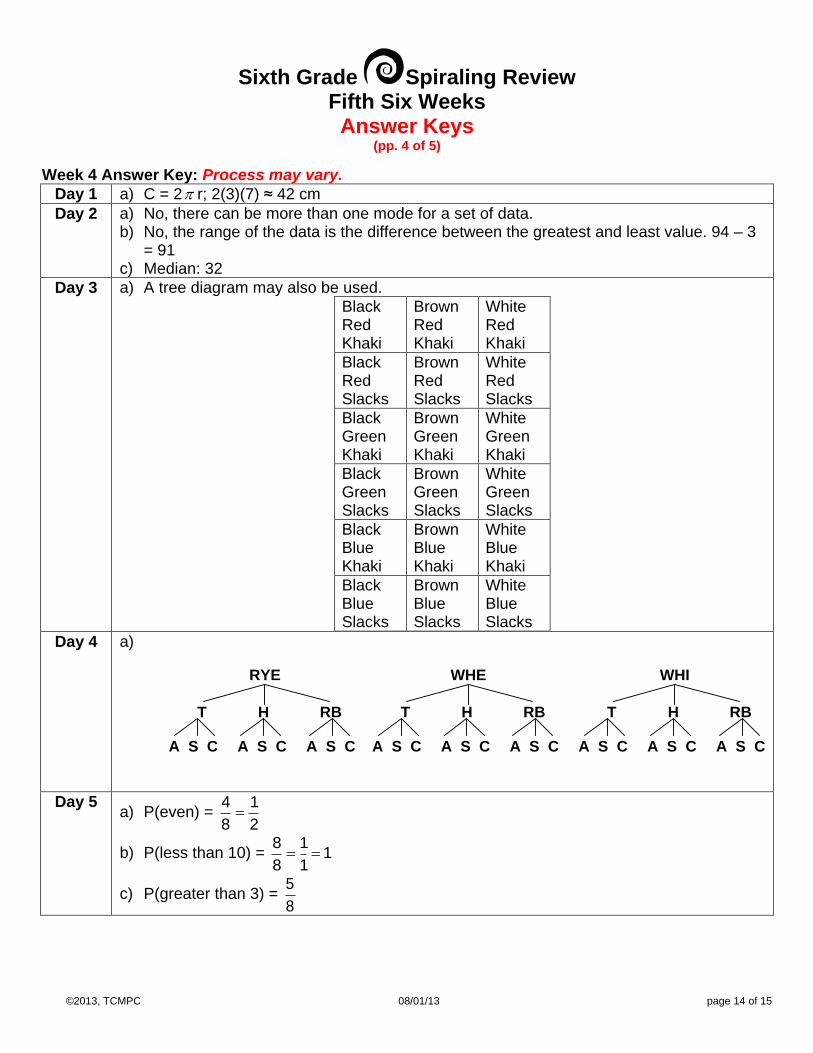
Week 4 Answer Key: Process may vary.
Day 1 a) C = 2 r; 2(3)(7) ≈ 42 cm
Day 2 a) No, there can be more than one mode for a set of data. b) No, the range of the data is the difference between the greatest and least value. 94 – 3