volume ratios, superior control over MOF membrane fabrication, and enhanced guest-sorption kinetics
compared to analogous bulk phases, but reliable synthesis of uniformly sized particles remains an
outstanding challenge. Here, we identify the smallest and most probable sizes of known MOF
nanocrystals and present an exhaustive comparative summary of nano- versus bulk-MOF syntheses.
Based on critical analysis of reported size data and experimental conditions, an alternate to the LaMer
model is proposed that describes nanocrystal formation as a kinetic competition between acid-base and
metal–ligand reactivity. Particle growth terminates when ligands outcompete metal-ion diffusion,
thereby arresting polymerization to produce kinetically trapped particle sizes. This model reconciles
disparate trends in the literature and postulates that minimum particle sizes can be achieved by
minimizing the relative ratios of metal-to-linker local concentrations. By identifying conditions that
disfavor small nanocrystal sizes, this model also provides routes towards macroscopic MOF single
crystals. A universal “seesaw” relationship between nanocrystal sizes and the concentrations of acidic
surface-capping ligands provides a roadmap for achieving precise synthetic control. Best practices in
synthesis, characterization, and data presentation are recommended for future investigations so that
MOF nanocrystals may achieve their full potential as advanced nanomaterials.
Introduction
Nanocrystals are distinguished from their bulk counterparts bythe extreme size-dependence of their functional properties. Forexample, catalytic activities of metal nanoparticles,1 nanocrystalplasmon resonance energies,2,3 and quantum dot absorptionand emission proles in photovoltaic, solar fuel, and lumines-cence technologies4–6 reect underlying electronic structuressensitive to sub-nanometre size variations. Tailoring nano-crystals to a given application therefore relies on generatingparticles with precise diameter values and uniform size distri-butions. Since the advent of reliable synthetic methods, inor-ganic nanocrystals of metals7 and semiconductors8–10 havefound widespread use as advanced materials in diverse areas,whereas design principles for organic–inorganic hybrid nano-materials are just emerging.
Recently, considerable efforts have focused on exploring thenanoscale synthesis of metal–organic frameworks (nano-MOFs)due to the promise of their heightened performance in drugdelivery,11–13 catalysis,14 membrane design for gas storage andseparation,15–17 and analyte sensing.18 As 3D porous
ESI) available: Compiled literature sizeI: 10.1039/c9sc03802g
8
coordination polymers comprised of inorganic clusters bridgedby multi-topic organic linkers, MOFs display immense modu-larity that has given rise to more than 20 000 unique bulkphases,19 each with the potential to adopt enhanced function-alities when prepared as nanocrystals.20 To advance thisresearch frontier, we must identify synthetic targets anduniversal mechanistic principles. Building on the publication ofrecent reviews21–24 and rigorous mechanistic studies,25–29 weidentied key open questions: Which MOFs have been preparedas nanocrystals? Which sizes are achievable? And Which mecha-nistic parameters govern nano-MOF sizes? Here, we address theseoutstanding questions by compiling experimental parametersand particle sizes from across the nano-MOF literature; statis-tically treating reported size data (see Methods section below);comparing nano-MOF sizes, size-measurement techniques, andsynthetic conditions; and identifying underlying chemicalprinciples from observed trends. Whereas recent reviews21,30,31
have compared the impacts of varying synthetic techniques,such as microwave versus solvothermal, and conditions, such astime and temperature, we target the generalized chemicalequilibria and kinetic pathways universal to nano-MOFsyntheses.
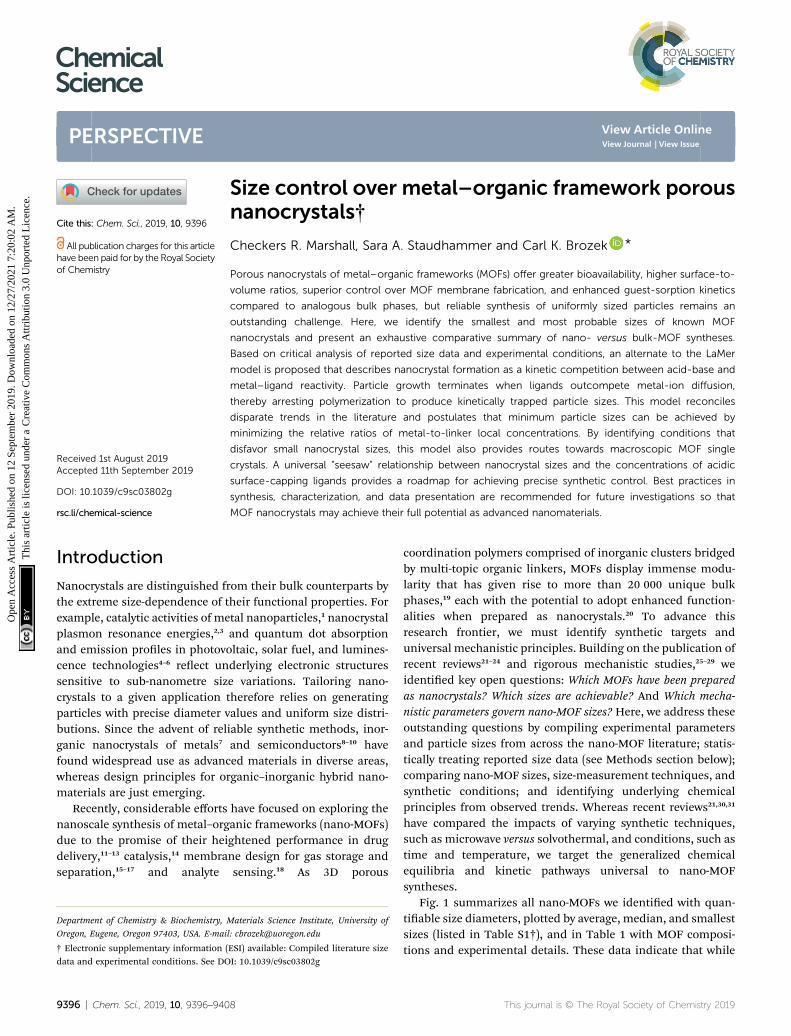
Fig. 1 summarizes all nano-MOFs we identied with quan-tiable size diameters, plotted by average, median, and smallestsizes (listed in Table S1†), and in Table 1 with MOF composi-tions and experimental details. These data indicate that while
Fig. 1 Summary of all MOFmaterials reported to-date as nanocrystals with precisely measured particle diameters. Average and median sizes areincluded using all reported literature values for each MOFmaterial. Average sizes for MFU-4, MOF-5, NU-1000, NU-1003, UiO-67, and PCN-222are above 450 nm, as indicated by arrows. Smallest known sizes for eachMOF are labelled according to the corresponding synthetic method, i.e.,coordination modulation (CM), metal–organic gel (gel), slow addition (SA), and ionic liquid microemulsions (ILM). See Methods section for detailsof data treatment. All tabulated values are included in Table S1 of the ESI.†
Perspective Chemical Science
Ope
n A
cces
s A
rtic
le. P
ublis
hed
on 1
2 Se
ptem
ber
2019
. Dow
nloa
ded
on 1
2/27
/202
1 7:
20:0
2 A
M.
Thi
s ar
ticle
is li
cens
ed u
nder
a C
reat
ive
Com
mon
s A
ttrib
utio
n 3.
0 U
npor
ted
Lic
ence
.View Article Online
many MOF materials have been accessed as nanocrystals, thevast majority have not. Furthermore, Fig. 1 suggests that typicalnano-MOF sizes exist on the 100 nm scale, with few extendingbelow 20 nm, in contrast to the 1–10 nm diameters achievablefor inorganic nanocrystals.8 For most MOF materials, selectstudies have achieved sub-100 nm diameters, but these casesare exceptions, as size averages and median values are farlarger. For each class of MOF materials displayed in Fig. 1, thesmallest size provides the current state-of-the-art in minimizingnanocrystal sizes, median values indicate the most likelyachievable sizes when using the coordination modulationsynthetic method, and average values lend insight into thedistribution of reported values for each given class of MOFnanocrystals.
Interestingly, compiling size data for a given MOF revealedthat oen the most impactful size determinants were those thatchanged between separate synthetic investigations, rather thanthe parameters systematically explored within isolated studies.For example, Fig. 2 shows a portion of data compiled for nano-scale HKUST-1 (Cu3(BTC)2(H2O)3). Clearly, the differing reactionconditions between the results in panel a versus panel b hada greater impact on the nanocrystal sizes compared to the minorimpact of copper salt and added base identities shown in panel b.Either the differing reactant concentrations (2.34 mM versus 0.17mM), solvent conditions (DMF/H2O/EtOH mixture versusbutanol), or solvothermal versus microwave synthetic routesinvolved distinct processes that produced stark size differences.In response to such cases, we focus our mechanistic analysis onreports that employed “coordination modulators”—typicallymonotopic acid ligands—as these represent the bulk of literature
examples, although small particles of MOFs have been generatedby many other techniques, such as preparation via micro-emulsions,32,33 dual injection,34 and metal–organic gels.35
Reliable preparation of small nano-MOF particles dependson a rm mechanistic understanding of nano-MOF initiation,growth, and termination. Typically, nano-MOF syntheses arediscussed21,23,26 in terms of the LaMer model of particlegrowth,36 which separates crystal nucleation from growth, anddescribes both in terms of thermodynamic driving forces trig-gered by high precursor concentrations. In situ data suggest thatMOF-5 (Zn4O(BDC)3) may follow this model, as nucleation andgrowth appear to be effectively separated.26 However, systemssuch as HKUST-1 and ZIF-8 (Zn(Hmim)2) behave differently,exhibiting slow nucleation phases that overlap with growth.37,38
A collection of in situ XRD studies of MOF crystal formationrevealed no signicant difference in the time scales betweennucleation and growth phases, implying that both processescan occur simultaneously.39 Furthermore, the majority of nano-MOF syntheses occur under dilute conditions (Table S2†).Rather than stabilizing at thermodynamically controlled criticalsize diameters, termination of nano-MOF growth relies on thepresence of capping ligands to surround particle surfaces.
We argue, therefore, that while thermodynamics remaincentral to understanding MOF crystal nucleation and growth,nano-MOF sizes are kinetically controlled by chemical parame-ters that arrest particle growth. In particular, the critical conditionsfor ensuring small nano-MOF sizes involve depleting the localconcentrations of reactant metal ions, thereby allowing linkers andmonotopic modulators to trap nano-MOF particles. Analysis of theliterature reveals that ideal conditions involve excess ligand
Fig. 2 Size comparisons of HKUST-1 nanocrystals prepared by (A)microwave-assisted growth at varying reactant concentrations andadded equivalents of dodecanoic acid and (B) by solvothermalsynthesis at a fixed reactant concentration of 0.0024 M and varyingequivalents of triethylamine (TEA) or acetate (OAc) modulators.44,86,87
The nanocrystal sizes in these studies were determined by TEM (A) andPXRD (B).
Scheme 1 Key chemical equilibria controlling nano-MOF growth andtermination.
Chemical Science Perspective
Ope
n A
cces
s A
rtic
le. P
ublis
hed
on 1
2 Se
ptem
ber
2019
. Dow
nloa
ded
on 1
2/27
/202
1 7:
20:0
2 A
M.
Thi
s ar
ticle
is li
cens
ed u
nder
a C
reat
ive
Com
mon
s A
ttrib
utio
n 3.
0 U
npor
ted
Lic
ence
.View Article Online
(linker or modulator), dilute reactant concentrations, strongmetal–ligand bonds, and low proton activities. In this perspec-tive, we support this kinetic model with literature examples thatillustrate the role performed by each parameter and apply thisinsight to rationalizing previously unexplained phenomena.
Methods
Most size data shown in the gures, tables, and text of thisperspective were reproduced from values enumerated in liter-ature sources, including error bars, which were reported as sizedeviations. When size ranges were listed without averages, wetook the range midpoints as average values (e.g., 100–200 nmwould be 150 nm � 50 nm). When nanoparticle sizes wereprovided as histograms, average sizes were taken as the modes,with the extreme values as the size distribution ranges. In a fewcases, data were digitized from published graphs using theFigure Calibration package in the program ImageJ.40 To compilesize data, manual searches were conducted in SciFinder,WebofScience and Google Scholar using the terms “nano,”“nanocrystal,” “nanosize,” and “nanoparticle” in addition to theterm “MOF” or “metal–organic framework.” To seek specicstructures that have been made on the nanoscale, their various
9400 | Chem. Sci., 2019, 10, 9396–9408
common MOF names (e.g. CPO-27 or MOF-74) were used inaddition to these terms.
For Fig. 1, average and median values were calculated fromall compiled literature sources that reported nanocrystals sizesas denitive values (e.g., “�200 nm” or “about 200 nm” were notused). Sizes reported were analysed regardless of the measure-ment technique (i.e., PXRD, DLS, etc). When multiple sizedetermination techniques were reported for a given nanocrystalinvestigation, data from those techniques were averaged, thenused to determine the global average and median for that MOFmaterial (see Table S3†). The smallest MOF nanocrystalsprepared via other methods are given in order to compare thesevalues to all MOF nanocrystals obtained by coordinationmodulation.
Factors controlling MOF nanocrystal sizes
We propose that the kinetic trapping of MOF nanocrystals ofparticular sizes depends on the competition between fourchemical equilibria (Scheme 1): (1) linker deprotonation; (2)modulator deprotonation; (3) linker complexation, and (4)termination.
Equilibria with fast forward-direction rates and low revers-ibility dictate whether MOF particles steadily grow toward bulkphases or arrest quickly to form small nanocrystals. MOFlinkers must deprotonate (eqn (1)) before forming metal-linkerbonds. Modulators are usually acids, and so must also bedeprotonated (eqn (2)). Complexation between metal ions andlinkers facilitates particle growth (eqn (3)). Reports suggest thatearly in MOF growth, large collections of molecular complexesand oligomers develop in solution before coalescing into MOFparticles.41 Subsequent MOF growth is then dominated by thearrival of oligomer clusters or solvated reactant molecules.42
During the nal termination step (eqn (4)), linker and modu-lator ligands compete for metal ion coordination sites.According to our kinetic model, this process continues until thelocal concentration of ligands far exceeds the metal ions,thereby arresting particle growth. In addition to these fourchemical processes, the assembly of cluster nodes and solventdecomposition have also been invoked to discuss nano-MOFnucleation and growth,43 but we focus on the most generalprocesses that dominate particle trapping. Critical analysis ofnano-MOF sizes and synthetic conditions reveal the existence ofkey parameters that may be programmed to deplete localconcentrations of metal ions and generate small particle sizes:modulator identity and concentration, equivalents of linker ormodulator, and metal–ligand bond strengths.
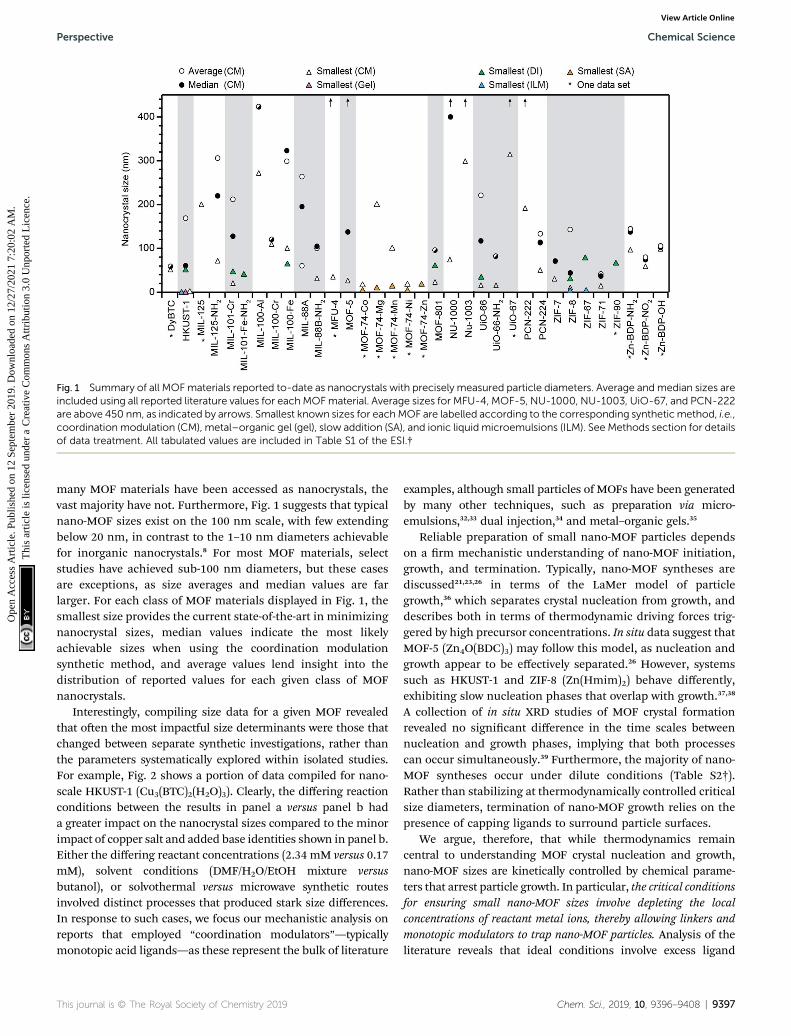
Fig. 3 Nanoscale MOF sizes depend on the equivalents and pKa valuesof added modulator reagents. (A) MIL-101(Cr) nanocrystal sizesdecrease with increasingmodulator pKa values. Sizes were determinedby TEM.98 (B) As modulator equivalents increases, sizes of UiO-66particles increase. (TFA: trifluoroacetic acid, DCA: dichloroacetic acid,FA: formic acid, and AA: acetic acid). Shaded boxes are provided toemphasize sizes below 200 nm. Sizes were determined with STEM andDLS (DLS not shown).72 (C) MIL-101-Cr nanocrystal sizes decrease withincreased modulator equivalents, while MIL-88B-NH2-Fe exhibits theopposite trend. Interestingly, MIL-88B microcrystals are formed as animpurity at and above 5 benzoic acid equivalents (orange). Sizes weredetermined with SEM (orange and pink) and TEM (blue).48,49,94
Perspective Chemical Science
Ope
n A
cces
s A
rtic
le. P
ublis
hed
on 1
2 Se
ptem
ber
2019
. Dow
nloa
ded
on 1
2/27
/202
1 7:
20:0
2 A
M.
Thi
s ar
ticle
is li
cens
ed u
nder
a C
reat
ive
Com
mon
s A
ttrib
utio
n 3.
0 U
npor
ted
Lic
ence
.View Article Online
Modulators. Modulators are typically monotopic carboxylicacids and occasionally Brønsted bases added to nano-MOFsyntheses. The intended purpose of modulators varies, but wepropose that their function is to inuence nano-MOF sizes byaffecting linker deprotonation and arresting particle growth.44
Modulators also act to prevent particle aggregation. Althoughmodulators produce size trends that appear complex andcontradictory, their role can be rationalized in terms of the fourequilibria outlined above.
When strong Brønsted bases are used as modulators, theirprimary role is to facilitate ligand deprotonation (eqn (1)) andenhance metal-linker complexation (eqn (3)) relative to metal-ion diffusion, thereby depleting local metal ion concentra-tions and forming small MOF nanocrystals. For example,nanocrystals of MFU-4 (Zn5Cl4(BBTA)3) decrease in size withadded lutidine or KOH.12 Similarly, when nanocrystals of NU-1000 (Zr6(m3-OH)8(OH)8(TBAPy)2) are prepared with the addi-tion of 4-biphenyl-carboxylic acid, particle sizes decreasefurther if NaOH is added to the precursor linker solution45
Nanocrystals of MOF-5 and IR-MOF-3 (Zn4O(TPDC)3) requiretriethylamine (TEA), which become more uniform with initialaddition of cetyltrimethylammonium bromide (CTAB).46 Simi-larly, including n-butylamine decreases nanocrystal sizes of ZIF-71 (Zn(Hdcim)2).41 Interestingly, nanoparticles of MIL-101(Cr)(Cr3 (H2O)2O[(C6H3)-(CO2)3]2) are synthesized without anymodulator by simply decreasing the amount of HF, which isused as a mineralizing agent in the traditional bulksynthesis.47–49 Adding a strong base to the reaction mixture,however, results in smaller particle sizes.50
When carboxylic acids serve asmodulators, their presence canincrease or decrease nano-MOF sizes depending on whether theyimpede linker deprotonation (eqn (1)) or act as surface cappingligands (eqn (4)). By interfering with deprotonation, they slowdown metal-linker complexation (eqn (3)) relative to metal-iondiffusion, resulting in large nano-MOF sizes. On the otherhand, they can terminate particle growth by acting as surface-capping ligands and produce small sizes. For example, Fig. 3Ashows that while adding 0.33 equivalents of peruorobenzoicacid generates larger MIL-101 particles relative to using no HF ormodulator, the addition of more weakly acidic 4-nitrobenzoicacid, benzoic acid, 4-methoxybenzoic acid, and stearic aciddecreases particle sizes with increasing modulator pKa values.51
The less acidic the modulator, the lower the H+ activity in solu-tion available to protonate linker molecules (eqn (1)).
Adding small quantities of acidic modulators decreasesnano-MOF sizes until the H+ activity in solution reachesa threshold value that begins to interfere with linker deproto-nation (eqn (1)). Further addition of acid slows metal–ligandcomplexation relative to metal-ion diffusion, leading to largeparticle sizes. For example, Fig. 3A serves as a useful compar-ison to the data in Fig. 3A. Both studies were conducted atsimilar concentrations (0.076 M versus 0.033 M) and bothinvolve similarly strong metal–ligand bond strengths (Zr4+-carboxylate and Cr3+-carboxylate) but whereas 0.33 modulatorequivalents were employed in Fig. 3A, much higher quantitieswere involved in Fig. 3B. The data show that UiO-66
(Zr6O6(BDC)6) nanocrystal sizes increase with additionalmodulator. Interestingly, modulators with lower pKa valuesproduce larger particle sizes at a given amount of addedmodulator. For instance, 15–20 equivalents of triuoroaceticacid (TFA) or dichloroacetic acid (DCA) produce 200 nm UiO-66
nanocrystal sizes, whereas twice that amount of acetic andformic acid are needed. Acidic modulators slow down metal–ligand complexation (eqn (3)) relative to metal-ion diffusion sothat particles continue to grow. Indeed, adding thousands ofequivalents of formic acid to the synthesis of UiO-66 generatessingle crystals hundreds of microns in diameter.52 This kineticexplanation ts many other studies in which particle sizesincrease with additional acidic modulator,44,53–55 includingHKUST-1 modulated by dodecanoic acid,44 PCN-224 (Zr-TCPP)with benzoic acid,53 UiO-66 with benzoic acid54 and MIL-88B-NH2 (Fe3O(BDC-NH2)3(H2O)2) with acetic acid.55
Concentrated reaction conditions necessitate the addition ofmodulator; otherwise, rapid metal-ion diffusion due to shorteffective pathlengths outcompetes growth termination (eqn (4)).Indeed, most nanoscale MOF syntheses rely on dilute condi-tions (Table S2†). For example, synthesis of MIL-101-Crinvolving high concentrations (0.2 M H2BDC) produces smallparticle sizes only with addition of small quantities of benzoicacid. (Fig. 3C).48 The more acidic benzoic acid has a greatereffect than acetic acid on decreasing particle sizes at such highreactant concentrations, suggesting that under these reactionconditions, interfering with metal–ligand complexation is crit-ical to kinetically trapping small MIL-101-Cr nanocrystals.
Phase purity must be considered when choosing modulatorequivalents and reaction concentrations. For example, whileadding few equivalents of either acetic or benzoic acid in thesynthesis of MIL-101 at high concentrations results in phase-pure MIL-101 nanocrystals, greater equivalents induce theformation of mixed-phase products49 because MIL-101 andMIL-88B occupy the same reaction space, with both arising from Fe3+
or Cr3+ and trimesic acid.56 Therefore, at a benzoic acid : linkerratio of 10 : 1, only MIL-88B microcrystals form.50 Concentra-tion plays an important role in controlling nanocrystal phase
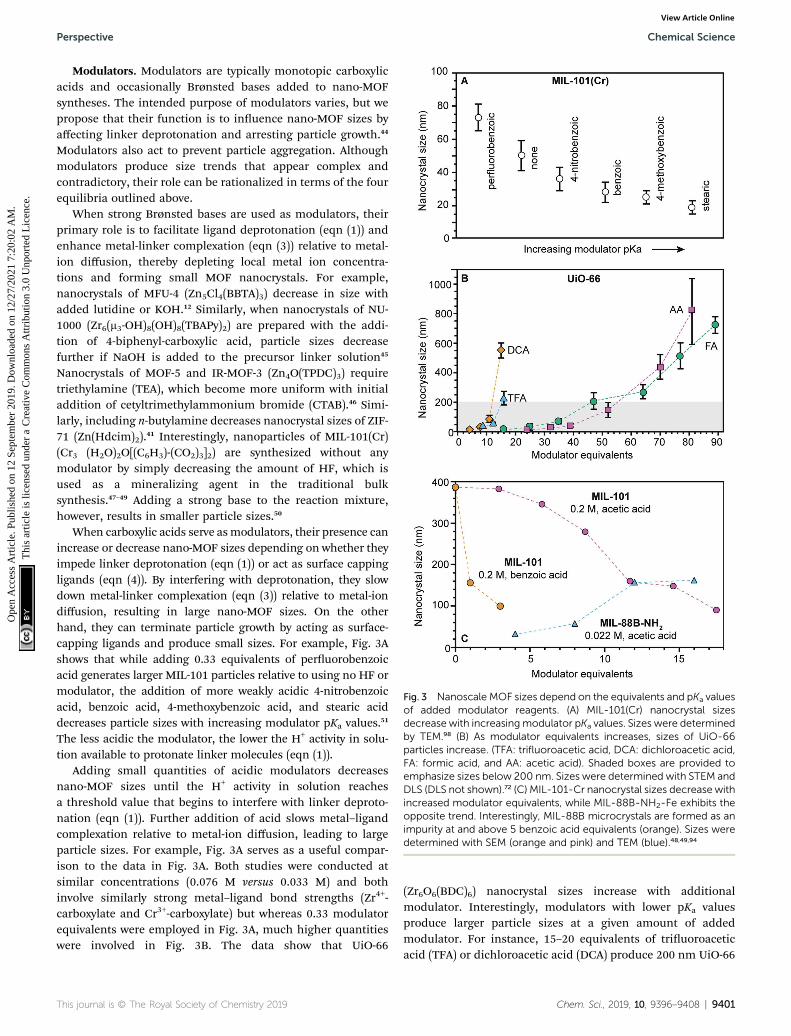
Fig. 4 ZIF nanocrystal syntheses with varying relative ratios of metal, linmethylimidazole, Hdcim: 4,5-dichloroimidazole). (A) Dilution results in ainfluence than base on nanocrystal sizes.37 (C) Addition of n-butylamine
9402 | Chem. Sci., 2019, 10, 9396–9408
purity as well. For example, MIL-101-Cr and MIL-88B-Fe nano-crystals have been obtained with similar equivalents of aceticacid, but the synthesis of MIL-88B-Fe was an order of magnitudemore dilute (Fig. 3C). Such phase transformations with variablemodulator equivalents indicate the importance of nonclassicalgrowth mechanisms.57 Similar phenomena have been observedfor the phases spaces involvingMIL-100-Al (Al3$(H2O)2O(BTC)2)/MIL-96-Al (Al12O-(OH)16(H2O)5(BTC)6 MIL-110-Al (Al8(OH)12(-OH)3(H2O)3(BTC)3) and NU-901 (Zr6(m3-OH)8(OH)8(TBAPy)2)/NU-1000.45,58,59
Linker equivalents. Excess linker equivalents shi equilibriatoward enhanced metal–ligand complexation (eqn (3)), therebydepleting local metal ion concentrations44 and arresting particlegrowth without added modulator (eqn (4)). In other words,excess linkers serve as surface-capping ligands. The excesslinker method was rst reported in 2009 for ZIF-8 and has sincebeen used in further ZIF-8 and ZIF-71 nanocrystal syntheses(Fig. 4).37,41,60 Nano-MOF particle sizes can be further reduced byadding Brønsted bases to enhance linker deprotonation (eqn(1)).60 Irreversible ligand deprotonation may lead, however, tounchecked particle growth through rapid metal–ligandcomplexation, unless counterbalanced by excess surface-capping ligands—illustrating the intricate kinetic balance ofthe four key underlying processes outlined in eqn (1)–(4).
Although several chemical parameters may contribute todecreased nano-MOF sizes, the impact of certain factors maydominate over others. For example, linker excess was discov-ered to be the single strongest size determinant of ZIF-8 nano-crystals through systematic investigations into the role ofBrønsted base, linker excess, and reactant concentrations(Fig. 4A and B).60 Nanocrystals of ZIF-8 can be synthesized usingan excess of the linker 1-methylimidazolium (Hmim),60 whereastypical bulk syntheses of ZIF-8 combine the zinc salt and
ker, modulator, and solvent. Synthetic variables are in bold. (Hmim: 1-series of ZIF-8 nanocrystals sizes.60 (B) Excess linker exerts a strongerrather than linker excess exhibits biggest impact on ZIF-71 sizes.41
Fig. 5 Heterobimetallic ZIF-8 nanocrystals increase in size as the Zn2+
atoms are substituted for Co2+ or Cu2+ atoms. Insert: highlighted dataat low equivalents, where identical Co2+ and Cu2+ quantities producedifferent particle sizes. Particle sizes were determined by TEM (main)and SEM (insert).63,114
Scheme 2 Reaction conditions that favor small or large MOF nano-crystal sizes when linker or acidic modulators are present in excess.
Perspective Chemical Science
Ope
n A
cces
s A
rtic
le. P
ublis
hed
on 1
2 Se
ptem
ber
2019
. Dow
nloa
ded
on 1
2/27
/202
1 7:
20:0
2 A
M.
Thi
s ar
ticle
is li
cens
ed u
nder
a C
reat
ive
Com
mon
s A
ttrib
utio
n 3.
0 U
npor
ted
Lic
ence
.View Article Online
imidazole linker in a 1 : 1 ratio.61 Simply increasing the metal-to-linker ratio to 1 : 5 results in nanocrystals sizes of 40 nm(Fig. 4A).60 Reactant concentration was also studied as a sizedeterminant, with the data in Fig. 4A showing that more dilutesystems lead to smaller ZIF-8 crystal sizes. In terms of ourkinetic model, the role of dilution is to increase metal-iondiffusion pathlengths, allowing particles to be terminated inisolation from additional metal ions. The impact of added basewas also investigated, but only the basic modulator n-butyl-amine resulted in reduced nanocrystal sizes, whereas less basic1-methylimidazole and sodium formate resulted inmicrometre-sized crystals.37 Nevertheless, compared to the impact of dilu-tion (Fig. 4A) and Brønsted base, the most signicant decreasesin ZIF-8 sizes were achieved by linker excess (Fig. 4B). Thesesystematic comparisons suggest that growth termination ismore important than linker deprotonation in controlling ZIF-8nanocrystal sizes.
If linker deprotonation limits nanocrystal formationkinetics, however, addition of Brønsted base will producea greater effect than the equivalents of excess linker. Forexample, systematic studies of ZIF-71 nanocrystal synthesisindicate that in contrast to ZIF-8, the most inuential variable isn-butylamine equivalents (Fig. 4C).41 When the linker-to-metalratio is doubled from two to four with base and concentrationheld constant, particle sizes remain around 80–100 nm.Increasing the proportion of base, however, reduces particlesizes to approximately 20 nm. The sensitivity of ZIF-71 nano-crystal sizes to the equivalents of added base results from theless acidic 4,5-dichloroimidazole linker.
Interestingly, rather than follow this excess linker strategy,most reported nano-MOF syntheses rely on the same linkerequivalents used in bulk syntheses (Table S2†). On the otherhand, select studies have shown that excess linker was ineffec-tive in generating nanoscale particles. Excess trimesic acid doesnot produce HKUST-1 nanocrystals, for instance.38 Althoughexcess linker reduces the sizes of UiO-66 particles, higher watercontent exerted the greatest size control, perhaps due to its rolein assembling the Zr4+-oxo cluster nodes.62
Metal–ligand bond strengths. Strong metal–ligand interac-tions favour small particle size because they enhance rates ofboth complexation (eqn (3)) and termination (eqn (4)) duringnano-MOF growth, thereby depleting the local concentrationsof metal ions relative to linkers or modulators. Systematicstudies varying the metal identities of heterobimetallic mate-rials illustrates the inuence of metal–ligand interactions onnanocrystal size. For example, higher Co2+ contents in Zn2+-based ZIF-8 nanocrystals results in larger nanocrystals (Fig. 5).63
Using Cu2+ further accentuates this effect, with comparativelylarger sizes produced at identical dopant metal concentra-tions.64 Because linker-to-metal ratios remained constant inthese experiments, the increase in size with lower Zn2+ contentcan be attributed to the strong Zn2+-imidazolate interactions,which quickly produce small particles unless harder ions suchas Cu2+ interfere. Similarly, differences in metal ion labilitieswere invoked to explain why MOF-74 (M2(DOBDC)) crystalsnucleate and grow faster with Zn2+ than with Co2+.42 Surpris-ingly, cobalt-doped UiO-66 nanoparticles are smaller in size
than their zirconium-only counterparts when synthesized underotherwise identical conditions.65 As the strength of the zirco-nium–carboxylate bond is expected to be stronger than cobalt-carboxylate bonds, metal-linker complexation rates may notbe the only equilibrium to consider. For instance, weaker bondsmight slow particle growth, allowing diffusing linkers trap thecobalt variants at smaller sizes. To date, there have been fewstudies regarding the effect of mixed metals on MOF nano-crystal size and this area warrants further exploration.
Summary. The metal–ligand chemistry outlined in eqn (1)–(4) provides a framework for understanding trends in reportednano-MOF sizes. Based on these insights, Scheme 2 offersa general guide for designing small MOF nanocrystals. Excesslinker or acidic modulator generally reduce nanocrystal sizesunless either metal-linker complexation far exceeds termina-tion kinetics or if acid addition inhibits linker deprotonation.Dilute reactant concentrations paired with low proton activitiesensure small particle sizes by enhancing complexation (eqn (3))and termination (eqn (4)), while isolating particles fromdiffusing metal ions to prevent runaway growth.
Fig. 6 The “Seesaw” relationship between nanocrystal sizes and addedequivalents of acidic ligands. Nanocrystal sizes increase with higherratios of metal-to-linker local concentrations (A) particles reacha minimum size a at critical values of acidic ligand 3 and minimumrelative ratios local metal ion-to-ligand concentrations b and relativeratios diffusion and metal–ligand complexation ratios s. (B) MIL-125-NH2 and UiO-66 exhibit the full seesaw relationship curve in trendsbetween particle sizes and equivalents of p-toluic acid.66
Chemical Science Perspective
Ope
n A
cces
s A
rtic
le. P
ublis
hed
on 1
2 Se
ptem
ber
2019
. Dow
nloa
ded
on 1
2/27
/202
1 7:
20:0
2 A
M.
Thi
s ar
ticle
is li
cens
ed u
nder
a C
reat
ive
Com
mon
s A
ttrib
utio
n 3.
0 U
npor
ted
Lic
ence
.View Article Online
The “Seesaw” relationship of nano-MOF sizes
Seemingly incompatible trends reported for nano-MOF sizescan be reconciled by viewing nano-MOF growth as a balancebetween reactant concentration, linker and modulator depro-tonation, metal–ligand interactions, and metal-ion diffusion.Fig. 6A summarizes our model into two regimes. In regime I,small quantities of acidic ligands (either modulators or linkers)decrease particle sizes by supplying surface-capping ligands,overwhelming local metal ion concentrations. Higher quanti-ties of acidic ligands further decrease nanocrystal sizes byincreasing the rate of metal–ligand complexation relative tometal-ion diffusion. This trend continues until reachingminimum nanocrystal sizes a at threshold values of addedacidic ligand 3 (Fig. 6A). This critical point corresponds toa minimum of relative ratios between local metal ion-to-ligandconcentrations b and ratios of relative rates of diffusion andmetal–ligand complexation s (Fig. 6A). In regime II, additionalequivalents of acidic ligands raise solution proton activitiessuch that they interfere with linker deprotonation. As a result,nanocrystal sizes increase with additional acidic ligand becausemetal-ion diffusion rates outcompete particle termination. This“seesaw” relationship between nano-MOF sizes and relativetermination versus diffusion rates strikes a balance preciselywhere particles sizes are at a minimum.
Fig. 6B summarizes data exhibiting a seesaw curve for NH2-MIL-125 and UiO-66 sizes with varying quantities of p-toluicacid.66 For both materials, particle sizes at rst decrease,bottom-out at minimum values, and then increase with higherquantities of modulator. Competition between complexationand metal-ion diffusion may explain seesaw curves in relatedphenomena, such as the polymorphic balance between MIL-101and MIL-88B phases achieved by tuning benzoic acid equiva-lents (Fig. 3C).48 Low benzoic acid equivalents producedecreasing sizes of MIL-101 until higher equivalents lead tolarge micron-sized particles of MIL-88B instead.
We propose that most reported trends of nano-MOF sizescapture just portions of the entire curve of the seesaw rela-tionship. Regime-I behavior, where added acidic liganddecreases particle sizes, is observed for theMIL-101(Cr) and ZIF-8 syntheses discussed above (Fig. 3A and 4A).48,49,60 Examples ofregime II behavior, where particle size increases with respect toincreasing modulator equivalents, have been observed for manyMOFs when monocarboxylic acids are added, including reportson UiO-66, HKUST-1, PCN-224, and MIL-88B-NH2.44,53–55 Basedon numerous reports exhibiting regime II behavior, the curva-ture of the slope region II appears proportional to modulatoracidity such that highly acidic ligands produce larger particlesizes at xed equivalents. The impact of highly acidic modula-tors is so pronounced that they can halt particle growth entirely,whereas less acidic modulators added in large excess simplypromote large particles.
Whether regime-I or regime-II behaviors emerge for a givenMOF material depends on the similarities between the partic-ular complexation, termination, and metal-ion diffusion rates.
9404 | Chem. Sci., 2019, 10, 9396–9408
Although the seesaw curve involves kinetic trapping, theextreme limit at the far right of the curve involves particles growover much longer time periods due to sluggish metal–ligandcomplexation that places MOF crystal growth in an entirelydifferent regime determined by thermodynamics. According tothis model, defects incorporated in nano-MOFs must be kinet-ically trapped, whereas defects in macroscopic MOF singlecrystals arrive through thermodynamically driven processes.This model helps explains why addition of strong acid helps toproduce large single crystals of MOFs.67
Best practices and outstandingchallenges
Elevating the rigor of MOF nanocrystal synthesis will requireaddressing critical challenges. Here, we offer recommendationson synthetic, characterization, and data-reporting methods tofacilitate future MOF nanocrystal investigations.
Colloidal stability
Applying MOF nanoparticles in applications such as drug deliveryrequires that the particles be colloidally stable. A re-dispersednanoparticle solution may suffer from signicant aggregation orcoalescence without sufficient surface capping ligand coverage.
Measurements of zeta potentials provide useful information onthe charge at the nanoparticle surface, such that values far awayfrom zero indicate that a dispersion is stable.68DLS (dynamic lightscattering) measurements may be used to determine colloidalstability, as it is a solution-phase size measurement method.Aggregating particles observed by DLS display unusually highhydrodynamic radii. Additionally, further growth or aggregationcauses the apparent sizes to increase over time.
Incorporation of modulator
Identifying the presence and location of modulators in nano-MOFs is important in determining whether they serve assurface-capping ligands or form internal defects. Mirkin et al.found that while the colloidal stability of UiO-66 crystalscorrelated to the identity and amount of modulator, the exactrole of modulators at the particles surfaces was unclear.68 Forexample, while small equivalents of weakly acidic modulatorsresulted in aggregation,68 nanoparticles of UiO-66 have beensynthesized without any monocarboxylic acid modulator.62
A commonmethod to quantify ligand incorporation inMOFsis to perform acid digestion NMR studies. The linker-to-modulator ratio in the MOF can be elucidated through 1H-NMR peak integration.69 Defects may also be identied asa weight percent by thermal gravimetric analysis (TGA).46,70 Therelative incorporation of a modulator depends on its functionduring synthesis. For instance, in the synthesis of ZIF-8 with n-butylamine, less than 1% incorporation is observed by 1H NMR.The absence of incorporated modulator indicates its primaryrole is to deprotonate the linker, rather than cap particlesduring termination.71 When the ratio of modulator is higherthan would be expected for surface passivation, it must eitherbe creating defects in the MOF particle, or be present as a guest.For example, a reported synthesis of UiO-66 modulated withbenzoic acid revealed an 8 : 10 benzoic acid-to-linker ratio, evenaer extensive washing.54 The amount of modulator incorpo-rated can depend on pH, as one 1H NMR digestion study of UiO-66 showed that acetic acid incorporation rst decreased, thenincreased, with respect to the amount of triethylamine added.69
The authors speculated that amount of deprotonated BDC inthe reaction was maximized at the minimum of the acetateincorporation curve.69 Interestingly, modulator incorporationobserved in this study exhibits a U-shaped curve, indicating thatmodulator defect concentrations can be minimized at a criticalamount of added modulator. This U-shape does not correspondto size, however; the size monotonically decreases, indicatingthe minimum size and defect concentration occur withdifferent quantities of added modulator. Due to the insightobtained from these studies, we recommend acid digestionNMR studies as a standard method to characterize MOF nano-particles. We expect synthetic methods to advance toward nerlevels of control as trends emerge from the impact modulatorshave on defect incorporation and nanocrystal size.
Measurement methods
Size analysis of MOF nanocrystals relies on appropriate use ofstructural characterization methods, as has been discussed in
a previous review.27 Typical techniques include PXRD (powderX-ray diffraction), microscopy, DLS, and SAXS (small angle X-rayscattering). In general, we recommend reporting data from atleast two complimentary methods, even when data contradict.
According to the Scherrer relation,72 the full-width-at-half-max of a given PXRD peak relates to the particle size.Although smaller particles will exhibit broader diffraction peaksin general, peak broadening may result from several factors,such as lattice stress or instrument effects.73 Several peaksshould be modelled to determine reliable size estimates. Whenconsidering polyhedral crystals, shape factors should be chosento match the particle morphology and specic miller index ofthe peak under consideration.73 Crystallographic domain, notparticle, sizes are estimated by this method. Aggregated parti-cles comprise of multiple domains, which leads to conictingdata between PXRD and other sizing techniques.74
Dynamic light scattering (DLS) overestimates particle sizesbecause the method determines the hydrodynamic radii ofparticles. Authors oen attribute size overestimates from DLS toaggregation. Recent reports have suggested that MOF porositymay induce unconventional diffusion behaviour, which wouldhamper analysis by DLS.62 The interpretation of DLS relies on theassumption that particles are hard spheres that move in solutionvia Brownian motion.75 Irregularly shaped particles or porousparticles defy these simplied models.76,77 Several advancedmodels exist that describe hollow nanoparticles, although thesetoo may be inadequate for describing the complex microporosityof MOF particles.78 The key utility of DLS is in developing bio-logical applications of large particles, where it can effectivelyidentify the presence of microscopic aggregates in solution.79
Microscopy is the most common method to determineparticle sizes. Both SEM (scanning electron microscopy) andTEM (transmission electron microscopy) are widely used,although they rely on high-energy electron beams that cancompromise MOF structural integrity.27 Microscopy nds itsgreatest advantage in probing particle morphology, althoughthe 2D projections of 3D particle shapes should be consideredcarefully.60 Furthermore, analysis must be applied to statisti-cally relevant ensembles of particles. It is essential to report thesize of the population used to estimate size and size distribu-tions; these values are oen missing in the literature.
SAXS is a less common technique, but it presents severaladvantages: SAXS measures solution-state samples withoutoverestimating sizes and it examines statistically relevant pop-ulations.37 Accurate analysis relies on choosing appropriateapproximations and form factors.80 Although size and porosity ofhollow nanoparticles can be accurately determined by SAXS,nano-MOFs lack a generally accepted model due to their complextopology.78 The model used, and any other relevant data analysis,should be rigorously reported. In general, critical treatment ofparticle size data is essential to rigorous investigations into thestructure–property relationships of MOF nanocrystals.
Conclusions
MOF nanocrystal sizes and synthetic conditions were criticallyanalysed from across the literature to develop a deeper
mechanistic understanding of nanocrystal formation. A generalmodel was presented that reconciles seemingly contradictorytrends for MOF nanocrystal sizes versus common syntheticparameters: excess ligand, additional acid or base, reactantconcentrations, and metal ion identities. A universal “seesaw”relationship is proposed that relates nano-MOF sizes toa competition between particle growth facilitated by diffusingmetal ions and particle termination by depleting metal ion localconcentrations through rapid ligand complexation. Therefore,conditions that favour high relative concentrations of ligandsand that maximize metal-ion diffusion pathlengths produce thesmallest nano-MOF sizes. This model also sheds light on themechanism of MOF crystal growth, in general, and providesa framework for designing macroscopic single crystals. Bycompiling data for all known MOF nanocrystals, we dene thegoalposts for future nano-MOF synthetic targets and providea mechanistic model rooted in chemical parameters that maybe tuned to discover the full potential of this emerging class ofnanomaterials.
Conflicts of interest
There are no conicts to declare.
Acknowledgements
We are grateful to Frederic Hessman, the creator of theFigure Calibration package in ImageJ, and to Prof. ChristopherH. Hendon for insightful conversations.
Notes and references
1 L. Liu and A. Corma, Chem. Rev., 2018, 118, 4981–5079.2 A. M. Schimpf, N. Thakkar, C. E. Gunthardt, D. J. Masielloand D. R. Gamelin, ACS Nano, 2014, 8, 1065–1072.
3 A. Llordes, G. Garcia, J. Gazquez and D. J. Milliron, Nature,2013, 500, 323–326.
4 D. M. Kroupa, J. Y. Roh, T. J. Milstein, S. E. Creutz andD. R. Gamelin, ACS Energy Lett., 2018, 3, 2390–2395.
5 E. M. Sanehira, A. R. Marshall, J. A. Christians, S. P. Harvey,P. N. Ciesielski, L. M. Wheeler, P. Schulz, L. Y. Lin,M. C. Beard and J. M. Luther, Sci. Adv., 2017, 3, eaao4204.
6 Z. Han, F. Qiu, R. Eisenberg, P. L. Holland and T. D. Krauss,Science, 2012, 338, 1321–1324.
7 I. Chakraborty and T. Pradeep, Chem. Rev., 2017, 117, 8208–8271.
8 J. Owen and L. Brus, J. Am. Chem. Soc., 2017, 139, 10939–10943.
9 J. Huhn, C. Carrillo-Carrion, M. G. Soliman, C. Pfeiffer,D. Valdeperez, A. Masood, I. Chakraborty, L. Zhu,M. Gallego, Z. Yue, M. Carril, N. Feliu, A. Escudero,A. M. Alkilany, B. Pelaz, P. Del Pino and W. J. Parak,Chem. Mater., 2017, 29, 399–461.
10 Y. Yin and A. P. Alivisatos, Nature, 2005, 437, 664–670.11 S. Wuttke, M. Lismont, A. Escudero, B. Rungtaweevoranit
and W. J. Parak, Biomaterials, 2017, 123, 172–183.
9406 | Chem. Sci., 2019, 10, 9396–9408
12 M. Graf, N. Moreno, K. Kerl and H. Bunzen, J. Mater. Chem.,2018, 6, 6481–6489.
13 S. Wang, Y. Chen, S. Wang, P. Li, C. A. Mirkin andO. K. Farha, J. Am. Chem. Soc., 2019, 141, 2215–2219.
14 S. M. J. Rogge, A. Bavykina, J. Hajek, H. Garcia, A. I. Olivos-Suarez, A. Sepulveda-Escribano, A. Vimont, G. Clet,P. Bazin, F. Kapteijn, M. Daturi, E. V. Ramos-Fernandez,F. X. I. Llabres Xamena, V. Van Speybroeck and J. Gascon,Chem. Soc. Rev., 2017, 46, 3134–3184.
15 K. Adil, Y. Belmabkhout, R. S. Pillai, A. Cadiau, P. M. Bhatt,A. H. Assen, G. Maurin and M. Eddaoudi, Chem. Soc. Rev.,2017, 46, 3402–3430.
16 Y. He, W. Zhoud, G. Qian and B. Chen, Chem. Soc. Rev.,2014, 43, 5657–5678.
17 G. Yu, Y. Liu, X. Zou, N. Zhao, H. Rong and G. Zhu, J. Mater.Chem., 2018, 6, 11797–11803.
18 Y. Sakata, S. Furukawa, M. Kondo, K. Hirai, N. Horike,Y. Takashima, H. Uehara, N. Louvain, M. Meilikhov,T. Tsuruoka, S. Isoda, W. Kosaka, O. Sakata andS. Kitagawa, Science, 2013, 339, 193–196.
19 H. Furukawa, K. E. Cordova, M. O'Keeffe and O. M. Yaghi,Science, 2013, 341, 1230444.
20 R. Freund, U. Lachelt, T. Gruber, B. Ruhle and S. Wuttke,ACS Nano, 2018, 12, 2094–2105.
21 S. Wang, C. M. McGuirk, A. D'Aquino, J. A. Mason andC. A. Mirkin, Adv. Mater., 2018, 30, 1800202.
22 B. S. Barros, O. J. de Lima Neto, A. C. de Oliveira Fros andJ. Kulesza, ChemistrySelect, 2018, 3, 7459–7471.
23 M. Sindoro, N. Yanai, A. Y. Jee and S. Granick, Acc. Chem.Res., 2014, 47, 459–469.
24 M. B. Majewski, H. Noh, T. Islamoglu and O. K. Farha, J.Mater. Chem. A, 2018, 6, 7338–7350.
25 J. Cravillon, C. A. Schroder, R. Nayuk, J. Gummel, K. Huberand M. Wiebcke, Angew. Chem., Int. Ed., 2011, 50, 8067–8071.
26 S. Hermes, T. Witte, T. Hikov, D. Zacher, S. Bahnmuller,G. Langstein, K. Huber and R. A. Fischer, J. Am. Chem.Soc., 2007, 129, 5324–5325.
27 P. Hirschle, T. Preiß, F. Auras, A. Pick, J. Volkner,D. Valdeperez, G. Witte, W. J. Parak, J. O. Radler andS. Wuttke, CrystEngComm, 2016, 18, 4359–4368.
28 J. P. Patterson, P. Abellan, M. S. Denny, C. Park,N. D. Browning, S. M. Cohen, J. E. Evans andN. C. Gianneschi, J. Am. Chem. Soc., 2015, 137, 7322–7328.
29 Y. Zhu, J. Ciston, B. Zheng, X. Miao, C. Czarnik, Y. Pan,R. Sougrat, Z. Lai, C. E. Hsiung, K. Yao, I. Pinnau, M. Panand Y. Han, Nat. Mater., 2017, 16, 532–536.
30 N. Abedin, Z. Hasan and S. Hwa, Coord. Chem. Rev., 2018,376, 20–45.
31 B. Liu, K. Vellingiri, S.-H. Jo, P. Kumar, Y. S. Ok andK.-H. Kim, Nano Res., 2018, 11, 4441–4467.
32 W. Sun, X. Zhai and L. Zhao, Chem. Eng. J., 2016, 289, 59–64.33 R. Ye, M. Ni, Y. Xu and H. Chen, RSC Adv., 2018, 8, 26237–
26242.34 X. G. Wang, Q. Cheng, Y. Yu and X. Z. Zhang, Angew. Chem.,
35 Y. Qi, C. He, J. Lin, S. Lin, J. Liu, J. Huang, W. Xue, G. Yu,H.-Y. Chao, Y. Tong and Z. Qiao, Nano Res., 2017, 10,3621–3628.
36 V. K. LaMer and R. H. Dinegar, J. Am. Chem. Soc., 1950, 72,4847–4854.
37 J. Cravillon, R. Nayuk, S. Springer, A. Feldhoff, K. Huber andM. Wiebcke, Chem. Mater., 2011, 23, 2130–2141.
38 P. Schafer, F. Kapteijn, M. A. Van Der Veen andK. F. Domke, Cryst. Growth Des., 2017, 17, 5603–5607.
39 M. J. Van Vleet, T. Weng, X. Li and J. R. Schmidt, Chem. Rev.,2018, 118, 3681–3721.
40 J. Schindelin, I. Arganda-Carreras, E. Frise, V. Kaynig,M. Longair, T. Pietzsch, S. Preibisch, C. Rueden,S. Saalfeld, B. Schmid, J. Y. Tinevez, D. J. White,V. Hartenstein, K. Eliceiri, P. Tomancak and A. Cardona,Nat. Methods, 2012, 9, 676–682.
41 I. H. Lim, W. Schrader and F. Schuth, Chem. Mater., 2015,27, 3088–3095.
42 E. Haque and S. H. Jhung, Chem. Eng. J., 2011, 173, 866–872.43 S. Surble, F. Millange, C. Serre, G. Ferey and R. I. Walton,
Chem. Commun., 2006, 1518–1520.44 S. Diring, S. Furukawa, Y. Takashima, T. Tsuruoka and
S. Kitagawa, Chem. Mater., 2010, 22, 4531–4538.45 T. E. Webber, W. Liu, S. P. Desai, C. C. Lu, D. G. Truhlar and
R. L. Penn, ACS Appl. Mater. Interfaces, 2017, 9, 39342–39346.
46 M. Ma, D. Zacher, X. Zhang, R. A. Fischer and N. Metzler-Nolte, Cryst. Growth Des., 2011, 11, 185–189.
47 V. Thi Thanh Chau, H. Thi MinhThanh, P. Dinh Du,T. Thanh Tam Toan, T. Ngoc Tuyen, T. Xuan Mau andD. Quang Khieu, J. Chem., 2018, 2018, 1–14.
48 L. Yang, T. Zhao, I. Boldog, C. Janiak, X.-Y. Yang, Q. Li,Y.-J. Zhou, Y. Xia, D.-W. Lai and Y.-J. Liu, Dalton Trans.,2019, 48, 989–996.
49 T. Zhao, L. Yang, P. Feng, I. Gruber, C. Janiak and Y. Liu,Inorg. Chim. Acta, 2018, 471, 440–445.
50 T. Zhao, S. Li, L. Shen, Y. Wang and X. Yang, Inorg. Chem.Commun., 2018, 96, 47–51.
51 D. Jiang, A. D. Burrows and K. J. Edler, CrystEngComm, 2011,13, 6916–6919.
52 C. A. Trickett, K. J. Gagnon, S. Lee, F. Gandara, H. B. Burgiand O. M. Yaghi, Angew. Chem., Int. Ed., 2015, 54, 11162–11167.
53 J. Park, Q. Jiang, D. Feng, L. Mao and H. Zhou, J. Am. Chem.Soc., 2016, 138, 3518–3525.
54 A. Schaate, P. Roy, A. Godt, J. Lippke, F. Waltz, M. Wiebckeand P. Behrens, Chem. Eur. J., 2011, 17, 6643–6651.
55 M. Pham, G. Vuong, A. Vu and T. Do, Langmuir, 2011, 27,15261–15267.
56 M. Suresh, B. David Raju, K. S. Rama Rao,K. Raveendranath Reddy, M. L. Kantam and P. Srinivasu,J. Chem. Sci., 2014, 126, 527–532.
57 M. J. Van Vleet, T. Weng, X. Li and J. R. Schmidt, Chem. Rev.,2018, 118, 3681–3721.
58 B. Seoane, A. Dikhtiarenko, A. Mayoral, C. Tellez,J. Coronas, F. Kapteijn and J. Gascon, CrystEngComm,2015, 17, 1693–1700.
59 A. G. Marquez, A. Demessence, A. E. Platero-Prats,D. Heurtaux, P. Horcajada, C. Serre, J. Chang, G. Ferey,A. De, C. Boissiere, D. Grosso and C. Sanchez, Eur. J.Inorg. Chem., 2012, 100, 5165–5174.
60 J. Cravillon, S. Munzer, S. Lohmeier, A. Feldhoff andK. Huber, Chem. Mater., 2009, 21, 1410–1412.
61 Y. Lee, M. Jang, H. Cho, H. Kwon, S. Kim andW. Ahn, Chem.Eng. J., 2015, 271, 276–280.
62 G. E. Decker, Z. Stillman, L. Attia, C. A. Fromen andE. D. Bloch, Chem. Mater., 2019, 31, 4831–4839.
63 J. K. Zareba, M. Nyk andM. Samoc, Cryst. Growth Des., 2016,16, 6419–6425.
64 A. Schejn, A. Aboulaich, L. Balan, V. Falk, J. Lalevee,G. Medjahdi, L. Aranda, K. Mozet and R. Schneider, Catal.Sci. Technol., 2015, 5, 1829–1839.
65 J. Cao, Z. Yang, W. Xiong, Y. Zhou, Y. Peng and X. Li, Chem.Eng. J., 2018, 353, 126–137.
66 S. Hu, M. Liu, X. Guo, K. Li, Y. Han, C. Song and G. Zhang,Cryst. Growth Des., 2017, 17, 6586–6595.
67 H. Furukawa, F. Gandara, Y.-B. Zhang, J. Jiang, W. L. Queen,M. R. Hudson and O. M. Yaghi, J. Am. Chem. Soc., 2014, 136,4369–4381.
68 W. Morris, S. Wang, D. Cho, E. Auyeung, P. Li, O. K. Farhaand C. A. Mirkin, ACS Appl. Mater. Interfaces, 2017, 9,33413–33418.
69 Y. Zhao, Q. Zhang, Y. Li, R. Zhang and G. Lu, ACS Appl.Mater. Interfaces, 2017, 9, 15079–15085.
70 Z. Hu, I. Castano, S. Wang, Y. Wang, Y. Peng, Y. Qian,C. Chi, X. Wang and D. Zhao, Cryst. Growth Des., 2016, 16,2295–2301.
71 S. Springer, A. Satalov, J. Lippke and M. Wiebcke,Microporous Mesoporous Mater., 2015, 216, 161–170.
72 W. Morris, S. Wang, D. Cho, E. Auyeung, P. Li, O. K. Farhaand C. A. Mirkin, ACS Appl. Mater. Interfaces, 2017, 9,33413–33418.
73 A. W. Burton, K. Ong, T. Rea and I. Y. Chan, MicroporousMesoporous Mater., 2009, 117, 75–90.
74 T. Uemura, M. Ohba and S. Kitagawa, Inorg. Chem., 2004,43, 7339–7345.
75 J. Stetefeld, S. A. McKenna and T. R. Patel, Biophys. Rev.,2016, 8, 409–427.
76 M. Mandø, C. Yin, H. Sørensen and L. Rosendahl, inProceedings of the 6th International Conference onMultiphase Flow, ICMF, 2007.
77 G. C. Abade, B. Cichocki, M. L. Lekiel-Jezewska, G. Nageleand E. Wajnryb, J. Phys. Condens. Matter, 2010, 22, 322101.
78 Z. H. Chen, C. Kim, X. B. Zeng, S. H. Hwang, J. Jang andG. Ungar, Langmuir, 2012, 28, 15350–15361.
79 E. Bellido, M. Guillevic, T. Hidalgo, M. J. Santander-Ortega,C. Serre and P. Horcajada, Langmuir, 2014, 30, 5911–5920.
80 T. Li, A. J. Senesi and B. Lee, Chem. Rev., 2016, 116, 11128–11180.
81 Y. Liu, R. Decadt, T. Bogaerts, K. Hemelsoet,A. M. Kaczmarek, D. Poelman, M. Waroquier, V. VanSpeybroeck, R. Van Deun and P. Van Der Voort, J. Phys.Chem. C, 2013, 117, 11302–11310.
82 Z. Qi, J. Yang, Y. Kang, F. Guo and W. Sun, Dalt. Trans.,2016, 45, 8753–8759.
83 H. Guo, Y. Zhu, S. Wang, S. Su, L. Zhou and H. Zhang,Chem. Mater., 2012, 24, 444–450.
84 M. Pang, A. J. Cairns, Y. Liu, Y. Belmabkhout, H. C. Zengand M. Eddaoudi, J. Am. Chem. Soc., 2013, 135, 10234–10237.
85 X. Cai, B. Liu, M. Pang and J. Lin, Dalt. Trans., 2018, 47,16329–16336.
86 F. Wang, H. Guo, Y. Chai, Y. Li and C. Liu, MicroporousMesoporous Mater., 2013, 173, 181–188.
87 C. Xin, H. Zhan, X. Huang, H. Li, N. Zhao, F. Xiao, W. Weiand Y. Sun, RSC Adv., 2015, 5, 27901–27911.
88 Y. Pan, D. Heryadi, F. Zhou, L. Zhao, G. Lestari, H. Su andZ. Lai, CrystEngComm, 2011, 13, 6937.
89 A. Ran, S. B. Betzler, F. Haase and B. V. Lotsch,CrystEngComm, 2013, 15, 9296–9300.
90 D. Li, H. Wang, X. Zhang, H. Sun, X. Dai, Y. Yang, L. Ran,X. Li, X. Ma and D. Gao, Cryst. Growth Des., 2014, 14,5856–5864.
91 H. Bunzen, M. Grzywa, M. Hambach, S. Spirkl andD. Volkmer, Cryst. Growth Des., 2016, 16, 3190–3197.
92 J. Amaro-gahete, R. Klee, D. Esquivel, J. R. Ruiz, C. Jimenez-Sanchidrian and F. J. Romero-salguero, Ultrason.Sonochem., 2019, 50, 59–66.
93 E. Bagherzadeh, S. M. Zebarjad and H. R. M. Hosseini, Eur.J. Inorg. Chem., 2018, 1909–1915.
94 X. Cai, J. Lin and M. Pang, Cryst. Growth Des., 2016, 16,3565–3568.
95 D. Liu, Y. Liu, F. Dai, J. Zhao, K. Yang and C. Liu, Dalt.Trans., 2015, 96, 16421–16429.
96 R. Anand, F. Borghi, F. Manoli, I. Manet, V. Agostoni,P. Reschiglian, R. Gref and S. Monti, J. Phys. Chem. B,2014, 118, 8532–8539.
97 E. Bellido, T. Hidalgo, M. V. Lozano, M. Guillevic, R. Simon-Vazquez, M. J. Santander-Ortega, A. Gonzalez-Fernandez,C. Serre, M. J. Alonso and P. Horcajada, Adv. HealthcareMater., 2015, 4, 1246–1257.
98 D. Jiang, A. D. Burrows and K. J. Edler, CrystEngComm, 2011,101, 6916–6919.
99 C. Guo, Y. Zhang, Y. Guo, L. Zhang and J. Wang, Chem.Commun., 2018, 54, 252.
9408 | Chem. Sci., 2019, 10, 9396–9408
100 W. S. Chi, D. K. Roh, C. S. Lee and J. H. Kim, J. Mater. Chem.A, 2015, 3, 21599–21608.
101 S. Vilela, P. Salcedo-Abraira, I. Colinet, F. Salles, M. deKoning, M. Joosen, C. Serre and P. Horcajada,Nanomaterials, 2017, 7, 321.
102 R. Nayuk, D. Zacher, R. Schweins, C. Wiktor, R. A. Fischer,G. Van Tendeloo and K. Huber, J. Phys. Chem. C, 2012, 116,6127–6135.
103 L. Huang, H. Wang, J. Chen, Z. Wang, J. Sun, D. Zhao andY. Yan, Microporous Mesoporous Mater., 2003, 58, 105–114.
104 S. Wang, Y. Lv, Y. Yao, H. Yu and G. Lu, Inorg. Chem.Commun., 2018, 93, 56–60.
105 F. S. Nesse, M. Opitz and P. D. C. Dietzel, MicroporousMesoporous Mater., 2019, 275, 207–213.
106 J. E. Bachman, Z. P. Smith, T. Li, T. Xu and J. R. Long, Nat.Mater., 2016, 15, 845–849.
107 I. Abanades Lazaro, S. Haddad, J. M. Rodrigo-Munoz,R. J. Marshall, B. Sastre, V. Del Pozo, D. Fairen-Jimenezand R. S. Forgan, ACS Appl. Mater. Interfaces, 2018, 10,31146–31157.
108 S. Muthu Prabhu, S. Kancharla, C. M. Park and K. Sasaki,CrystEngComm, 2019, 21, 2320–2332.
109 Z. Hu, I. Castano, S. Wang, Y. Wang, Y. Peng, Y. Qian,C. Chi, X. Wang and D. Zhao, Cryst. Growth Des., 2016,16, 2295–2301.
110 P. Li, R. C. Klet, S. Moon, T. C. Wang, P. Deria, A. W. Peters,B. M. Klahr, H. Park, S. S. Al-Juaid, J. T. Hupp andO. K. Farha, Chem. Commun., 2015, 51, 10925–10928.
111 A. Pankajakshan, M. Sinha, A. A. Ojha and S. Mandal, ACSOmega, 2018, 3, 7832–7839.
112 J. Wang, Y. Fan, Y. Tan, X. Zhao, Y. Zhang, C. Cheng andM. Yang, ACS Appl. Mater. Interfaces, 2018, 10, 36615–36621.
113 Y. S. Li, H. Bux, A. Feldhoff, G. N. Li, W. S. Yang and J. Caro,Adv. Mater., 2010, 22, 3322–3326.
114 A. Schejn, A. Aboulaich, L. Balan, V. Falk, J. Lalevee,G. Medjahdi, L. Aranda, K. Mozet and R. Schneider,Catal. Sci. Technol., 2015, 5, 1829–1839.
115 S. Rojas, F. Carmona, C. Maldonado, P. Horcajada,T. Hidalgo, C. Serre, J. Navarro and E. Barea, Inorg.Chem., 2016, 55, 2650–2663.