HAL Id: hal-00357740 https://hal.archives-ouvertes.fr/hal-00357740 Submitted on 1 Feb 2009 HAL is a multi-disciplinary open access archive for the deposit and dissemination of sci- entific research documents, whether they are pub- lished or not. The documents may come from teaching and research institutions in France or abroad, or from public or private research centers. L’archive ouverte pluridisciplinaire HAL, est destinée au dépôt et à la diffusion de documents scientifiques de niveau recherche, publiés ou non, émanant des établissements d’enseignement et de recherche français ou étrangers, des laboratoires publics ou privés. Distributed under a Creative Commons Attribution| 4.0 International License Size effect regarding fatigue evaluation of asphalt mixtures Didier Bodin, Chantal de la Roche, Gilles Pijaudier-Cabot To cite this version: Didier Bodin, Chantal de la Roche, Gilles Pijaudier-Cabot. Size effect regarding fatigue evalua- tion of asphalt mixtures: Laboratory cantilever bending tests. Road Materials and Pavement De- sign, Taylor & Francis, 2006, ASPHALT TECHNOLOGY (EATA 2006), 7 (Supp 1), pp.181-201. 10.1080/14680629.2006.9690064. hal-00357740
Transcript
HAL Id: hal-00357740https://hal.archives-ouvertes.fr/hal-00357740
Submitted on 1 Feb 2009
HAL is a multi-disciplinary open accessarchive for the deposit and dissemination of sci-entific research documents, whether they are pub-lished or not. The documents may come fromteaching and research institutions in France orabroad, or from public or private research centers.
L’archive ouverte pluridisciplinaire HAL, estdestinée au dépôt et à la diffusion de documentsscientifiques de niveau recherche, publiés ou non,émanant des établissements d’enseignement et derecherche français ou étrangers, des laboratoirespublics ou privés.
Distributed under a Creative Commons Attribution| 4.0 International License
Size effect regarding fatigue evaluation of asphaltmixtures
Didier Bodin, Chantal de la Roche, Gilles Pijaudier-Cabot
To cite this version:Didier Bodin, Chantal de la Roche, Gilles Pijaudier-Cabot. Size effect regarding fatigue evalua-tion of asphalt mixtures: Laboratory cantilever bending tests. Road Materials and Pavement De-sign, Taylor & Francis, 2006, ASPHALT TECHNOLOGY (EATA 2006), 7 (Supp 1), pp.181-201.�10.1080/14680629.2006.9690064�. �hal-00357740�
Didier Bodin* —Chantal de La Roche* —Gilles Pijaudier-Cabot**
* Laboratoire Central des Ponts et ChausséesDivision Matériaux et Structures de ChausséesRoute de Bouaye, BP 4129, F-44341 Bouguenais [email protected]@lcpc.fr
** École Centrale de Nantes R&DO - GeM Institut de recherches en Génie Civilet Mécanique UMR 6183Rue de la Noë - BP 92101, F-44321 Nantes Cedex [email protected]
ABSTRACT. Experimental results for fatigue tests on three size geometrically similar asphalt con-crete specimen are presented. Effect on fatigue life is analyzed and compared to trends givenby a fatigue damage model. This innovative laboratory campaign points out a size effect onfatigue assessment of asphalt mixture. In a second part, the application of a nonlocal fatiguedamage model for asphalt mixtures is presented. A qualitative agreement is obtained betweenexperimental results and non local damage fatigue predictions trends. This agreement validatesthe nonlocal modelling that allows to model the influence of the heterogeneous nature of the ma-terial on fatigue failure. Differences observed between laboratory data and model predictionsmay be attributed to viscoelasticity induced thermal softening which had to be quantified andcoupled to damage in order to properly study these fatigue test data.
It has been shown for a while that, for a given material, the strength depends onthe specimen size (da Vinci, 1881-91; Galileo, 1638). Consequently, strength is nolonger a material constant. Such a phenomenon is called size effect. Size effects onboth strength and fracture toughness of structural materials have been experimentallyobserved on different materials such as cement concrete, rocks, composite materials,ice, . . .. As an example, tensile strength and fatigue strength decrease with the speci-men size (Bazant, 2002). Commonly, scaling law parameters are determined by fittingmodels on experimental data. Size effect on material strength under static loading hasextensively been analyzed during the last few decades, and several theories have beenproposed. However, only few examples exist for cyclic and fatigue loading on cementconcrete (Bazant et al., 1991).
Concerning asphalt mixtures in fatigue, the influence of the tested specimen shapehas been highlighted in the literature (SHRP, 1994; de La Roche, 1996; Benedetto etal., 2003) but few results are available on specimen with the same shape but differentsizes called "homothetic" or geometrically similar specimens. In order to explore theinfluence of the specimen size vs the size of aggregates, Doan (Doan, 1973) made astudy on one loading level for a 0/20 mm asphalt mixe on quasi geometrically similartrapezoidal specimen of two sizes(30 samples : height 250 mm large base 56 mm,small base 25 mm and thickness 25 mm approximatly conform to the present europeanstandard) and a bigger size (10 samples: height 500 mm, large base 90 mm, small base30 mm and thickness 30 mm). For a low loading level, he concluded that the specimensize effect was neglectible leading to the same average fatigue life for each specimenseries. However, more extensive studies are necessary to separate size and scatteringeffects.
This paper presents an experimental campaign performed on different specimensizes on bending fatigue tests derived from the so-called "two points" bending fatiguetest on trapezoidal specimens (NF EN 12697-24). Three size are considered leadingto three similar specimen series.
Elaboration of the specimens, material and specimen characteristics are presentedin section 2. Then fatigue results analyzis and classical fatigue life interpretation areperformed in order to evaluate the size effect on fatigue performance evaluation. Ex-perimental trends are then compared to theoretical results given by a non local fatiguedamage model (Bodin et al., 2004b; Bodin, 2002). The good qualitative agreementsobtained are investigated in further details with the trends expected from viscoelastic-ity induced self heating of the thermal dependant material specimens.
2. Specimen fabrication and material characterization
The material used for this study is a 0/6 mm dense asphalt concrete containing6.4% of 50/70 pure bitumen detailed in Table 1.
2
Table 1. Composition and grading curve of the tested material
For the size effect study, specimens are 2D geometrically similar and their thick-ness is the same as it is shown in the table presented figure 1(b). Size 1.0 correspondsto the standardized size.
� � � � � � � � � �� � � � � � � � � �
� � � � � � � � � �� � � � � � � � � �
� � � �� � � �� � � �� � � �
b
B
h
e
Dimension [mm]Size h B b e0.5 125 28 12.5 251 250 56 25 252 500 112 50 25
(a) (b)
Figure 1. Test principle (a) and dimensions of the tested specimens (b)
Mixtures were manufactured at LCPC and compacted in slabs using the LCPCrolling wheel compactor (NF EN 12697-33). The final dimensions of the slabs were150 x 400 x 600 mm. The sawing of the samples of different sizes had been done bytransposition of the standardized method. Samples are sawn vertically and parallellyto the compaction direction, from the slabs compacted in the laboratory (figure 2).
The homogeneity of each different size set of samples has been compared in termsof average void content. For the n tested samples, the void content mean value Va andits standard deviation σVa
have been calculated for each size. Results are presentedfigure 3.
Void content scattering decreases when the specimen size increases. This isquite understandable as small size specimens directly capture material heterogeneitywhereas big size specimens allow an averaging of the mesostructure of the material.However, the average void contents between sample sets are very similar, varying ofone percent.
Figure 3. Void content value (% by volume) of each specimen for the different sizes
3. Fatigue tests
Fatigue tests consist in applying a sinusoidal displacement at the head of a can-tilever trapezoidal beam (figure 1). The frequency is fixed to the value of 10 Hz. Testsare performed in a thermal chamber controlling the temperature at a value of 10˚C.For each of the three size different series, at least four specimens have been tested foreach loading level. Three loading strain levels have been tested 140 10-6, 180 10-6 and220 10-6 leading to fatigue life between 5 104 and 3 106 cycles. These loading levelsare equal to the maximal strain value in the specimen according to the classical beamtheory.
During the test, force and displacement amplitude are recorded. The effectivestiffness of the sample is calculated as the ratio of force amplitude to displacementamplitude. Then, the test result is plotted as the ratio of effective stiffness to initialstiffness versus the number of cycles.
4
3.1. Initial modulus
During fatigue, initial modulus has been measured for each sample. Initial mod-ulus values are compared in regards to the sample size. An important aspect is toverify the influence of loading amplitude at the beginning of fatigue test for each se-rie, i.e. the existence of non linearity since the beginning of fatigue test (Benedetto etal., 2003; Lundstrom et al., 2004).
Initial modulus measurements are plotted in figure 4(a) versus the loading leveland presented in terms of their average values E0 and their standard deviation σE0 forthe n samples tested of each serie figure 4(b).
Figure 4. Initial stiffness value function of the specimen size
The results obtained from the different sizes show that for each tested loadinglevel, no significative difference can be found between the different sizes. In the testedloading range, initial stiffness does not depend on strain amplitude even if a light trend,corresponding to a classical decrease of modulus with the increase of the loading level,can be observed in the linear regression presented figure 4(a).
3.2. Size effect on fatigue
The size effect is first studied comparing the stiffness decrease plots. Then fatiguelifes for each sizes are compared and finally, size effect on Wöhler curves is presentedto conclude on the classical fatigue performance evaluation using such kind of tests.
3.2.1. Size effect on stiffness decrease
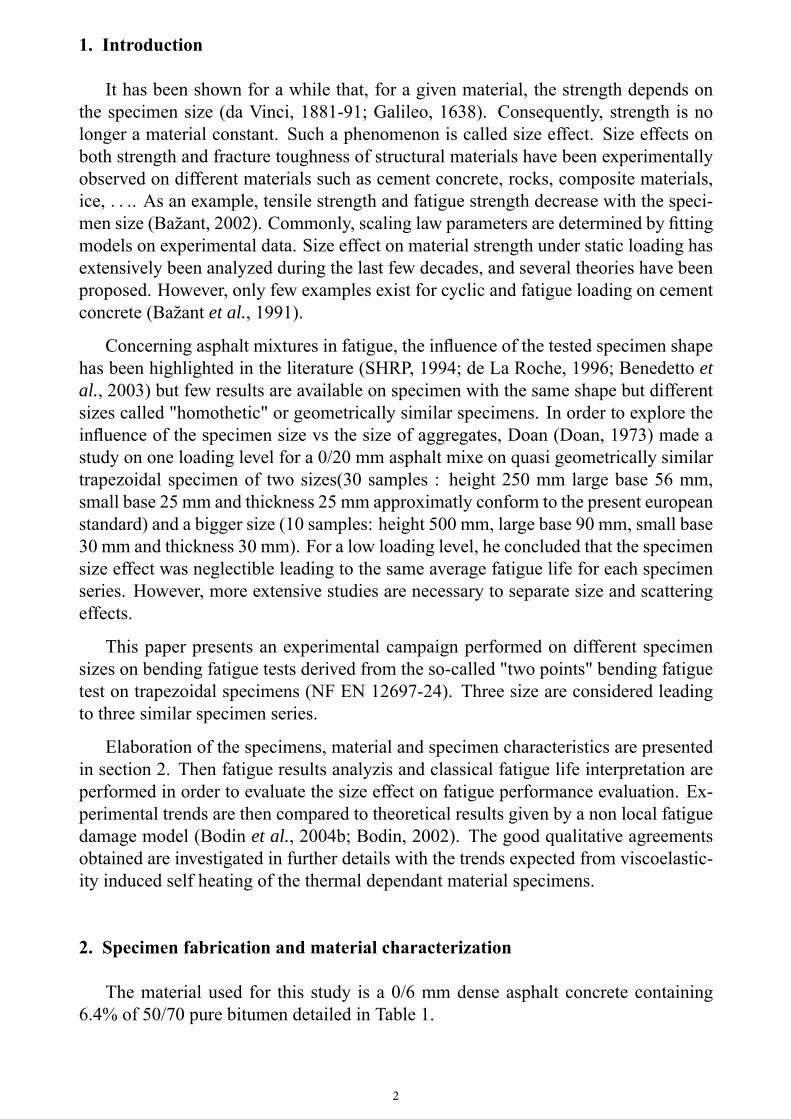
For each test, the decrease of the effective stiffness is plotted as a function of thenumber of loading cycle. For the three loading levels, results are presented figure 5.Typically, the stiffness decrease follows a three stage evolution process. The rapiddrop at the early beginning is followed by a slowest decrease. The ultimate stage,
5
0 1 2 3 4 5x 10⁶
0
0.2
0.4
0.6
0.8
1
Number of cycles N
Effe
ctiv
e st
iffne
ss /
initi
al st
iffne
ss size 0.5size 1size 2
(a)
0 2 4 6 8 10x 105
0
0.2
0.4
0.6
0.8
1
Number of cycles N
Effe
ctiv
e st
iffne
ss /
initi
al st
iffne
ss size 0.5size 1size 2
(b)
0 1 2 3 4 5 6x 10⁵
0
0.2
0.4
0.6
0.8
1
Number of cycles N
Effe
ctiv
e st
iffne
ss /
initi
al st
iffne
ss size 0.5size 1size 2
(c)
Figure 5. Global stiffness decrease during displacement controlled fatigue tests at10˚C - 10 Hz for the three loading levels (a) 140 10-6 (b) 180 10-6(c) 220 10-6
6
leading to the specimen failure is characterized by an acceleration of the decreaserate.
First, it has to be pointed out, that the difference in void content (Fig. 3) has nosignificant effect on fatigue phenomenon and its effect is included in the general scatterof fatigue life. Then comparison can be done between the different specimen series.
On figure (5(c)) where the highest level (220 10−6) tests are plotted, the differentsets of different sizes are very clearly separated. The biggest the size, the shortest thefatigue life. This result is confirmed by figures (5(a),5(b)) for the lowest and mediumlevel. For those conditions, the discrimination between the different series, exists too,even if the sizes 0.5 and 1.0 are less discriminative. Nevertheless, the effect of the sizeseems to be more important with the increasing of the loading level.
3.2.2. Size effect on fatigue life
The fatigue life of each specimen is fixed to the number of loading cycles leadingto a 50% decrease of the sample stiffness.
Size effects are classically explored as the variation of a resistance parameter suchas material failure stress. Concerning fatigue on notched specimen, the crack propaga-tion speed is studied in terms of Paris law parameters (Carpinteri et al., 2004; Bazantet al., 1991). In our case dealing with the growth of a damaged zone from a smoothsurface, size effects exist but no models are available in the literature. As a first ap-proach for fatigue of asphalt mixture, we can explore the size effect on the number ofcycles to failure (fatigue life) of each specimen. The fatigue life is a relevant indicatorof the material resistance to fatigue but dependant on the loading level, so we willconsider each loading level as an independent specimen set.
To do so, this size effect is investigated by plotting, for each loading level, theaverage logarithm of fatigue life versus the size (figure 6(a)).
This plot is another illustration of the decrease of the fatigue life with the size ofthe sample characterized before. To see if this size effect is dependant on the loadinglevel, we propose to calculate the relative loss or profit in fatigue life for size 0.5 orsize 2.0 by comparison to size 1.0 experiments. The fatigue life ratios function of theloading level are gathered in table (figure 6(b)).
For size 0.5 the ratio is greater than one, this means an increase of fatigue life fromsize 1.0 to size 0.5. For these two sizes, the ratio appears to increase with the loadinglevel but this trend is not confirmed by results from size 1.0 to size 2.0. Fatigue lifedecreases with the increasing of size as shown by the ratio which is smaller than one.
However, even if this point had not been presented in details in this study, as it wasreported in (Bodin et al., 2004a) for tension compression fatigue tests, it is necessaryto recall that self heating of the specimen due to viscoelastic dissipation occurs duringfatigue tests and this phenomenum leads to a size effect which is superimposed andprobably coupled to the intrinsic material one.
7
0.5 1 2103
104
105
106
107
Specimen size : log(size)
Fatig
ue li
fe :
log(
NF(5
0%)
εmax = 140 10−6
εmax = 180 10−6
εmax = 220 10−6
level [10-6] Size0.5 1 2
140 1.1 1 0.42180 1.4 1 0.28220 1.9 1 0.39
(a) (b)
Figure 6. (a) Effect of the specimen size on the fatigue life - NF(50%) (b) ratio offatigue life for each size i to fatigue life for the reference size 1.0 for each loadinglevels
This last effect, leading to a material softening due to material temperature in-crease, is qualitatively in accordance with the increasing of the size effect with theincreasing of the loading level observed between the sizes 1.0 and 0.5.
To finalize the extensive study of size effect, the following section presents theeffect of the size on the fatigue Wöhler curve and thus on fatigue performances ofasphalt mixtures for pavement design.
3.2.3. Size effect on Wöhler curve
Wöhler curves consist in plotting the fatigue life versus the strain loading ampli-tude. It directly illustrates the effect of loading level on fatigue life. It can be remindedthat fatigue life is defined by the number of cycles required to reach a 50% decreaseof the normalized stiffness quoted NF (50%).
Concerning asphalt mixtures, classical fatigue models are based on a linear regres-sion in a log-log diagram based on a fatigue law which can be presented according tothe following equation :
NF (50%) = 106(
εa
ε6
)p
[1]
Where p is the fatigue line slope, ε6 the loading level leading to a fatigue life of106 cycles. This expression leads to a line in a log-log plot of fatigue life versus
8
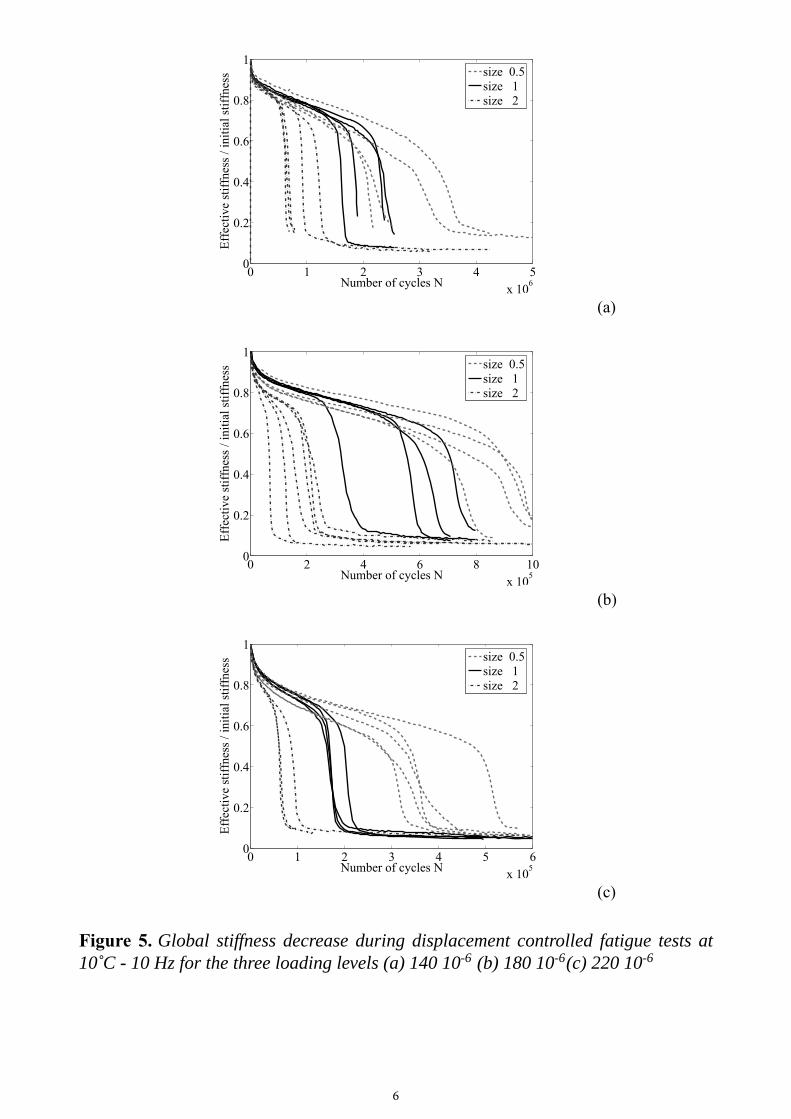
loading amplitude. With this expression (Eq. 1) the Wöhler curve is called the fatigueline. The fatigue line plots, for the different sizes, are presented figure 7(a).
140 180 220103
104
105
106
107
Strain amplitude εa (10−6)
Fatig
ue li
fe N
F (50%
)
size 0.5size 1.0size 2.0
0.5 1 2100
120
140
160
180
200
Size D/D0
ε 6 [10−6
]
(a) (b)
Figure 7. (a) Fatigue line fitted for each sample size - (b) Values and uncertainty ofε6 versus the size of the specimen sets
The fatigue line parameters for the different sizes are gathered in the table pre-sented below (Tab. 2). In order to compare the results, linear regression parame-ters are complemented with their confidence intervals calculated for a prediction 95%probability (Tomassone et al., 1992).
Table 2. Fatigue line parameters for each size sets
Some trends on the ε6 and the p values can be pointed out.
The fatigue slope p is not clearly dependant on the size taking the scattering andthe confidence interval into account. However, in previous works (Bodin, 2002) ithad been shown that the fatigue slope is dependant on the viscoelasticity induced selfheating under sinusoidal loading. That remark should induce an increase of the slopewith the specimen size. The small difference in slope between the small size 0.5 andthe medium size 1.0 is in accordance with that previous remark.
The value ε6 appears to be a function of the specimen size. It decreases with thesize. The confidence interval increases with the size, however the difference betweenthe three ε6 value is significative. This last observation is really important if the valueis used as a design limit of the maximal strain in the pavement layer. For the same
9
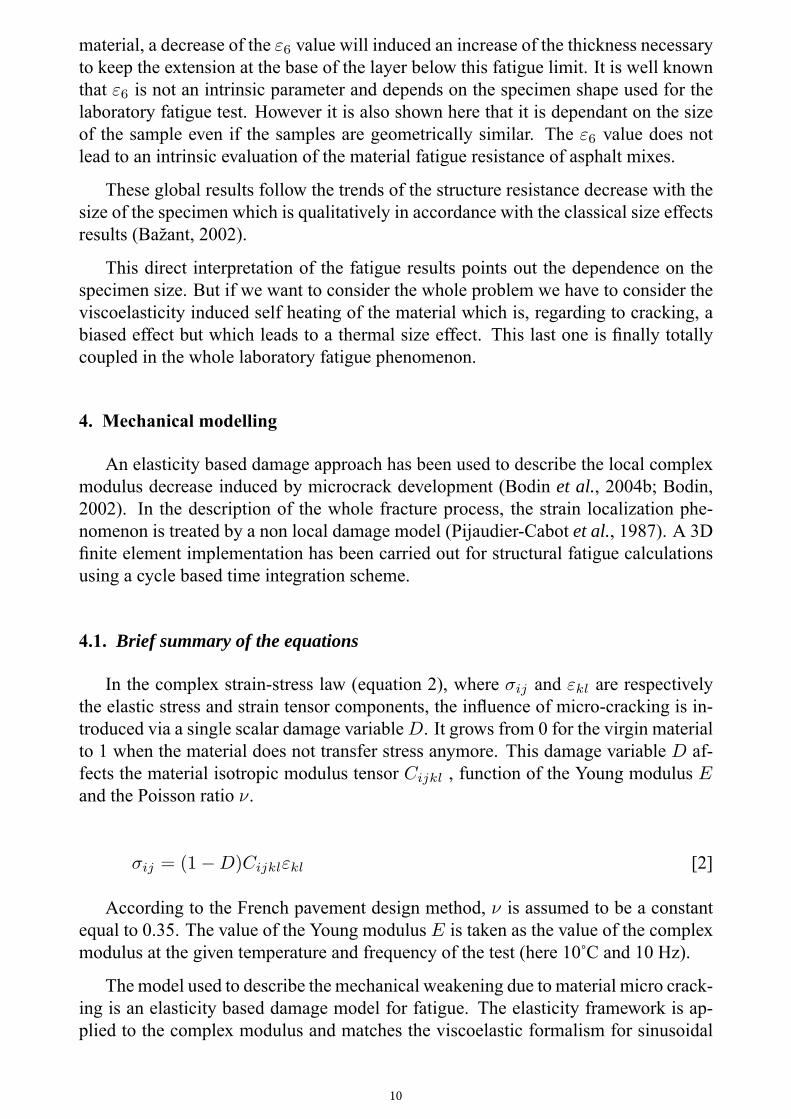
material, a decrease of the ε6 value will induced an increase of the thickness necessaryto keep the extension at the base of the layer below this fatigue limit. It is well knownthat ε6 is not an intrinsic parameter and depends on the specimen shape used for thelaboratory fatigue test. However it is also shown here that it is dependant on the sizeof the sample even if the samples are geometrically similar. The ε6 value does notlead to an intrinsic evaluation of the material fatigue resistance of asphalt mixes.
These global results follow the trends of the structure resistance decrease with thesize of the specimen which is qualitatively in accordance with the classical size effectsresults (Bazant, 2002).
This direct interpretation of the fatigue results points out the dependence on thespecimen size. But if we want to consider the whole problem we have to consider theviscoelasticity induced self heating of the material which is, regarding to cracking, abiased effect but which leads to a thermal size effect. This last one is finally totallycoupled in the whole laboratory fatigue phenomenon.
4. Mechanical modelling
An elasticity based damage approach has been used to describe the local complexmodulus decrease induced by microcrack development (Bodin et al., 2004b; Bodin,2002). In the description of the whole fracture process, the strain localization phe-nomenon is treated by a non local damage model (Pijaudier-Cabot et al., 1987). A 3Dfinite element implementation has been carried out for structural fatigue calculationsusing a cycle based time integration scheme.
4.1. Brief summary of the equations
In the complex strain-stress law (equation 2), where σij and εkl are respectivelythe elastic stress and strain tensor components, the influence of micro-cracking is in-troduced via a single scalar damage variable D. It grows from 0 for the virgin materialto 1 when the material does not transfer stress anymore. This damage variable D af-fects the material isotropic modulus tensor Cijkl , function of the Young modulus Eand the Poisson ratio ν.
σij = (1 − D)Cijklεkl [2]
According to the French pavement design method, ν is assumed to be a constantequal to 0.35. The value of the Young modulus E is taken as the value of the complexmodulus at the given temperature and frequency of the test (here 10˚C and 10 Hz).
The model used to describe the mechanical weakening due to material micro crack-ing is an elasticity based damage model for fatigue. The elasticity framework is ap-plied to the complex modulus and matches the viscoelastic formalism for sinusoidal
10
loading with an offset equal to zero. Evolution of damage is controlled by the strainstate of the material by a scalar equivalent strain. The strains induced by positiveprincipal stresses σi are assumed to lead to the damage growth as follows:
ε =
√√√√ ∑i=1,...,3
< σi >2
E(1 − D)where < x >=
12
(|x| + x) [3]
where E is the Young modulus of the virgin material.
For structural computation, the non-local enhancement of the presented model isused. It consists in replacing the equivalent strain value by the weighted average of thelocal equivalent strain taken over a region about the considered point: the non-localequivalent strain as follow:
ε =1
Vr(x)
∫Ω
Ψ(x − s)ε(s)ds avec Vr(x) =∫
Ω
Ψ(x − s)ds [4]
where Ω is the volume of the structure, Vr(x) is the representative volume at pointx and Ψ is the weight function chosen as a gaussian function
Ψ(x − s) = exp−4||x − s||2lc
2 [5]
The characteristic length lc is the internal length of the non local continuum. It isrelated to the microstructure of the material. It controls the size of damage localizationzone. For cement concrete, its value is given as a function of the maximal aggregatesize of the mix (Bazant et al., 1989).
For bituminous material, it has not yet being carefully determined but, accordingto experimental data, its value is fixed to three times the maximum aggregate sizeof the mix according to results on cementitious concrete. When the strain state ishomogeneous over the specimen, like in uniaxial tension or compression, the nonlocal equivalent strain (Eq. 4) is equal to the local equivalent strain (Eq. 3).
The rate of damage growth is defined as a function of this nonlocal equivalentstrain rate (Mazars et al., 1989):
D = f(D) εβ < ε > [6]
f(D) is a function of damage which is defined later on. The exponent β is a modelparameter. It is supposed to be a material parameter and it can be demonstrated that
11
−(β + 1) corresponds to the slope of the Wöhler curve in the log-log diagram. Itsvalue can be easily fitted on experimental data.
The three stage damage evolution law is given by Eq. 7.
f(D) =α2
α1α3
(D
α2
)1−α3
exp(
D
α2
)α3
[7]
α1, α2 and α2 are material parameters fitted on experimental data. This mathemat-ical form is expressed as the product of two different terms. The first one is a powerlaw factor. The second one leads to the phase II phase III transition.
The model is implemented in the finite element code Cast3M coupled to a jump incycle procedure to perform high cycle fatigue simulation without calculation of eachcycle. The meshes and the time algorithm parameters had been fixed according to(Bodin, 2002).
4.2. Size effect of the damage model
Fatigue test are simulated under isothermal assumption to estimate the size effectaccording to the nonlocal fatigue damage model.
Model parameters are fixed to the values evaluated in (Bodin, 2002) for similarmaterial but manufactured with a different 50/70 binder from the same origin. The ε6
for this material was 152 10-6 to be compared with 156 10-6 here (Tab. 2). The smalldifference in ε6 can be explained by the lower void content of the present material(3.2% (figure 3(b)) to be compared to 5% for the previous one) which leads to anincrease of ε6 around 3 10-6 per one percent void content (Moutier, 1991).
This void contents difference leads to an expected increase of fatigue life for thepresent material regarding the previous study. This trend is confirmed further by fig-ures 9 where the model leads to predictions with shorter fatigue lifes.
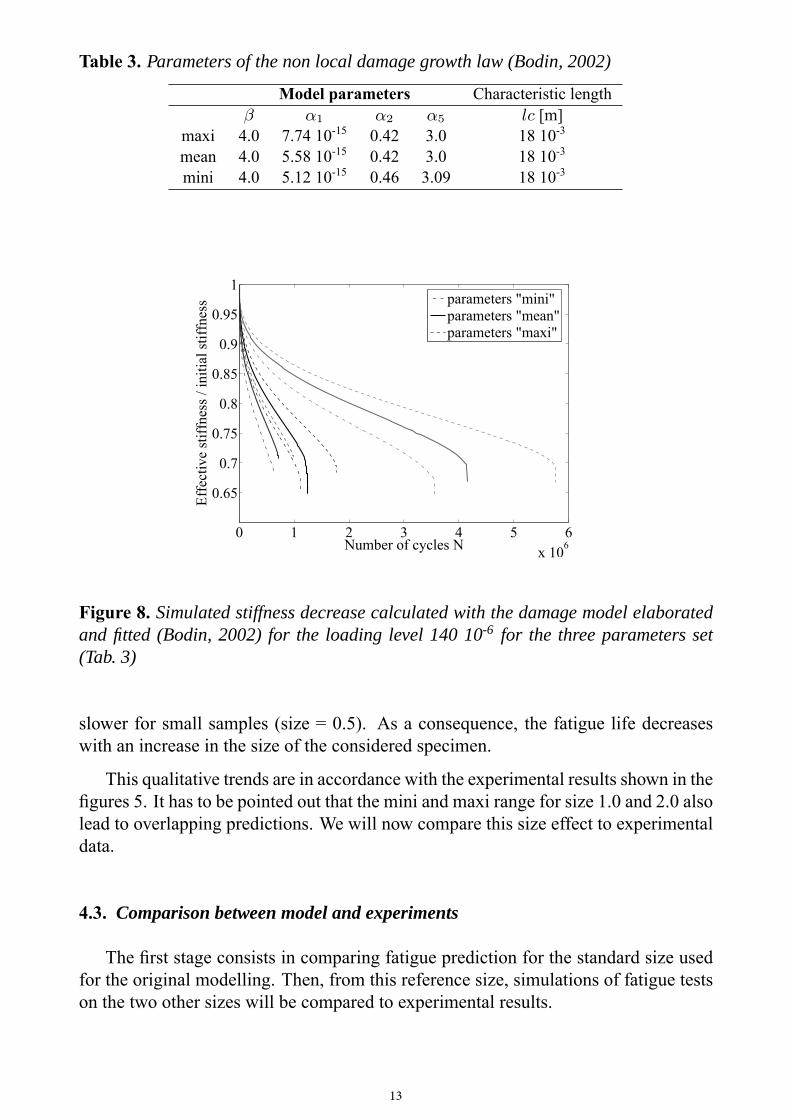
Three parameter sets have been fitted to take into account the experimental scatter-ing of experimental fatigue. They are gathered in the table 3 where the mean parameterset had been fitted considering the average experimental data. The maxi and the miniparameters set had been fitted on extreme experimental data obtained during this pre-vious work (Bodin, 2002). This method allows to estimate the consequences of thescatter of experimental data on fatigue predictions as shown in figure 8.
The effect of the size is illustrated on the stiffness decrease curves. The figure 8shows the results simulated at a loading level of 140 10-6.
The size effect of the non local damage model is characterized by different stiffnessdecrease curve for each specimen size. Compared to the standard size (size = 1), thefigure (8) shows that the stiffness decrease is faster for big samples (size = 2) and
12
Table 3. Parameters of the non local damage growth law (Bodin, 2002)
Model parameters Characteristic lengthβ α1 α2 α5 lc [m]
maxi 4.0 7.74 10-15 0.42 3.0 18 10-3
mean 4.0 5.58 10-15 0.42 3.0 18 10-3
mini 4.0 5.12 10-15 0.46 3.09 18 10-3
0 1 2 3 4 5 6x 10⁶
0.65
0.7
0.75
0.8
0.85
0.9
0.95
1
Number of cycles N
Effe
ctiv
e st
iffne
ss /
initi
al st
iffne
ss parameters "mini"parameters "mean"parameters "maxi"
Figure 8. Simulated stiffness decrease calculated with the damage model elaboratedand fitted (Bodin, 2002) for the loading level 140 10-6 for the three parameters set(Tab. 3)
slower for small samples (size = 0.5). As a consequence, the fatigue life decreaseswith an increase in the size of the considered specimen.
This qualitative trends are in accordance with the experimental results shown in thefigures 5. It has to be pointed out that the mini and maxi range for size 1.0 and 2.0 alsolead to overlapping predictions. We will now compare this size effect to experimentaldata.
4.3. Comparison between model and experiments
The first stage consists in comparing fatigue prediction for the standard size usedfor the original modelling. Then, from this reference size, simulations of fatigue testson the two other sizes will be compared to experimental results.
13
0 0.5 1 1.5 2 2.5x 10⁶
0
0.2
0.4
0.6
0.8
1
Number of cycles N
Effe
ctiv
e st
iffne
ss /
initi
al st
iffne
ss
(a)
0 1 2 3 4 5 6 7x 10⁵
0
0.2
0.4
0.6
0.8
1
Number of cycles N
Effe
ctiv
e st
iffne
ss /
initi
al st
iffne
ss
(b)
0 0.5 1 1.5 2x 10⁵
0
0.2
0.4
0.6
0.8
1
Number of cycles N
Effe
ctiv
e st
iffne
ss /
initi
al st
iffne
ss
(c)
Figure 9. Comparison of the model prediction with experimental data for the standardspecimen size 1.0 for the three loading levels : (a) level 140 10-6, (b) level 180 10-6
and (c) level 220 10-6
14
0 1 2 3 4 5x 10⁶
0.5
0.6
0.7
0.8
0.9
1
Number of cycles N
Effe
ctiv
e st
iffne
ss /
initi
al st
iffne
ss size 0.5 (exp.)size 0.5 (model)
(a)
0 0.5 1 1.5 2 2.5 3x 10⁶
0.5
0.6
0.7
0.8
0.9
1
Number of cycles N
Effe
ctiv
e st
iffne
ss /
initi
al st
iffne
ss size 1.0 (exp.)size 1.0 (model)
(b)
0 5 10 15x 105
0.5
0.6
0.7
0.8
0.9
1
Number of cycles N
Effe
ctiv
e st
iffne
ss /
initi
al st
iffne
ss size 2.0 (exp.)size 2.0 (model)
(c)
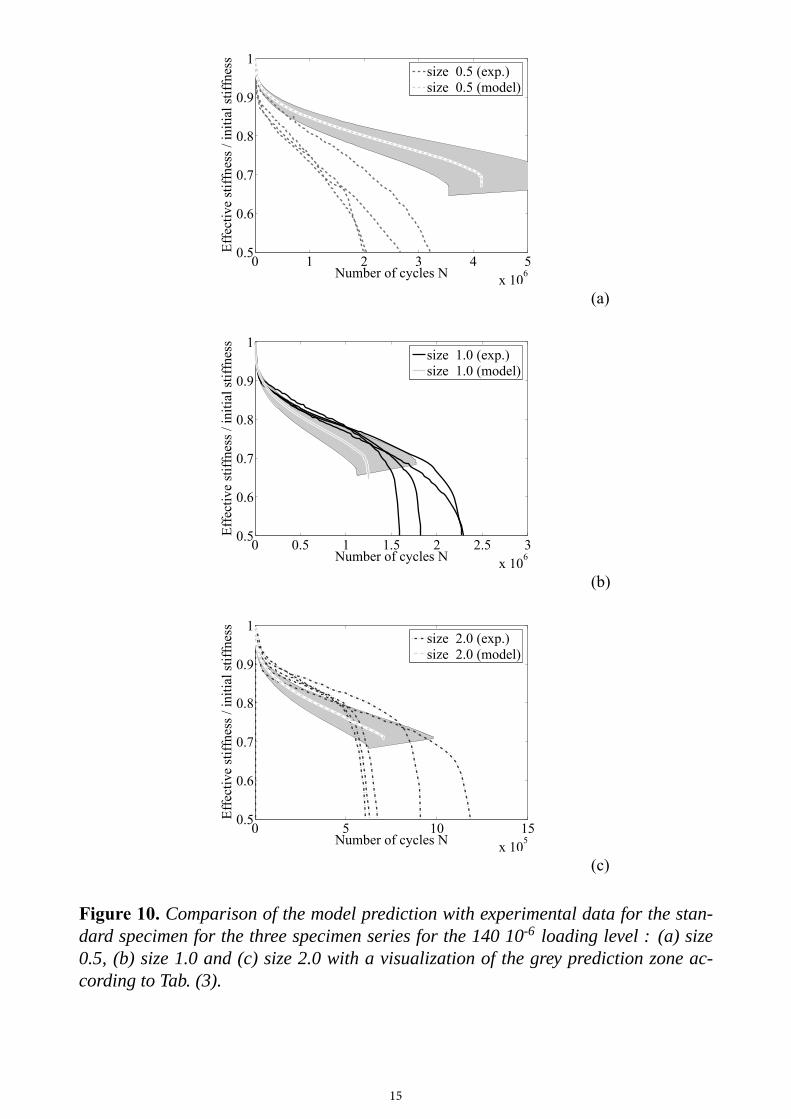
Figure 10. Comparison of the model prediction with experimental data for the stan-dard specimen for the three specimen series for the 140 10-6 loading level : (a) size0.5, (b) size 1.0 and (c) size 2.0 with a visualization of the grey prediction zone ac-cording to Tab. (3).
15
4.3.1. Comparison for size 1.0
Before the comparison of the fatigue prediction for the different size, the fatigueprediction has been evaluated on the standard size (size 1.0) in order to see if the modelfitted during another study is still predictive for the present asphalt mixture differingonly on the binder year of fabrication and the compaction protocol. Figures 9 presentthe superposition of size effect experimental data for the three loading levels with theprediction of the nonlocal fatigue damage model. The green line are the prediction ofthe model using the average parameter set (Tab. 3) and the prediction zone in grey isbounded by the predictions using the two maxi and mini parameter sets.
The model allows an acceptable prediction of the experimental data, even if a lightsystematic difference leads to an earlier failure for the model which can be due to ma-terial compacity difference as explained earlier. In consideration of this, model pre-dictions are close to experimental measurements, what allows to compare the trendsof modelling size effects compared to experimental observations.
4.3.2. Model size effect compared to experimental data
On figures 10 nonlocal fatigue damage simulations are plotted in green superim-posed to experimental data for the three tested sizes. To stay closer to the isothermalassumption, only the lowest loading level (140 10-6) is presented.
Considering size 1.0, results are the same than on figure 9(a). The two dotted greenlines are plotted with simulated data for the sizes 0.5 and 2.0.
We observe that fatigue life is well predicted for the size 2.0 and the distancebetween model and experiment grows with the decreasing of the size. For the smallestsize, the model predicts a failure for a larger number of cycles than it is observed inthe lab. This trend on the lowest level is confirmed on fatigue lines presented in thenext section.
4.3.3. Size effect on fatigue line
To achieve the study of comparison between the nonlocal fatigue model and exper-imental results the comparison of Wöhler curves for the three size allows to summarizethe differences between model prediction and experimental data.
Figure 11 illustrates the model fatigue lines with a visualization of the predictionzone (three sets of model parameters given table 3) given by the errorbars for the threeloading levels.
Model agreement is better for large samples with a fatigue line very close to ex-perimental data. For the other sizes the differences between model and experimentaldata grows with the decreasing of the size. However for the size 1.0 experimental dataare included in the model prediction zone. For size 0.5 the model leads to a systematicoverevaluation of the fatigue life.
Figure 11. Comparison of model predictions (pred.) and experiment (exp.) fatigueline for each size.
At this stage and before going further in the analysis, these observations have to beenlightened by the consequences of the model assumption. The following discussionhighlights effects of neglecting thermal softening and the consequence of the internallength choice.
4.3.4. Discussion and prospects on the model size effect
Viscoelastic dissipation and the material softening due to thermal increase mayaffect the fatigue response. As reported for tension compression test on cylinder whichexhibit large thermal effect due to the shape of the specimen (Bodin et al., 2004a), thefatigue life may be affected by the coupling between damage and thermal softening.The effect is neglectible for low loading levels but, in this case may decrease thefatigue of more than 50% for high loading levels.
This effect also exists for bending test even if its effect is lower due to the testgeometry. Nevertheless, the evaluation of this complex phenomenon needs to solvethe completely transient thermomechanical problem coupled with damage.
Nevertheless, an estimation of the expected thermal effect can be calculated ac-cording to numerical modelling (de La Roche et al., 1998; Bodin, 2002). For dis-placement controlled test and without damage, the balance between dissipated energyand exchanges through the specimen boundaries leads to a permanent state. For thisstate the temperature field in the specimen leads to a global stiffness decrease. Therelative stiffness decrease in percent characterize this thermal effect. For all the testedconditions simulation results are gathered in table 4.
17
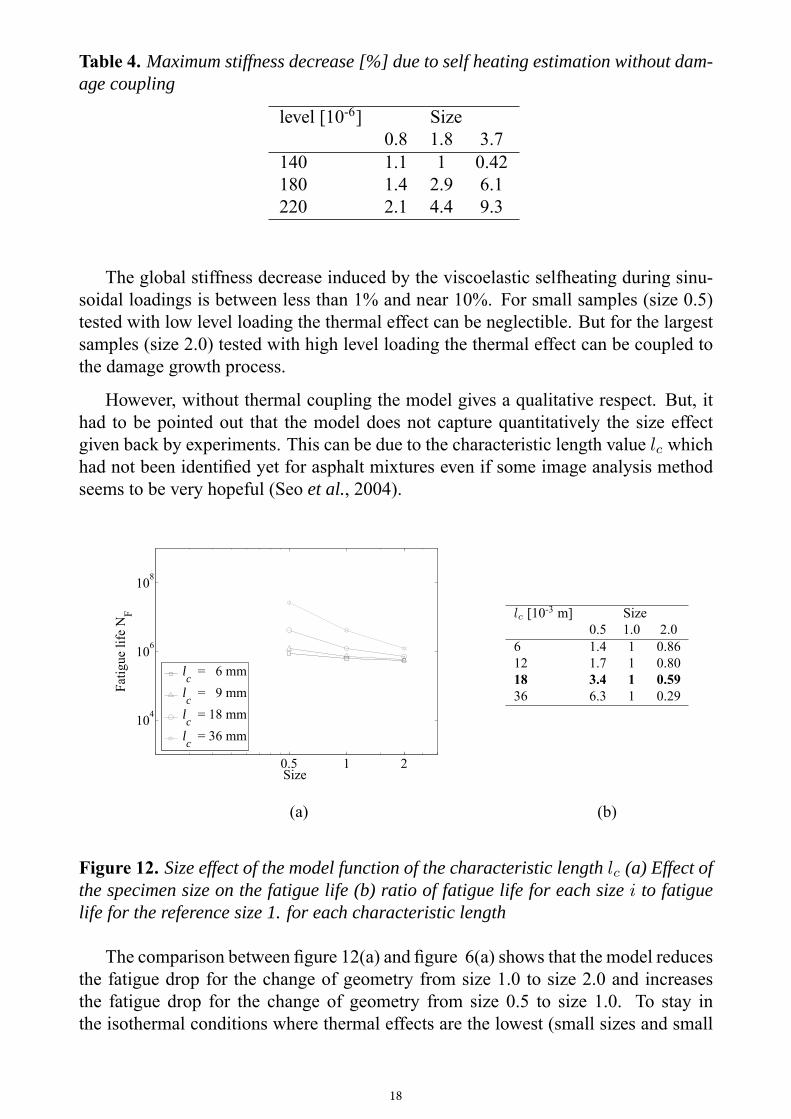
Table 4. Maximum stiffness decrease [%] due to self heating estimation without dam-age coupling
level [10-6] Size0.8 1.8 3.7
140 1.1 1 0.42180 1.4 2.9 6.1220 2.1 4.4 9.3
The global stiffness decrease induced by the viscoelastic selfheating during sinu-soidal loadings is between less than 1% and near 10%. For small samples (size 0.5)tested with low level loading the thermal effect can be neglectible. But for the largestsamples (size 2.0) tested with high level loading the thermal effect can be coupled tothe damage growth process.
However, without thermal coupling the model gives a qualitative respect. But, ithad to be pointed out that the model does not capture quantitatively the size effectgiven back by experiments. This can be due to the characteristic length value lc whichhad not been identified yet for asphalt mixtures even if some image analysis methodseems to be very hopeful (Seo et al., 2004).
Figure 12. Size effect of the model function of the characteristic length lc (a) Effect ofthe specimen size on the fatigue life (b) ratio of fatigue life for each size i to fatiguelife for the reference size 1. for each characteristic length
The comparison between figure 12(a) and figure 6(a) shows that the model reducesthe fatigue drop for the change of geometry from size 1.0 to size 2.0 and increasesthe fatigue drop for the change of geometry from size 0.5 to size 1.0. To stay inthe isothermal conditions where thermal effects are the lowest (small sizes and small
18
levels) better agreement between the model size effect and experimental size effectshould be obtained for characteristic length lc lower than 18 mm chosen accordingcementitious concrete under monotonic loadings. However for small values of lc thesize effect between size 1.0 and size 2.0 will be lower than experimental data. Nev-ertheless, for size 2.0 samples thermal effects are greater and may lead to prematurefailure which are not captured in isothermal conditions.
Without any quantification, we can conclude that effect of the characteristic lengthis important. Experimental results leads us to suppose that its value is smaller thanthree time the maximal aggregate size if thermal effects are correctly taken into ac-count in the analysis.
5. Conclusion
The study of the influence of the cantilever beam size in bending fatigue showsthe effect of the size on fatigue characterization of asphalt mixes. Tested specimen aregeometrically similar, and for specimen tested at the same loading level, the stiffnessdecrease vs the number of cycles is faster when the size is bigger. In terms of fatiguelife : the biggest the sample, the shortest the fatigue life (number of cycles to failure).
The nonlocal fatigue damage model leads to a dependency of the fatigue resultswith the specimen size. For the model, the fatigue life decreases with the increasingof the specimen size. These qualitative trends are conform to size effect experimentalresults. To extend the conclusions, the thermal softening due to viscolestacity inducedheating need to be considered coupled to the damage process. Future size effectsstudies should give a way to calibrate the characteristic length lc using an inversefitting method like it has been achieve for cementitious concrete (Bellégo et al., 2003).
These results highlight once again that even if fatigue damage is intrinsic consid-ered at the material local scale, fatigue tests results strongly depend on the samplegeometry and its size even if tested specimens are geometrically similar.
If the size effect is confirmed by other studies, a practical outcome is conceivable toevaluate fatigue performances on smaller specimens sawn from cores extracted frompavements
6. Bibliography
Bazant Z. P., Scaling of Structural Strength, Hermes Penton Science, London, 2002.Bazant Z. P., Pijaudier-Cabot G., “ Measurement of Characteristic Length of Nonlocal Contin-
uum”, Journal of Engineering Mechanics, Vol. 115, No 4, p. 755-767, april, 1989.Bazant Z. P., Xu K., “ Size effect in fatigue of concrete”, ACI Material Journal, Vol. 88, No 4,
p. 390-399, july-august, 1991.Bellégo C. L., Dubé J.-F., Cabot G. P., Gérard B., “ Calibration of Non Local Model from size
effects Tests”, European Journal of Mechanics - A/Solids, Vol. 22, No 1, p. 33-46, 2003.
19
Benedetto H. D., de La Roche C., Baaj H., Pronk A., Lundstrom R., “ Fatigue of bitumi-nous mixtures : Different approches and Rilem group contribution”, proceedings of the 6 th
International RILEM Symposium on Performance Testing and Evaluation of BituminousMaterials, Zurich, Switzerland, 14-16 April, 2003.
Bodin D., Modèle d’endommagement par fatigue : Application aux enrobés bitumineux, Thèsede doctorat, École Centrale de Nantes, Nantes, France, Décembre, 2002.
Bodin D., Belzung F., de La Roche C., Chabot A., “ Thermomechanical modelling for fatiguedamage of bituminous materials”, proceedings of the 5 th International RILEM Conference- Cracking in Pavements, Limoge, France, 5-7 May, 2004a.
Bodin D., Pijaudier-Cabot G., de La Roche C., Piau J.-M., Chabot A., “ A continuum damageapproach to asphalt concrete fatigue Modelling”, Journal of Engineering Mechanics, ASCE,Vol. 130, No 6, p. 700-708, June, 2004b.
Carpinteri A., Spagnoli A., “ A fractal analysis of size effect on fatigue crack growth”, Interna-tional Journal of Fatigue, Vol. 26, No 2, p. 125-133, 2004.
da Vinci L., Les manuscrits de Léonard de Vinci, vol. 3, transl. in French by C. Ravaisson-Mollien, Institut de France, Paris, 1881-91.
de La Roche C., Module de rigidité et comportement en fatigue des enrobés bitumineux. Expéri-mentations et nouvelles perspectives d’analyse., Thèse de doctorat, Ecole Centrale Paris,Paris - France, novembre, 1996.
de La Roche C., Piau J.-M., Dangla P., “ Thermal effects induced by viscoelastic dissipationduring fatigue tests on bituminous mixtures”, Proceedings of the 6th International Sympo-sium On Creep and Coupled Process - sept. 23-25, Bialowieza, Poland, 1998.
Doan T. H., Recherche en fatigue des enrobés bitumineux, Document interne, L.C.P.C., 1973.Galileo G. L., Discorsi i Demonstrazioni Matematiche intorno à due Nuovo Science, 1638.Lundstrom R., Benedetto H. D., Isacsson U., “ Influence of Asphalt Mixture Stiffness on Fatigue
Failure”, Journal of Material in Civil Engineering, Vol. 16, No 6, p. 516-525, december,2004.
Mazars J., Pijaudier-Cabot G., “ Continuum damage theory - Application to concrete”, Interna-tional Journal of Engineering mechanics, Vol. 115, No 2, p. 345-365, february, 1989.
Moutier F., “ Étude statistique de l’effet de la composition des enrobés bitumineux sur leurcomportement en fatigue et leur module complexe”, Bulletin de Liaison des Laboratoiresdes Ponts et Chaussées, Vol. 172, p. 71-79, 1991.
Pijaudier-Cabot G., Bazant Z. P., “ Nonlocal damage theory”, Journal of Engineering Mechan-ics, Vol. 113, No 10, p. 1512-1533, oct., 1987.
Seo Y., Kim Y. R., “ The mechanical testing of asphalt concrete mixtures using digital iamgecorrelations”, proceedings of the 5 th International RILEM Conference - Cracking in Pave-ments, Limoge, France, 5-7 May, 2004.
SHRP C., Fatigue Response of Asphalt Aggregate Mixes, Strategic Highway Research Program(SHRP), Washington, D.C. 1994.
Tomassone R., Audrain S., de Turckheim E. L., Millier C., La régression - Méthode statistique,Masson - Actualités INRA, Paris, 1992.