In the past, PV systems were mainly installed to feed the generated electricity into the electricity grid, which was remunerated with feed-in tariffs. However, in the beginning of 2012, the feed-in tariffs for PV systems below 10 kWp undercut the retail electricity prices for households in Germany [1]. With the increasing spread between PV feed-in tariffs and prices of grid electricity, using the PV generated electricity on-site on the household level is becoming more attractive than feeding it into the grid. Nevertheless, the simultaneity of the PV generation and load consumption in private households is limited. Shifting the consumption of deferrable loads by demand-side management to periods with PV surpluses is one solution to increase the local self-consumption of PV electricity in the residential sector [2]. The conjunction of PV systems with storage batteries allows a further increase of self-
Johannes Weniger et al. / Energy Procedia 46 ( 2014 ) 78 – 87 79
consumed PV electricity. With a battery system, the excess PV electricity during the day is buffered and later used at night. In this way, households equipped with a PV battery system can reduce the energy drawn from the grid and therefore increase their self-sufficiency.
In this paper residential PV battery systems will be analysed by simulations in order to gain insights into their sizing. In the next section the simulation model and the used input data are described. Afterwards, a sensitivity analysis is conducted varying the size of the PV battery system to identify appropriate system configurations. Finally, an economic assessment of residential PV battery systems is conducted to derive recommendations for cost-optimal sizing.
2. Approach
In order to analyse the energy flows of a household equipped with a PV battery system, a simulation model was developed. Both meteorological and load demand data sets were used as input for the simulation.
2.1. Input Data
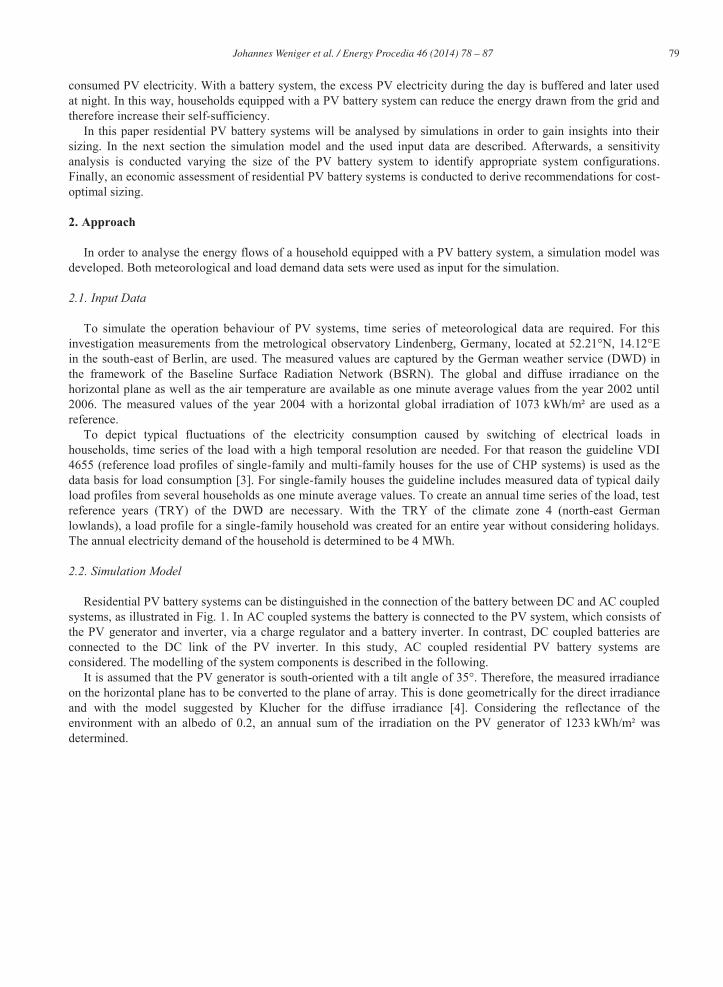
To simulate the operation behaviour of PV systems, time series of meteorological data are required. For this investigation measurements from the metrological observatory Lindenberg, Germany, located at 52.21°N, 14.12°E in the south-east of Berlin, are used. The measured values are captured by the German weather service (DWD) in the framework of the Baseline Surface Radiation Network (BSRN). The global and diffuse irradiance on the horizontal plane as well as the air temperature are available as one minute average values from the year 2002 until 2006. The measured values of the year 2004 with a horizontal global irradiation of 1073 kWh/m² are used as a reference.
To depict typical fluctuations of the electricity consumption caused by switching of electrical loads in households, time series of the load with a high temporal resolution are needed. For that reason the guideline VDI 4655 (reference load profiles of single-family and multi-family houses for the use of CHP systems) is used as the data basis for load consumption [3]. For single-family houses the guideline includes measured data of typical daily load profiles from several households as one minute average values. To create an annual time series of the load, test reference years (TRY) of the DWD are necessary. With the TRY of the climate zone 4 (north-east German lowlands), a load profile for a single-family household was created for an entire year without considering holidays. The annual electricity demand of the household is determined to be 4 MWh.
2.2. Simulation Model
Residential PV battery systems can be distinguished in the connection of the battery between DC and AC coupled systems, as illustrated in Fig. 1. In AC coupled systems the battery is connected to the PV system, which consists of the PV generator and inverter, via a charge regulator and a battery inverter. In contrast, DC coupled batteries are connected to the DC link of the PV inverter. In this study, AC coupled residential PV battery systems are considered. The modelling of the system components is described in the following.
It is assumed that the PV generator is south-oriented with a tilt angle of 35°. Therefore, the measured irradiance on the horizontal plane has to be converted to the plane of array. This is done geometrically for the direct irradiance and with the model suggested by Klucher for the diffuse irradiance [4]. Considering the reflectance of the environment with an albedo of 0.2, an annual sum of the irradiation on the PV generator of 1233 kWh/m² was determined.
80 Johannes Weniger et al. / Energy Procedia 46 ( 2014 ) 78 – 87
Fig. 1. System layout of AC coupled (a) and DC coupled (b) residential PV battery systems
To depict the impact of the irradiance on the efficiency of the PV generator, an efficiency curve of a multi-crystalline PV module was used. The increase of the PV generator temperature above the ambient temperature is assumed to be 29 °C for an irradiance of 1000 W/m², which is appropriate for rooftop systems with good ventilation. The thermal inertia of the PV generator was depicted with a PT1 element and a thermal time constant of 10 minutes [5]. The decrease of the PV power output due to increasing temperatures of the PV generator compared to the temperature of 25 °C is set to -0.4%/°C. Further PV generator losses of 8% are considered with empirical factors [6]. Additionally, average losses due to power degradation over 20 years are assumed to be 2%.
The dependence of the PV inverter conversion efficiency on the power output of the PV generator is considered with a parametric model [7]. The required model parameters are determined from data sheet specifications of a transformer-less inverter with a maximum conversion efficiency of 97%. The nominal power of the PV inverter is set to 1 kW/kWp. These models and assumptions result in an annual energy output of the PV system of 1024 kWh/kWp and a performance ratio of 83%.
In this study a lithium-based battery system is considered. The batteries are modelled with a simplified approach, considering a mean watt-hour efficiency of 95%. It should be noted that this neglects the dependence of the efficiency on several factors of influence like the discharging power, the temperature and the battery age. The state of charge of the battery is restricted to a range between 20% and 80% of the nominal battery capacity. Therefore, only a share of 60% of the installed battery capacity is usable. Hence, in this investigation all specifications of the battery size refer to the usable battery capacity.
Basically, the ageing of the battery leads to a decrease in battery capacity. The lifetime of a battery is defined as the period of time in which the capacity is reduced to 80% of the initial capacity [8]. Therefore, it is assumed that 90% of the usable battery capacity is indeed utilised within the lifetime on average.
The losses of the battery inverter are considered with a constant efficiency factor of 94%. This implies that the power dependent losses of the battery converter are not taken into account. The battery charge and discharge power normalised to the usable battery capacity is limited to 1 kW/kWh. The quotient of the energy output and the energy input on the AC side of the battery system is 84%.
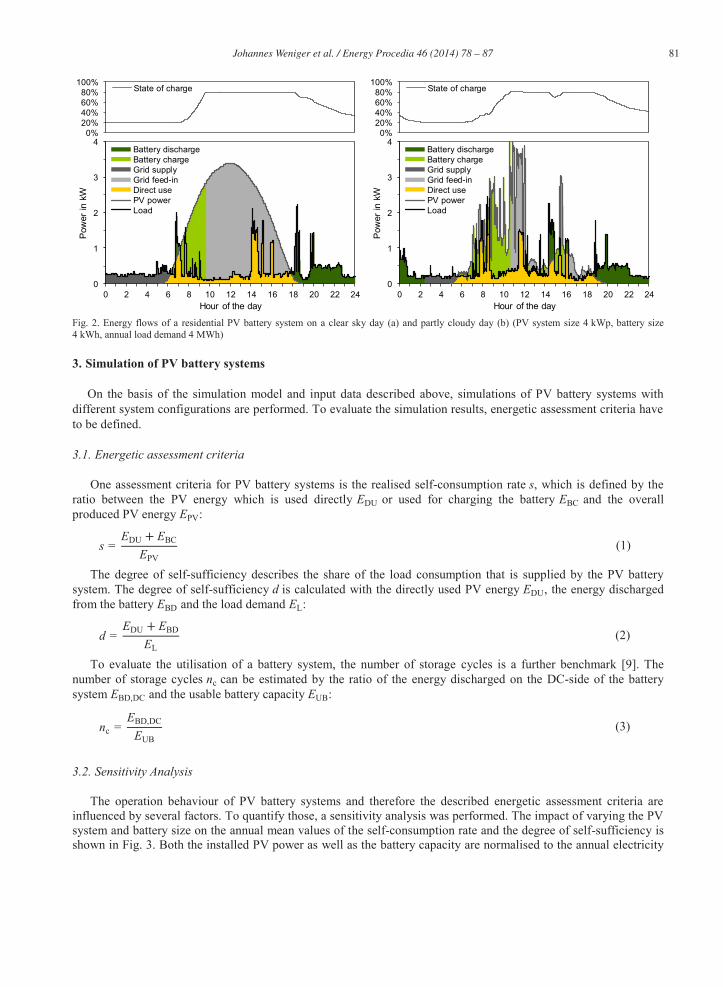
Considering the simulation model described before, the system behaviour of a residential PV battery system is displayed for two example days in Fig. 2. The PV generation on a typical clear sky day is represented in Fig. 2a. The fluctuations of the PV power in Fig. 2b are caused by passing clouds. In general, the load with peaks during the day is influenced by the user behaviour and by the domestic appliances. The PV power output which can be consumed by the load at the same time is used directly on-site. In the case in which the PV power exceeds the load, surpluses occur. As long as the battery does not reach the maximum state of charge, the resulting excess PV power will be used for charging the battery, restricted by the battery inverter power. Otherwise, the surplus PV power will be fed into the grid. In the case in which the load exceeds the generated PV power, the battery is discharged until the minimum state of charge is reached. The remaining load is covered by energy drawn from the grid.
PV generator
PV inverter
Loads
Controlunit
=Charge regulatorand inverter
== M
PPT
AC
DC =
== B
AT
AC
DC
Circuit breaker
Battery
888.888kWh Energy meter
Grid
PV generator
Loads
Controlunit
Charge regulator=
BAT
Circuit breaker
Battery
888.888kWh Energy meter
Grid
== M
PPT
=
AC
DC
== B
AT
Johannes Weniger et al. / Energy Procedia 46 ( 2014 ) 78 – 87 81
Fig. 2. Energy flows of a residential PV battery system on a clear sky day (a) and partly cloudy day (b) (PV system size 4 kWp, battery size 4 kWh, annual load demand 4 MWh)
3. Simulation of PV battery systems
On the basis of the simulation model and input data described above, simulations of PV battery systems with different system configurations are performed. To evaluate the simulation results, energetic assessment criteria have to be defined.
3.1. Energetic assessment criteria
One assessment criteria for PV battery systems is the realised self-consumption rate , which is defined by the ratio between the PV energy which is used directly or used for charging the battery and the overall produced PV energy :
(1)
The degree of self-sufficiency describes the share of the load consumption that is supplied by the PV battery system. The degree of self-sufficiency is calculated with the directly used PV energy , the energy discharged from the battery and the load demand :
(2)
To evaluate the utilisation of a battery system, the number of storage cycles is a further benchmark [9]. The number of storage cycles can be estimated by the ratio of the energy discharged on the DC-side of the battery system and the usable battery capacity :
(3)
3.2. Sensitivity Analysis
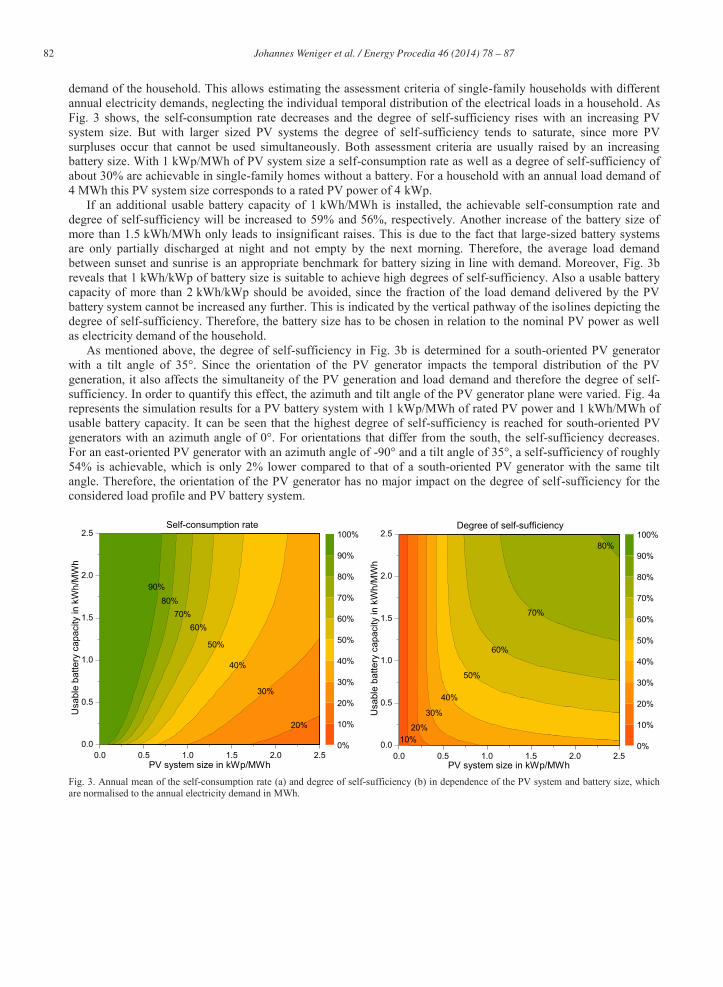
The operation behaviour of PV battery systems and therefore the described energetic assessment criteria are influenced by several factors. To quantify those, a sensitivity analysis was performed. The impact of varying the PV system and battery size on the annual mean values of the self-consumption rate and the degree of self-sufficiency is shown in Fig. 3. Both the installed PV power as well as the battery capacity are normalised to the annual electricity
82 Johannes Weniger et al. / Energy Procedia 46 ( 2014 ) 78 – 87
demand of the household. This allows estimating the assessment criteria of single-family households with different annual electricity demands, neglecting the individual temporal distribution of the electrical loads in a household. As Fig. 3 shows, the self-consumption rate decreases and the degree of self-sufficiency rises with an increasing PV system size. But with larger sized PV systems the degree of self-sufficiency tends to saturate, since more PV surpluses occur that cannot be used simultaneously. Both assessment criteria are usually raised by an increasing battery size. With 1 kWp/MWh of PV system size a self-consumption rate as well as a degree of self-sufficiency of about 30% are achievable in single-family homes without a battery. For a household with an annual load demand of 4 MWh this PV system size corresponds to a rated PV power of 4 kWp.
If an additional usable battery capacity of 1 kWh/MWh is installed, the achievable self-consumption rate and degree of self-sufficiency will be increased to 59% and 56%, respectively. Another increase of the battery size of more than 1.5 kWh/MWh only leads to insignificant raises. This is due to the fact that large-sized battery systems are only partially discharged at night and not empty by the next morning. Therefore, the average load demand between sunset and sunrise is an appropriate benchmark for battery sizing in line with demand. Moreover, Fig. 3b reveals that 1 kWh/kWp of battery size is suitable to achieve high degrees of self-sufficiency. Also a usable battery capacity of more than 2 kWh/kWp should be avoided, since the fraction of the load demand delivered by the PV battery system cannot be increased any further. This is indicated by the vertical pathway of the isolines depicting the degree of self-sufficiency. Therefore, the battery size has to be chosen in relation to the nominal PV power as well as electricity demand of the household.
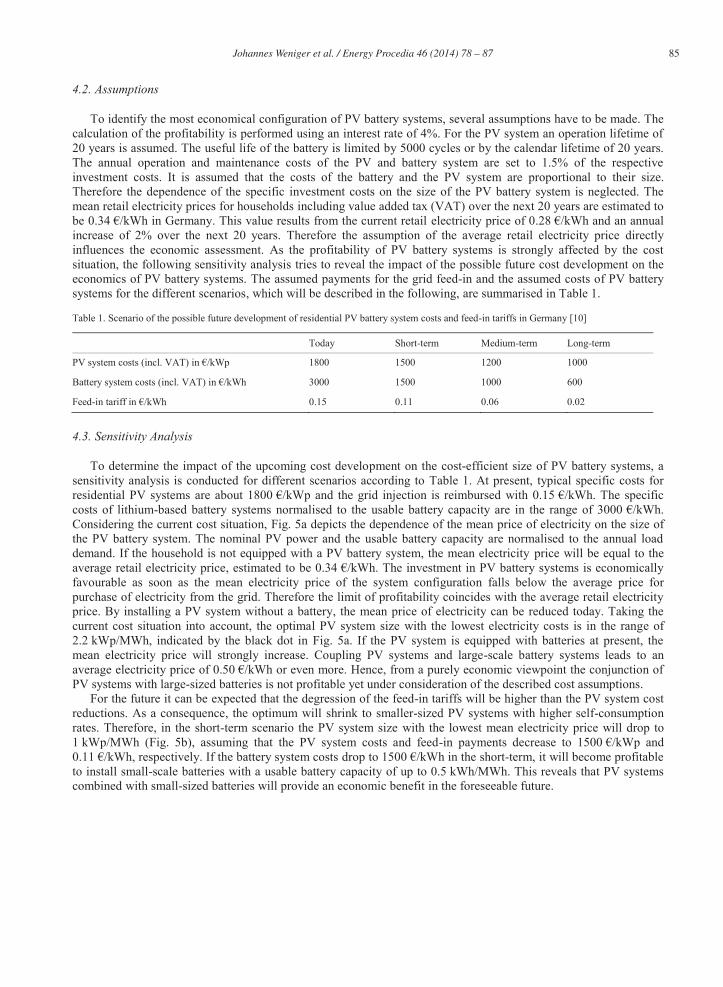
As mentioned above, the degree of self-sufficiency in Fig. 3b is determined for a south-oriented PV generator with a tilt angle of 35°. Since the orientation of the PV generator impacts the temporal distribution of the PV generation, it also affects the simultaneity of the PV generation and load demand and therefore the degree of self-sufficiency. In order to quantify this effect, the azimuth and tilt angle of the PV generator plane were varied. Fig. 4a represents the simulation results for a PV battery system with 1 kWp/MWh of rated PV power and 1 kWh/MWh of usable battery capacity. It can be seen that the highest degree of self-sufficiency is reached for south-oriented PV generators with an azimuth angle of 0°. For orientations that differ from the south, the self-sufficiency decreases. For an east-oriented PV generator with an azimuth angle of -90° and a tilt angle of 35°, a self-sufficiency of roughly 54% is achievable, which is only 2% lower compared to that of a south-oriented PV generator with the same tilt angle. Therefore, the orientation of the PV generator has no major impact on the degree of self-sufficiency for the considered load profile and PV battery system.
Fig. 3. Annual mean of the self-consumption rate (a) and degree of self-sufficiency (b) in dependence of the PV system and battery size, which are normalised to the annual electricity demand in MWh.
0.0 0.5 1.0 1.5 2.0 2.50.0
0.5
1.0
1.5
2.0
2.5
90%
20%
30%
40%
50%
60%70%
80%
PV system size in kWp/MWh
Usa
ble
batte
ry c
apac
ity in
kW
h/M
Wh
0%
10%
20%
30%
40%
50%
60%
70%
80%
90%
100%Self-consumption rate
0.0 0.5 1.0 1.5 2.0 2.50.0
0.5
1.0
1.5
2.0
2.5
10%20%
30%
40%
50%
60%
70%
80%
PV system size in kWp/MWh
Usa
ble
batte
ry c
apac
ity in
kW
h/M
Wh
0%
10%
20%
30%
40%
50%
60%
70%
80%
90%
100%Degree of self-sufficiency
Johannes Weniger et al. / Energy Procedia 46 ( 2014 ) 78 – 87 83
Fig. 4. (a) Annual mean of the degree of self-sufficiency in dependence of the orientation of the PV generator (PV system size 1 kWp/MWh, battery size 1 kWh/MWh); (b) Number of storage cycles per year in dependence of the rated PV power and usable battery size, which are normalised to the annual electricity demand in MWh.
Besides the degree of self-sufficiency and the self-consumption rate, the number of storage cycles is a further benchmark. Also the annual number of storage cycles is strongly affected by the size of the PV battery system, as can be seen in Fig. 4b. In general, batteries in combination with small-sized PV systems only have few cycles and reach less than 150 cycles per year. This is because with small-scale PV systems only a few PV surpluses occur, which can be used to charge the battery. With an increasing PV system size the surplus PV energy rises and therefore also the number of cycles. A PV battery system with 1 kWp/MWh of PV power and 1 kWh/MWh of usable battery capacity reaches about 270 cycles a year. The highest annual number of storage cycles occurs in system configurations with a small battery capacity. Therefore the time period until reaching the maximum number of storage cycles is lower for small-scale battery systems than for larger sized systems. This indicates that the cycle lifetime of the battery is also highly affected by the system configuration.
It must be emphasized that all results presented above are influenced by the system technology, the used simulation models and input data as well as constraints. Especially the temporal distribution of the load demand and the PV generation has an impact on the energetic assessment criteria. The load profiles vary not only with the type of household but also with the domestic appliances the household is equipped with. Nevertheless, the presented simulation results can give an indication to estimate the energetic assessment criteria for PV battery systems in single-family houses in Germany.
4. Sizing of PV battery systems
After the energetic assessment of PV battery systems, different configurations are evaluated from the economic perspective. To identify the cost-optimal ratio of PV system and battery size, assessment criteria have to be defined.
4.1. Economic assessment criteria
The economic evaluation is performed using the annuity method. The annuity describes the annual payments of an investment including interest charges and repayments for an amortisation of the investment within a defined time period. The annuity factor is defined by the interest rate and the investment duration as:
-90° -60° -30° 0° 30° 60° 90°0°
10°
20°
30°
40°
50°
60°
70°
80°
90°
54%
52%
53%
55%
56%
Degree of self-sufficiency
Azimuth angle
Tilt
angl
e
45%46%47%48%49%50%51%52%53%54%55%56%57%58%59%60%
0.0 0.5 1.0 1.5 2.0 2.5
0.5
1.0
1.5
2.0
2.5
350
50
100150
200
250
300
PV system size in kWp/MWh
Usa
ble
batte
ry c
apac
ity in
kW
h/M
Wh
0
50
100
150
200
250
300
350
400
450
500
550Annual number of storage cycles
84 Johannes Weniger et al. / Energy Procedia 46 ( 2014 ) 78 – 87
(4)
For a PV system the investment duration coincides with the operation lifetime of the system. The annual costs of the PV system are given by
(5)
using the annuity factor of the PV investment, the annual operation and maintenance costs normalised to the investment cost, the specific PV investment cost and the PV system size . Similarly, the annual costs of the battery system are calculated as
(6)
using the annuity factor of the battery investment, the annual operation and maintenance costs normalised to the investment cost, the specific battery investment cost and the usable battery capacity . To calculate the annuity factor of the battery investment regarding equation (4), the achievable useful life of the battery system is required. The operation life of the battery is restricted either by reaching the cycle lifetime or by the calendar lifetime [9]:
(7)
The cycle lifetime can be estimated by dividing the maximum number of storage cycles by the annual number of storage cycles :
(8)
The average annual costs for the procurement of electricity from the grid are calculated with the average retail electricity price , the annual load demand and the degree of self-sufficiency :
(9)
Besides the annual costs for the PV battery system and procurement of electricity from the grid, incomes from the remuneration of the grid injection of the PV generated electricity have to be considered as well. The annual revenues from the PV feed-in are calculated using the feed-in tariff , the average annual PV yield and the self-consumption rate :
(10)
Considering all costs and revenues associated with the electricity consumption and production of the household allows comparing the profitability of different system configurations. Therefore, the mean price of electricity of the household during the operation lifetime of the PV battery system is a comparable measure to determine the cost-optimal configuration. The mean electricity price is obtained by dividing the sum of all annual expenses
and as well as revenues by the annual load consumption as follows:
(11)
The mean price of electricity varies with the PV system and battery size as well as all cost assumptions. The PV battery system size with the lowest mean electricity price corresponds the cost-optimal system configuration.
Johannes Weniger et al. / Energy Procedia 46 ( 2014 ) 78 – 87 85
4.2. Assumptions
To identify the most economical configuration of PV battery systems, several assumptions have to be made. The calculation of the profitability is performed using an interest rate of 4%. For the PV system an operation lifetime of 20 years is assumed. The useful life of the battery is limited by 5000 cycles or by the calendar lifetime of 20 years. The annual operation and maintenance costs of the PV and battery system are set to 1.5% of the respective investment costs. It is assumed that the costs of the battery and the PV system are proportional to their size. Therefore the dependence of the specific investment costs on the size of the PV battery system is neglected. The mean retail electricity prices for households including value added tax (VAT) over the next 20 years are estimated to be 0.34 . This value results from the current retail electricity price of 0.28 increase of 2% over the next 20 years. Therefore the assumption of the average retail electricity price directly influences the economic assessment. As the profitability of PV battery systems is strongly affected by the cost situation, the following sensitivity analysis tries to reveal the impact of the possible future cost development on the economics of PV battery systems. The assumed payments for the grid feed-in and the assumed costs of PV battery systems for the different scenarios, which will be described in the following, are summarised in Table 1. Table 1. Scenario of the possible future development of residential PV battery system costs and feed-in tariffs in Germany [10]
Today Short-term Medium-term Long-term
PV system costs (incl. VAT) in 1800 1500 1200 1000
Battery system costs (incl. VAT) in 3000 1500 1000 600
Feed-in tariff in 0.15 0.11 0.06 0.02
4.3. Sensitivity Analysis
To determine the impact of the upcoming cost development on the cost-efficient size of PV battery systems, a sensitivity analysis is conducted for different scenarios according to Table 1. At present, typical specific costs for residential PV systems are about 1800 /kWh. The specific costs of lithium-based battery systems normalised to the usable battery capacity are in the range of 3000 Considering the current cost situation, Fig. 5a depicts the dependence of the mean price of electricity on the size of the PV battery system. The nominal PV power and the usable battery capacity are normalised to the annual load demand. If the household is not equipped with a PV battery system, the mean electricity price will be equal to the average retail electricity price, estimated to be 0.34 favourable as soon as the mean electricity price of the system configuration falls below the average price for purchase of electricity from the grid. Therefore the limit of profitability coincides with the average retail electricity price. By installing a PV system without a battery, the mean price of electricity can be reduced today. Taking the current cost situation into account, the optimal PV system size with the lowest electricity costs is in the range of 2.2 kWp/MWh, indicated by the black dot in Fig. 5a. If the PV system is equipped with batteries at present, the mean electricity price will strongly increase. Coupling PV systems and large-scale battery systems leads to an average electricity price of 0.50 PV systems with large-sized batteries is not profitable yet under consideration of the described cost assumptions.
For the future it can be expected that the degression of the feed-in tariffs will be higher than the PV system cost reductions. As a consequence, the optimum will shrink to smaller-sized PV systems with higher self-consumption rates. Therefore, in the short-term scenario the PV system size with the lowest mean electricity price will drop to 1 kWp/MWh (Fig. 5b), assuming that the PV system costs and feed-in payments decrease to 1500 0.11 drop to 1500 the short-term, it will become profitable to install small-scale batteries with a usable battery capacity of up to 0.5 kWh/MWh. This reveals that PV systems combined with small-sized batteries will provide an economic benefit in the foreseeable future.
86 Johannes Weniger et al. / Energy Procedia 46 ( 2014 ) 78 – 87
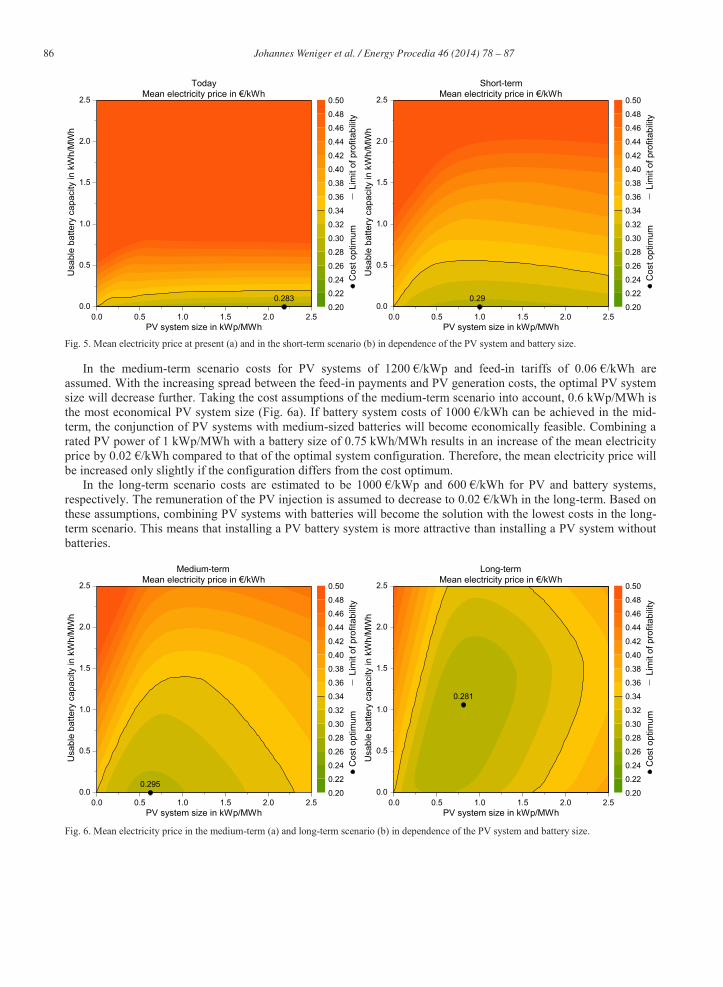
Fig. 5. Mean electricity price at present (a) and in the short-term scenario (b) in dependence of the PV system and battery size.
In the medium-term scenario costs for PV systems of 1200 -in tariffs of 0.06 are assumed. With the increasing spread between the feed-in payments and PV generation costs, the optimal PV system size will decrease further. Taking the cost assumptions of the medium-term scenario into account, 0.6 kWp/MWh is the most economical PV system size (Fig. 6a). If battery system costs of 1000 the mid-term, the conjunction of PV systems with medium-sized batteries will become economically feasible. Combining a rated PV power of 1 kWp/MWh with a battery size of 0.75 kWh/MWh results in an increase of the mean electricity price by 0.02 that of the optimal system configuration. Therefore, the mean electricity price will be increased only slightly if the configuration differs from the cost optimum.
In the long-term scenario costs are estimated to be 1000 respectively. The remuneration of the PV injection is assumed to decrease to 0.02 in the long-term. Based on these assumptions, combining PV systems with batteries will become the solution with the lowest costs in the long-term scenario. This means that installing a PV battery system is more attractive than installing a PV system without batteries.
Fig. 6. Mean electricity price in the medium-term (a) and long-term scenario (b) in dependence of the PV system and battery size.
0.283
0.0 0.5 1.0 1.5 2.0 2.50.0
0.5
1.0
1.5
2.0
2.5
Today
PV system size in kWp/MWh
Usa
ble
batte
ry c
apac
ity in
kW
h/M
Wh
0.20
0.22
0.24
0.26
0.28
0.30
0.32
0.34
0.36
0.38
0.40
0.42
0.44
0.46
0.48
0.50
Cos
t opt
imum
Lim
it of
pro
fitab
ility
0.29
0.0 0.5 1.0 1.5 2.0 2.50.0
0.5
1.0
1.5
2.0
2.5
Short-term
PV system size in kWp/MWh
Usa
ble
batte
ry c
apac
ity in
kW
h/M
Wh
0.20
0.22
0.24
0.26
0.28
0.30
0.32
0.34
0.36
0.38
0.40
0.42
0.44
0.46
0.48
0.50
Cos
t opt
imum
Lim
it of
pro
fitab
ility
0.295
0.0 0.5 1.0 1.5 2.0 2.50.0
0.5
1.0
1.5
2.0
2.5
Medium-term
PV system size in kWp/MWh
Usa
ble
batte
ry c
apac
ity in
kW
h/M
Wh
0.20
0.22
0.24
0.26
0.28
0.30
0.32
0.34
0.36
0.38
0.40
0.42
0.44
0.46
0.48
0.50
Cos
t opt
imum
Lim
it of
pro
fitab
ility
0.281
0.0 0.5 1.0 1.5 2.0 2.50.0
0.5
1.0
1.5
2.0
2.5
Long-term
PV system size in kWp/MWh
Usa
ble
batte
ry c
apac
ity in
kW
h/M
Wh
0.20
0.22
0.24
0.26
0.28
0.30
0.32
0.34
0.36
0.38
0.40
0.42
0.44
0.46
0.48
0.50
Cos
t opt
imum
Lim
it of
pro
fitab
ility
Johannes Weniger et al. / Energy Procedia 46 ( 2014 ) 78 – 87 87
Fig. 6b reveals that the system configuration with a PV system size of 0.8 kWp/MWh and a usable battery capacity of 1.1 kWh/MWh is the most cost-efficient solution. However, a broad range of system configurations will be profitable. Nevertheless, PV system sizes above 1.6 kWp/MWh cannot compete against the grid electricity costs without a battery, due to their low self-consumption rates. It should also be highlighted that configurations enabling degrees of self-sufficiency above 70% are economically feasible in the long term (see Fig. 4b). In spite of the higher mean electricity price compared to the cost optimum, it can be reasonable to install such system configurations to reduce the reliance on possible future raises of grid electricity costs. In conclusion, it should be pointed out that the profitability and the cost-optimal configuration can only be estimated, as the development of the electricity prices and the load demand of the household in the future cannot be predicted precisely.
5. Conclusion
In summary, this analysis shows that the self-consumption rate and the degree of self-sufficiency strongly depend on the PV system and battery size. Nevertheless, only a small impact of the PV generator orientation on the degree of self-sufficiency for a residential PV battery system was determined. This may lead to the conclusion that the orientation of the PV generator will be of smaller relevance in the future than in the past, where the absolute yield was the crucial factor. Based on the simulation results, an economic assessment of PV battery systems was carried out, which reveals that the cost-optimal system configurations are strongly affected by the cost situations. It was identified that the optimal PV system size will shrink to small-scale systems with higher self-consumption rates, as the incomes from the feed-in payments will play a minor role in future. In the considered long-term scenario the conjunction of PV systems with batteries will be not only profitable but also the most economical solution. Therefore, the conjunction of PV systems with batteries is of decisive importance, not only to store surplus PV energy, but also to tap the whole PV potential.
Acknowledgements
The authors thank the Senate Department for Urban Development and the Environment of the state of Berlin for UEP II/2), which is funded by the Environmental Relief Program (UEP
II) that is co-financed by the European Union through the European Regional Development Fund (ERDF) and the state of Berlin
References [1] Quaschning, V.; Weniger, J.; Tjaden, T.: Der unterschätzte Markt. In: BWK, Bd. 64 (2012) Nr. 7/8, S. 25-28 [2] Castillo- -Martín, E.; Matallanas, E.; Masa-Bote, D.; Gutiérrez, A.; Monasterio-Huelin, F.; Jiménez-
Leube, J.: PV self-consumption optimization with storage and Active DSM for the residential sector. In: Solar Energy, Vol. 85 (2011), pp. 2338-2348
[3] Verein Deutscher Ingenieure VDI (Ed.): VDI 4655 Reference load profiles of single-family and multi-family houses for the use of CHP systems. Beuth Verlag, Berlin, 2008
[4] Klucher, T.: Evaluation of models to predict insolation on tilted surfaces. In: Solar Energy, Vol. 23 (1979), pp. 111-114 [5] Burger, B.: Auslegung und Dimensionierung von Wechselrichtern für netzgekoppelte PV-Anlagen. 20. Symposium
Photovoltaische Solarenergie, Bad Staffelstein, 2005 [6] Lorenz, E.; Scheidsteger, T,; Hurka, J.;, Heinemann, D.; Kurz, C.: Regional PV power prediction for improved grid
integration. Progress in Photovoltaics: Research and Applications, Vol. 19 (2011), pp. 757-771 [7] Schmidt, H.; Sauer, D. U.: Wechselrichter-Wirkungsgrade Praxisgerechte Modellierung und Abschätzung. In:
Sonnenenergie 04/1996, S. 43-47 [8] Braun, M.; Büdenbender, K.; Magnor, D.; Jossen, A.: Photovoltaic Self-Consumption in Germany - Using Lithium-Ion
Storage to Increase Self-Consumed Photovoltaic Energy. 24th European Photovoltaic Solar Energy Conference and Exhibition, Hamburg, 2009,
[9] Werner, C.; Breyer, C.; Gerlach, A.; Beckel, O.: Photovoltaic With Energy Storage: An Overview On Economics, System Design And Politics. 27th European Photovoltaic Solar Energy Conference, Frankfurt, 2012
[10] Weniger, J.; Quaschning, V.; Tjaden, T.: Optimale Dimensionierung von PV-Speichersystemen. In: pv-magazine Deutschland, 1/2013, S. 70-75