Skagit River Flood Damage Reduction Study Skagit River Flood Damage Reduction Study Hydraulic Measure Evaluation Hydraulic Measure Evaluation US Army Corps of Engineers Linda Smith, Project Manager and Ted Perkins, Hydraulic Engineer Skagit County
Transcript
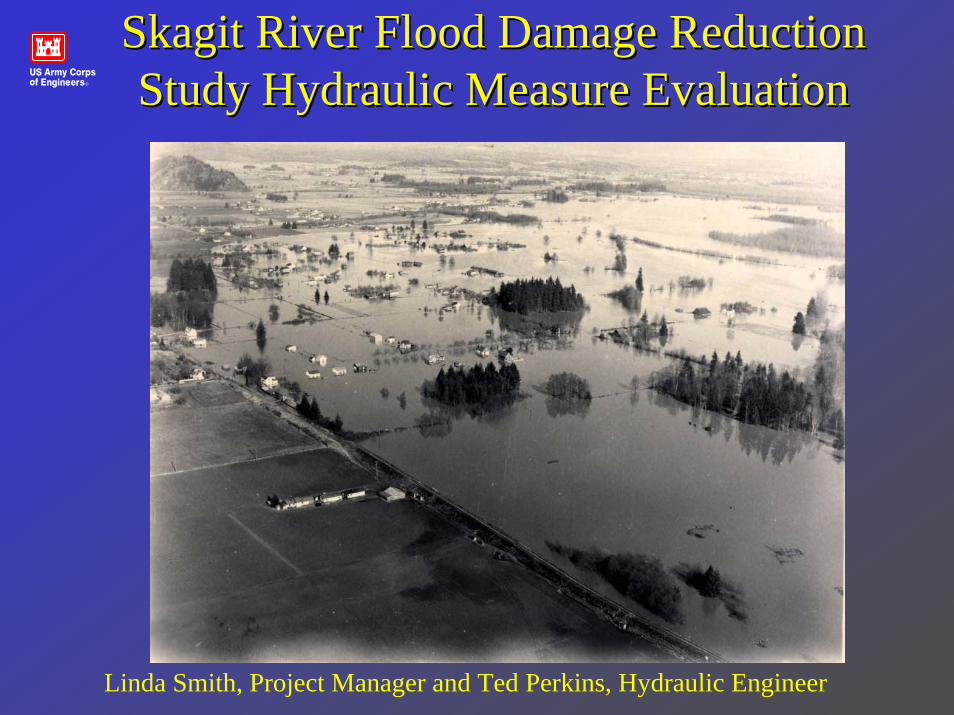
Skagit River Flood Damage Reduction Study Skagit River Flood Damage Reduction Study Hydraulic Measure EvaluationHydraulic Measure Evaluation
US Army Corps of EngineersLinda Smith, Project Manager and Ted Perkins, Hydraulic Engineer
Skagit County
Skagit River Flood Damage Skagit River Flood Damage Reduction StudyReduction Study
Evaluation ProcessEvaluation Process1)Measures 1)Measures –– Identify and ScreenIdentify and Screen2)Combine into Alternatives2)Combine into Alternatives3)Screen Alternatives (Econ, Environmental, Socio/cultural, 3)Screen Alternatives (Econ, Environmental, Socio/cultural,
Engineering)Engineering)4)Select for Detailed Design and Evaluation4)Select for Detailed Design and Evaluation5)Recommended Plan for Federal Implementation5)Recommended Plan for Federal Implementation6)Workshops, Scoping Meetings 6)Workshops, Scoping Meetings 7)Variety of floods evaluated 7)Variety of floods evaluated –– 55--500. Do not just focus on 100 year500. Do not just focus on 100 year
StatusStatus
•• Identified measuresIdentified measures•• Modeled measure ability to reduce flood stages Modeled measure ability to reduce flood stages
(today(today’’s discussion)s discussion)•• Complete preliminary costs for measures (Jan)Complete preliminary costs for measures (Jan)•• Model damages prevented by each measure Model damages prevented by each measure
(Jan(Jan--early Feb)early Feb)•• Compare measure costs to damages reduced Compare measure costs to damages reduced ––
without real without real estate(Febestate(Feb))
Purpose of a Flood Damage Purpose of a Flood Damage Reduction StudyReduction Study
Looking to Reduce Flood Damage in a way Looking to Reduce Flood Damage in a way that:that:
•• Yields Maximum Net Economic BenefitYields Maximum Net Economic Benefit•• Performs Efficiently and Effectively, Even Performs Efficiently and Effectively, Even
Under Extreme EventsUnder Extreme Events•• Protects the EnvironmentProtects the Environment
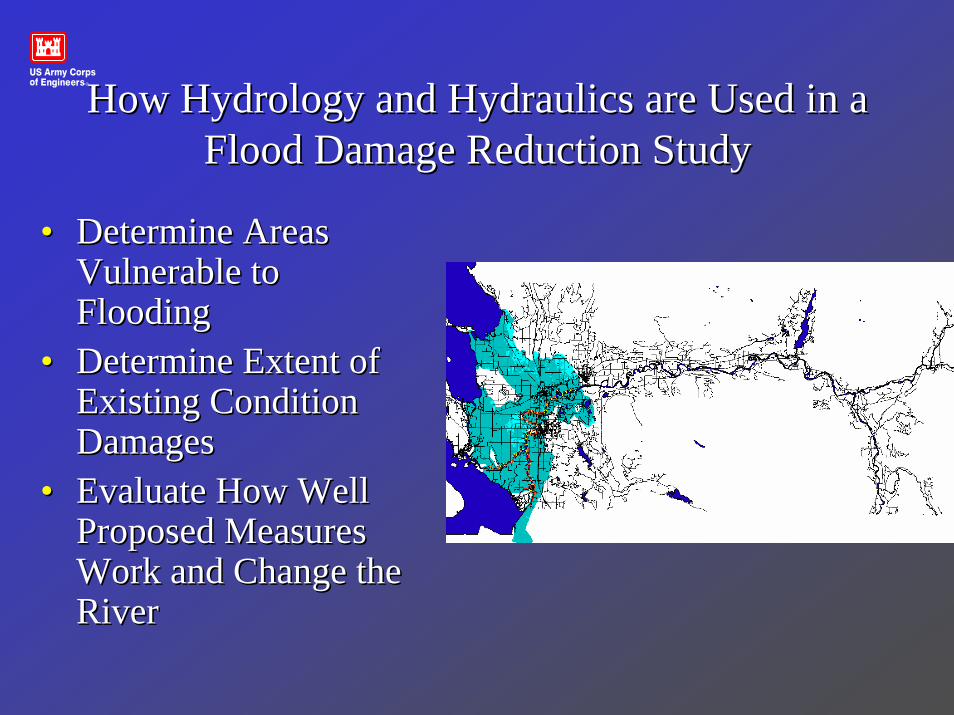
How Hydrology and Hydraulics are Used in a How Hydrology and Hydraulics are Used in a Flood Damage Reduction StudyFlood Damage Reduction Study
•• Determine Areas Determine Areas Vulnerable to Vulnerable to FloodingFlooding
•• Determine Extent of Determine Extent of Existing Condition Existing Condition DamagesDamages
•• Evaluate How Well Evaluate How Well Proposed Measures Proposed Measures Work and Change the Work and Change the RiverRiver
Defining Flood EventsDefining Flood EventsFlood EventFlood Event RecurrenceRecurrence Chance of Chance of
OccurrenceOccurrence
1010--yearyear 10%10% 1 in 101 in 10
2525--yearyear 4%4% 1 in 251 in 25
5050--yearyear 2%2% 1 in 501 in 50
100100--yearyear 1%1% 1 in 1001 in 100
500500--yearyear 0.2%0.2% 1 in 5001 in 500
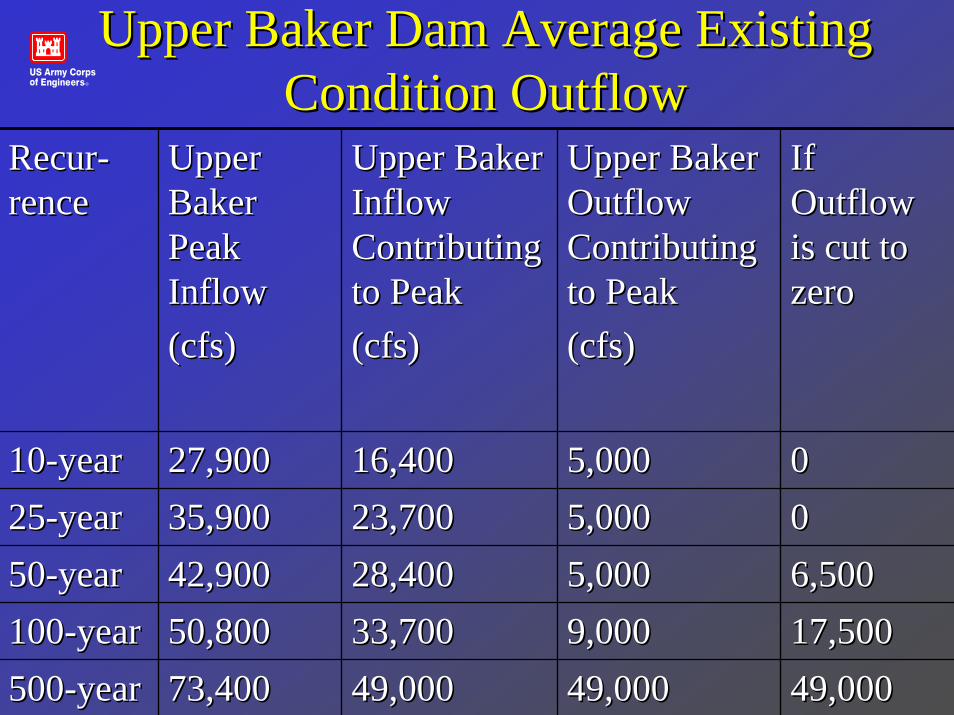
Skagit River Regulated Instantaneous Skagit River Regulated Instantaneous Peak FlowsPeak Flows
RecurrenceRecurrence at Concrete at Concrete GageGage(cfs)(cfs)
at Sedroat Sedro--WoolleyWoolley(cfs)(cfs)
at Mount at Mount Vernon Vernon GageGage(cfs)(cfs)
Minimum Minimum Outflow to Outflow to zerozero(cfs)(cfs)
Storage Storage Added to Added to 85K85K
Storage Storage Added to Added to 100K100K
5,0005,000 00
00
00
7,5007,500
49,00049,000
5,0005,000
5,0005,000
9,0009,000
49,00049,000
00
00
6,5006,500
17,50017,500
49,00049,000
00
00
00
10,50010,500
49,00049,000
1010--yearyear
2525--yearyear
5050--yearyear
100100--yearyear
500500--yearyear
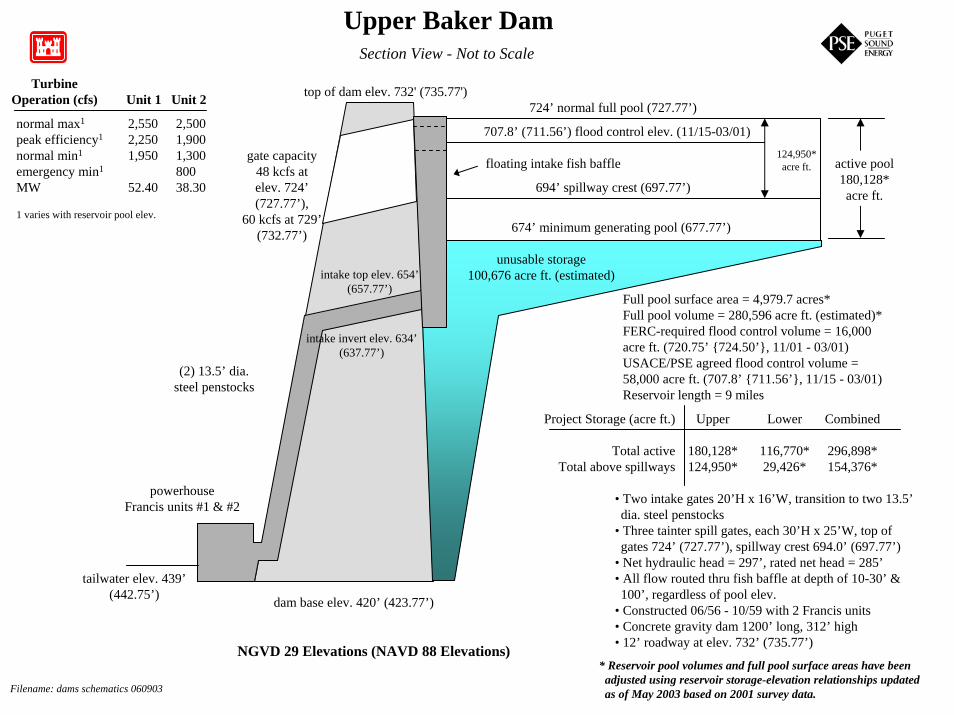
Upper Baker DamSection View - Not to Scale
724’ normal full pool (727.77’)
gate capacity48 kcfs atelev. 724’(727.77’),
60 kcfs at 729’(732.77’)
top of dam elev. 732' (735.77')
694’ spillway crest (697.77’)
707.8’ (711.56’) flood control elev. (11/15-03/01)
674’ minimum generating pool (677.77’)
powerhouseFrancis units #1 & #2
(2) 13.5’ dia. steel penstocks
dam base elev. 420’ (423.77’)
active pool180,128* acre ft.
unusable storage100,676 acre ft. (estimated)
Full pool surface area = 4,979.7 acres*Full pool volume = 280,596 acre ft. (estimated)*FERC-required flood control volume = 16,000 acre ft. (720.75’ {724.50’}, 11/01 - 03/01)USACE/PSE agreed flood control volume = 58,000 acre ft. (707.8’ {711.56’}, 11/15 - 03/01)Reservoir length = 9 miles
• Two intake gates 20’H x 16’W, transition to two 13.5’dia. steel penstocks
• Three tainter spill gates, each 30’H x 25’W, top of gates 724’ (727.77’), spillway crest 694.0’ (697.77’)
• Net hydraulic head = 297’, rated net head = 285’• All flow routed thru fish baffle at depth of 10-30’ & 100’, regardless of pool elev.
• Constructed 06/56 - 10/59 with 2 Francis units• Concrete gravity dam 1200’ long, 312’ high• 12’ roadway at elev. 732’ (735.77’)
normal max1
peak efficiency1
normal min1
emergency min1
MW
1 varies with reservoir pool elev.
Turbine Operation (cfs) Unit 1 Unit 2
2,5502,2501,950
52.40
124,950*acre ft.
2,5001,9001,30080038.30
tailwater elev. 439’(442.75’)
Project Storage (acre ft.)
Total activeTotal above spillways
Upper
180,128*124,950*
Lower
116,770*29,426*
Combined
296,898*154,376*
intake top elev. 654’(657.77’)
intake invert elev. 634’(637.77’)
floating intake fish baffle
NGVD 29 Elevations (NAVD 88 Elevations)* Reservoir pool volumes and full pool surface areas have been adjusted using reservoir storage-elevation relationships updated as of May 2003 based on 2001 survey data.Filename: dams schematics 060903
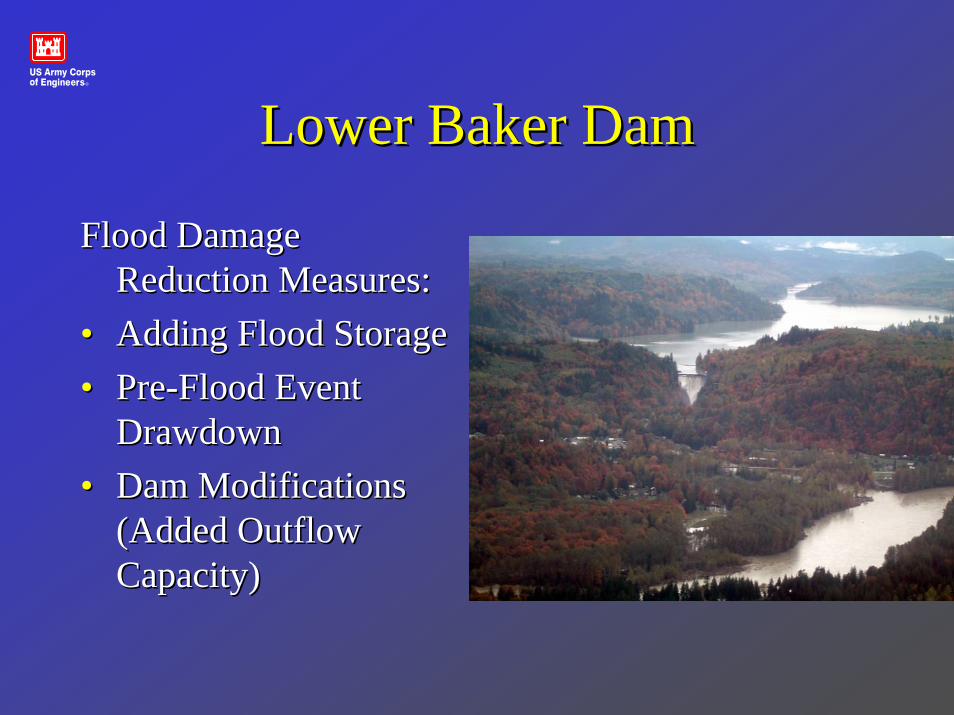
DrawdownDrawdown•• Dam Modifications Dam Modifications
(Added Outflow (Added Outflow Capacity)Capacity)
Lower Baker DamSection View - Not to Scale
powerhouseunit #3
vertical Francis
24” bypassDarling valve
80 cfs
16’ butterflyvalve
22’ dia. concrete-lined
penstock
dam base elev. 165.75’
442.35’ normal full pool
gate capacity40 kcfs at
elev. 442.35’
top of dam elev. 450.62’
393.75’ avg. minimum pool
428.55’ spillway crest
373.75’ minimum generating pool
active pool116,770* acre ft.
unusable storage29,509 acre-ft
intake invert elev.333.75’
intake top elev. 353.75’
Full pool surface area = 2,278.2 acres *Full pool volume = 146,279 acre ft. (estimated)*Required flood control volume = 0Reservoir length = 7 miles
• Two intakes 20’H x 12’W, transition to single 22’ dia. penstock, bifurcates to (2) 16’ dia. near powerhouse
• 23 spill gates, each 14’H x 9.5’W, top of gates 442.55’, 5 of 13 automatic are remote-controlled, 10 manual
• Rated net head = 243’
• Constructed Apr 1924 – Nov 1925 with 2-double Francis units• 33’ elev. added 1927, total height 285’• Concrete gravity arch dam 550’ long• Added Unit #3 1960, all destroyed May 1965 by landslide, rebuilt Sep 1968 with Unit #3 only
normal max1
peak efficiency1
normal min1
emergency min1
MW2
1 varies with reservoir pool elev.2 turbine capacity of 4,700 cfs presently
limited by transformer capacity3 data not available or untested
Turbine Operation (cfs) Unit #3 (new)
4,2002
3,8003,200N/A3
71.36
29,426 acre ft.*
*Reservoir pool volumes and full pool surface areas have been adjusted using reservoir storage-elevation relationships updated as of May 2003 based on 2001 survey data.NAVD 88 Elevations
Diablo DamDiablo Dam•• Storage available between Storage available between
Normal Full Pool and Normal Full Pool and Minimum Power Pool = Minimum Power Pool = 6,988 acre6,988 acre--feetfeet
(Elev. 1197 to 1205)(Elev. 1197 to 1205)•• Volume per hour released Volume per hour released
from Ross before the from Ross before the storm ~2000 acrestorm ~2000 acre--feetfeet
Gorge DamGorge Dam
•• Storage available Storage available between Normal Full between Normal Full Pool and Minimum Pool and Minimum Power Pool = 1,347 Power Pool = 1,347 acreacre--feetfeet
(Elev. 869 to 875)(Elev. 869 to 875)
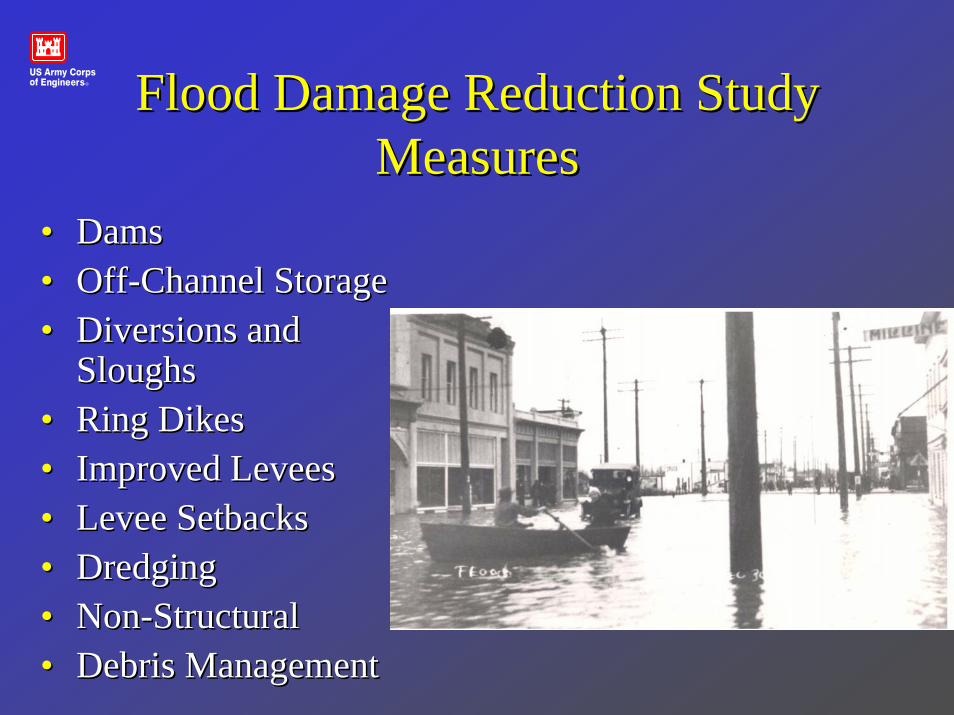
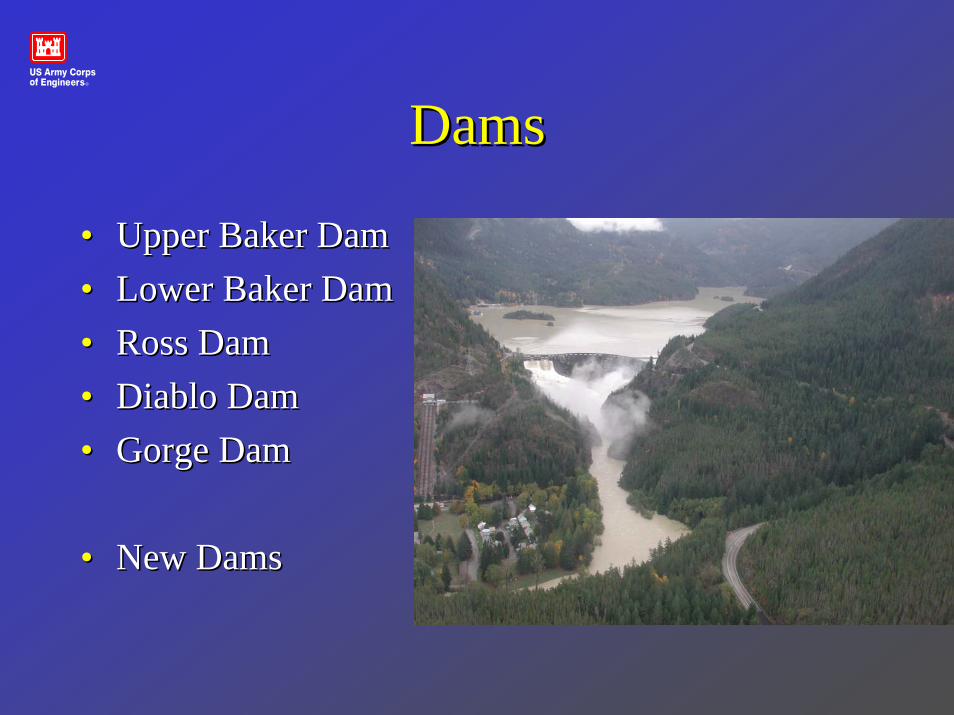
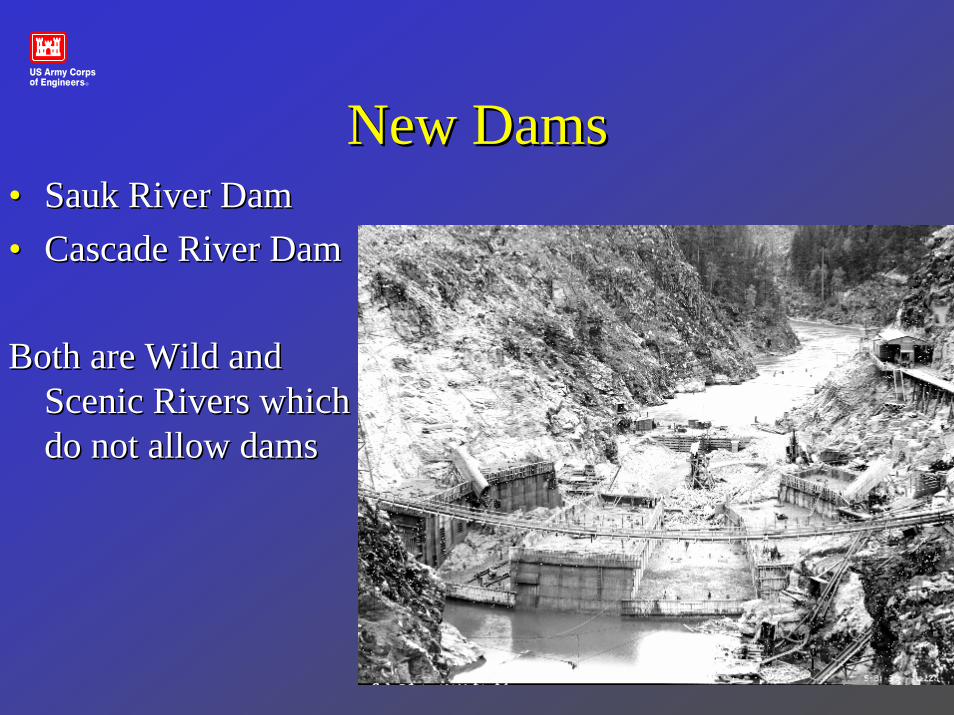
New DamsNew Dams•• Sauk River DamSauk River Dam•• Cascade River DamCascade River Dam
Both are Wild and Both are Wild and Scenic Rivers which Scenic Rivers which do not allow damsdo not allow dams
OffOff--Channel StorageChannel Storage•• Cockreham Island (RM 35 Cockreham Island (RM 35
to RM 39) to RM 39) –– 5,400 acre5,400 acre--feet feet
•• River Bend River Bend –– (RM 13 to (RM 13 to 17) 17) –– 4,000 acre4,000 acre--feetfeet
Fills up in less than an hour Fills up in less than an hour at peak of 100at peak of 100--yearyear
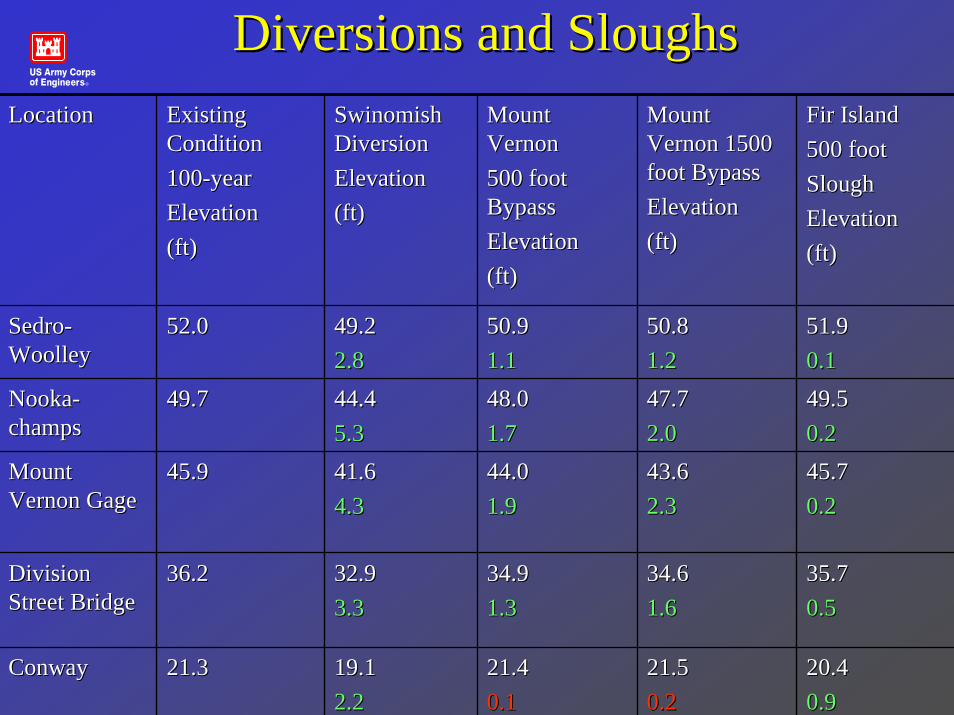
MV and MV and Fir Island Fir Island Slough Slough 500 feet500 feetElevation Elevation (ft)(ft)
MV and Fir MV and Fir Island Island Slough Slough 1500 feet 1500 feet w/Setbackw/SetbackElevation Elevation (ft)(ft)
52.052.0 49.049.03.03.0
43.443.46.36.3
40.640.65.35.3
32.032.04.24.2
18.518.52.82.8
49.749.7
45.945.9
36.236.2
21.321.3
SedroSedro--WoolleyWoolley
50.950.91.11.1
NookaNooka--champschamps
48.048.01.71.7
Mount Mount Vernon Vernon GageGage
43.943.92.02.0
Division Division Street Street BridgeBridge
34.434.41.81.8
ConwayConway 18.518.52.82.8
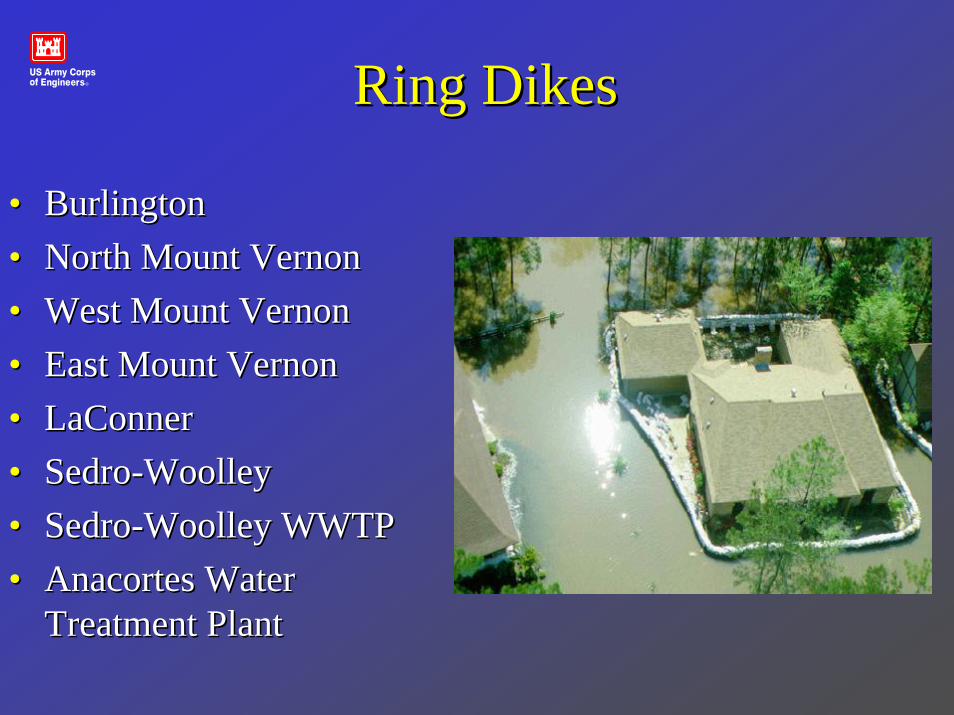
Ring DikesRing Dikes
•• BurlingtonBurlington•• North Mount VernonNorth Mount Vernon•• West Mount VernonWest Mount Vernon•• East Mount VernonEast Mount Vernon•• LaConnerLaConner•• SedroSedro--WoolleyWoolley•• SedroSedro--Woolley WWTPWoolley WWTP•• Anacortes Water Anacortes Water
Treatment PlantTreatment Plant
Burlington Ring DikeBurlington Ring Dike
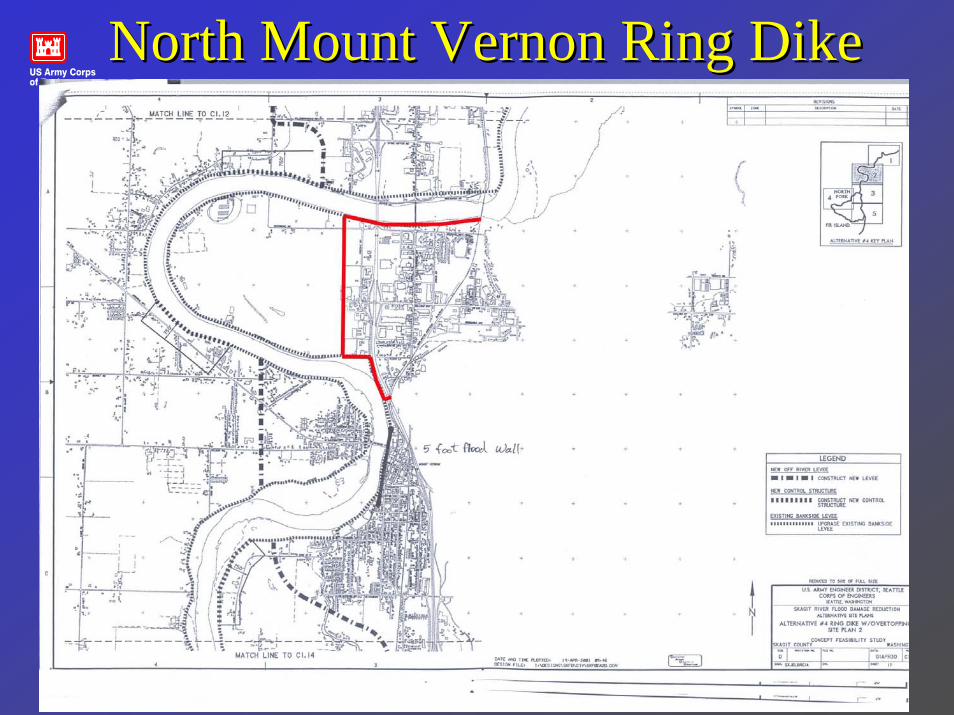
North Mount Vernon Ring DikeNorth Mount Vernon Ring Dike
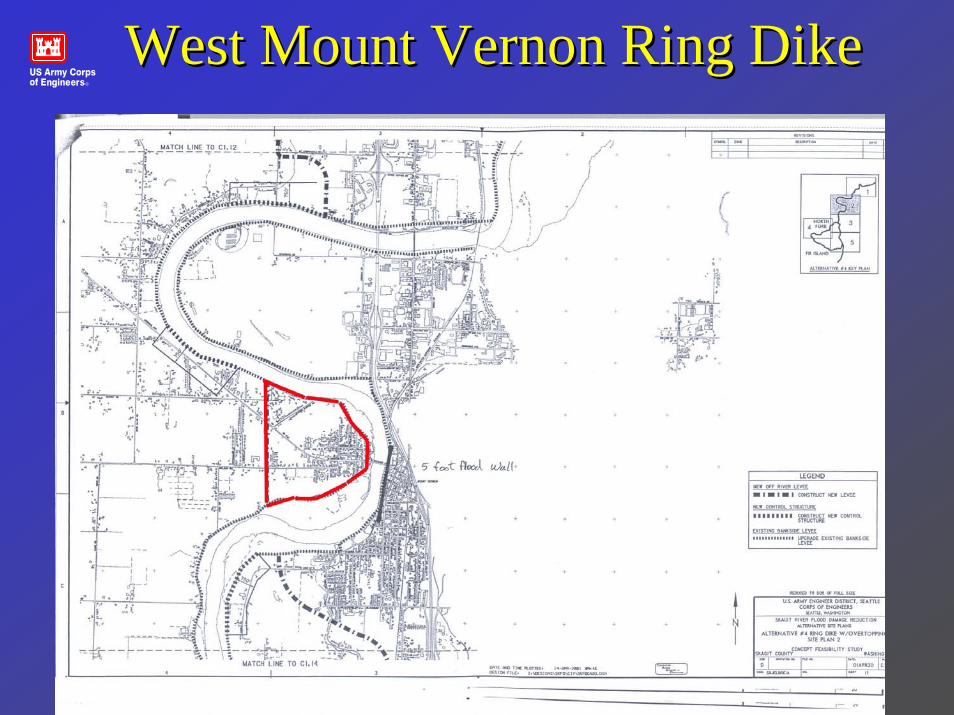
West Mount Vernon Ring DikeWest Mount Vernon Ring Dike
East Mount Vernon Ring DikeEast Mount Vernon Ring Dike
LaConner Ring DikeLaConner Ring Dike
SedroSedro--Woolley Ring DikeWoolley Ring Dike
Clear Lake Ring DikeClear Lake Ring Dike
Improved LeveesImproved Levees•• Left Bank to Mount Left Bank to Mount
VernonVernon•• Left Bank from Mount Left Bank from Mount
Vernon to SF MouthVernon to SF Mouth•• Right BankRight Bank
Improved Levees Not Including Improved Levees Not Including FreeboardFreeboard
RecurrenceRecurrence NookaNooka--champschamps
Mount Mount Vernon Vernon GageGage
Division Division Street Street BridgeBridge
ConwayConway
1010--yearyear 40.240.2 34.934.9 27.827.8
30.230.2
33.433.4
36.236.2
43.143.1
15.715.7
2525--yearyear 43.243.2 38.038.0 17.317.3
5050--yearyear 45.645.6 42.442.4 19.519.5
100100--yearyear 49.749.7 45.945.9 21.321.3
500500--yearyear 61.961.9 55.055.0 25.825.8
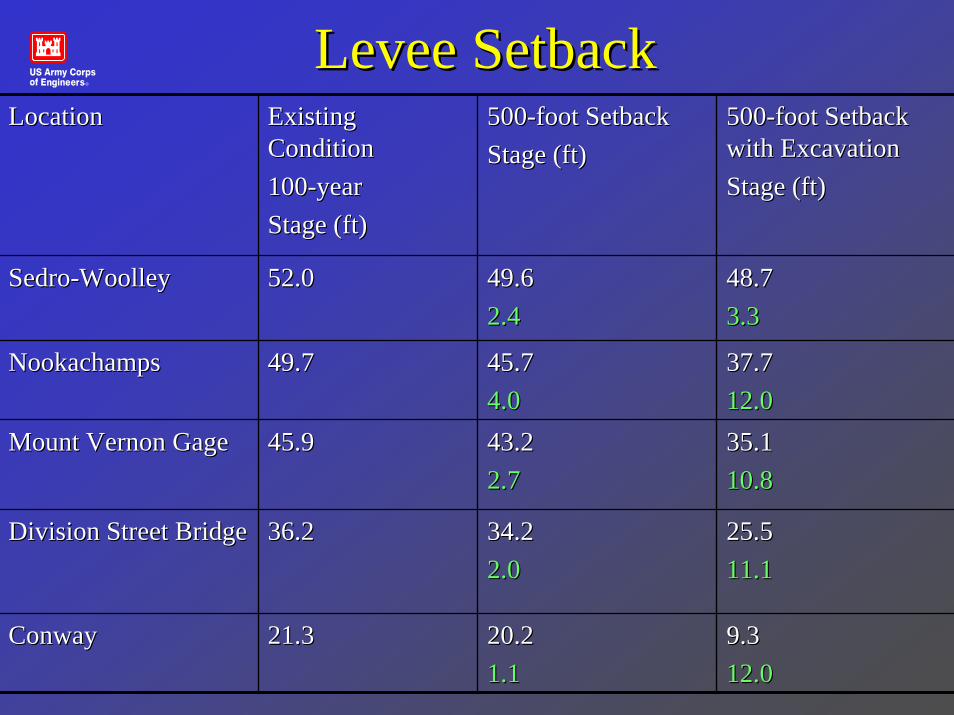
Levee SetbacksLevee Setbacks
•• 33--Bridge Bridge Corridor to Corridor to Skagit BaySkagit Bay
•• With and With and Without Without ExcavationExcavation
•• OverbankOverbankexcavated excavated 20 feet (5 20 feet (5 million million cubic yards)
0 200 400 600 800 1000 1200 1400 1600-10
0
10
20
30
40
ExistCond Plan: 100-yearRCSetback River = Skagit River Reach = BakertoConcrete RS = 14.6
500500--foot Setback foot Setback with Excavationwith ExcavationStage (ft)Stage (ft)
SedroSedro--WoolleyWoolley 52.052.0
49.749.7
45.945.9
36.236.2
21.321.3
49.649.62.42.4
48.748.73.33.3
NookachampsNookachamps 45.745.74.04.0
37.737.712.012.0
Mount Vernon GageMount Vernon Gage 43.243.22.72.7
35.135.110.810.8
Division Street BridgeDivision Street Bridge 34.234.22.02.0
25.525.511.111.1
ConwayConway 20.220.21.11.1
9.39.312.012.0
DredgingDredging
•• 60 million cubic yards 60 million cubic yards from Sedrofrom Sedro--Woolley Woolley to mouth for 100to mouth for 100--year year conveyanceconveyance
•• ShortShort--term fix and term fix and high O&M costhigh O&M cost
NonNon--structuralstructural•• Buying out Buying out
flood prone flood prone houseshouses
•• Raising Raising houseshouses
Debris ManagementDebris ManagementFlood at Flood at NookaNooka--champs champs ConfluenceConfluence
Without Without DebrisDebris
With With DebrisDebris
2525--yearyear 40.940.92.32.3
43.243.2
5050--yearyear 43.643.62.02.0
45.645.6
100100--yearyear 48.548.51.21.2
49.749.7
500500--yearyear 60.260.21.71.7
61.961.9
Skagit River Flood Damage Reduction Skagit River Flood Damage Reduction Study Hydraulic Measure EvaluationStudy Hydraulic Measure Evaluation
Linda Smith, Project Manager and Ted Perkins, Hydraulic Engineer