147
Skanska Capital Markets Day June 19, 2012 1 Skanska Capital Markets Day June 2012
Skanska Capital Markets Day June 19, 2012
1
Skanska Capital Markets Day June 2012
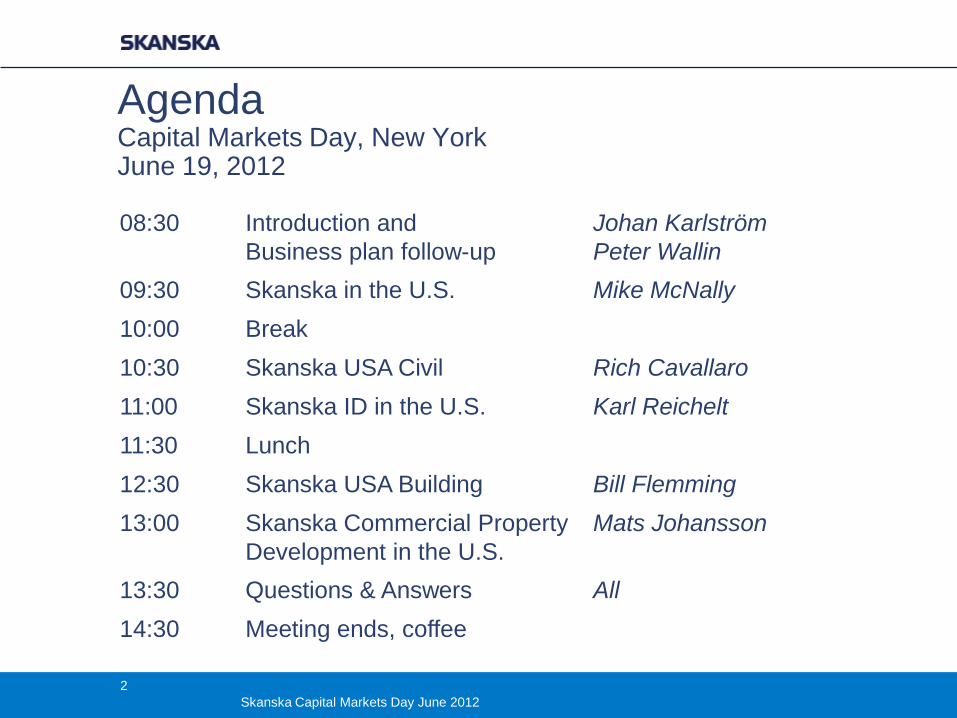
Agenda Capital Markets Day, New York June 19, 2012
08:30 Introduction and
Business plan follow-up
Johan Karlström
Peter Wallin
09:30 Skanska in the U.S. Mike McNally
10:00 Break
10:30 Skanska USA Civil Rich Cavallaro
11:00 Skanska ID in the U.S. Karl Reichelt
11:30 Lunch
12:30 Skanska USA Building Bill Flemming
13:00 Skanska Commercial Property
Development in the U.S.
Mats Johansson
13:30 Questions & Answers All
14:30 Meeting ends, coffee
2
Skanska Capital Markets Day June 2012
Introduction and Business Plan Follow-up
Johan Karlström, President and CEO Peter Wallin, CFO
3
Skanska Capital Markets Day June 2012
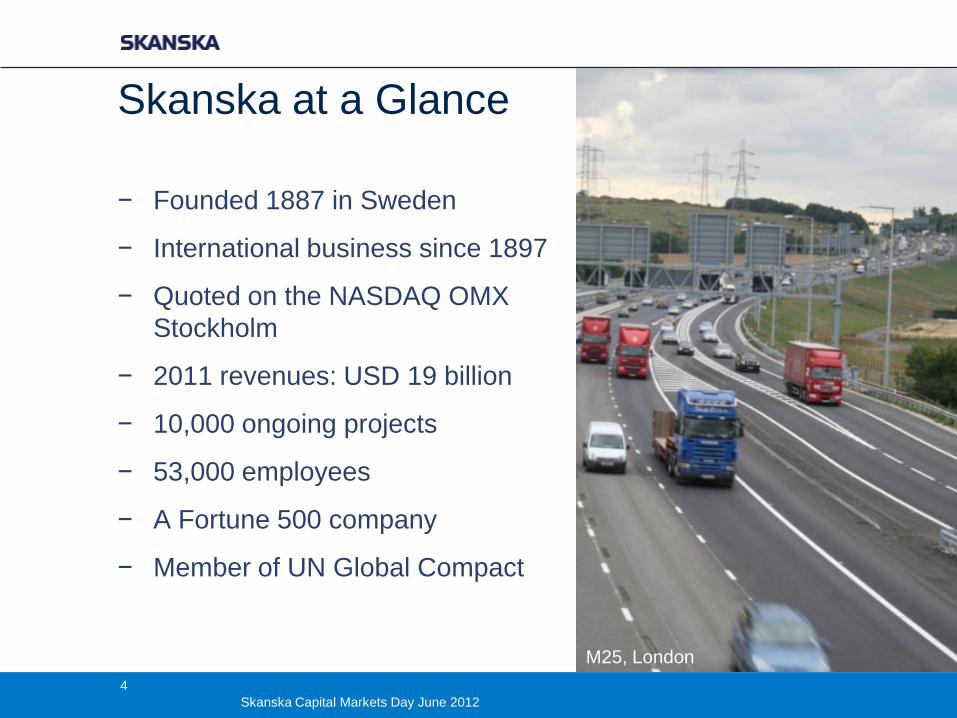
Skanska at a Glance
− Founded 1887 in Sweden
− International business since 1897
− Quoted on the NASDAQ OMX
Stockholm
− 2011 revenues: USD 19 billion
− 10,000 ongoing projects
− 53,000 employees
− A Fortune 500 company
− Member of UN Global Compact
M25, London
4
Skanska Capital Markets Day June 2012
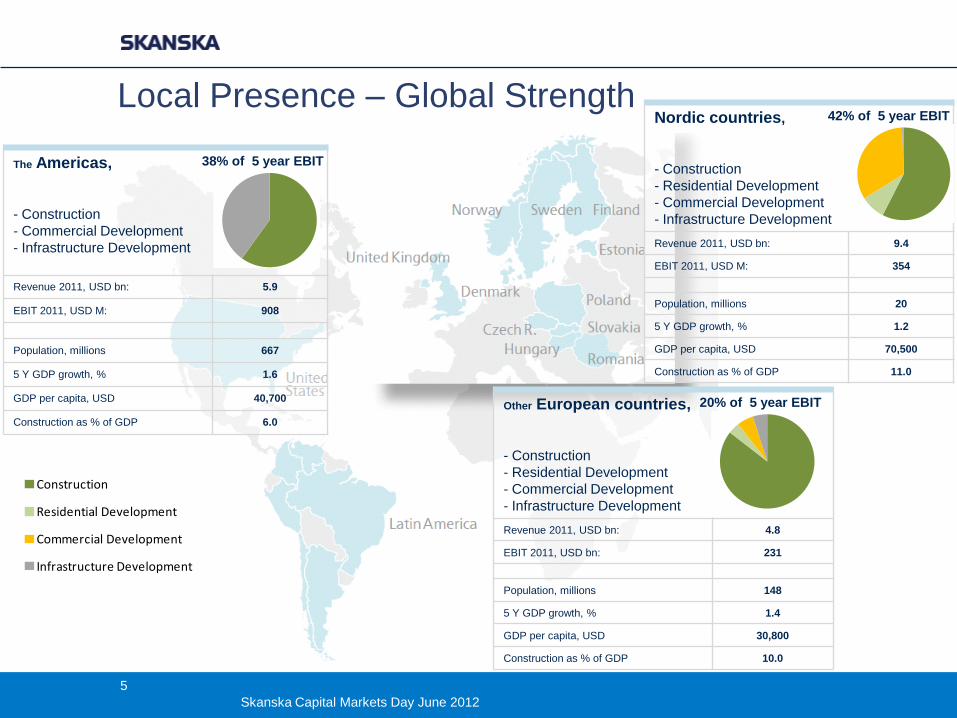
The Americas,
- Construction
- Commercial Development
- Infrastructure Development
Revenue 2011, USD bn: 5.9
EBIT 2011, USD M: 908
Population, millions 667
5 Y GDP growth, % 1.6
GDP per capita, USD 40,700
Construction as % of GDP 6.0
Construction
Residential Development
Commercial Development
Infrastructure Development
Other European countries,
- Construction
- Residential Development
- Commercial Development
- Infrastructure Development
Revenue 2011, USD bn: 4.8
EBIT 2011, USD bn: 231
Population, millions 148
5 Y GDP growth, % 1.4
GDP per capita, USD 30,800
Construction as % of GDP 10.0
Local Presence – Global Strength
Construction
Residential Development
Commercial Development
Infrastructure Development
Nordic countries,
- Construction
- Residential Development
- Commercial Development
- Infrastructure Development
Revenue 2011, USD bn: 9.4
EBIT 2011, USD M: 354
Population, millions 20
5 Y GDP growth, % 1.2
GDP per capita, USD 70,500
Construction as % of GDP 11.0
Construction
Residential Development
Commercial Development
Infrastructure Development
Construction
Residential Development
Commercial Development
Infrastructure Development
38% of 5 year EBIT
42% of 5 year EBIT
20% of 5 year EBIT
5
Skanska Capital Markets Day June 2012
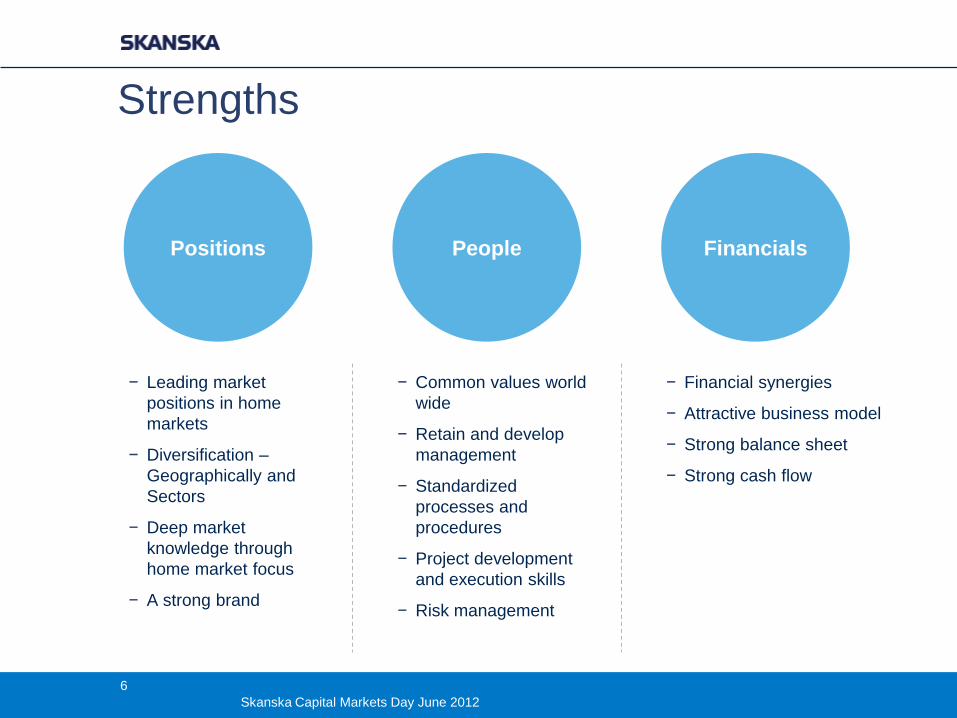
Positions People Financials
Strengths
− Leading market
positions in home
markets
− Diversification –
Geographically and
Sectors
− Deep market
knowledge through
home market focus
− A strong brand
− Common values world
wide
− Retain and develop
management
− Standardized
processes and
procedures
− Project development
and execution skills
− Risk management
− Financial synergies
− Attractive business model
− Strong balance sheet
− Strong cash flow
6
Skanska Capital Markets Day June 2012
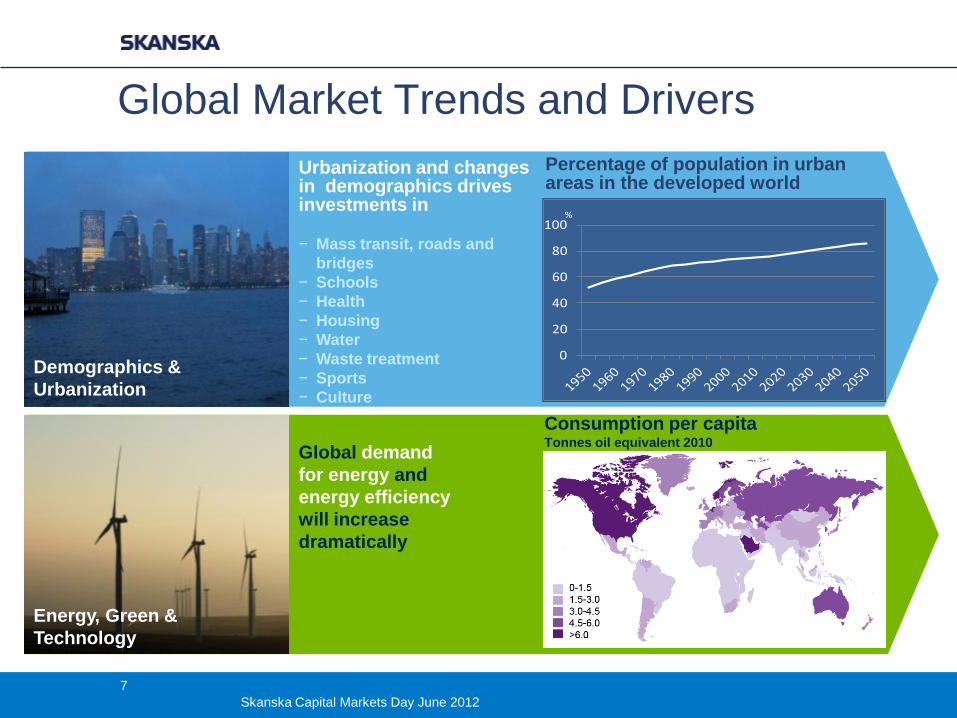
Global Market Trends and Drivers
Urbanization and changes in demographics drives investments in − Mass transit, roads and
bridges
− Schools
− Health
− Housing
− Water
− Waste treatment
− Sports
− Culture
Global demand
for energy and
energy efficiency
will increase
dramatically
Demographics &
Urbanization
Energy, Green &
Technology
0
20
40
60
80
100%
Percentage of population in urban areas in the developed world
Consumption per capita Tonnes oil equivalent 2010
7
Skanska Capital Markets Day June 2012
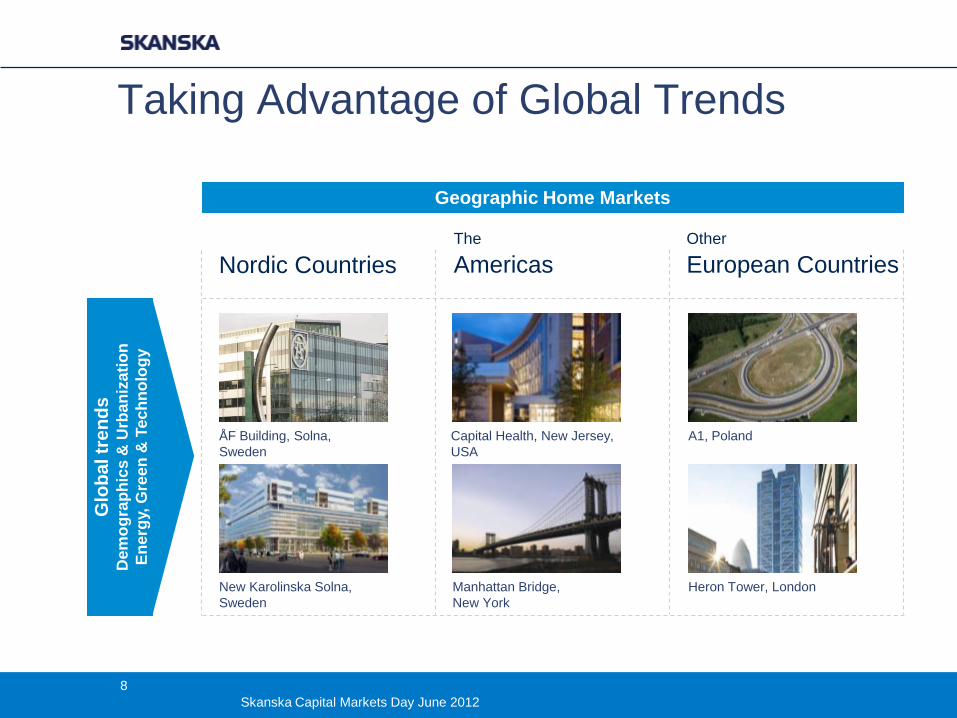
Taking Advantage of Global Trends G
lob
al tr
en
ds
D
em
og
rap
hic
s &
Urb
an
iza
tio
n
En
erg
y, G
ree
n &
Te
ch
no
log
y
Geographic Home Markets
Nordic Countries
The
Americas
Other
European Countries
New Karolinska Solna,
Sweden
Manhattan Bridge,
New York
A1, Poland ÅF Building, Solna,
Sweden
Heron Tower, London
Capital Health, New Jersey,
USA
8
Skanska Capital Markets Day June 2012
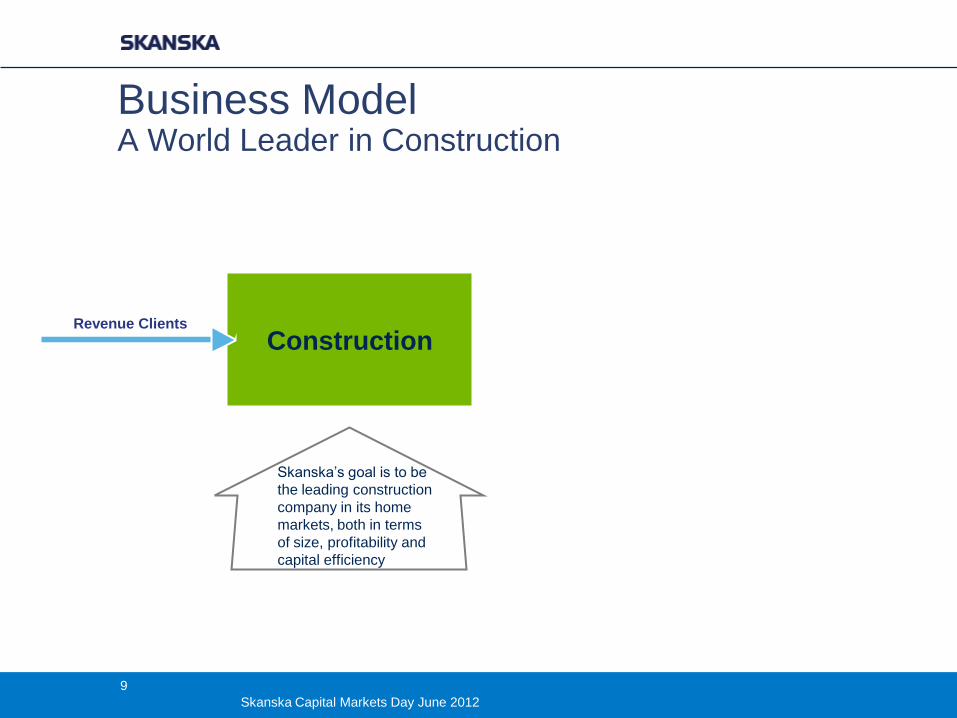
Business Model A World Leader in Construction
Revenue Clients
Construction
Skanska’s goal is to be
the leading construction
company in its home
markets, both in terms
of size, profitability and
capital efficiency
9
Skanska Capital Markets Day June 2012
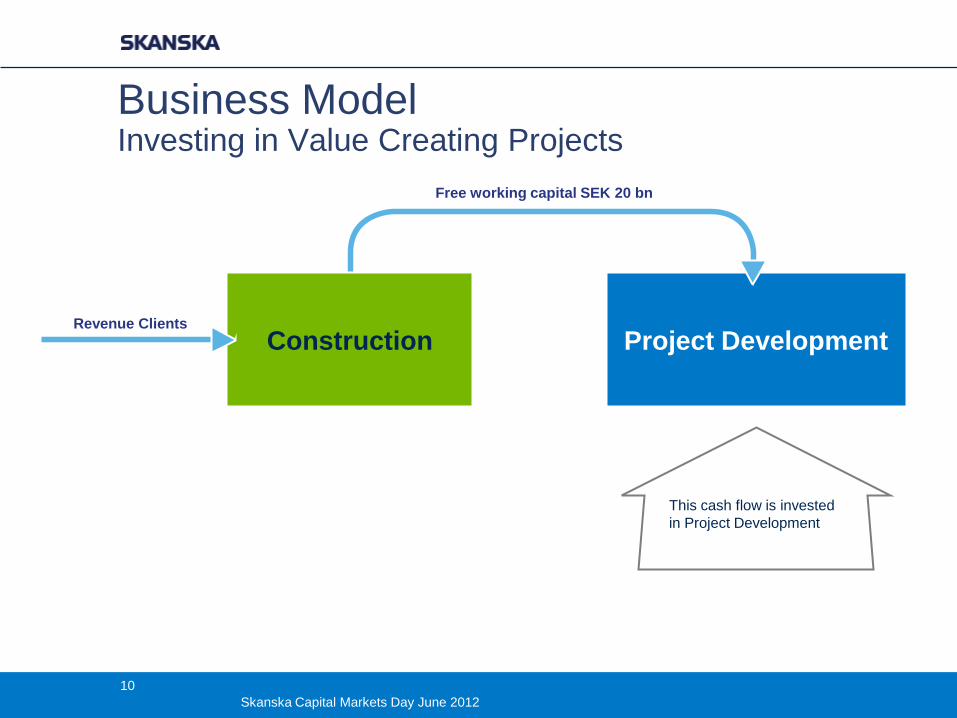
Business Model Investing in Value Creating Projects
Revenue Clients
Construction Project Development
This cash flow is invested
in Project Development
Free working capital SEK 20 bn
10
Skanska Capital Markets Day June 2012
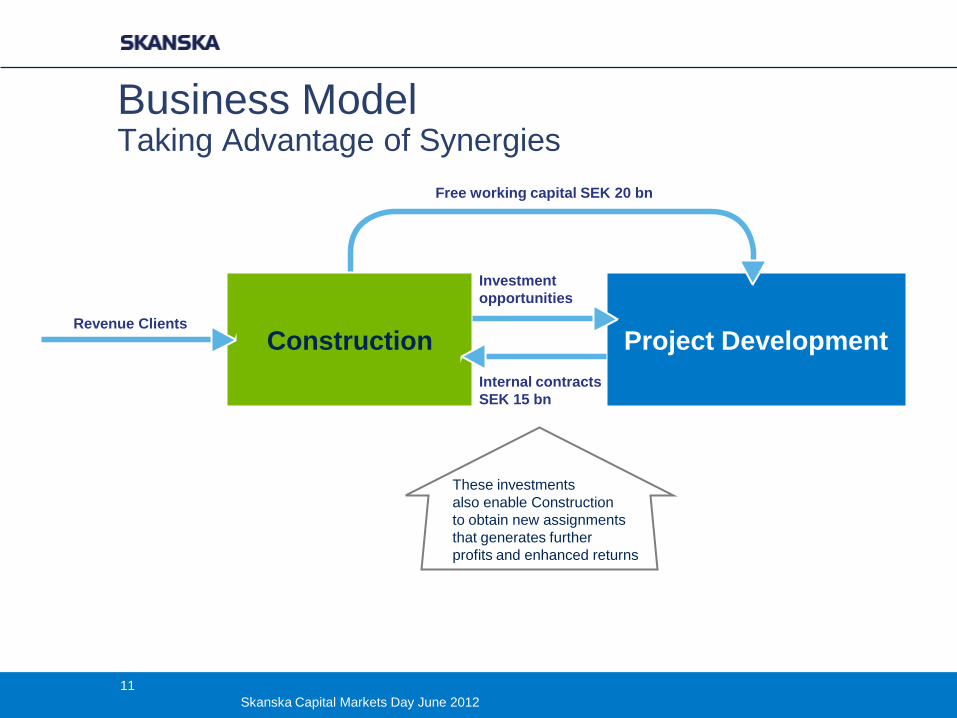
Business Model Taking Advantage of Synergies
Revenue Clients
Construction Project Development
Investment
opportunities
Internal contracts
SEK 15 bn
These investments
also enable Construction
to obtain new assignments
that generates further
profits and enhanced returns
Free working capital SEK 20 bn
11
Skanska Capital Markets Day June 2012
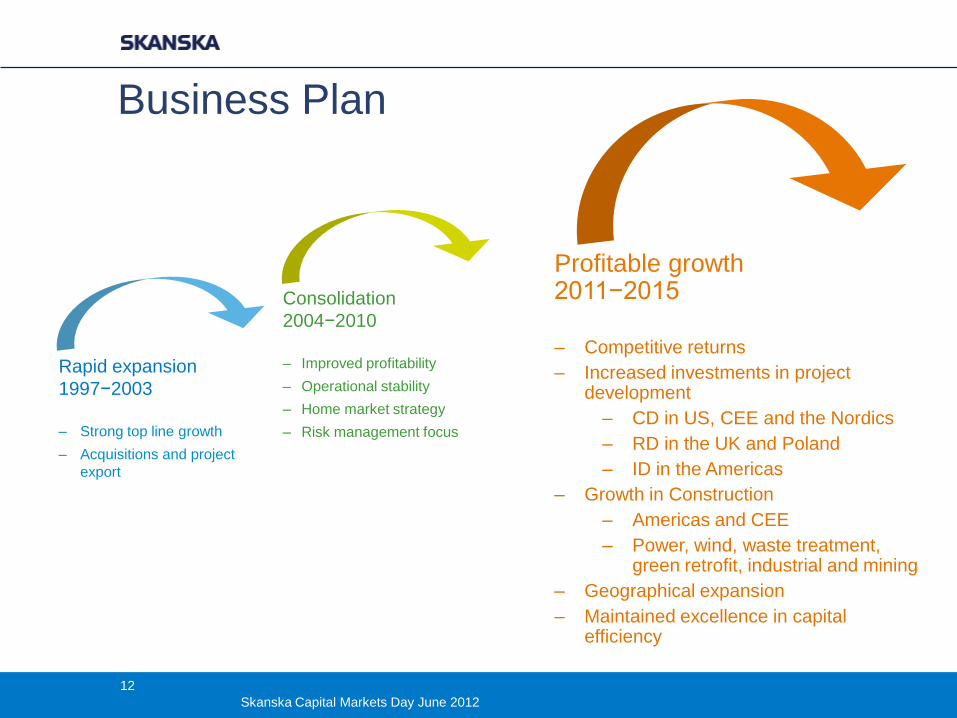
Business Plan
Profitable growth 2011−2015 ‒ Competitive returns
‒ Increased investments in project development
‒ CD in US, CEE and the Nordics
‒ RD in the UK and Poland
‒ ID in the Americas
‒ Growth in Construction
‒ Americas and CEE
‒ Power, wind, waste treatment, green retrofit, industrial and mining
‒ Geographical expansion
‒ Maintained excellence in capital efficiency
Rapid expansion
1997−2003
‒ Strong top line growth
‒ Acquisitions and project
export
Consolidation
2004−2010
‒ Improved profitability
‒ Operational stability
‒ Home market strategy
‒ Risk management focus
12
Skanska Capital Markets Day June 2012
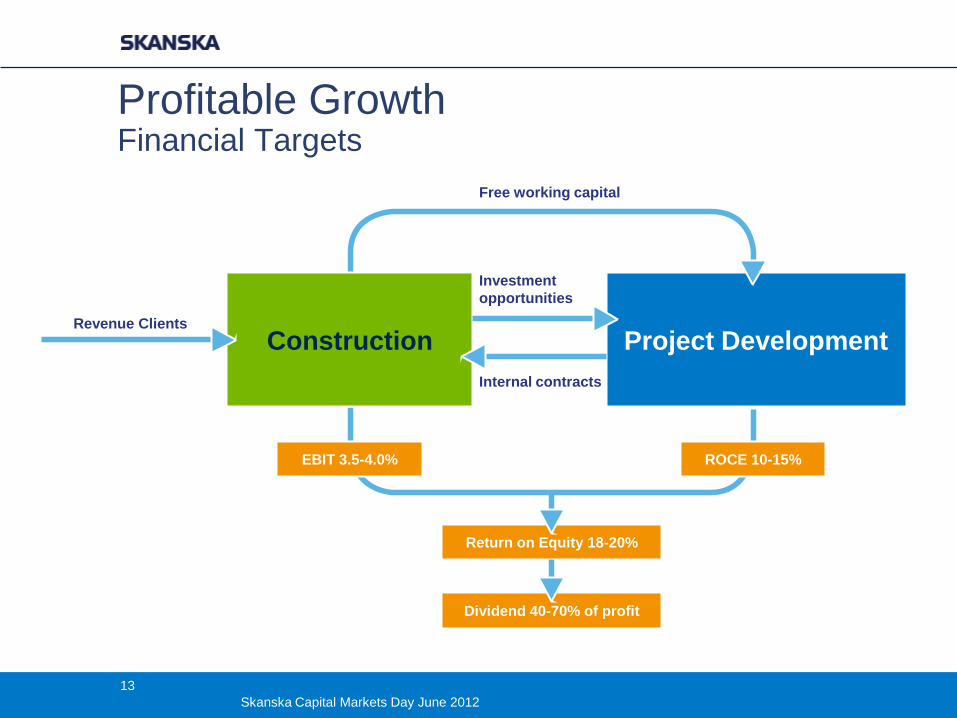
Dividend 40-70% of profit
Profitable Growth Financial Targets
Revenue Clients
Construction Project Development
Free working capital
EBIT 3.5-4.0%
Investment
opportunities
Internal contracts
ROCE 10-15%
Return on Equity 18-20%
13
Skanska Capital Markets Day June 2012
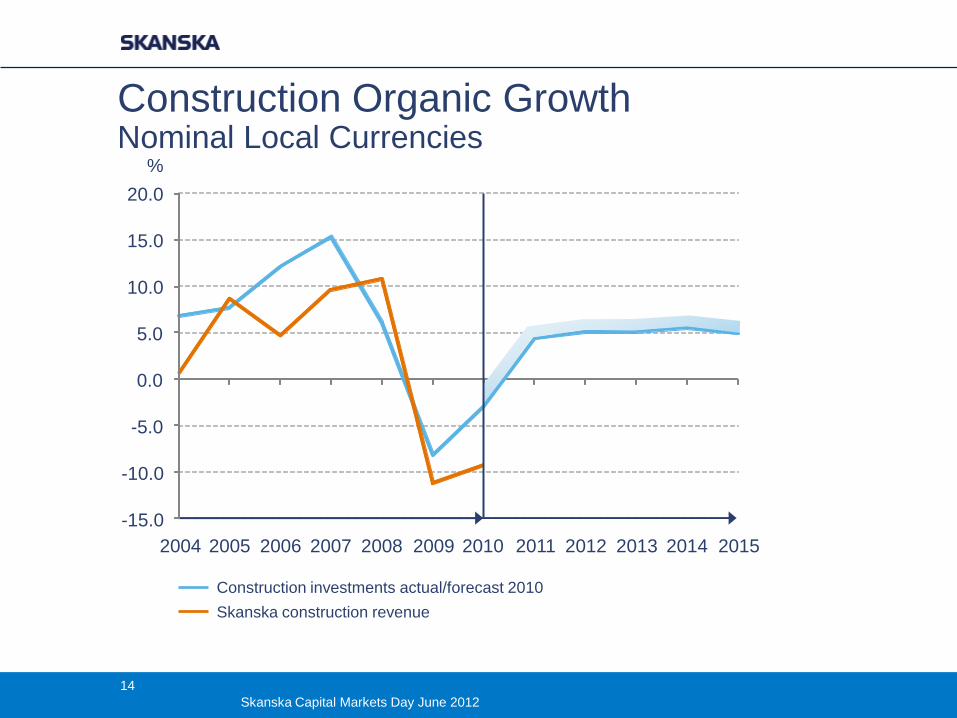
Construction Organic Growth Nominal Local Currencies
2004 2005 2006 2007 2008 2009 2010 2011 2012 2013 2014 2015
Construction investments actual/forecast 2010
Skanska construction revenue
-15.0
-10.0
-5.0
0.0
5.0
10.0
15.0
20.0
%
14
Skanska Capital Markets Day June 2012
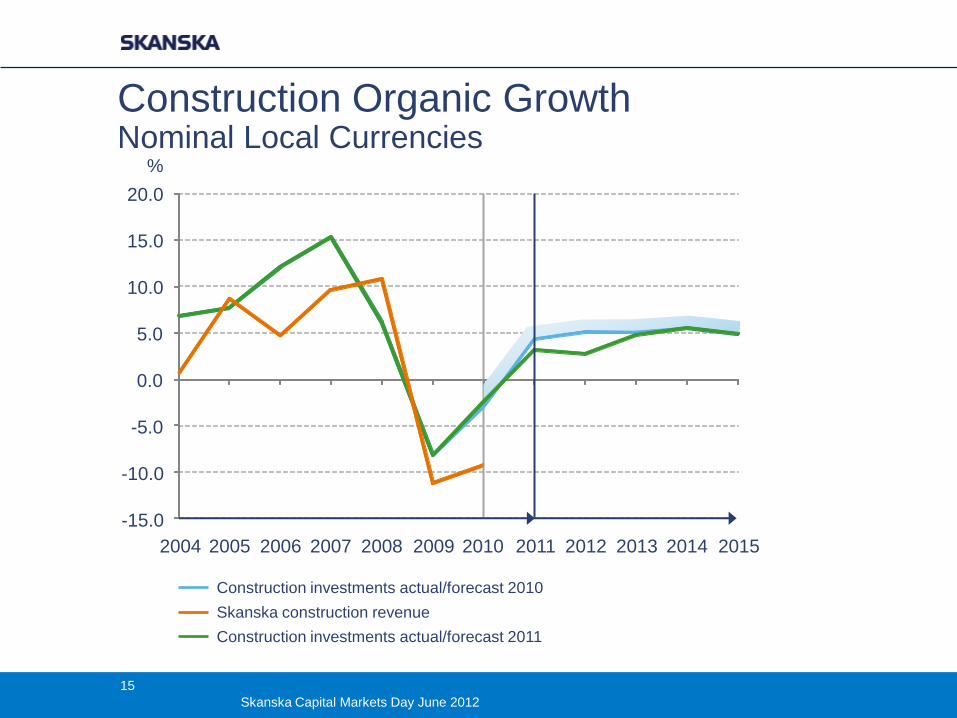
Construction Organic Growth Nominal Local Currencies
Construction investments actual/forecast 2010
Skanska construction revenue
Construction investments actual/forecast 2011
2004 2005 2006 2007 2008 2009 2010 2011 2012 2013 2014 2015
-15.0
-10.0
-5.0
0.0
5.0
10.0
15.0
20.0
%
15
Skanska Capital Markets Day June 2012
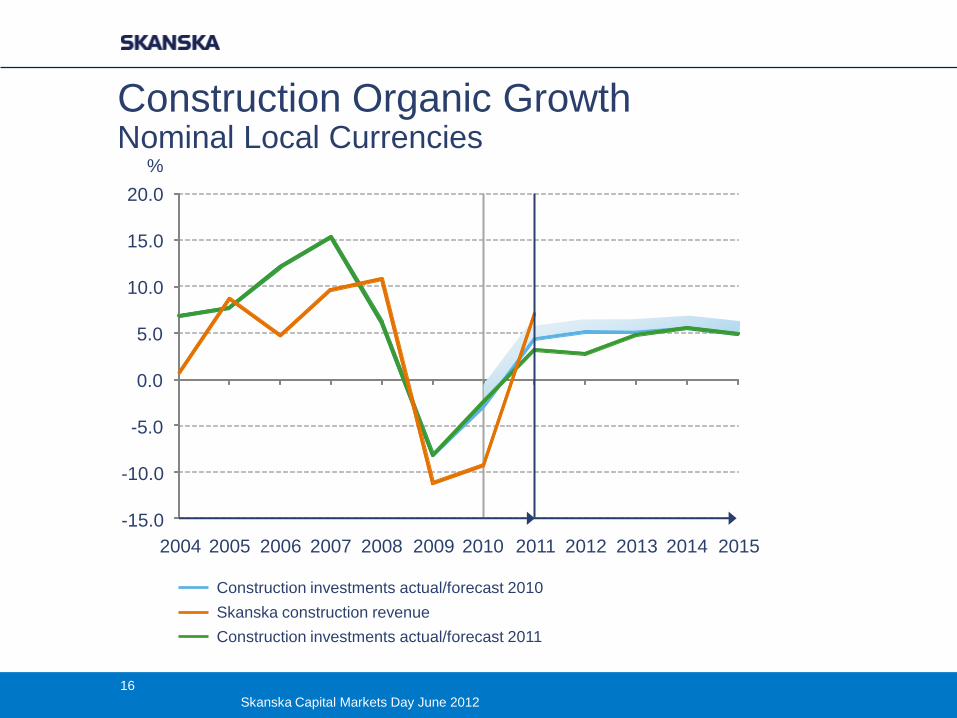
Construction Organic Growth Nominal Local Currencies
Construction investments actual/forecast 2010
Skanska construction revenue
Construction investments actual/forecast 2011
2004 2005 2006 2007 2008 2009 2010 2011 2012 2013 2014 2015
-15.0
-10.0
-5.0
0.0
5.0
10.0
15.0
20.0
%
16
Skanska Capital Markets Day June 2012

Construction Growth Nominal Local Currencies
0,0%
1,0%
2,0%
3,0%
4,0%
5,0%
6,0%
7,0%
8,0%
2003-2010 2011 2012-15
CAGR in Construction
Construction market investment growth Skanska organic construction revenue growth
17
Skanska Capital Markets Day June 2012
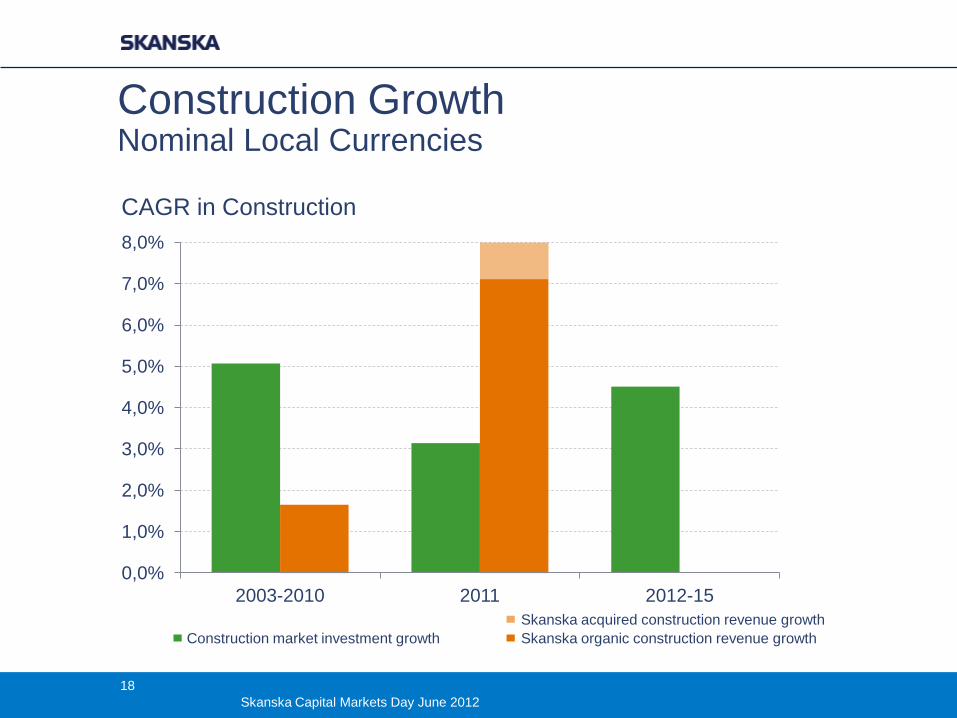
Construction Growth Nominal Local Currencies
0,0%
1,0%
2,0%
3,0%
4,0%
5,0%
6,0%
7,0%
8,0%
2003-2010 2011 2012-15
CAGR in Construction
Construction market investment growth Skanska organic construction revenue growth
Skanska acquired construction revenue growth
18
Skanska Capital Markets Day June 2012
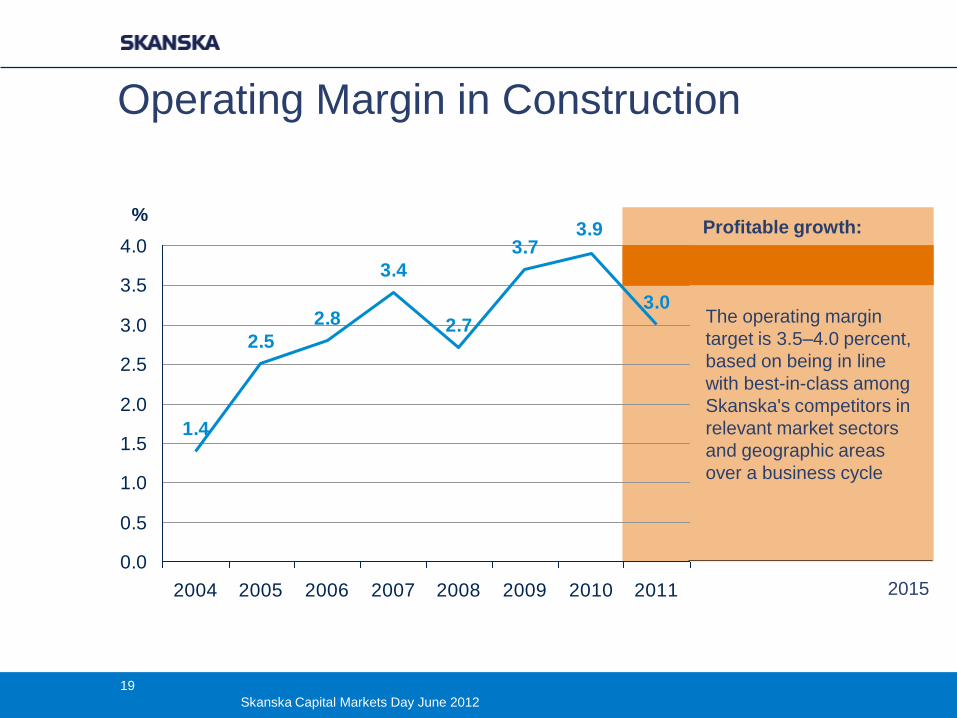
Operating Margin in Construction
1.4
2.5
2.8
3.4
2.7
3.7
3.0
3.9
0.0
0.5
1.0
1.5
2.0
2.5
3.0
3.5
4.0
2004 2005 2006 2007 2008 2009 2010 2011
%
2015
The operating margin
target is 3.5–4.0 percent,
based on being in line
with best-in-class among
Skanska's competitors in
relevant market sectors
and geographic areas
over a business cycle
Profitable growth:
19
Skanska Capital Markets Day June 2012
Profitable growth:
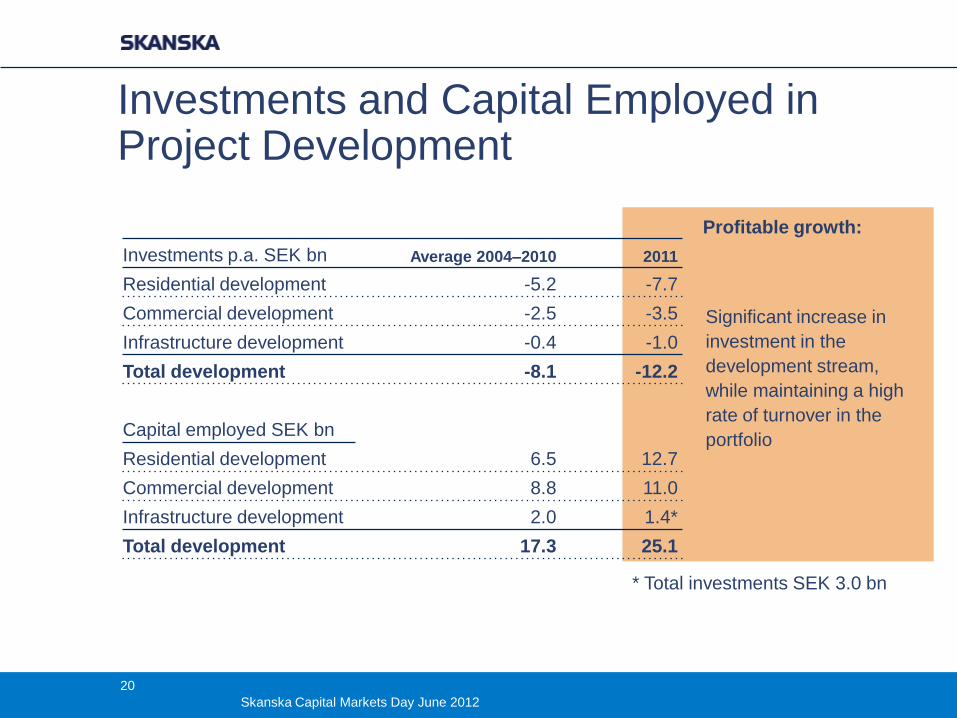
Investments and Capital Employed in Project Development
Investments p.a. SEK bn Average 2004–2010 2011
Residential development -5.2 -7.7
Commercial development -2.5 -3.5
Infrastructure development -0.4 -1.0
Total development -8.1 -12.2
Capital employed SEK bn
Residential development 6.5 12.7
Commercial development 8.8 11.0
Infrastructure development 2.0 1.4*
Total development 17.3 25.1
Significant increase in
investment in the
development stream,
while maintaining a high
rate of turnover in the
portfolio
* Total investments SEK 3.0 bn
20
Skanska Capital Markets Day June 2012
Profitable growth:
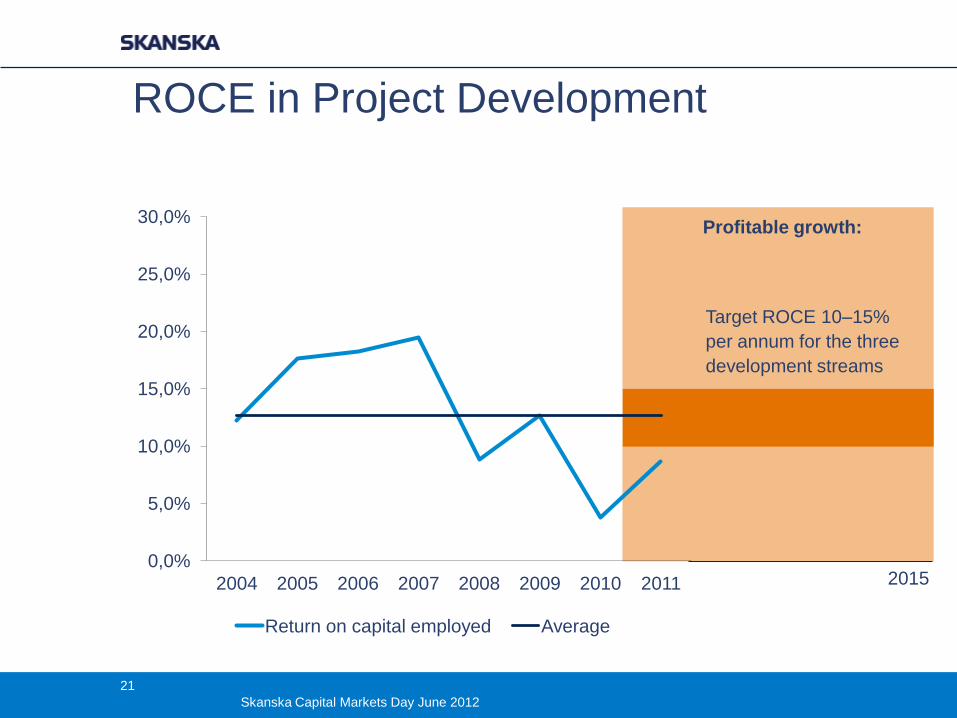
ROCE in Project Development
2015
Target ROCE 10–15%
per annum for the three
development streams
0,0%
5,0%
10,0%
15,0%
20,0%
25,0%
30,0%
2004 2005 2006 2007 2008 2009 2010 2011
Return on capital employed Average
21
Skanska Capital Markets Day June 2012
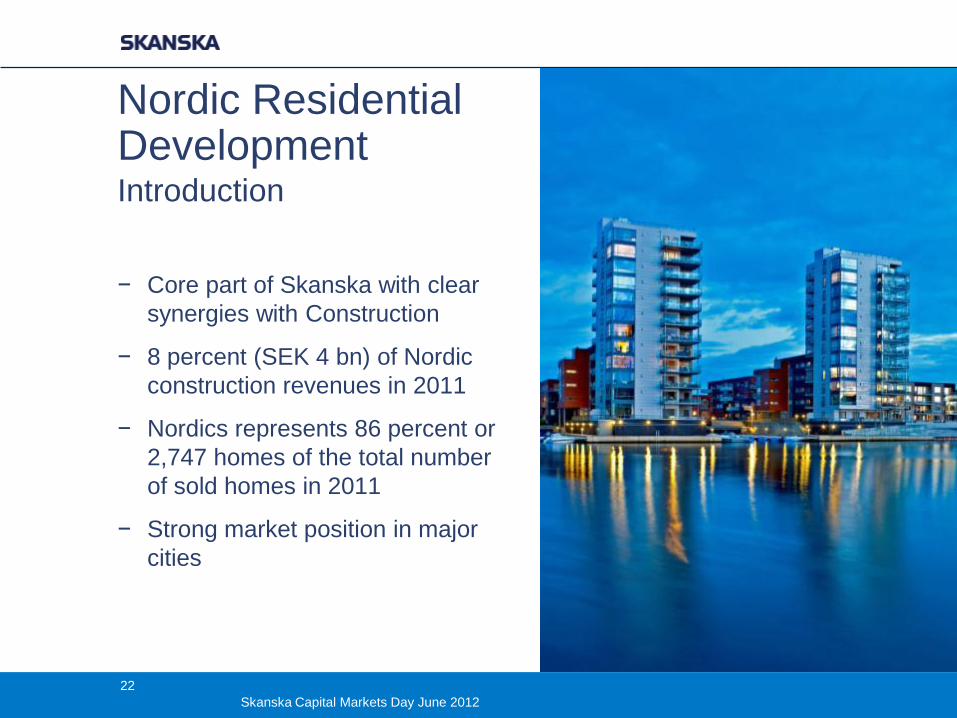
Nordic Residential Development Introduction
− Core part of Skanska with clear
synergies with Construction
− 8 percent (SEK 4 bn) of Nordic
construction revenues in 2011
− Nordics represents 86 percent or
2,747 homes of the total number
of sold homes in 2011
− Strong market position in major
cities
22
Skanska Capital Markets Day June 2012
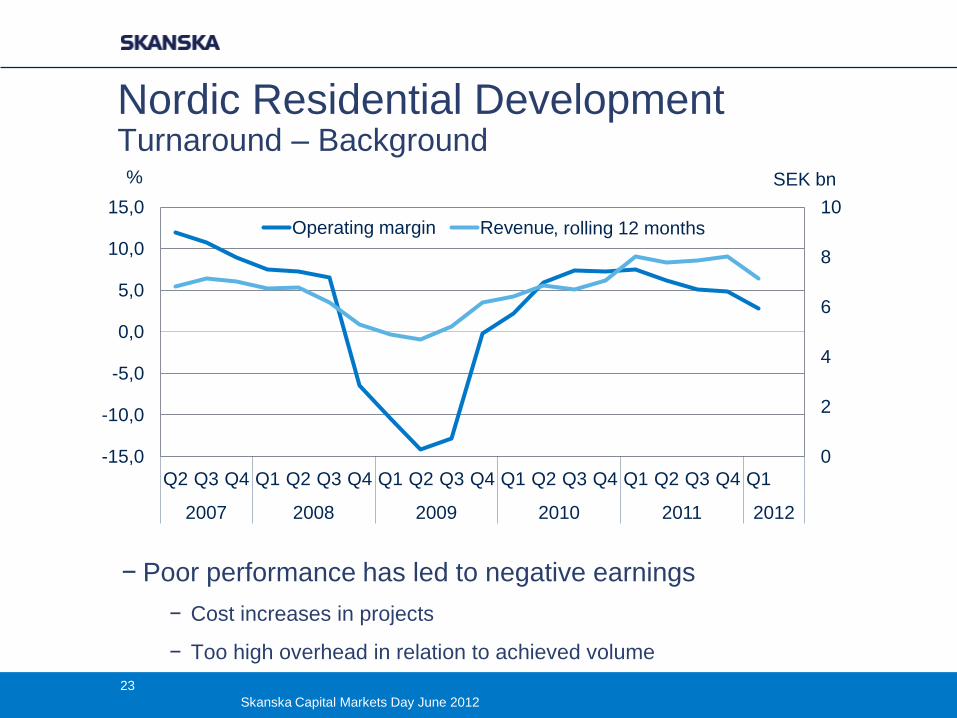
0
2
4
6
8
10
-15,0
-10,0
-5,0
0,0
5,0
10,0
15,0
Q2 Q3 Q4 Q1 Q2 Q3 Q4 Q1 Q2 Q3 Q4 Q1 Q2 Q3 Q4 Q1 Q2 Q3 Q4 Q1
2007 2008 2009 2010 2011 2012
SEK bn %
Operating margin Revenue
Nordic Residential Development Turnaround – Background
− Poor performance has led to negative earnings
− Cost increases in projects
− Too high overhead in relation to achieved volume
, rolling 12 months
23
Skanska Capital Markets Day June 2012
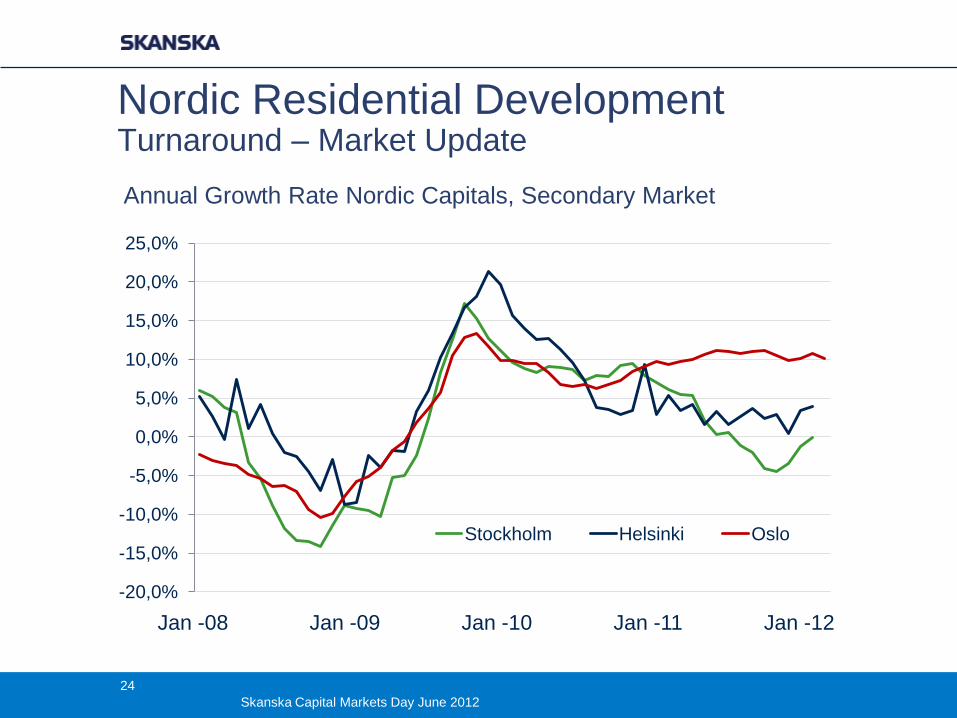
Nordic Residential Development Turnaround – Market Update
Annual Growth Rate Nordic Capitals, Secondary Market
-20,0%
-15,0%
-10,0%
-5,0%
0,0%
5,0%
10,0%
15,0%
20,0%
25,0%
Stockholm Helsinki Oslo
Jan -08 Jan -09 Jan -10 Jan -11 Jan -12
24
Skanska Capital Markets Day June 2012
Nordic Residential Development Turnaround – Market Update
Long term perspective
− Urbanization trend expected to continue
− Should support continued strong demand for new housing in major city
regions
Short and medium term
− Nordic economies not significantly impacted by EUR and other macro
economic turbulence
− Sale volumes and prices holding up relatively well
− Unemployment and interest rates remain key determining factors
25
Skanska Capital Markets Day June 2012
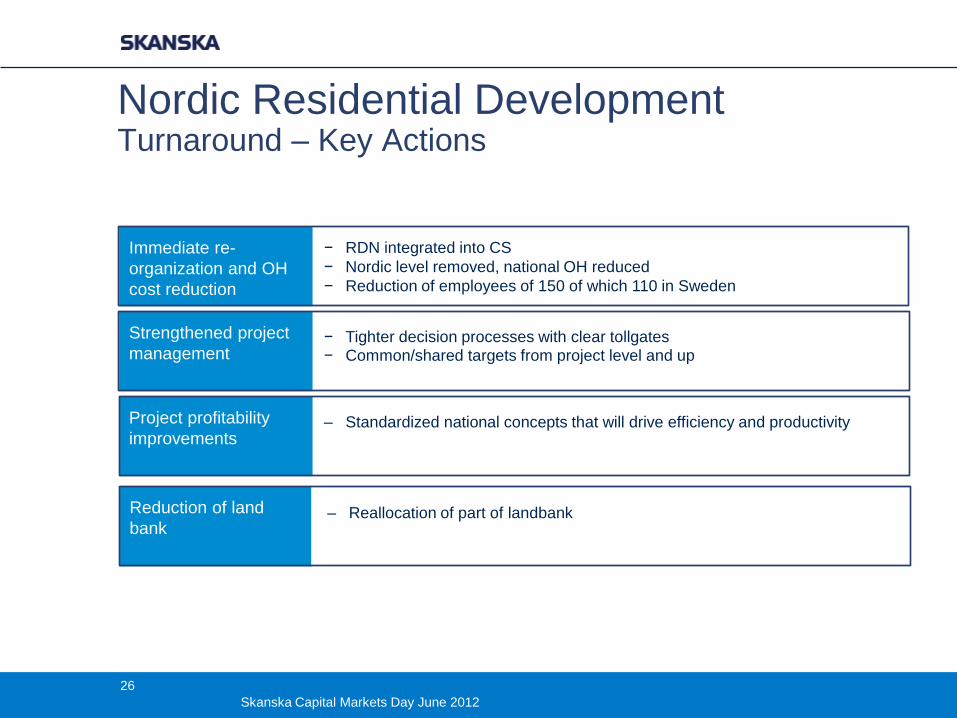
Nordic Residential Development Turnaround – Key Actions
− RDN integrated into CS
− Nordic level removed, national OH reduced
− Reduction of employees of 150 of which 110 in Sweden
− Tighter decision processes with clear tollgates − Common/shared targets from project level and up
‒ Standardized national concepts that will drive efficiency and productivity
Immediate re-
organization and OH
cost reduction
Strengthened project
management
Project profitability
improvements
Reduction of land
bank ‒ Reallocation of part of landbank
26
Skanska Capital Markets Day June 2012
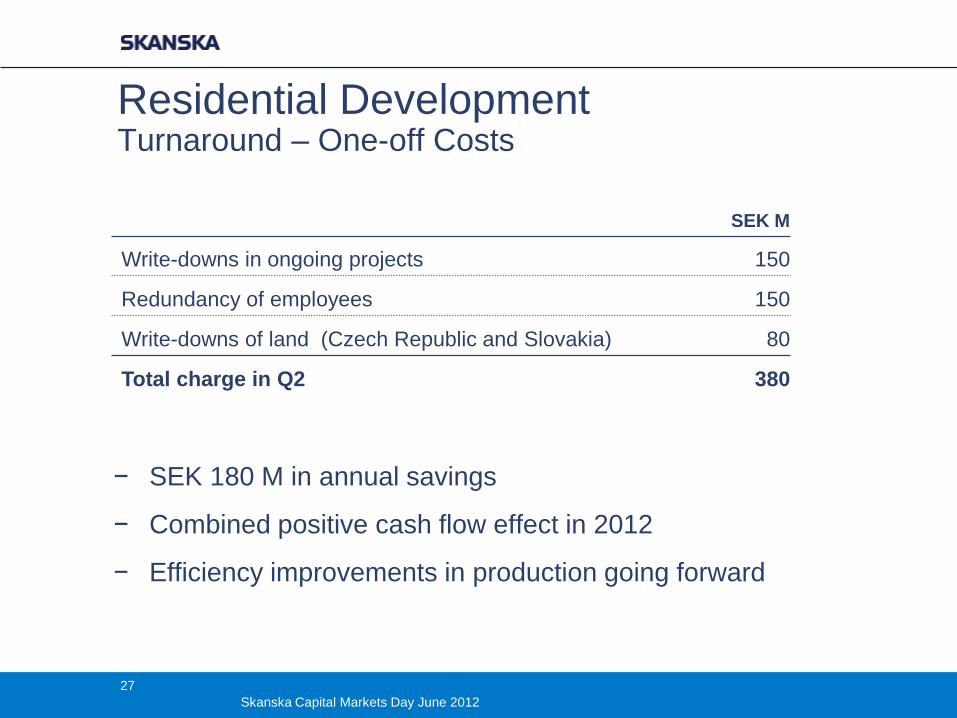
Residential Development Turnaround – One-off Costs
SEK M
Write-downs in ongoing projects 150
Redundancy of employees 150
Write-downs of land (Czech Republic and Slovakia) 80
Total charge in Q2 380
− SEK 180 M in annual savings
− Combined positive cash flow effect in 2012
− Efficiency improvements in production going forward
27
Skanska Capital Markets Day June 2012
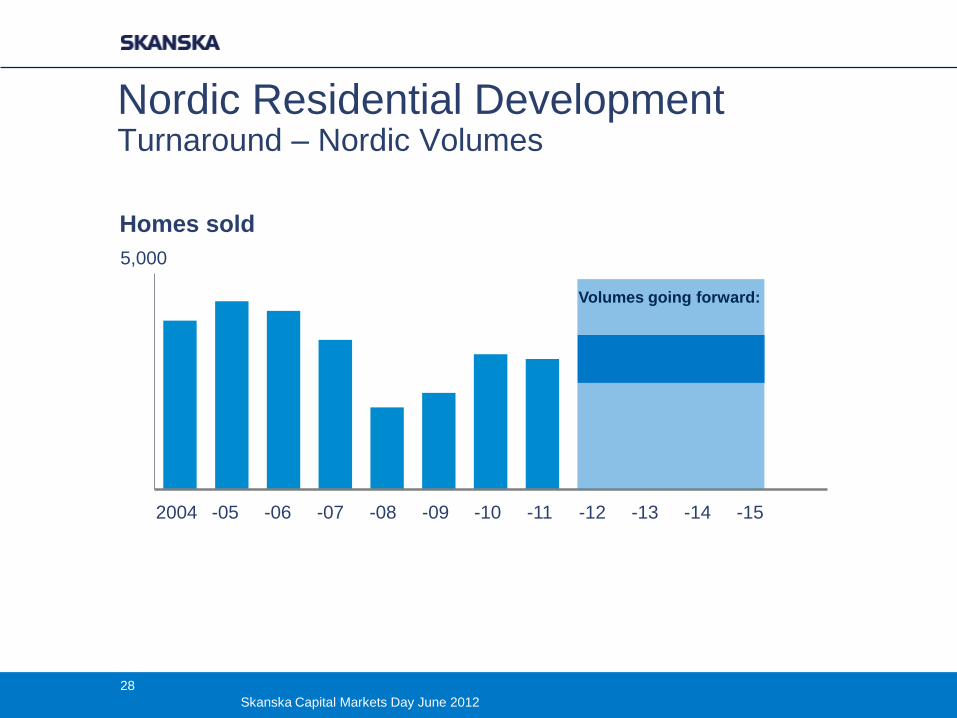
5,000
Homes sold
Nordic Residential Development Turnaround – Nordic Volumes
2004 -15 -14 -13 -12 -11 -10 -09 -08 -07 -06 -05
Volumes going forward:
28
Skanska Capital Markets Day June 2012
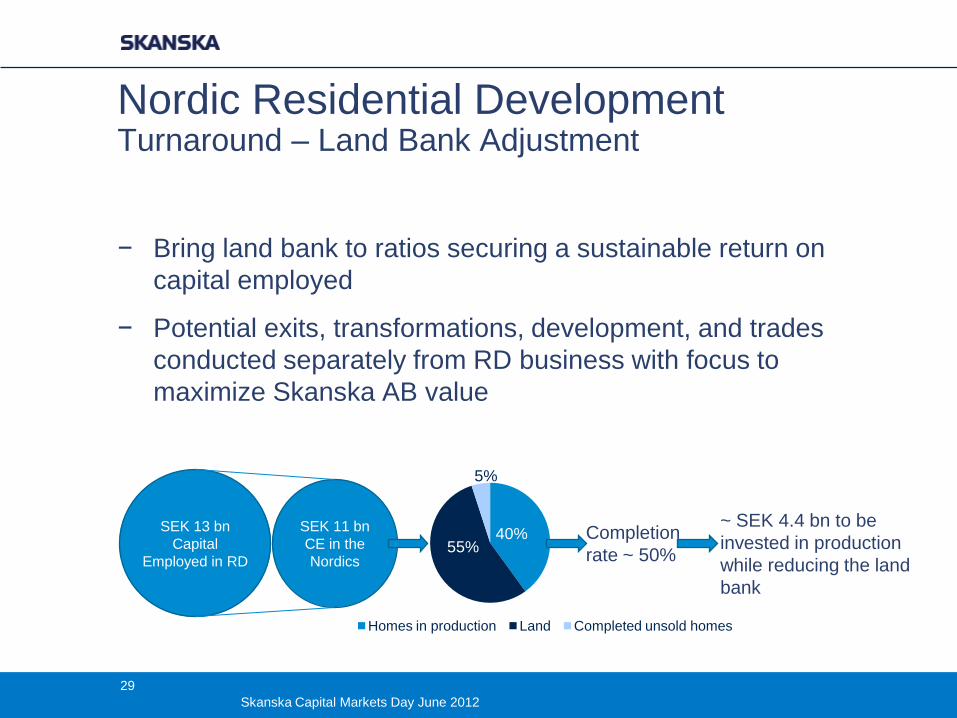
Nordic Residential Development Turnaround – Land Bank Adjustment
− Bring land bank to ratios securing a sustainable return on
capital employed
− Potential exits, transformations, development, and trades
conducted separately from RD business with focus to
maximize Skanska AB value
SEK 13 bn
Capital
Employed in RD
SEK 11 bn
CE in the
Nordics
40% 55%
5%
Homes in production Land Completed unsold homes
Completion
rate ~ 50%
~ SEK 4.4 bn to be
invested in production
while reducing the land
bank
29
Skanska Capital Markets Day June 2012
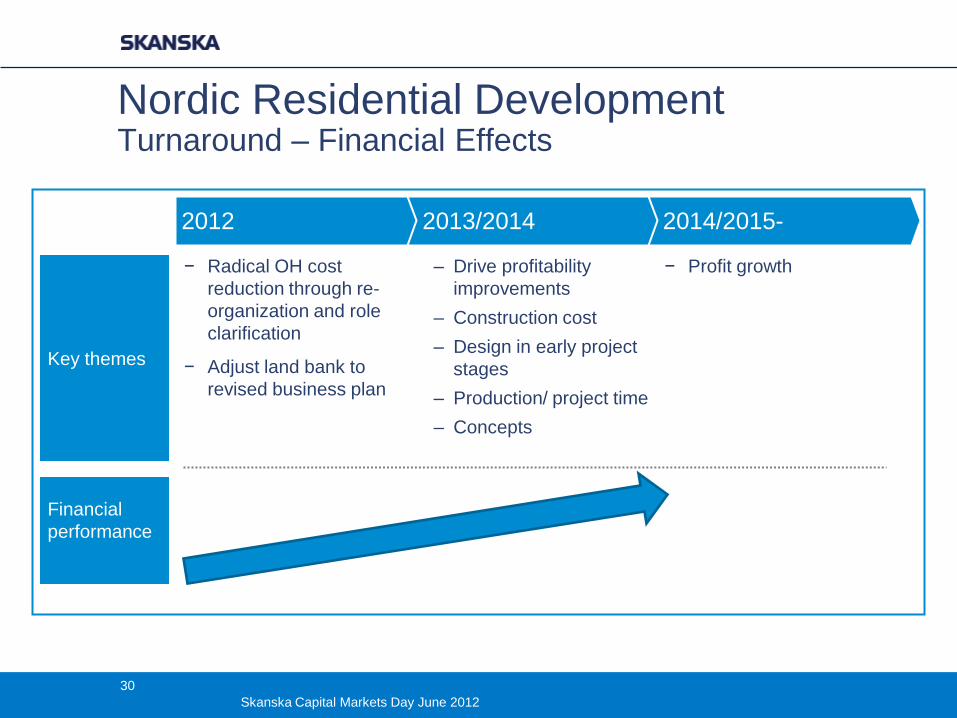
Key themes
Financial
performance
− Radical OH cost
reduction through re-
organization and role
clarification
− Adjust land bank to
revised business plan
− Profit growth
2012 2013/2014 2014/2015-
– Drive profitability
improvements
– Construction cost
– Design in early project
stages
– Production/ project time
– Concepts
Nordic Residential Development Turnaround – Financial Effects
30
Skanska Capital Markets Day June 2012
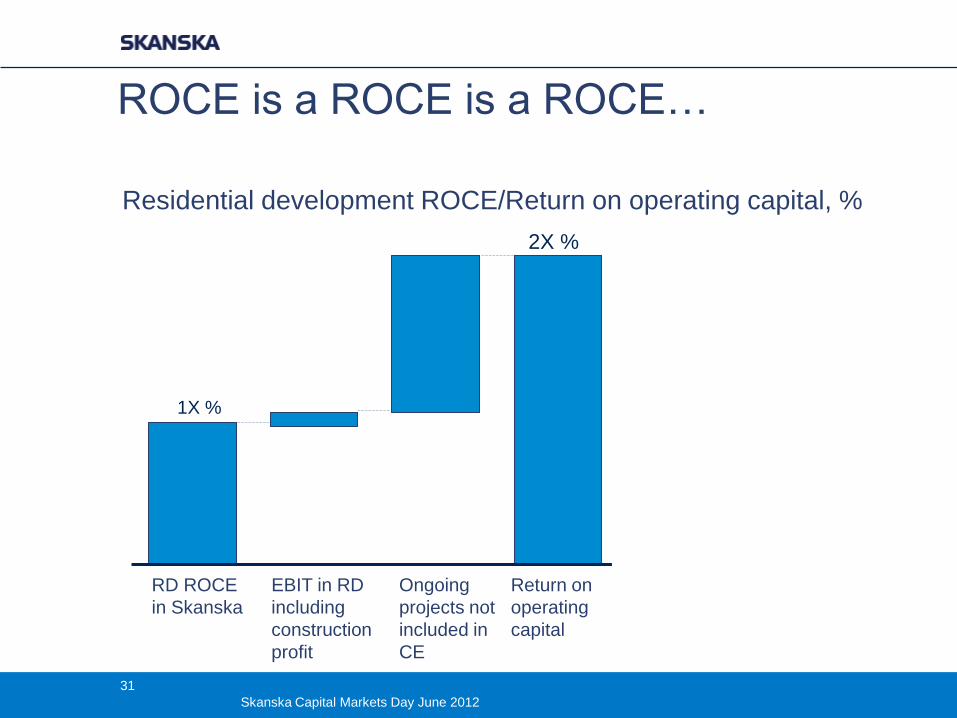
ROCE is a ROCE is a ROCE…
Residential development ROCE/Return on operating capital, %
31
RD ROCE
in Skanska
Return on
operating
capital
Ongoing
projects not
included in
CE
EBIT in RD
including
construction
profit
1X %
2X %
31
Skanska Capital Markets Day June 2012
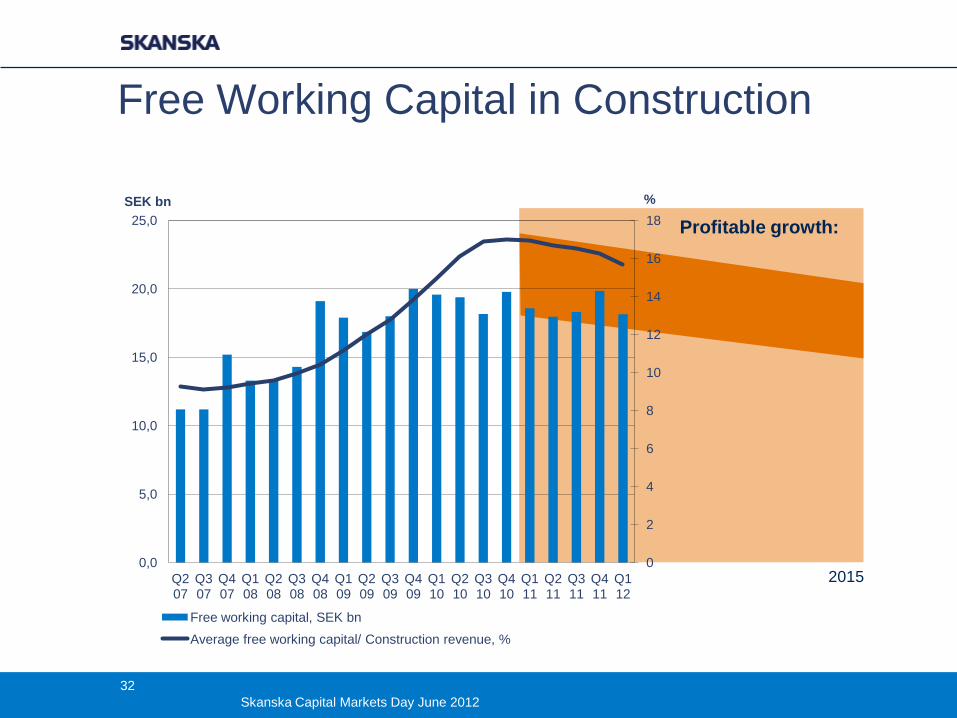
Free Working Capital in Construction
2015 0
2
4
6
8
10
12
14
16
18
0,0
5,0
10,0
15,0
20,0
25,0
Q2 07
Q3 07
Q4 07
Q1 08
Q2 08
Q3 08
Q4 08
Q1 09
Q2 09
Q3 09
Q4 09
Q1 10
Q2 10
Q3 10
Q4 10
Q1 11
Q2 11
Q3 11
Q4 11
Q1 12
% SEK bn
Free working capital, SEK bn
Average free working capital/ Construction revenue, %
Profitable growth:
32
Skanska Capital Markets Day June 2012
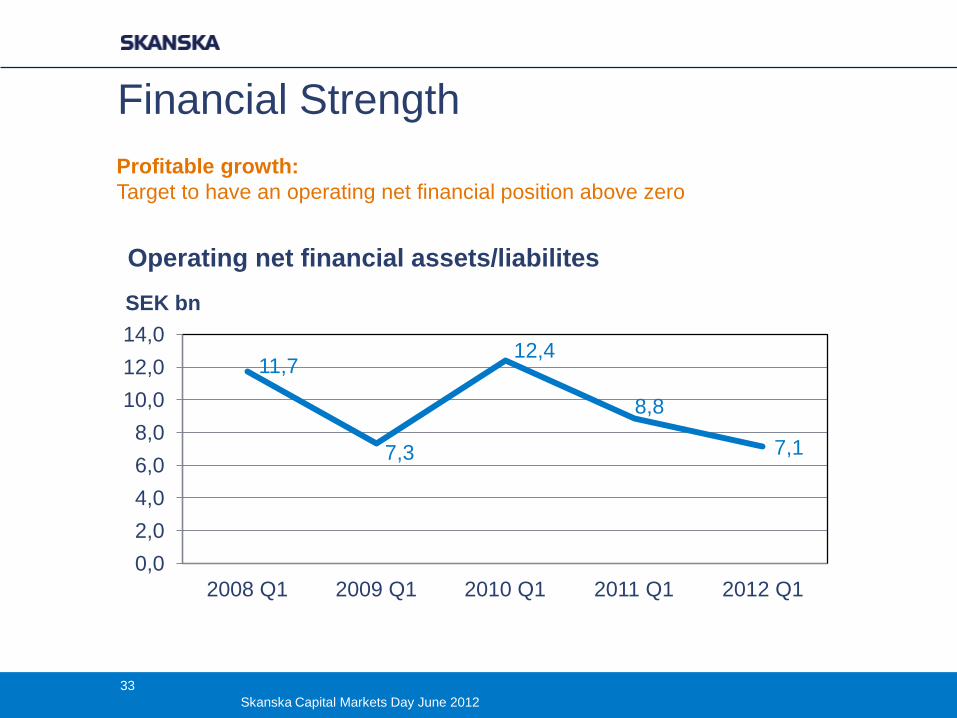
Financial Strength Profitable growth:
Target to have an operating net financial position above zero
11,7
7,3
12,4
8,8
7,1
0,0
2,0
4,0
6,0
8,0
10,0
12,0
14,0
2008 Q1 2009 Q1 2010 Q1 2011 Q1 2012 Q1
SEK bn
Operating net financial assets/liabilites
33
Skanska Capital Markets Day June 2012
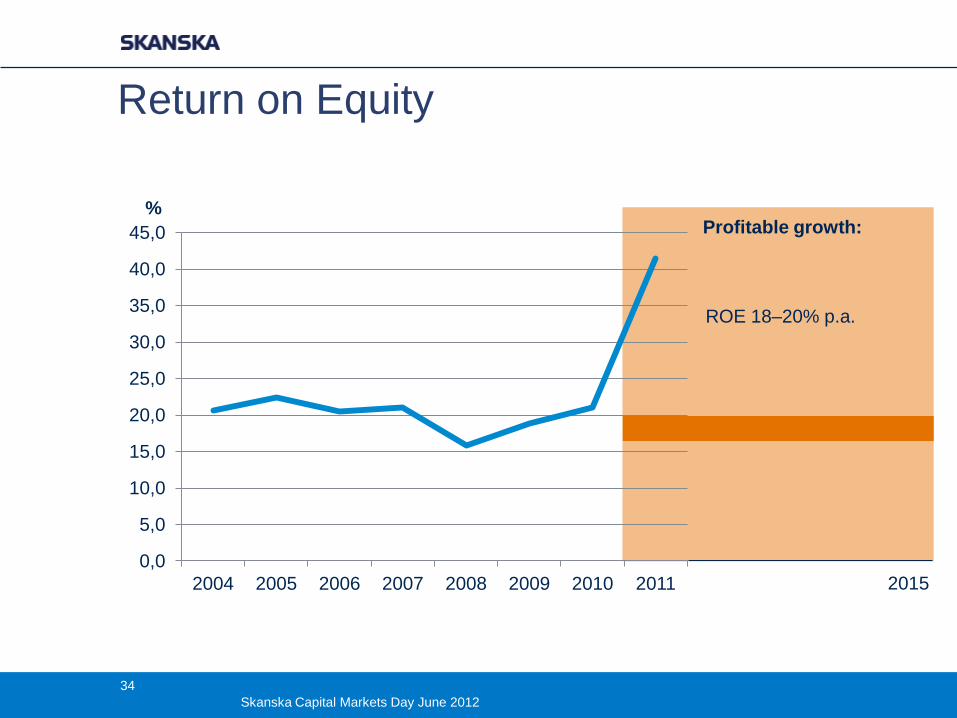
Profitable growth:
2015
ROE 18–20% p.a.
Return on Equity
0,0
5,0
10,0
15,0
20,0
25,0
30,0
35,0
40,0
45,0
2004 2005 2006 2007 2008 2009 2010 2011
%
34
Skanska Capital Markets Day June 2012
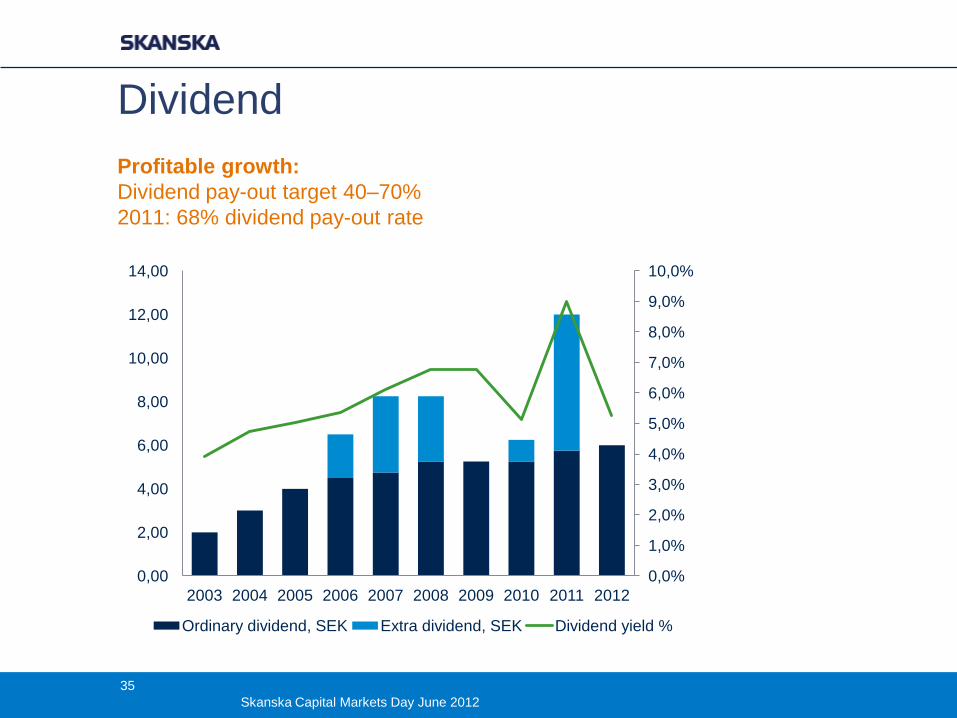
Dividend
0,0%
1,0%
2,0%
3,0%
4,0%
5,0%
6,0%
7,0%
8,0%
9,0%
10,0%
0,00
2,00
4,00
6,00
8,00
10,00
12,00
14,00
2003 2004 2005 2006 2007 2008 2009 2010 2011 2012
Ordinary dividend, SEK Extra dividend, SEK Dividend yield %
.
Profitable growth:
Dividend pay-out target 40–70%
2011: 68% dividend pay-out rate
35
Skanska Capital Markets Day June 2012
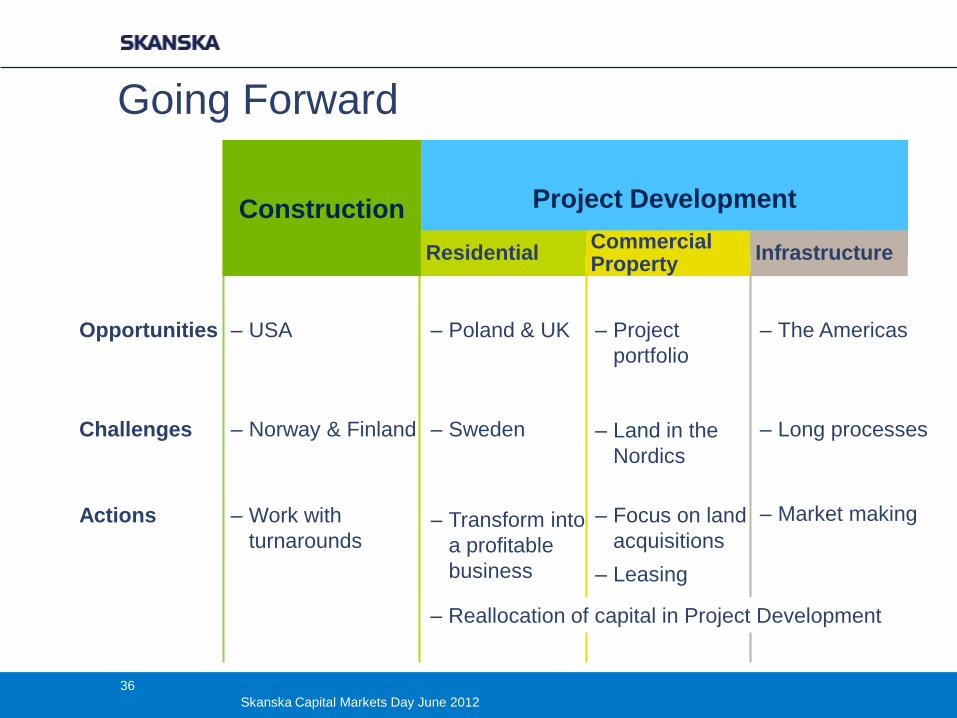
Going Forward
Challenges
Actions ‒ Transform into
a profitable
business
‒ Focus on land
acquisitions
‒ Leasing
‒ Work with
turnarounds
‒ Sweden ‒ Long processes ‒ Norway & Finland
Construction Project Development
Infrastructure Commercial Property
Residential
Opportunities ‒ Poland & UK ‒ Project
portfolio
‒ The Americas ‒ USA
‒ Land in the
Nordics
‒ Market making
‒ Reallocation of capital in Project Development
36
Skanska Capital Markets Day June 2012

Skanska in the U.S.
Mike McNally
37
Skanska Capital Markets Day June 2012
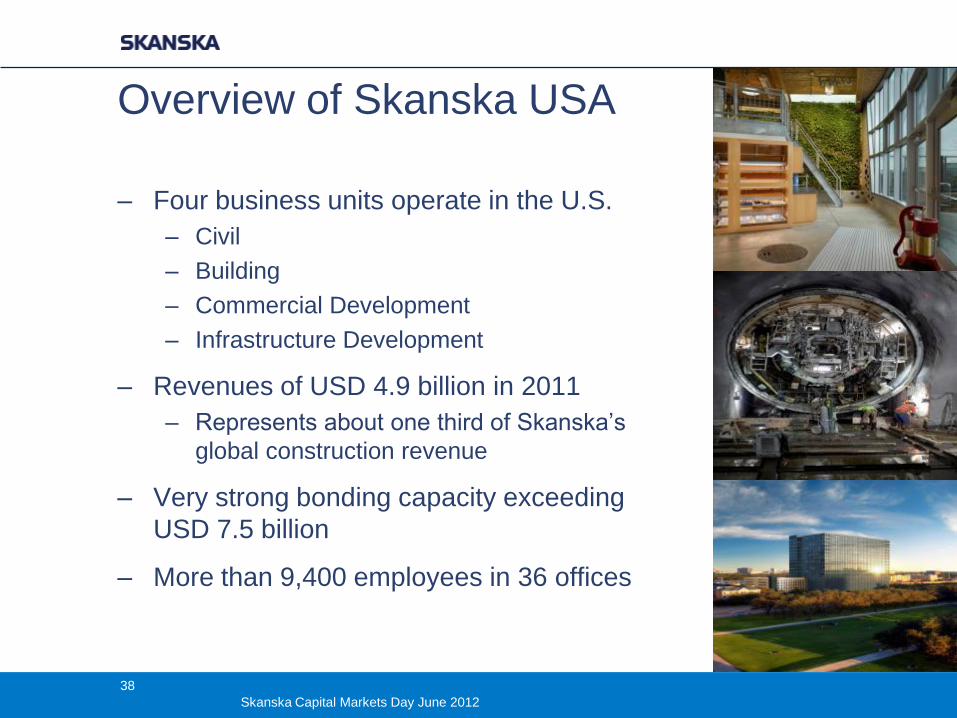
Overview of Skanska USA
– Four business units operate in the U.S.
– Civil
– Building
– Commercial Development
– Infrastructure Development
– Revenues of USD 4.9 billion in 2011
– Represents about one third of Skanska’s
global construction revenue
– Very strong bonding capacity exceeding
USD 7.5 billion
– More than 9,400 employees in 36 offices
38
Skanska Capital Markets Day June 2012
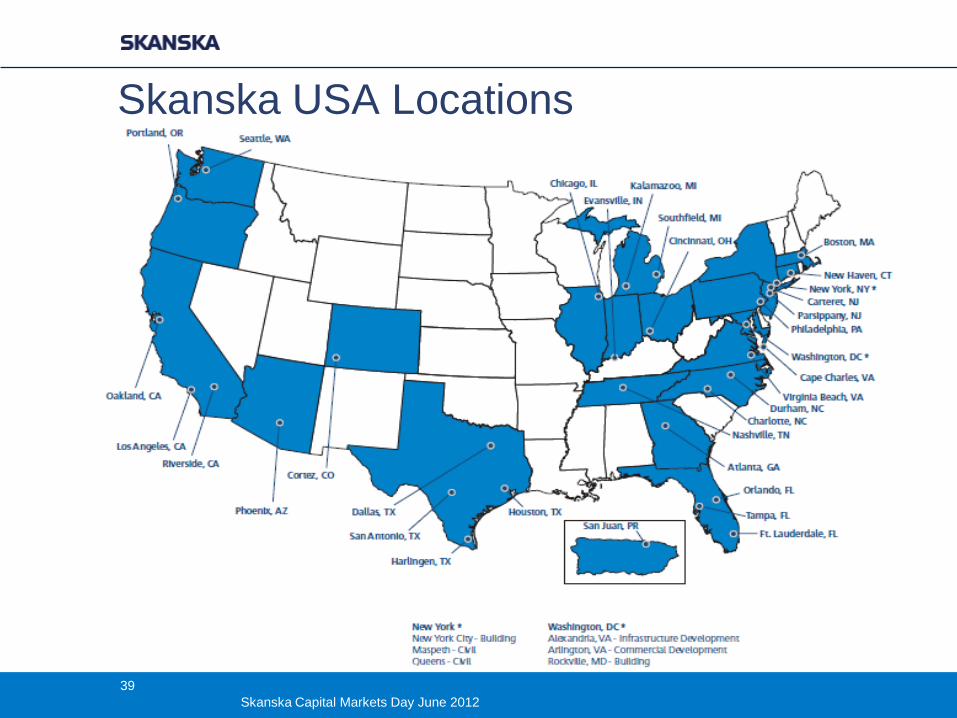
Skanska USA Locations
39
Skanska Capital Markets Day June 2012
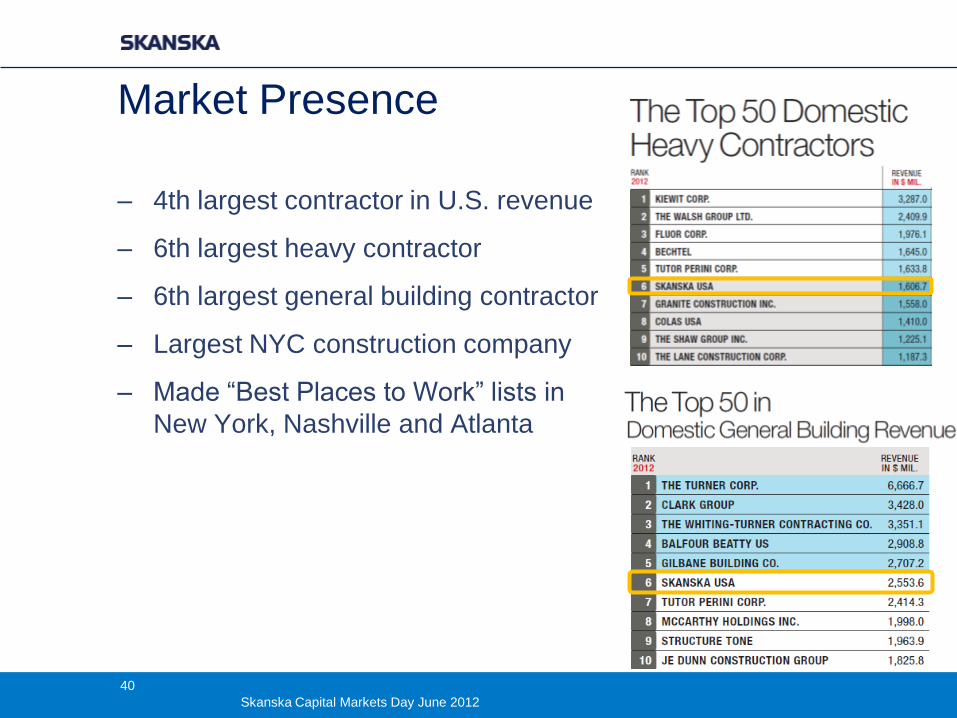
Market Presence
– 4th largest contractor in U.S. revenue
– 6th largest heavy contractor
– 6th largest general building contractor
– Largest NYC construction company
– Made “Best Places to Work” lists in
New York, Nashville and Atlanta
40
Skanska Capital Markets Day June 2012
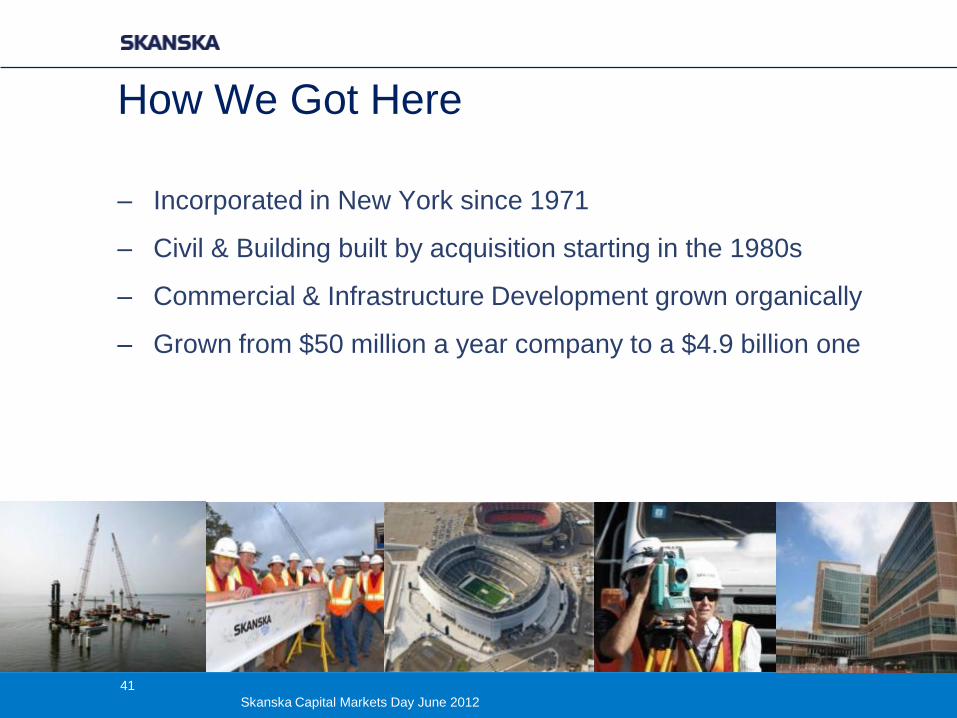
How We Got Here
– Incorporated in New York since 1971
– Civil & Building built by acquisition starting in the 1980s
– Commercial & Infrastructure Development grown organically
– Grown from $50 million a year company to a $4.9 billion one
41
Skanska Capital Markets Day June 2012
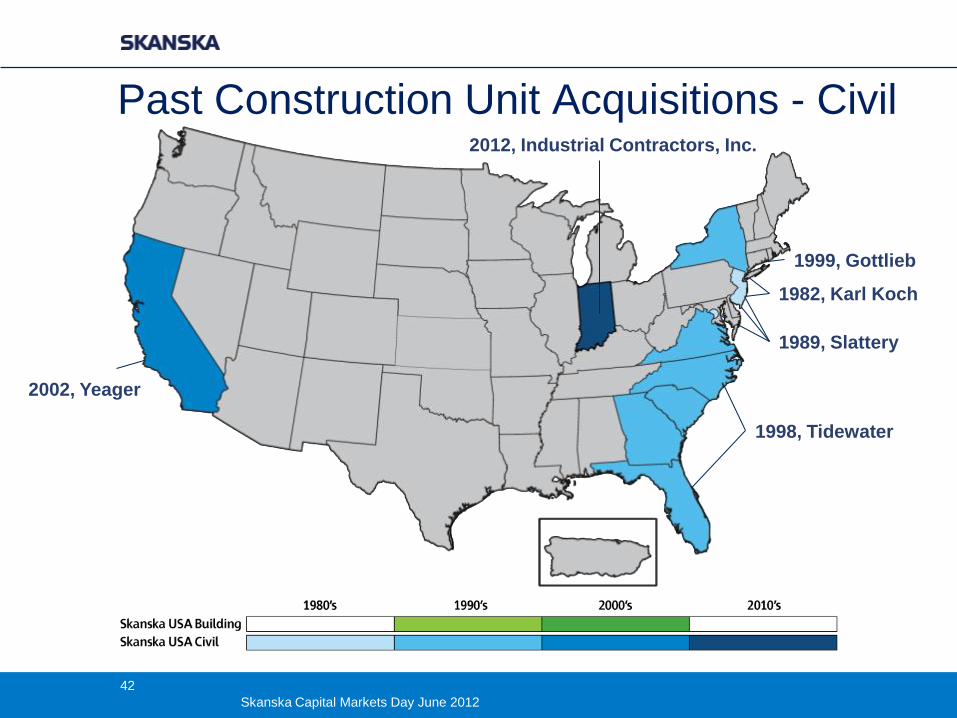
1982, Karl Koch
1989, Slattery
1998, Tidewater
1999, Gottlieb
2002, Yeager
Past Construction Unit Acquisitions - Civil 2012, Industrial Contractors, Inc.
42
Skanska Capital Markets Day June 2012
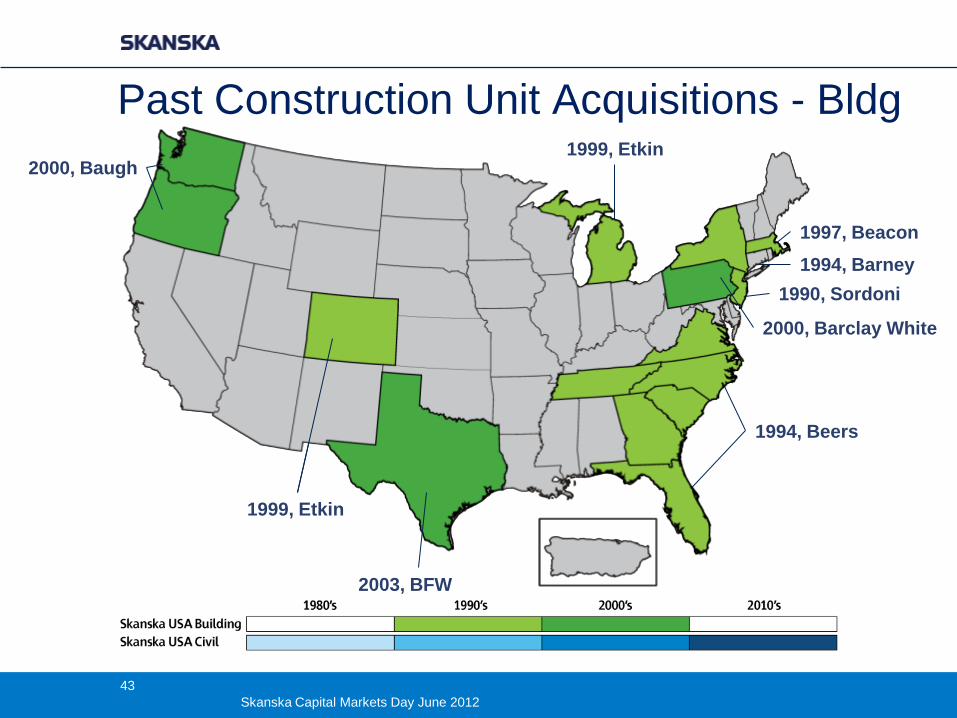
Past Construction Unit Acquisitions - Bldg
1990, Sordoni
1994, Barney
1997, Beacon
1999, Etkin
1994, Beers
1999, Etkin 2000, Baugh
2003, BFW
2000, Barclay White
43
Skanska Capital Markets Day June 2012
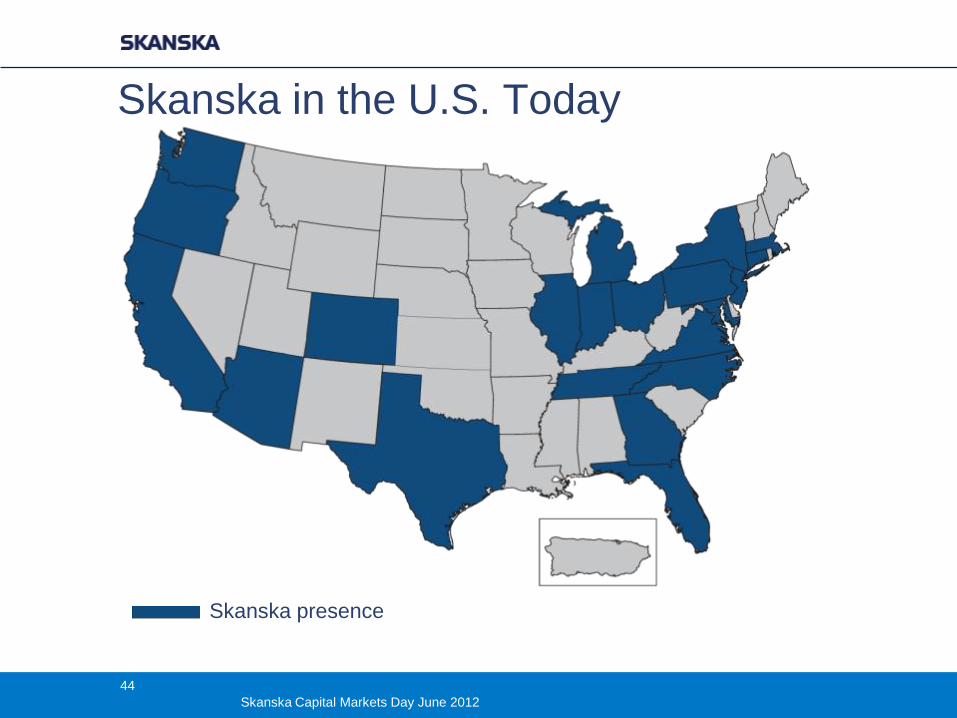
Skanska in the U.S. Today
Skanska presence
44
Skanska Capital Markets Day June 2012
Financial Results
45
Skanska Capital Markets Day June 2012
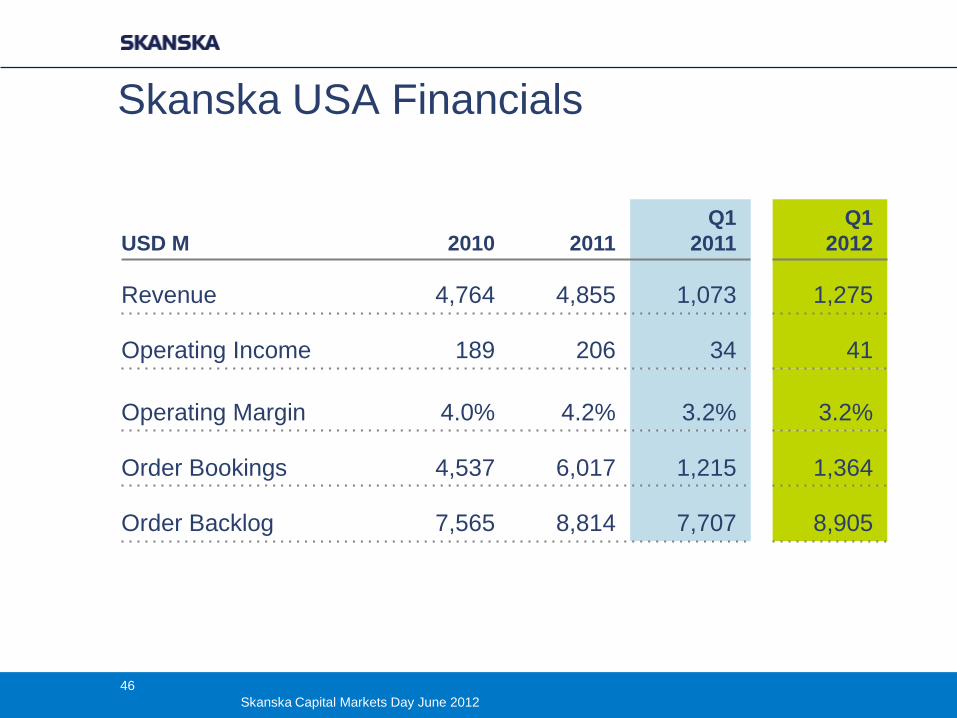
Skanska USA Financials
USD M 2010 2011
Q1
2011
Q1
2012
Revenue 4,764 4,855 1,073 1,275
Operating Income 189 206 34 41
Operating Margin 4.0% 4.2% 3.2% 3.2%
Order Bookings 4,537 6,017 1,215 1,364
Order Backlog 7,565 8,814 7,707 8,905
46
Skanska Capital Markets Day June 2012
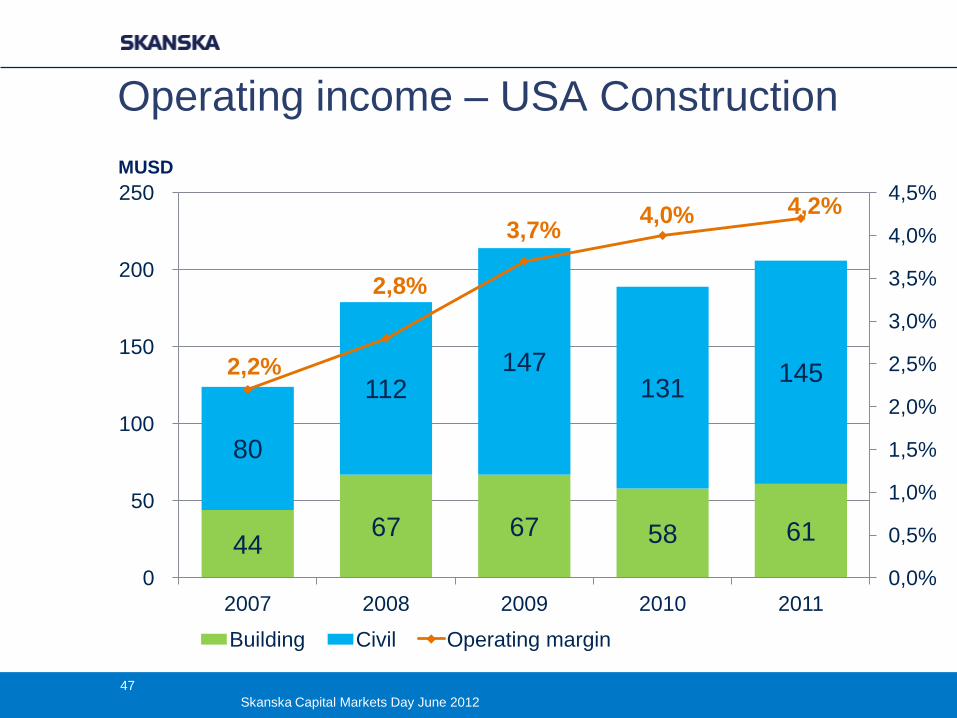
44 67 67 58 61
80
112 147
131 145 2,2%
2,8%
3,7% 4,0% 4,2%
0,0%
0,5%
1,0%
1,5%
2,0%
2,5%
3,0%
3,5%
4,0%
4,5%
0
50
100
150
200
250
2007 2008 2009 2010 2011
Building Civil Operating margin
Operating income – USA Construction
MUSD
47
Skanska Capital Markets Day June 2012
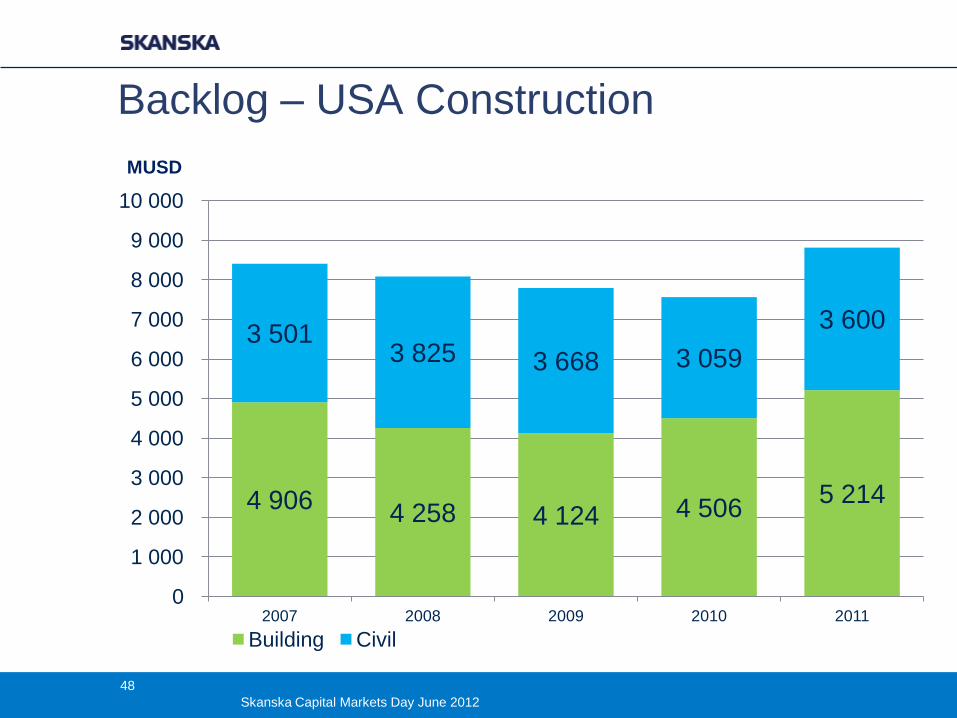
Backlog – USA Construction
4 906 4 258 4 124 4 506
5 214
3 501 3 825 3 668 3 059
3 600
0
1 000
2 000
3 000
4 000
5 000
6 000
7 000
8 000
9 000
10 000
2007 2008 2009 2010 2011
Building Civil
MUSD
48
Skanska Capital Markets Day June 2012
Market Update
49
Skanska Capital Markets Day June 2012
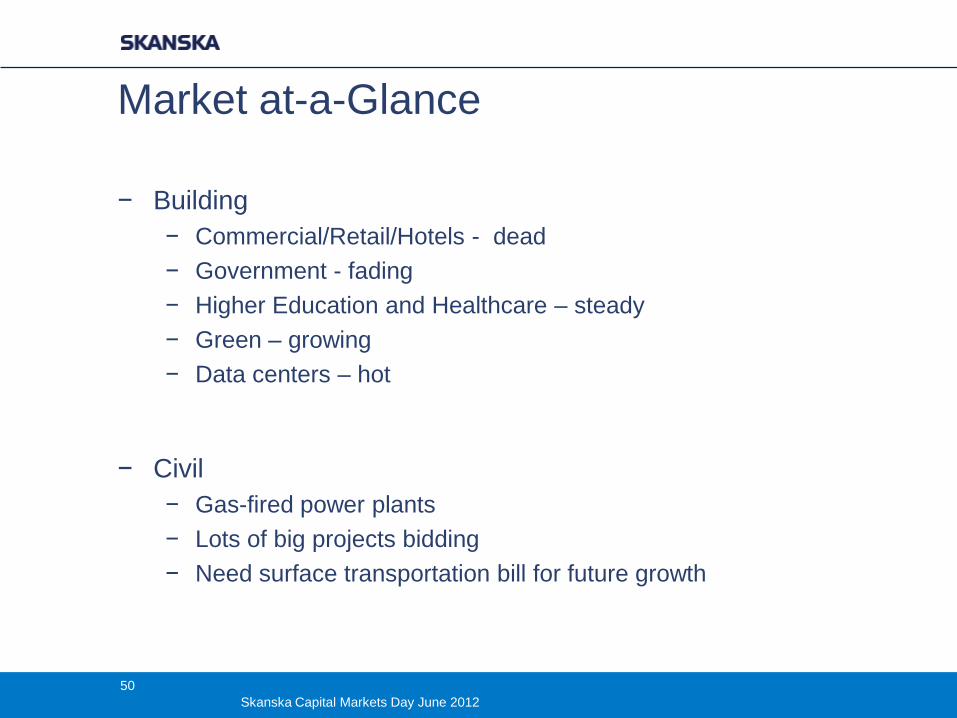
Market at-a-Glance
− Building
− Commercial/Retail/Hotels - dead
− Government - fading
− Higher Education and Healthcare – steady
− Green – growing
− Data centers – hot
− Civil
− Gas-fired power plants
− Lots of big projects bidding
− Need surface transportation bill for future growth
50
Skanska Capital Markets Day June 2012
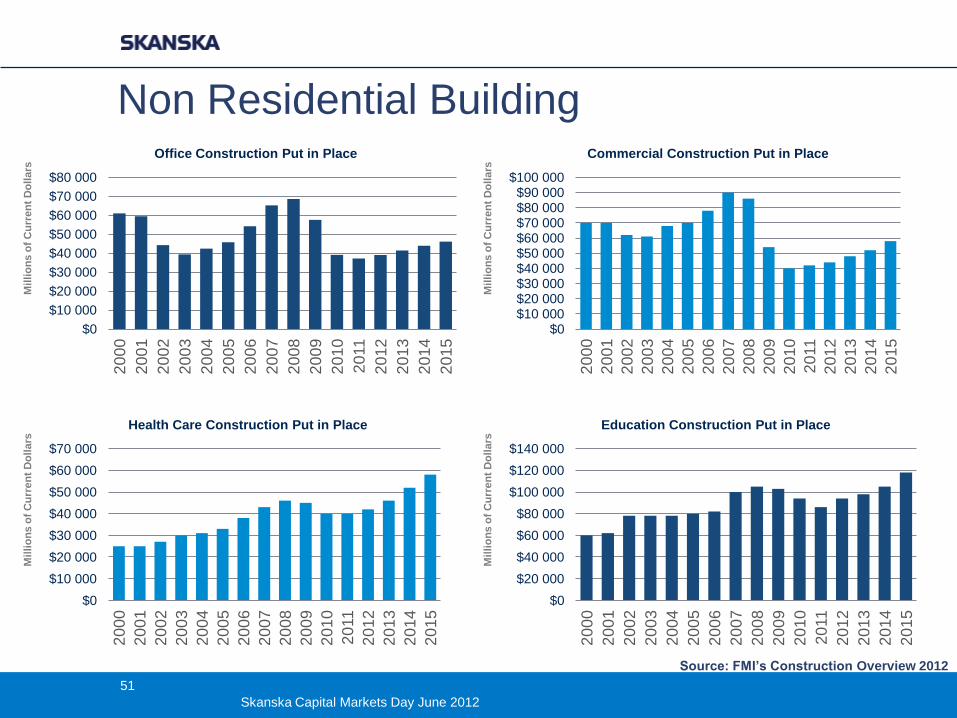
Non Residential Building
Source: FMI’s Construction Overview 2012
$0
$10 000
$20 000
$30 000
$40 000
$50 000
$60 000
$70 000
$80 000
20
00
20
01
20
02
20
03
20
04
20
05
20
06
20
07
20
08
20
09
20
10
20
11
20
12
20
13
20
14
20
15
Office Construction Put in Place
$0
$10 000
$20 000
$30 000
$40 000
$50 000
$60 000
$70 000
20
00
20
01
20
02
20
03
20
04
20
05
20
06
20
07
20
08
20
09
20
10
20
11
20
12
20
13
20
14
20
15
Health Care Construction Put in Place
$0 $10 000 $20 000 $30 000 $40 000 $50 000 $60 000 $70 000 $80 000 $90 000
$100 000
20
00
20
01
20
02
20
03
20
04
20
05
20
06
20
07
20
08
20
09
20
10
20
11
20
12
20
13
20
14
20
15
Commercial Construction Put in Place
$0
$20 000
$40 000
$60 000
$80 000
$100 000
$120 000
$140 000
20
00
20
01
20
02
20
03
20
04
20
05
20
06
20
07
20
08
20
09
20
10
20
11
20
12
20
13
20
14
20
15
Education Construction Put in Place
Mil
lio
ns o
f C
urr
en
t D
oll
ars
M
illi
on
s o
f C
urr
en
t D
oll
ars
Mil
lio
ns o
f C
urr
en
t D
oll
ars
M
illi
on
s o
f C
urr
en
t D
oll
ars
51
Skanska Capital Markets Day June 2012
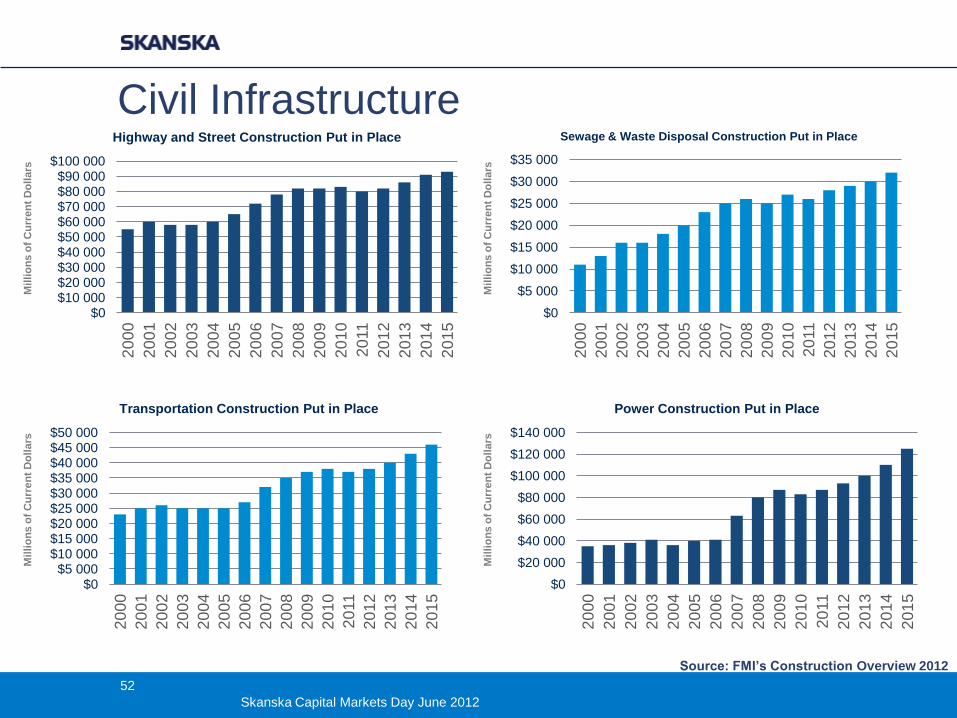
Civil Infrastructure
Source: FMI’s Construction Overview 2012
$0 $10 000 $20 000 $30 000 $40 000 $50 000 $60 000 $70 000 $80 000 $90 000
$100 000
20
00
20
01
20
02
20
03
20
04
20
05
20
06
20
07
20
08
20
09
20
10
20
11
20
12
20
13
20
14
20
15
Highway and Street Construction Put in Place
$0 $5 000
$10 000 $15 000 $20 000 $25 000 $30 000 $35 000 $40 000 $45 000 $50 000
20
00
20
01
20
02
20
03
20
04
20
05
20
06
20
07
20
08
20
09
20
10
20
11
20
12
20
13
20
14
20
15
Transportation Construction Put in Place
$0
$5 000
$10 000
$15 000
$20 000
$25 000
$30 000
$35 000
20
00
20
01
20
02
20
03
20
04
20
05
20
06
20
07
20
08
20
09
20
10
20
11
20
12
20
13
20
14
20
15
Sewage & Waste Disposal Construction Put in Place
$0
$20 000
$40 000
$60 000
$80 000
$100 000
$120 000
$140 000
20
00
20
01
20
02
20
03
20
04
20
05
20
06
20
07
20
08
20
09
20
10
20
11
20
12
20
13
20
14
20
15
Power Construction Put in Place
Mil
lio
ns o
f C
urr
en
t D
oll
ars
M
illi
on
s o
f C
urr
en
t D
oll
ars
Mil
lio
ns o
f C
urr
en
t D
oll
ars
M
illi
on
s o
f C
urr
en
t D
oll
ars
52
Skanska Capital Markets Day June 2012
Market at-a-Glance Cont’d
− Commercial Development
− Great time to develop office and apartment buildings
− Infrastructure Development
− Lack of government funds for infrastructure
− Should result in finally having US move to PPPs
− Uncertain political climate
53
Skanska Capital Markets Day June 2012
Positioned for Growth
− CD & ID both recently reached major milestones
− 1st sale
− 1st PPP
− Backlog increasing in both construction units
− Pipelines look strong
− Realizing synergies across all four U.S. businesses
− Our strengths aligned with market needs
− Our financial/bonding capacity gives us a leg up
Now is the time to take market share
54
Skanska Capital Markets Day June 2012
Skanska USA Civil
Rich Cavallaro
55
Skanska Capital Markets Day June 2012
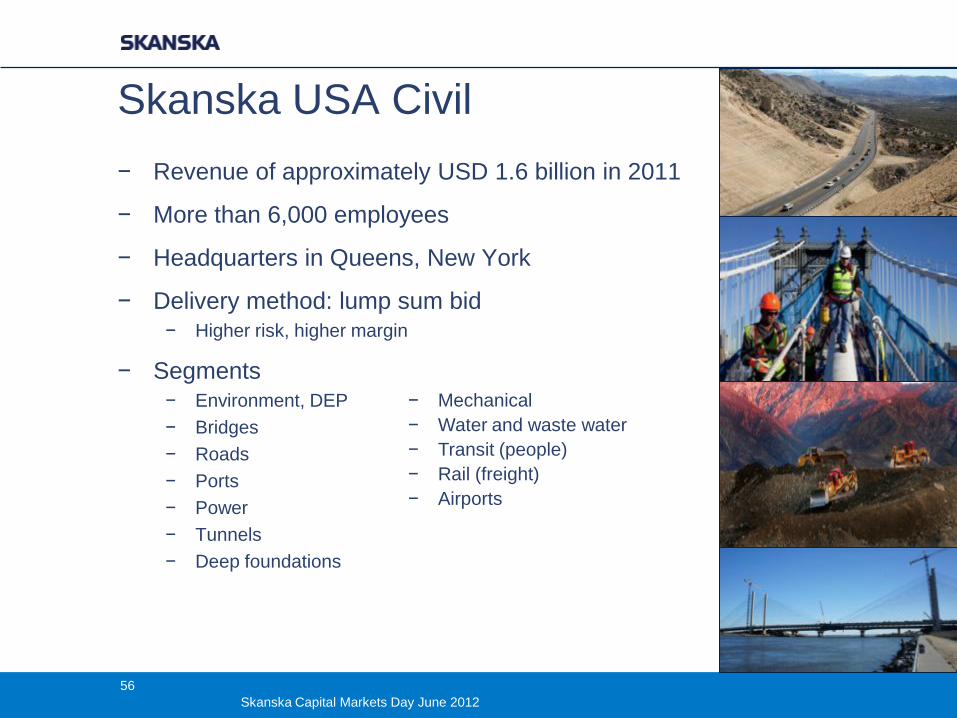
Skanska USA Civil
− Revenue of approximately USD 1.6 billion in 2011
− More than 6,000 employees
− Headquarters in Queens, New York
− Delivery method: lump sum bid − Higher risk, higher margin
− Segments − Environment, DEP
− Bridges
− Roads
− Ports
− Power
− Tunnels
− Deep foundations
− Mechanical
− Water and waste water
− Transit (people)
− Rail (freight)
− Airports
56
Skanska Capital Markets Day June 2012
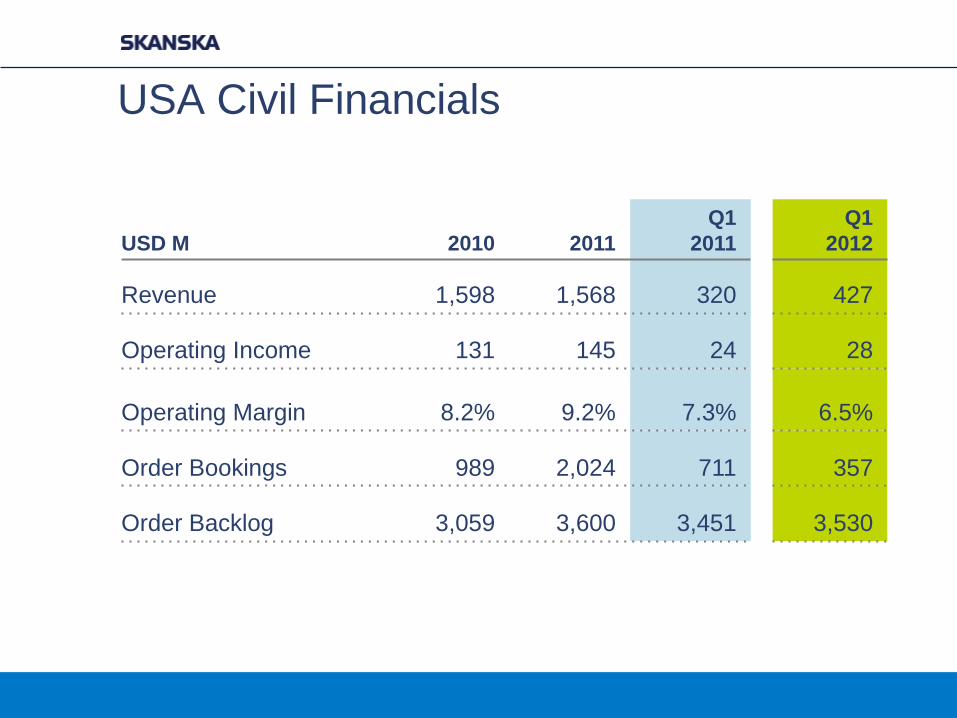
USA Civil Financials
USD M 2010 2011
Q1
2011
Q1
2012
Revenue 1,598 1,568 320 427
Operating Income 131 145 24 28
Operating Margin 8.2% 9.2% 7.3% 6.5%
Order Bookings 989 2,024 711 357
Order Backlog 3,059 3,600 3,451 3,530
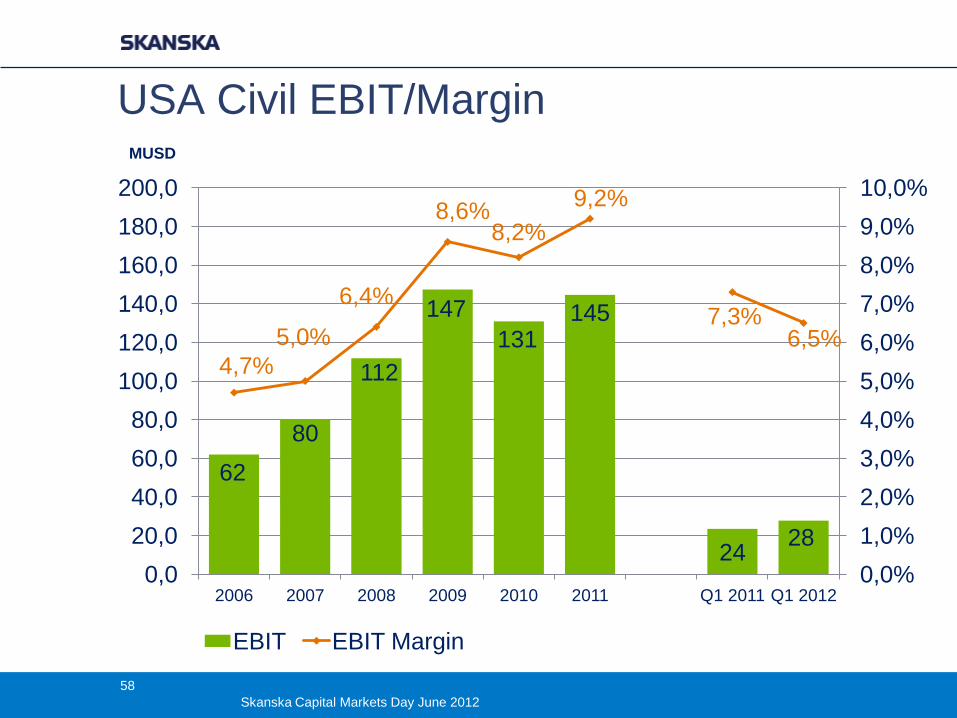
USA Civil EBIT/Margin
62
80
112
147
131 145
24 28
4,7%
5,0%
6,4%
8,6% 8,2%
9,2%
7,3% 6,5%
0,0%
1,0%
2,0%
3,0%
4,0%
5,0%
6,0%
7,0%
8,0%
9,0%
10,0%
0,0
20,0
40,0
60,0
80,0
100,0
120,0
140,0
160,0
180,0
200,0
2006 2007 2008 2009 2010 2011 Q1 2011 Q1 2012
EBIT EBIT Margin
MUSD
58
Skanska Capital Markets Day June 2012
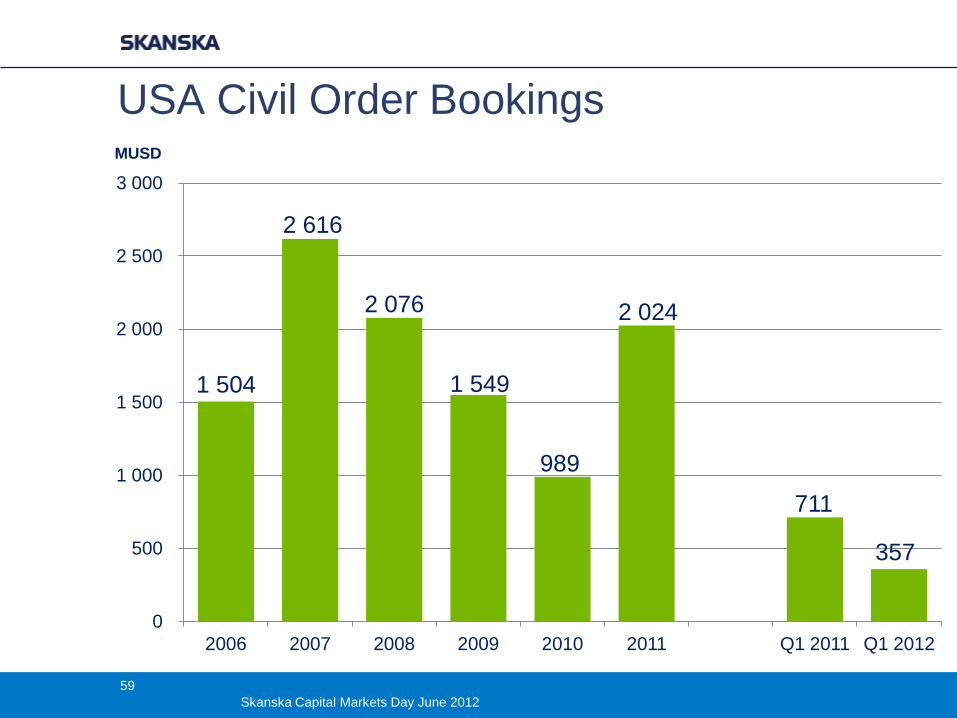
USA Civil Order Bookings
1 504
2 616
2 076
1 549
989
2 024
711
357
0
500
1 000
1 500
2 000
2 500
3 000
2006 2007 2008 2009 2010 2011 Q1 2011 Q1 2012
MUSD
59
Skanska Capital Markets Day June 2012
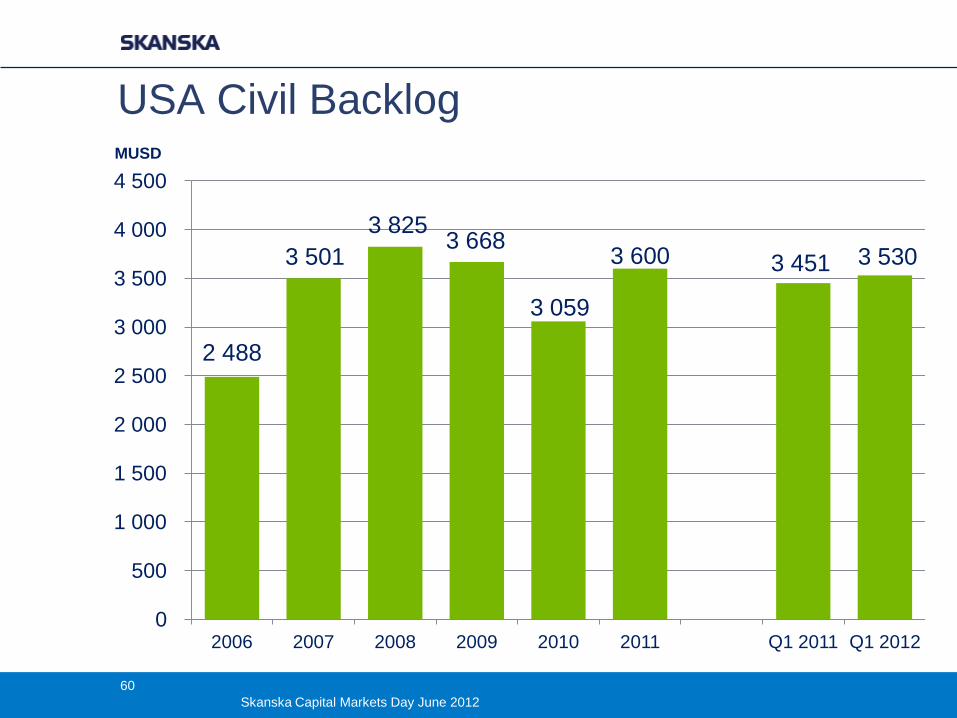
USA Civil Backlog
2 488
3 501
3 825 3 668
3 059
3 600 3 451 3 530
0
500
1 000
1 500
2 000
2 500
3 000
3 500
4 000
4 500
2006 2007 2008 2009 2010 2011 Q1 2011 Q1 2012
MUSD
60
Skanska Capital Markets Day June 2012
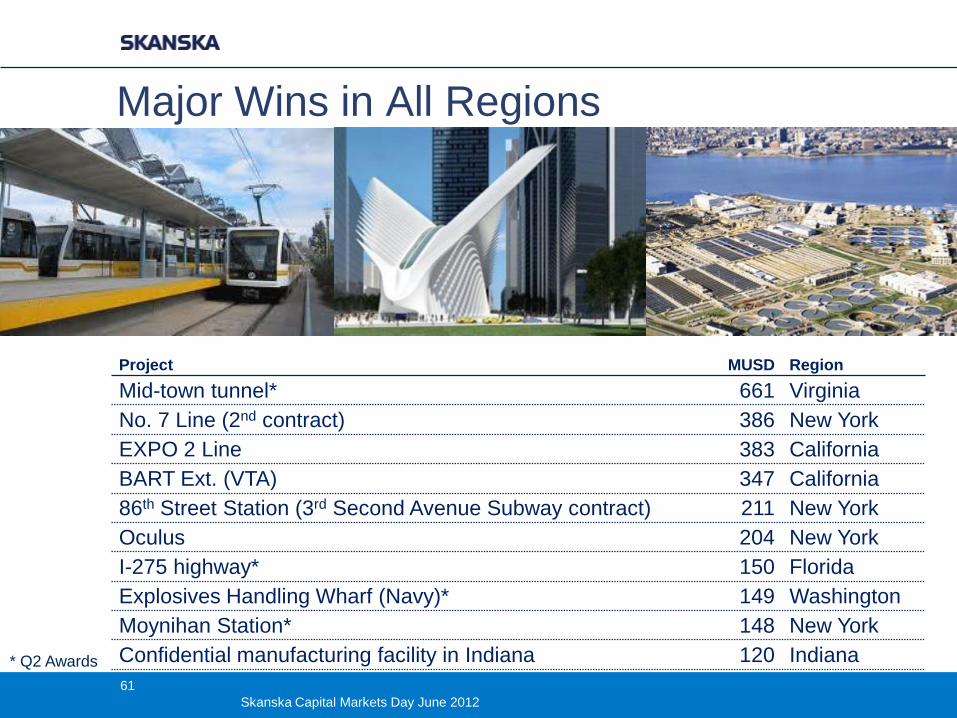
Major Wins in All Regions
Project MUSD Region
Mid-town tunnel* 661 Virginia
No. 7 Line (2nd contract) 386 New York
EXPO 2 Line 383 California
BART Ext. (VTA) 347 California
86th Street Station (3rd Second Avenue Subway contract) 211 New York
Oculus 204 New York
I-275 highway* 150 Florida
Explosives Handling Wharf (Navy)* 149 Washington
Moynihan Station* 148 New York
Confidential manufacturing facility in Indiana 120 Indiana * Q2 Awards
61
Skanska Capital Markets Day June 2012
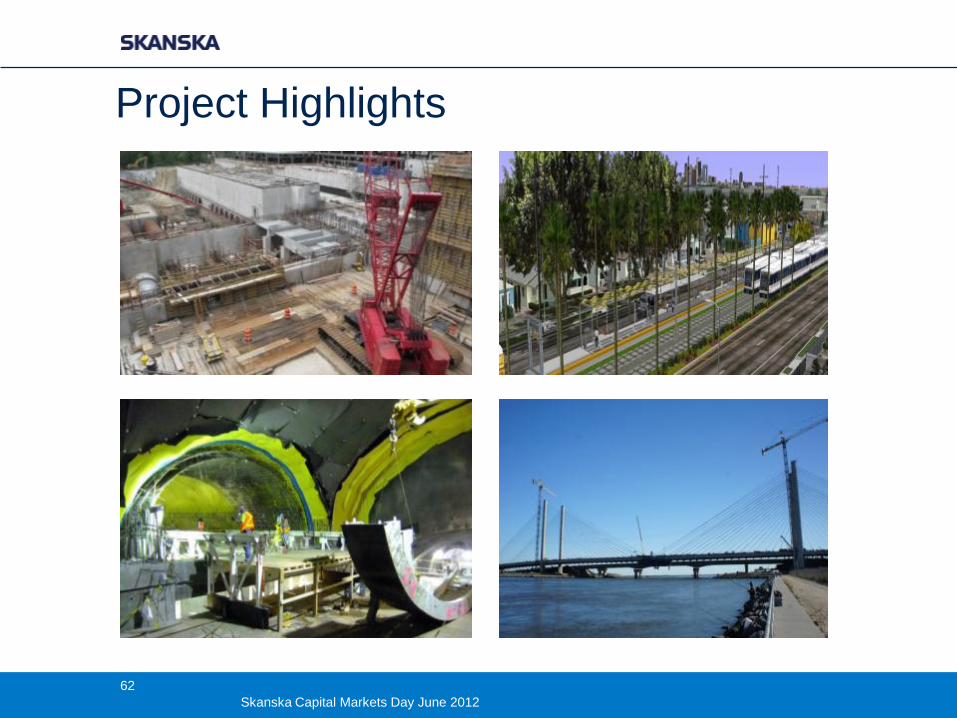
Project Highlights
62
Skanska Capital Markets Day June 2012
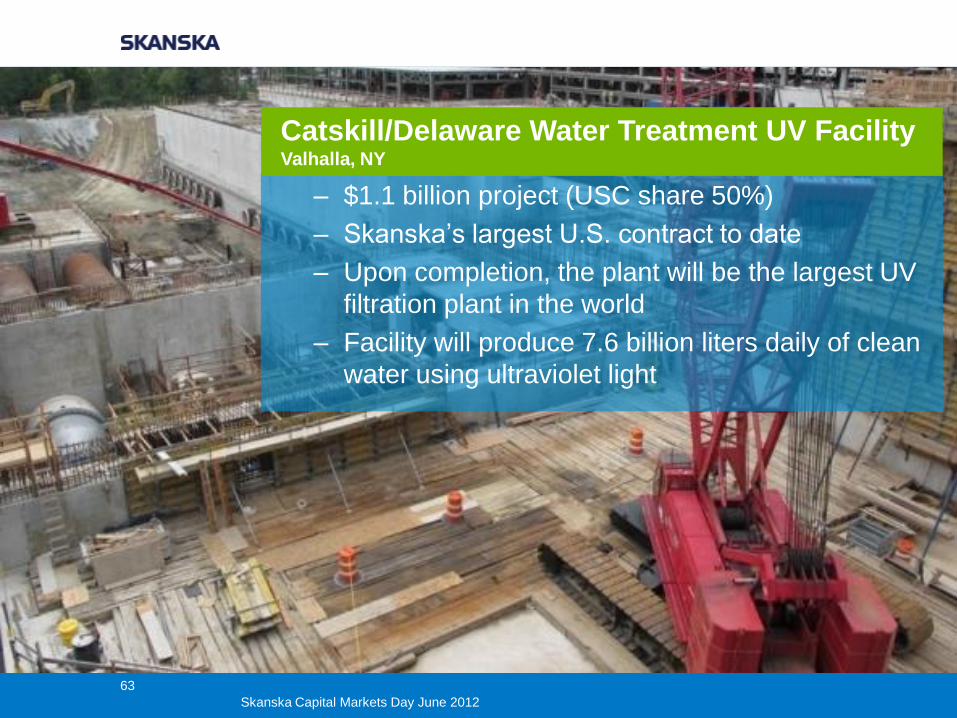
– $1.1 billion project (USC share 50%)
– Skanska’s largest U.S. contract to date
– Upon completion, the plant will be the largest UV
filtration plant in the world
– Facility will produce 7.6 billion liters daily of clean
water using ultraviolet light
Catskill/Delaware Water Treatment UV Facility Valhalla, NY
63
Skanska Capital Markets Day June 2012
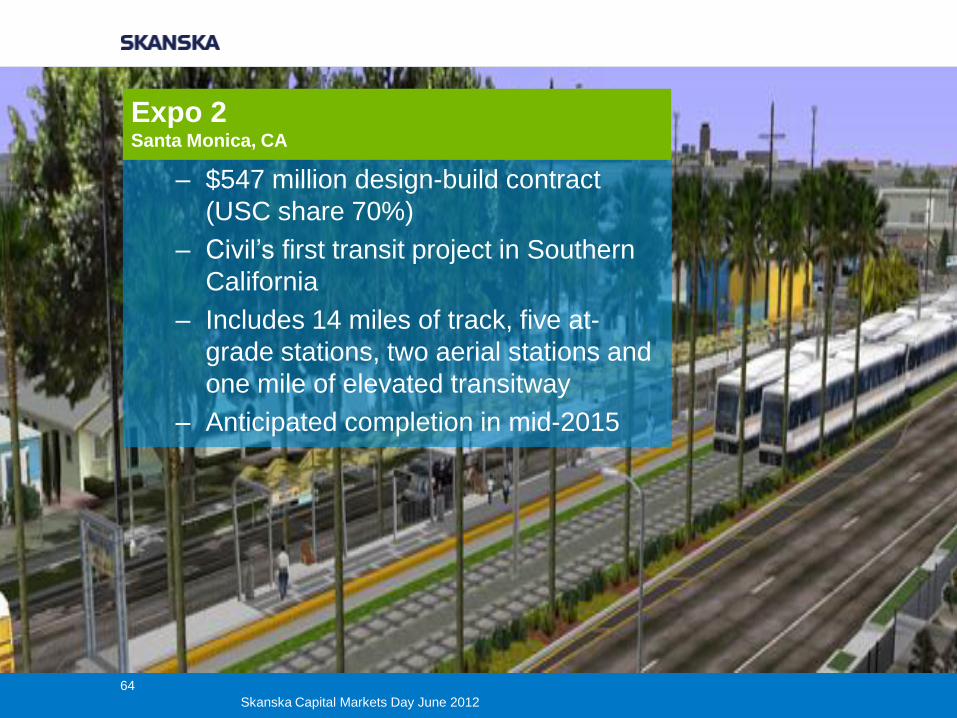
– $547 million design-build contract
(USC share 70%)
– Civil’s first transit project in Southern
California
– Includes 14 miles of track, five at-
grade stations, two aerial stations and
one mile of elevated transitway
– Anticipated completion in mid-2015
Expo 2 Santa Monica, CA
64
Skanska Capital Markets Day June 2012
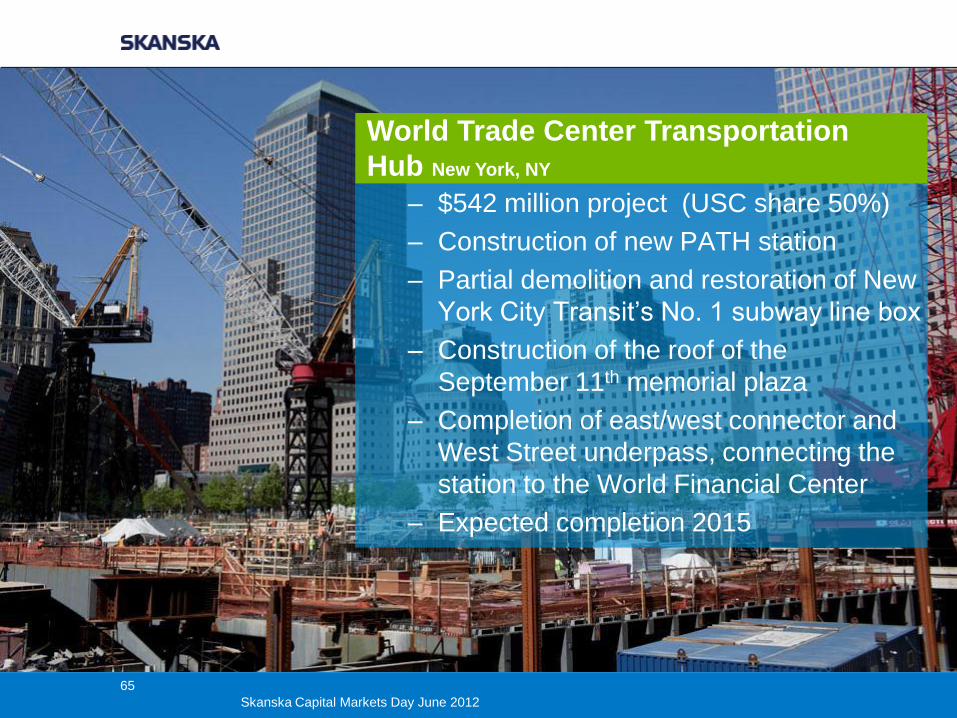
– $542 million project (USC share 50%)
– Construction of new PATH station
– Partial demolition and restoration of New
York City Transit’s No. 1 subway line box
– Construction of the roof of the
September 11th memorial plaza
– Completion of east/west connector and
West Street underpass, connecting the
station to the World Financial Center
– Expected completion 2015
World Trade Center Transportation
Hub New York, NY
65
Skanska Capital Markets Day June 2012
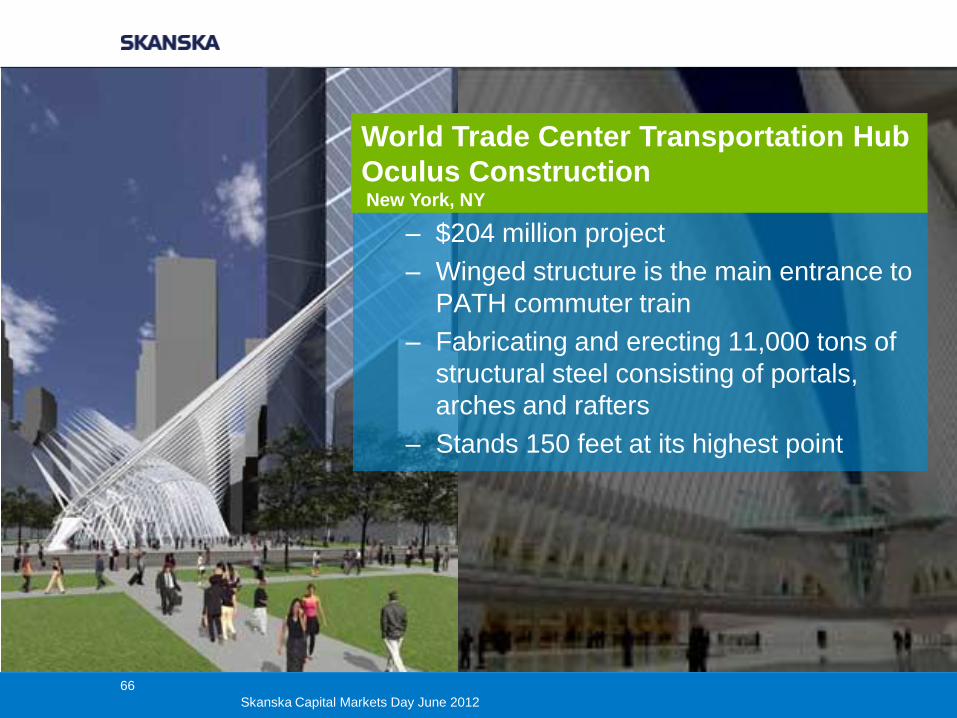
– $204 million project
– Winged structure is the main entrance to
PATH commuter train
– Fabricating and erecting 11,000 tons of
structural steel consisting of portals,
arches and rafters
– Stands 150 feet at its highest point
World Trade Center Transportation Hub
Oculus Construction New York, NY
66
Skanska Capital Markets Day June 2012
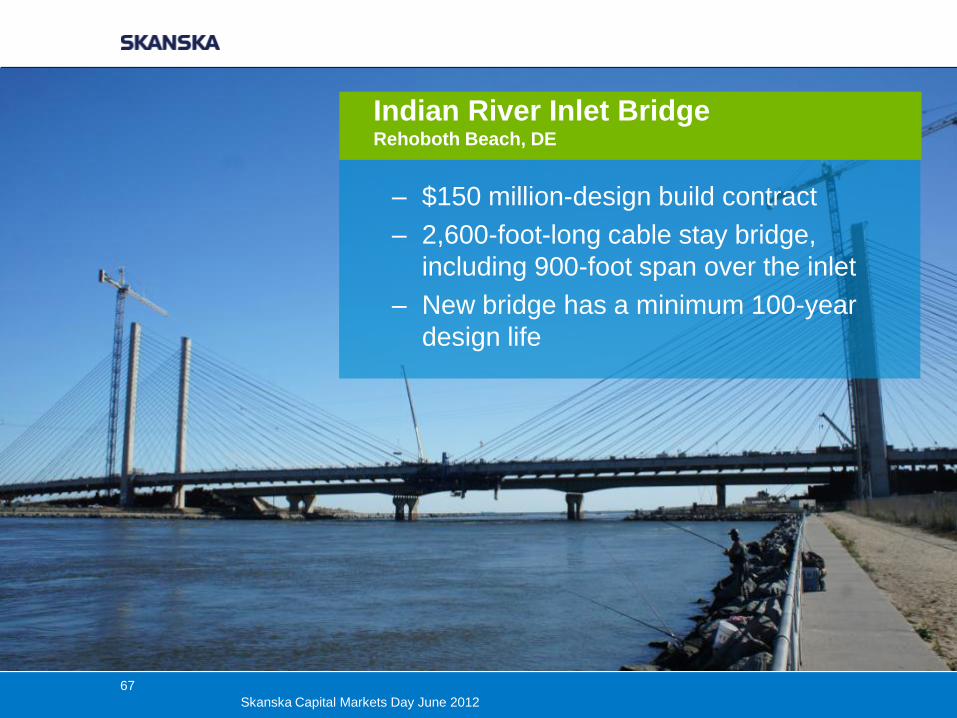
– $150 million-design build contract
– 2,600-foot-long cable stay bridge,
including 900-foot span over the inlet
– New bridge has a minimum 100-year
design life
Indian River Inlet Bridge Rehoboth Beach, DE
67
Skanska Capital Markets Day June 2012
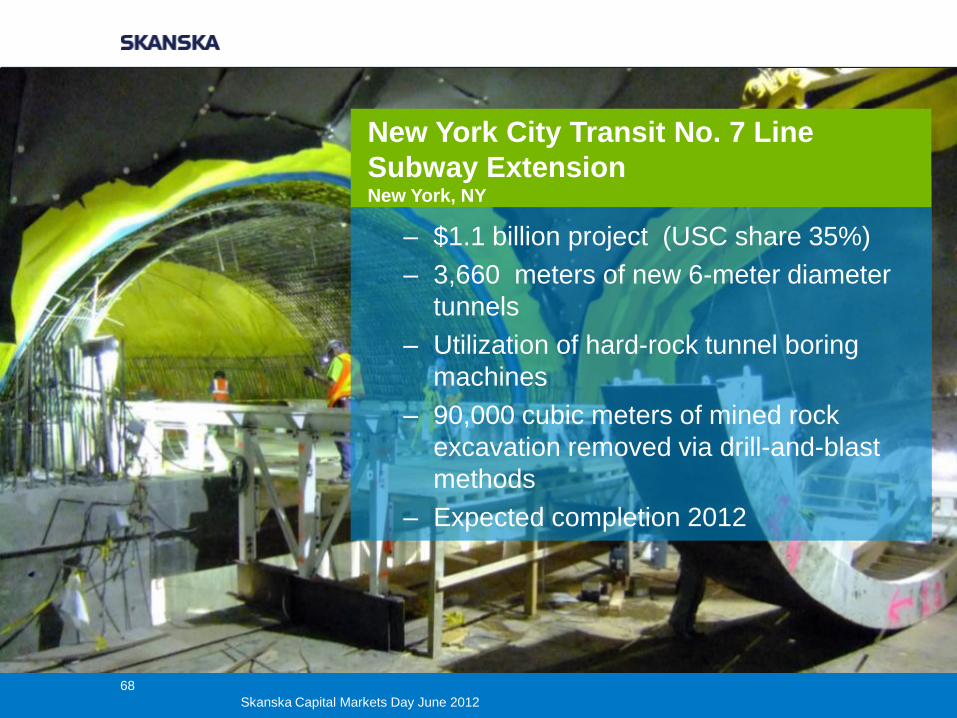
– $1.1 billion project (USC share 35%)
– 3,660 meters of new 6-meter diameter
tunnels
– Utilization of hard-rock tunnel boring
machines
– 90,000 cubic meters of mined rock
excavation removed via drill-and-blast
methods
– Expected completion 2012
New York City Transit No. 7 Line
Subway Extension New York, NY
68
Skanska Capital Markets Day June 2012
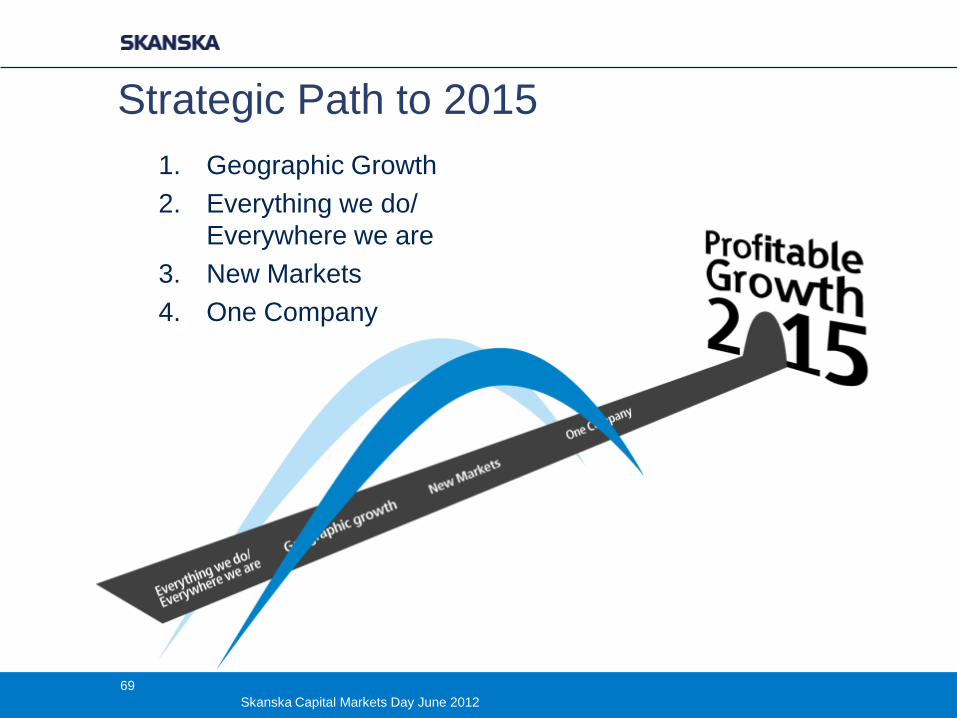
Strategic Path to 2015
1. Geographic Growth
2. Everything we do/
Everywhere we are
3. New Markets
4. One Company
69
Skanska Capital Markets Day June 2012
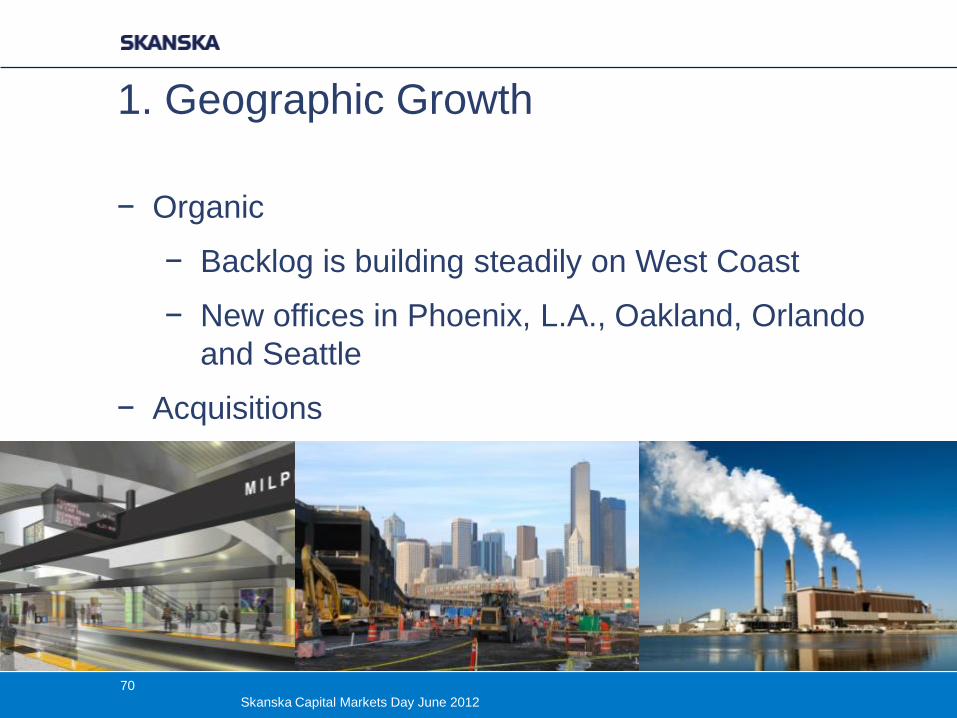
1. Geographic Growth
− Organic
− Backlog is building steadily on West Coast
− New offices in Phoenix, L.A., Oakland, Orlando
and Seattle
− Acquisitions
70
Skanska Capital Markets Day June 2012
December 2011
− Even stronger foothold in the Midwest
− Expanded portfolio of services
− Common geography in CM business
− Major power and industrial competitor on a
national scale
71
Skanska Capital Markets Day June 2012
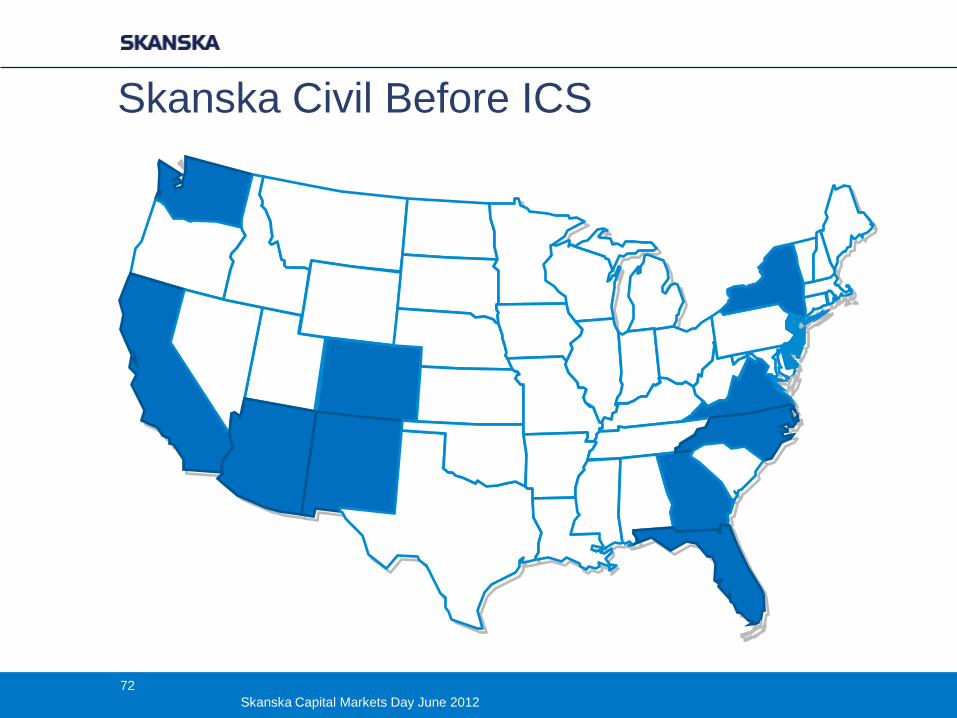
Skanska Civil Before ICS
72
Skanska Capital Markets Day June 2012
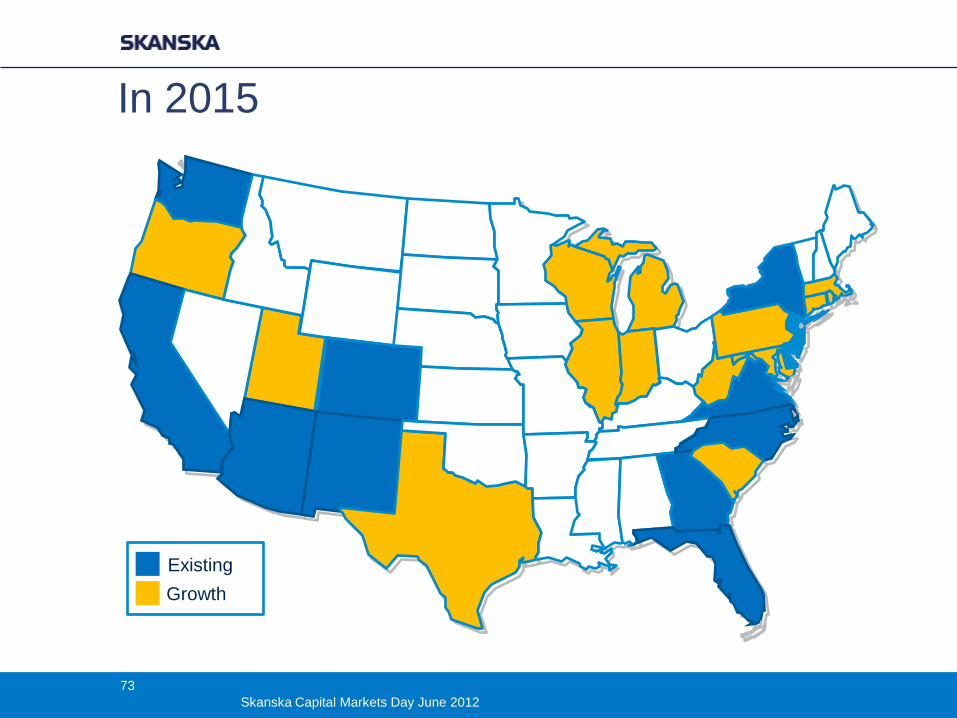
In 2015
Existing
Growth
73
Skanska Capital Markets Day June 2012
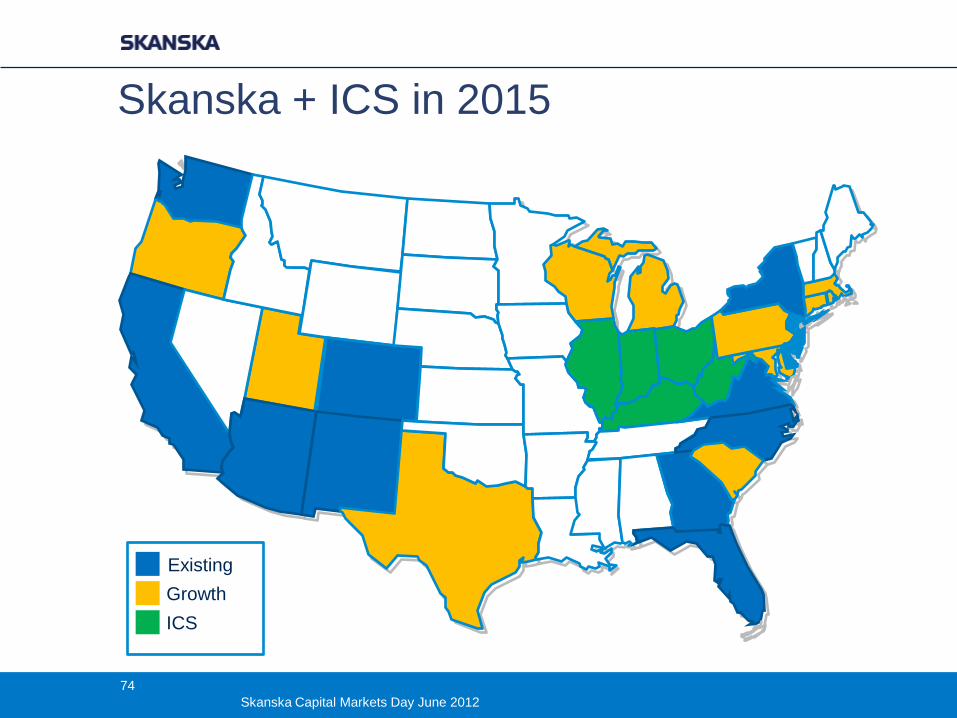
Skanska + ICS in 2015
Existing
Growth
ICS
74
Skanska Capital Markets Day June 2012
Still looking….
− Geographic targets: companies that fill out our map,
e.g. Texas, CA, Northeast
− Horizontal and vertical targets: leaders in their
market sector who bring new capabilities, e.g. more
power & industrial
75
Skanska Capital Markets Day June 2012
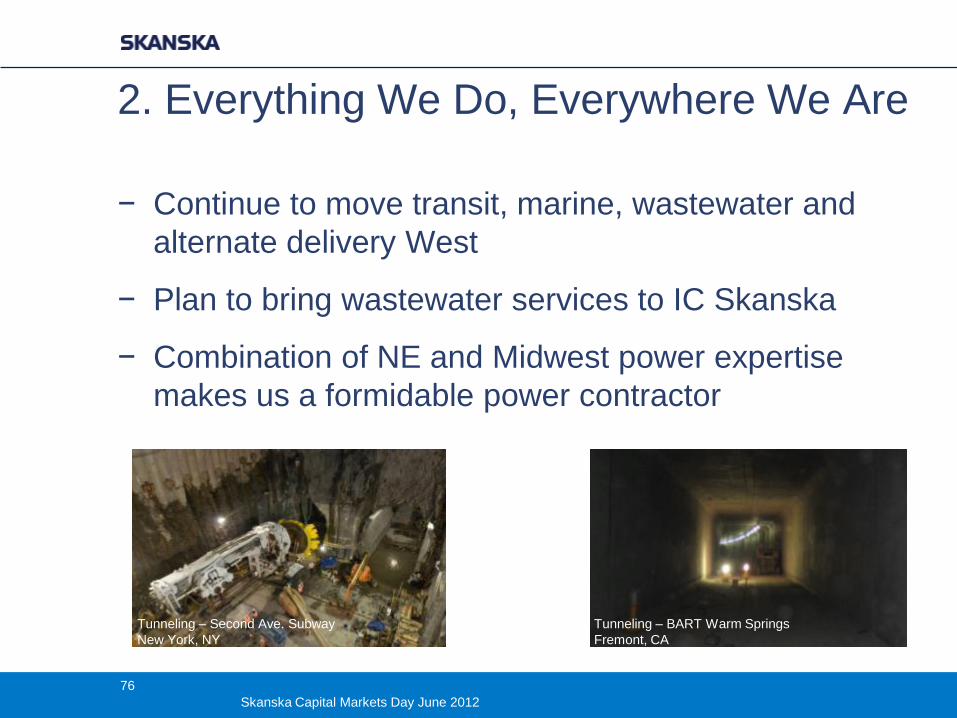
2. Everything We Do, Everywhere We Are
− Continue to move transit, marine, wastewater and
alternate delivery West
− Plan to bring wastewater services to IC Skanska
− Combination of NE and Midwest power expertise
makes us a formidable power contractor
Tunneling – Second Ave. Subway
New York, NY
Tunneling – BART Warm Springs
Fremont, CA
76
Skanska Capital Markets Day June 2012
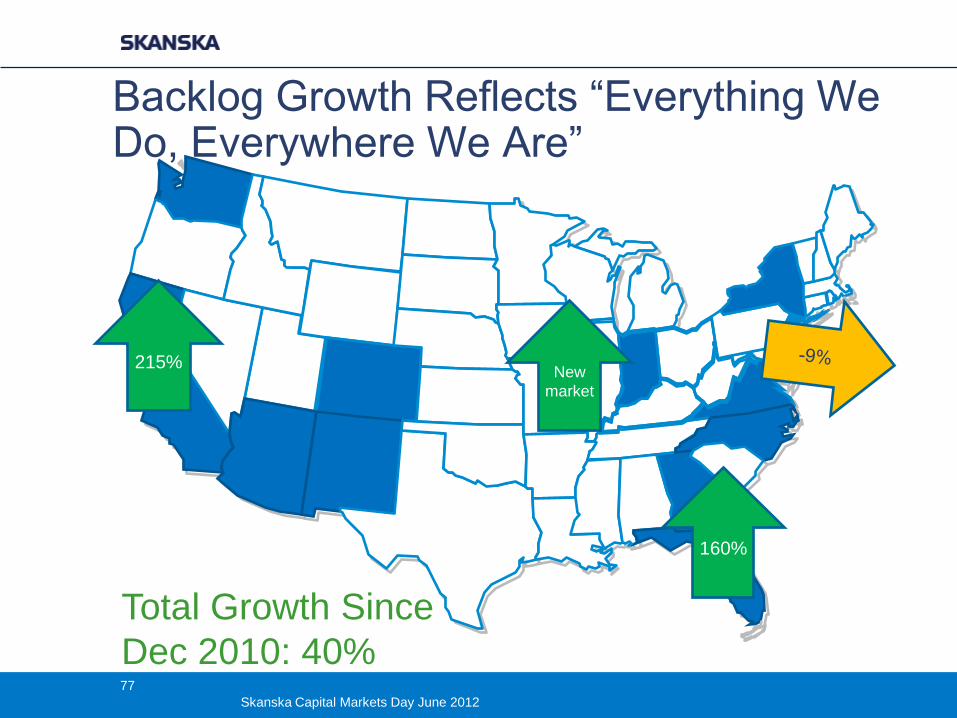
Backlog Growth Reflects “Everything We Do, Everywhere We Are”
160%
215% New
market
Total Growth Since
Dec 2010: 40% 77
Skanska Capital Markets Day June 2012
3. New Markets
– Skanska Financial Services allows us to compete
for DBF projects
– PPP opportunities growing; NY Infrastructure
Investment Act passed in Jan.
– Midtown Tunnel just closed
– 1 of 3 prequalified to compete for Goethals
– Shortlisted for Ohio River Bridges
78
Skanska Capital Markets Day June 2012
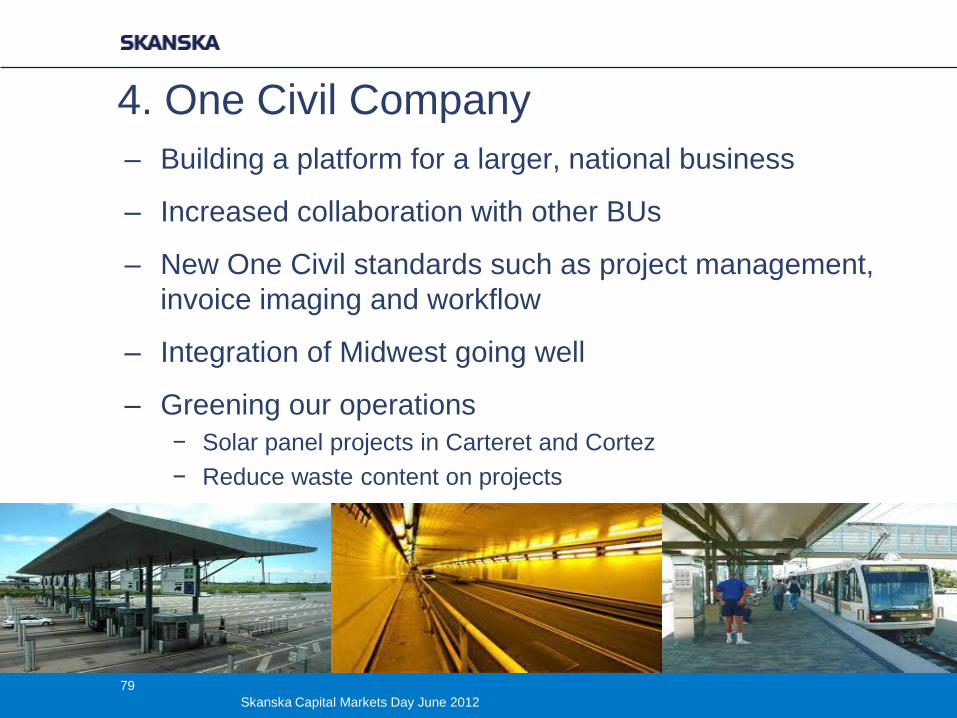
4. One Civil Company – Building a platform for a larger, national business
– Increased collaboration with other BUs
– New One Civil standards such as project management,
invoice imaging and workflow
– Integration of Midwest going well
– Greening our operations
− Solar panel projects in Carteret and Cortez
− Reduce waste content on projects
79
Skanska Capital Markets Day June 2012
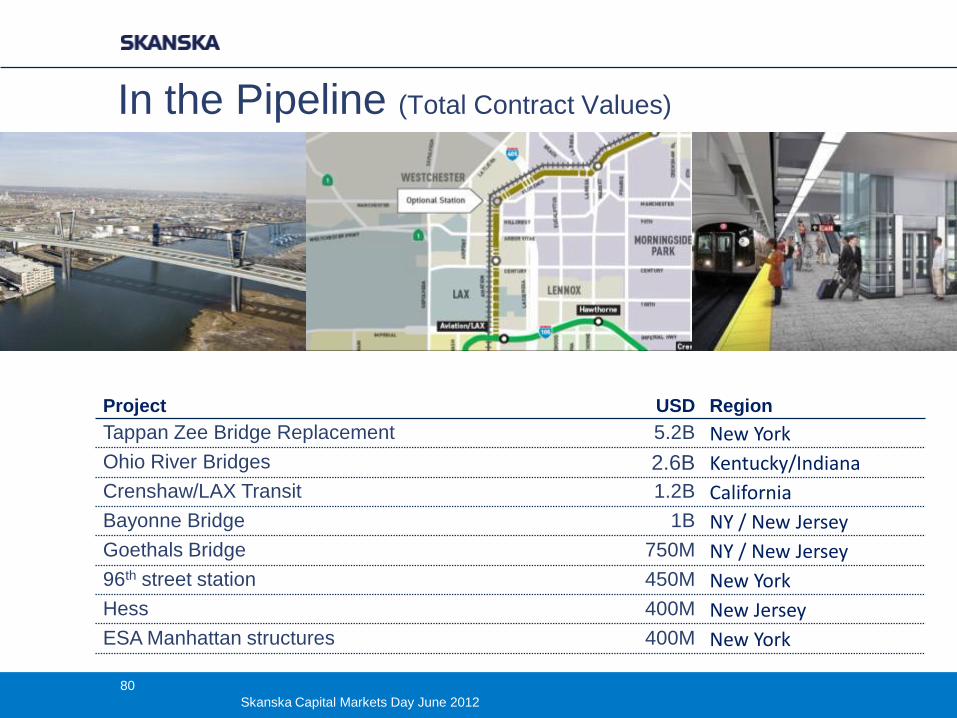
In the Pipeline (Total Contract Values)
Project
USD Region
Tappan Zee Bridge Replacement 5.2B New York
Ohio River Bridges 2.6B Kentucky/Indiana
Crenshaw/LAX Transit 1.2B California
Bayonne Bridge 1B NY / New Jersey
Goethals Bridge 750M NY / New Jersey
96th street station 450M New York
Hess 400M New Jersey
ESA Manhattan structures 400M New York
80
Skanska Capital Markets Day June 2012
Skanska Infrastructure Development
Karl Reichelt, EVP North America
81
Skanska Capital Markets Day June 2012
United States
Sweden
Finland
Norway
United Kingdom
Poland
Slovakia
Hungary Czech Republic
Estonia
Brazil
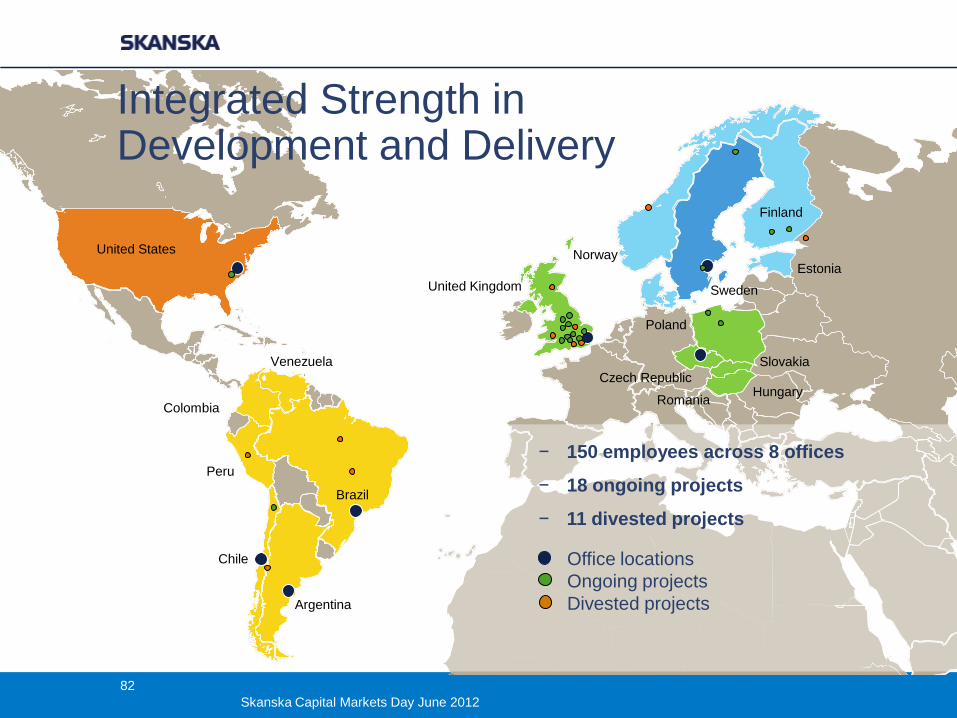
Integrated Strength in Development and Delivery
Argentina
Chile
Peru
Venezuela
Colombia Romania
− 150 employees across 8 offices
− 18 ongoing projects
− 11 divested projects
Office locations
Ongoing projects
Divested projects
82
Skanska Capital Markets Day June 2012
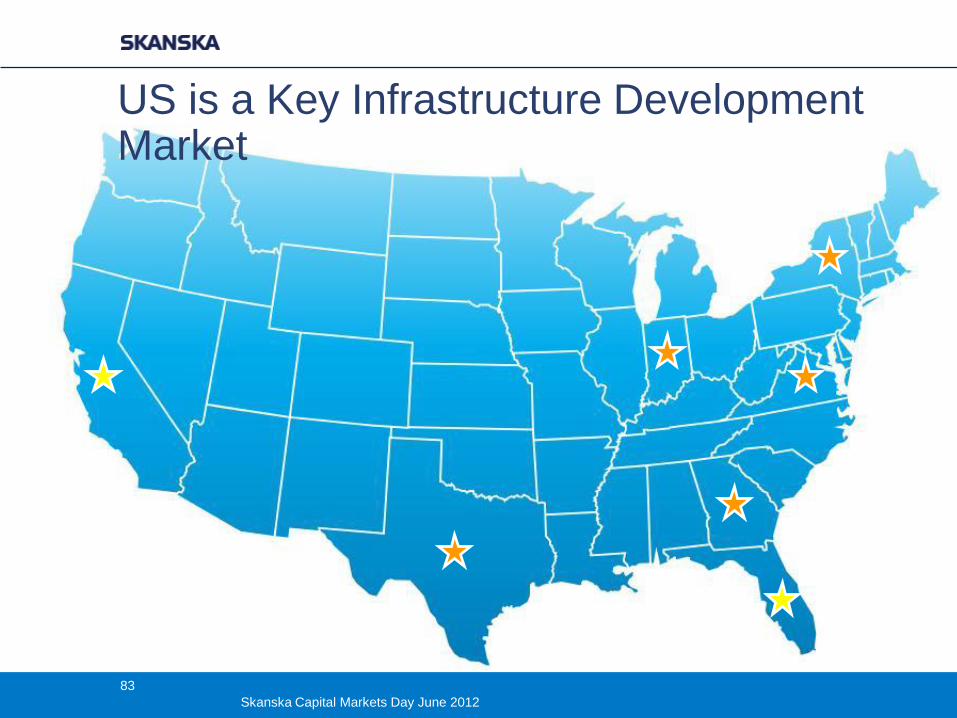
US is a Key Infrastructure Development Market
83
Skanska Capital Markets Day June 2012
From the Skanska Perspective:
Concession agreement with a public client
in which Skanska (with partners)
develops, constructs, operates, and
maintains a project - such as a toll road or
a hospital - and is responsible for
implementing debt and equity project
financing.
US Public Private Partnerships
84
Skanska Capital Markets Day June 2012
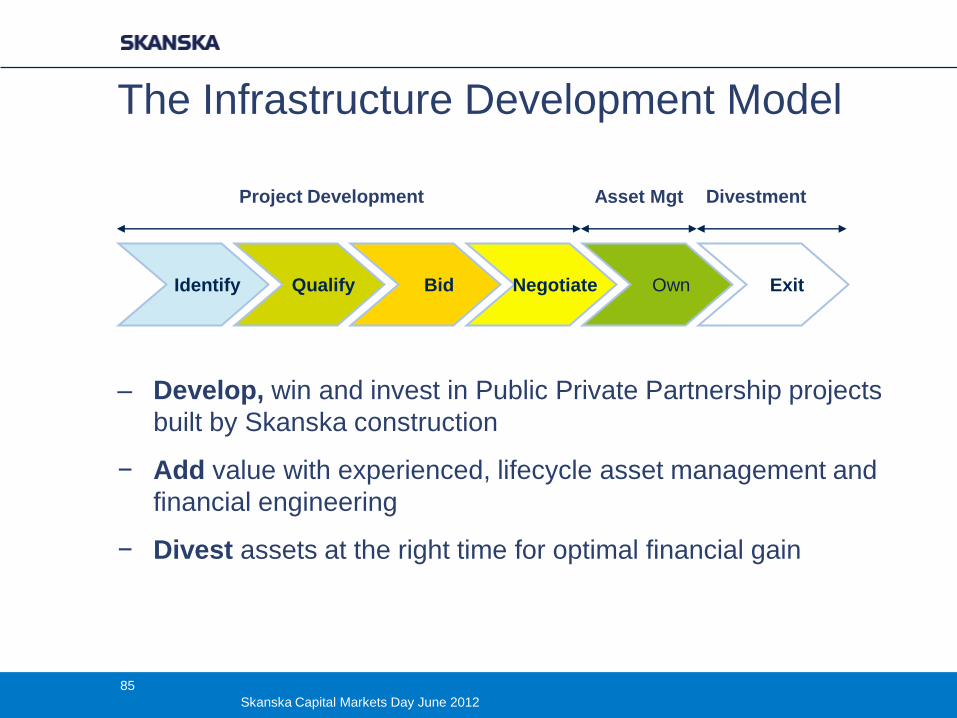
Identify Qualify Bid Negotiate Own Exit
Project Development Asset Mgt Divestment
The Infrastructure Development Model
– Develop, win and invest in Public Private Partnership projects
built by Skanska construction
− Add value with experienced, lifecycle asset management and
financial engineering
− Divest assets at the right time for optimal financial gain
85
Skanska Capital Markets Day June 2012
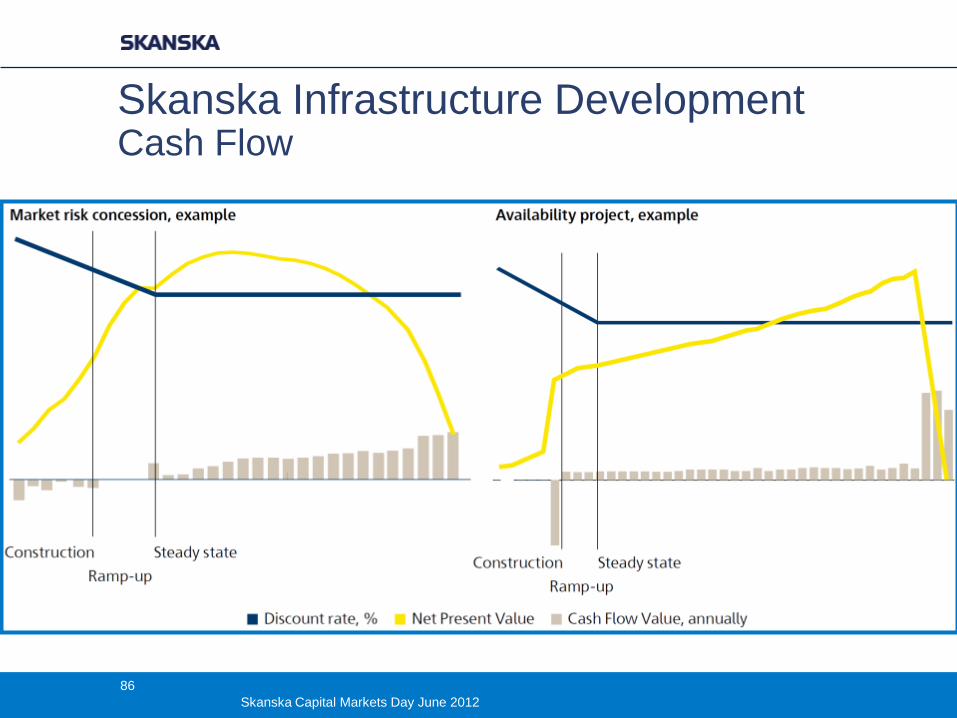
Skanska Infrastructure Development Cash Flow
86
Skanska Capital Markets Day June 2012
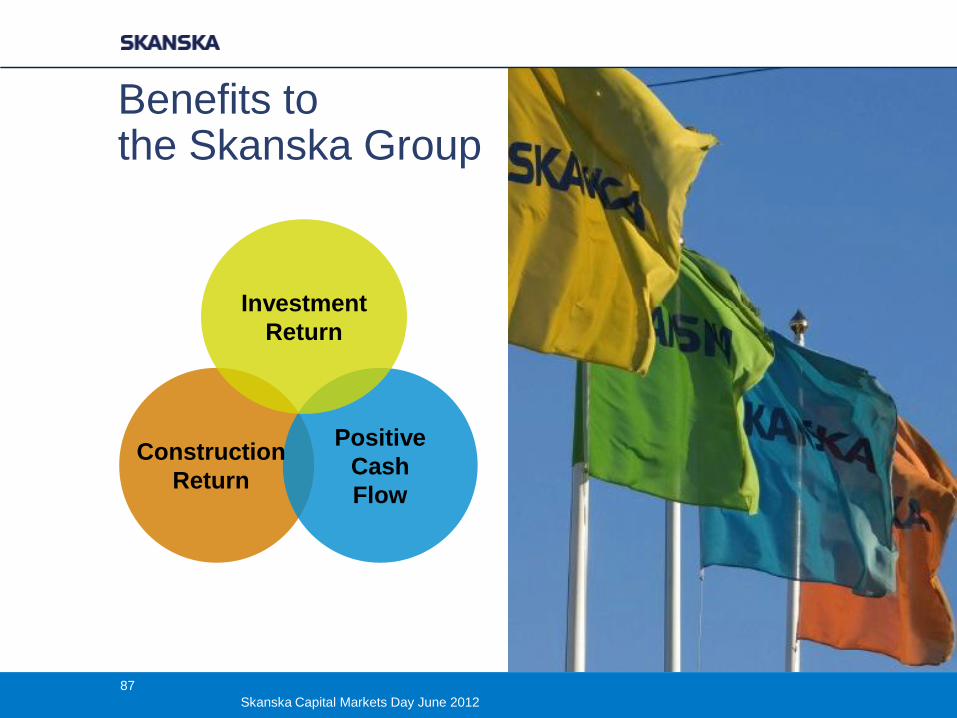
Benefits to the Skanska Group
Positive
Cash
Flow
Investment
Return
Construction
Return
87
Skanska Capital Markets Day June 2012
US Market Assessment
− PPP is widely implemented but
underutilized
− ~ 25 states allow for PPP
− Very few are using PPP with any
effect
− PPP is driven at the state level by
governors of both parties
− Market Leaders
− Virginia, Texas, California, Florida,
Colorado, Indiana
− Several states – including New
York – are emerging on PPP
88
Skanska Capital Markets Day June 2012
US Market Assessment
− Current federal government leadership
is mixed on PPP
− No federal Highway Bill
− Attacks on PPP from US Senate
paired with unsustainable hikes in
spending
− Solid support for PPP in US
House, although lower spending
increases
− Federal DOT leadership solid on
PPP via credit support, policy
− However, not using political capital
to protect/drive PPP
89
Skanska Capital Markets Day June 2012
PPP Market Drivers − National infrastructure crisis
− Crippling budget deficits
− Public debt limitations
− Need for economic growth, jobs
creation
− Growing political will
− Leveraging limited public funds with
private investment
− Lack of federal transportation bill
− Higher client interest in lifecycle,
“Green,” innovative solutions
− Growing support of user-based tolls
over new taxes
90
Skanska Capital Markets Day June 2012
PPP Outlook
5 major transportation PPPs expected
to reach financial close in 2012:
1. VA Midtown Tunnel/Downtown
Tunnel/MLK Freeway: $2.1B
2. CA Presidio Parkway: $480M
3. VA I-95 HOT Lanes: $940M
4. TX North Tarrant HOT Lanes
Phase 2: $2.7B
5. NC Mid-Currituck Bridge:
$700M
91
Skanska Capital Markets Day June 2012
PPP Outlook
New transportation PPP tenders
commencing in 2012:
1. NY LaGuardia Airport: $3.6B
2. NY Goethals Bridge: $1.6B
3. IN East End Bridge: $1.5B
4. TX SH 183: $1.1B
− National pipeline looks robust,
includes core Skanska sectors
92
Skanska Capital Markets Day June 2012
2015 ID US Strategy
− ID supports Skanska US growth
− With Civil & Building via PPP
− Diversify ID pursuits
− By new geographies, markets,
sectors,
− Balance of hard bidding &
negotiated deals
− Ride momentum of Midtown
− Close 2-3 additional PPP projects
93
Skanska Capital Markets Day June 2012
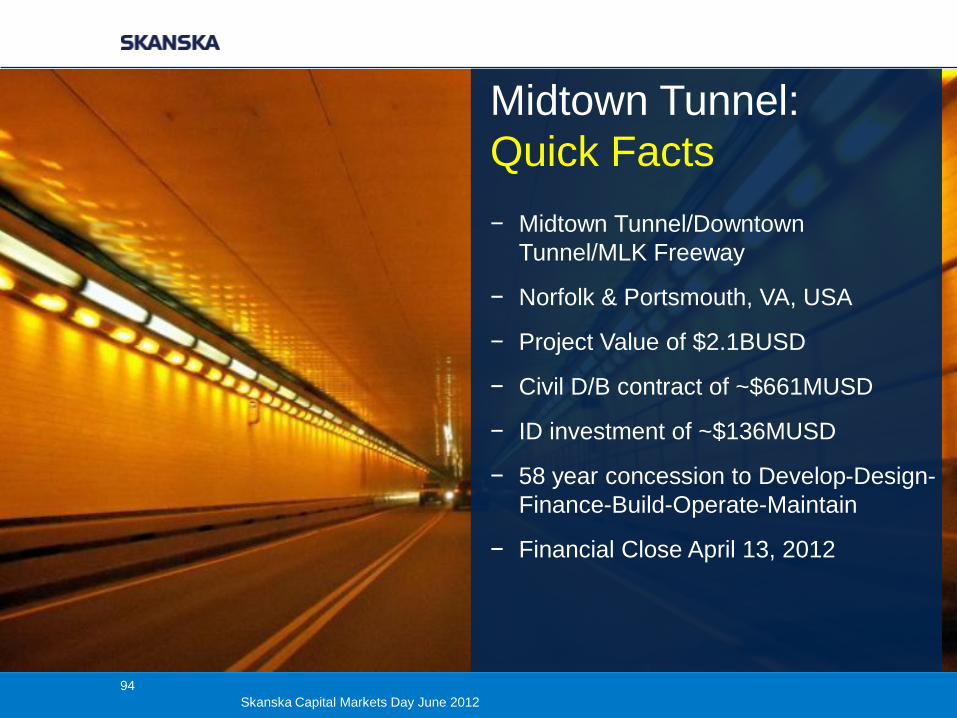
Midtown Tunnel:
Quick Facts
− Midtown Tunnel/Downtown
Tunnel/MLK Freeway
− Norfolk & Portsmouth, VA, USA
− Project Value of $2.1BUSD
− Civil D/B contract of ~$661MUSD
− ID investment of ~$136MUSD
− 58 year concession to Develop-Design-
Finance-Build-Operate-Maintain
− Financial Close April 13, 2012
94
Skanska Capital Markets Day June 2012
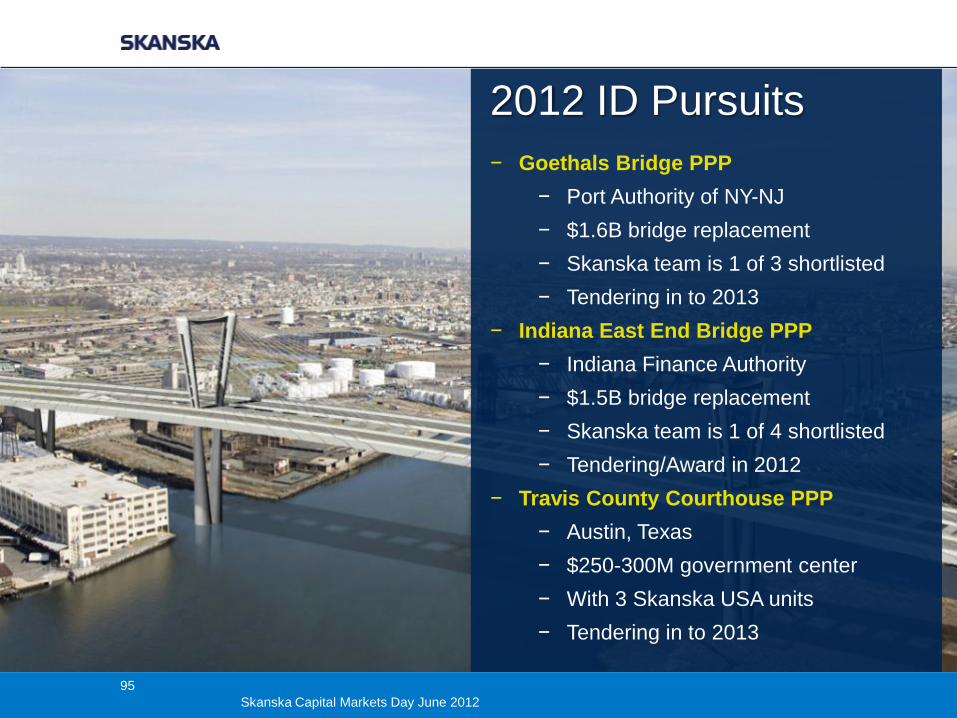
2012 ID Pursuits
− Goethals Bridge PPP
− Port Authority of NY-NJ
− $1.6B bridge replacement
− Skanska team is 1 of 3 shortlisted
− Tendering in to 2013
− Indiana East End Bridge PPP
− Indiana Finance Authority
− $1.5B bridge replacement
− Skanska team is 1 of 4 shortlisted
− Tendering/Award in 2012
− Travis County Courthouse PPP
− Austin, Texas
− $250-300M government center
− With 3 Skanska USA units
− Tendering in to 2013
95
Skanska Capital Markets Day June 2012
2012-2015
Additional Targets
− I-85 HOT Plus Lanes
− Atlanta, GA
− Hampton Roads Bridge Tunnel
− VA Beach, VA
− Virginia Beach Light Rail
− Virginia
− I-4 Ultimate
− Orlando, FL
− I-95 Expansion/Tolling
− Virginia
96
Skanska Capital Markets Day June 2012
Skanska USA Building
Bill Flemming
97
Skanska Capital Markets Day June 2012
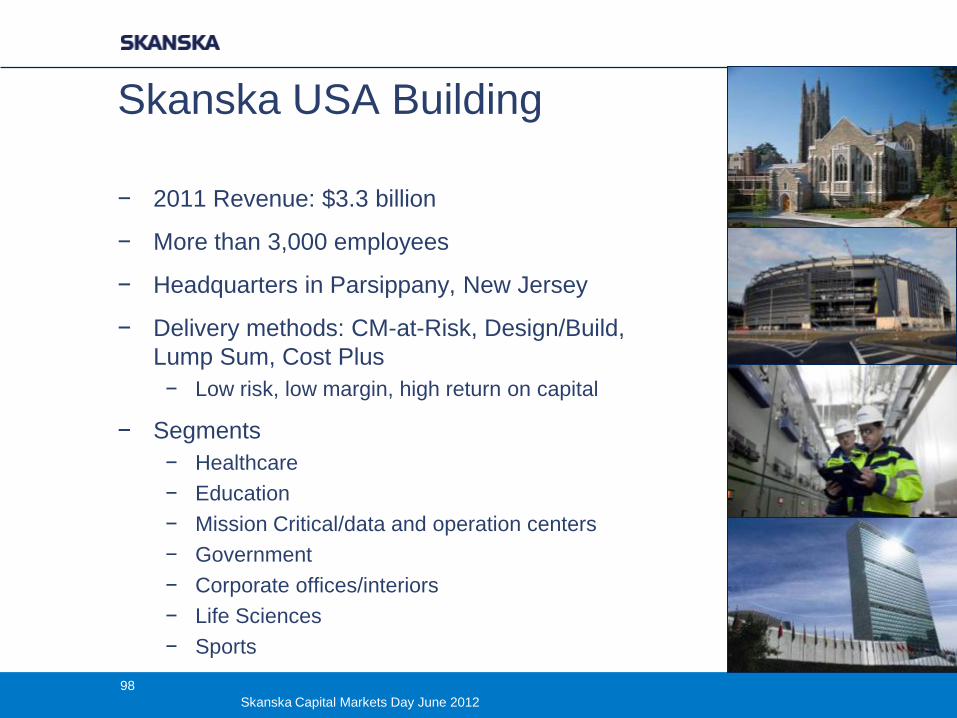
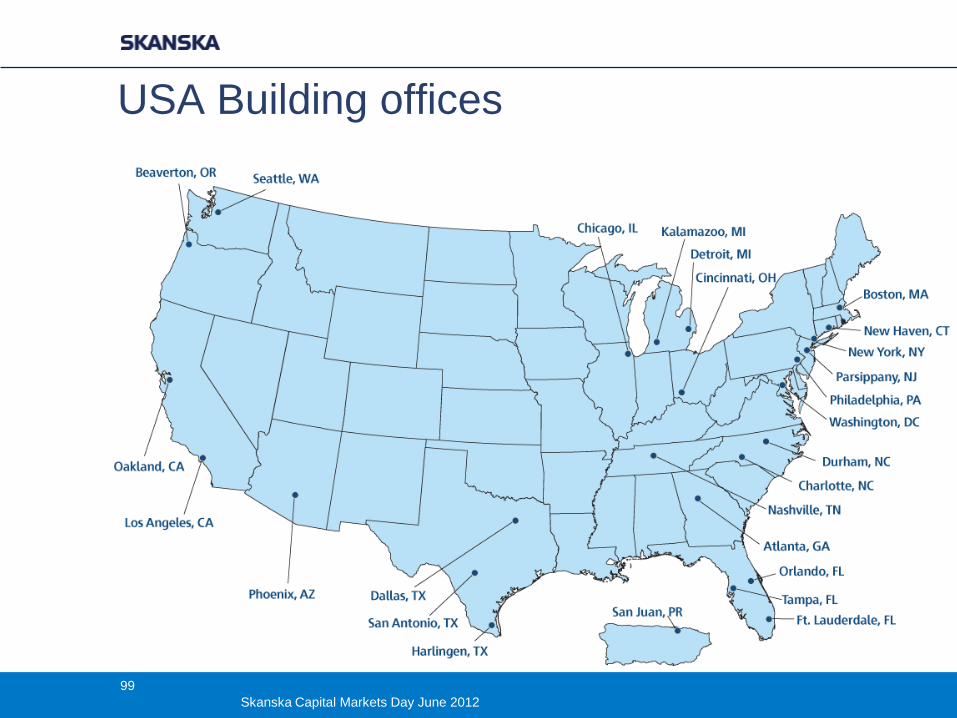
Skanska USA Building
− 2011 Revenue: $3.3 billion
− More than 3,000 employees
− Headquarters in Parsippany, New Jersey
− Delivery methods: CM-at-Risk, Design/Build,
Lump Sum, Cost Plus
− Low risk, low margin, high return on capital
− Segments
− Healthcare
− Education
− Mission Critical/data and operation centers
− Government
− Corporate offices/interiors
− Life Sciences
− Sports
98
Skanska Capital Markets Day June 2012
USA Building offices
99
Skanska Capital Markets Day June 2012
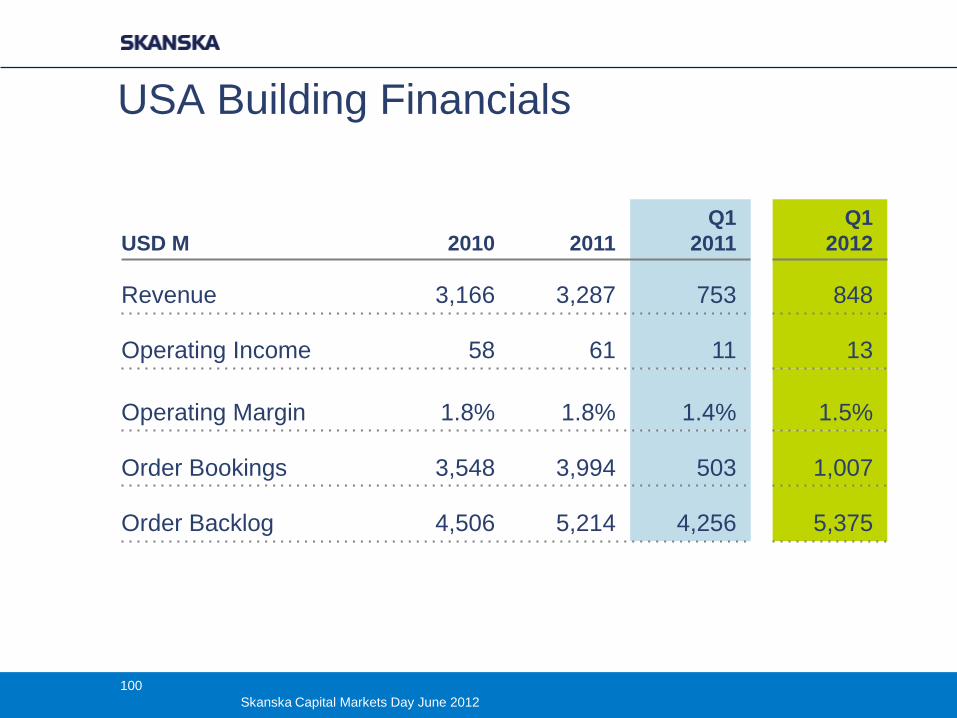
USA Building Financials
USD M 2010 2011
Q1
2011
Q1
2012
Revenue 3,166 3,287 753 848
Operating Income 58 61 11 13
Operating Margin 1.8% 1.8% 1.4% 1.5%
Order Bookings 3,548 3,994 503 1,007
Order Backlog 4,506 5,214 4,256 5,375
100
Skanska Capital Markets Day June 2012
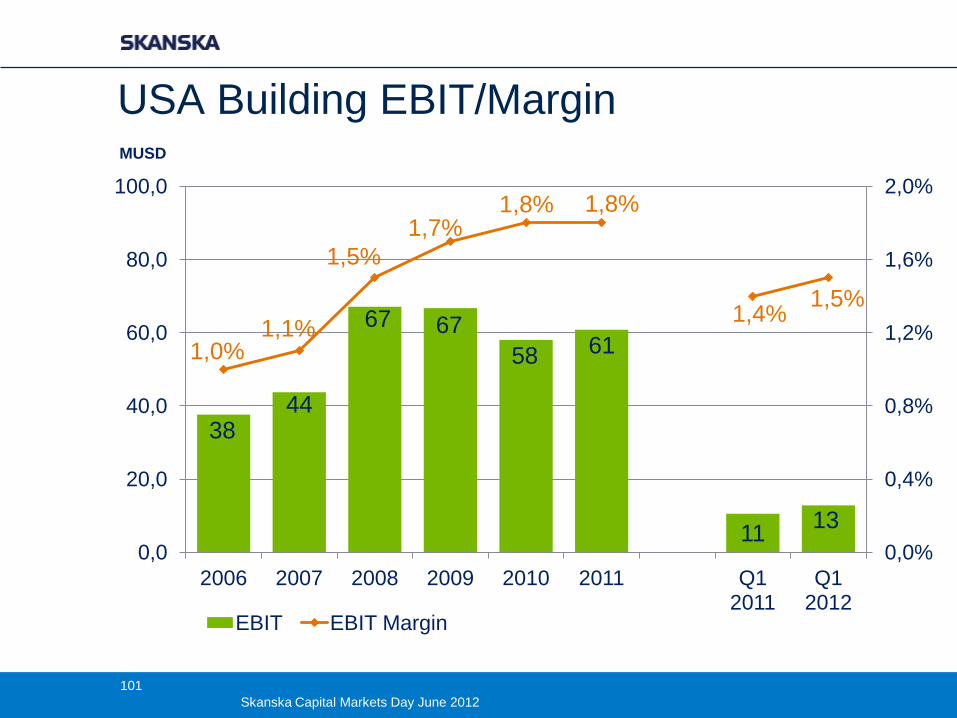
USA Building EBIT/Margin
38 44
67 67
58 61
11 13
1,0% 1,1%
1,5%
1,7% 1,8% 1,8%
1,4% 1,5%
0,0%
0,4%
0,8%
1,2%
1,6%
2,0%
0,0
20,0
40,0
60,0
80,0
100,0
2006 2007 2008 2009 2010 2011 Q1 2011
Q1 2012
EBIT EBIT Margin
MUSD
101
Skanska Capital Markets Day June 2012
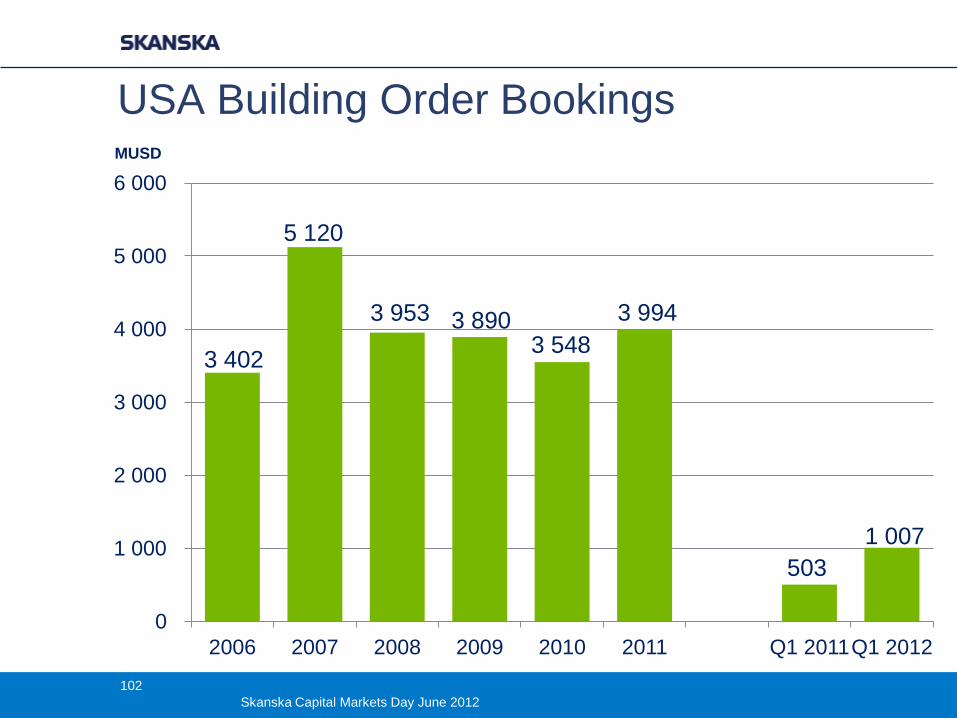
USA Building Order Bookings
3 402
5 120
3 953 3 890 3 548
3 994
503
1 007
0
1 000
2 000
3 000
4 000
5 000
6 000
2006 2007 2008 2009 2010 2011 Q1 2011 Q1 2012
MUSD
102
Skanska Capital Markets Day June 2012
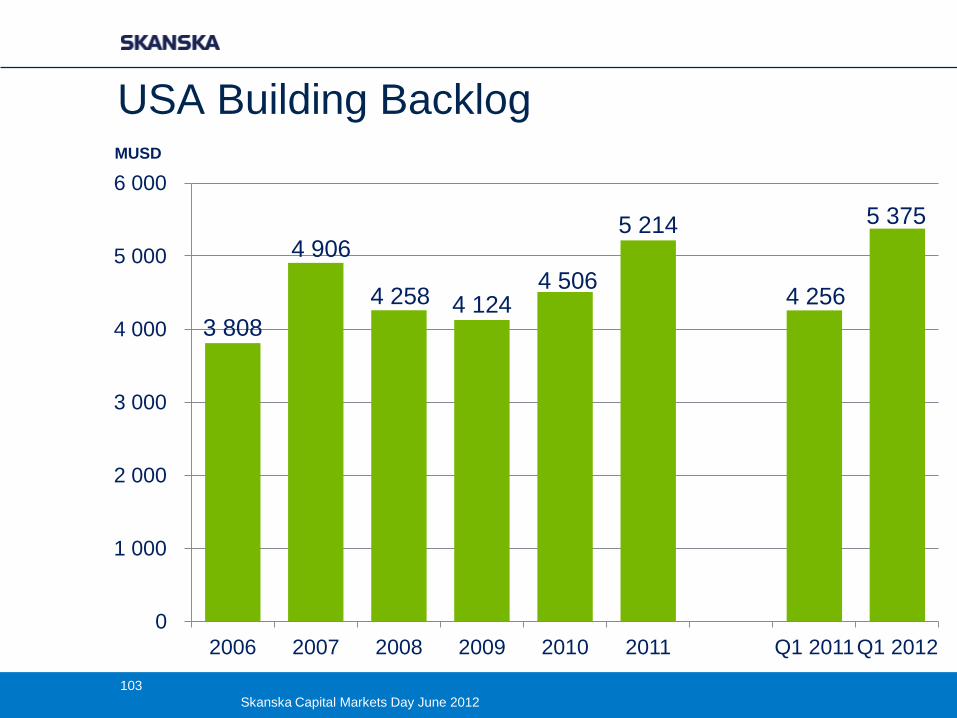
USA Building Backlog
3 808
4 906
4 258 4 124 4 506
5 214
4 256
5 375
0
1 000
2 000
3 000
4 000
5 000
6 000
2006 2007 2008 2009 2010 2011 Q1 2011 Q1 2012
MUSD
103
Skanska Capital Markets Day June 2012
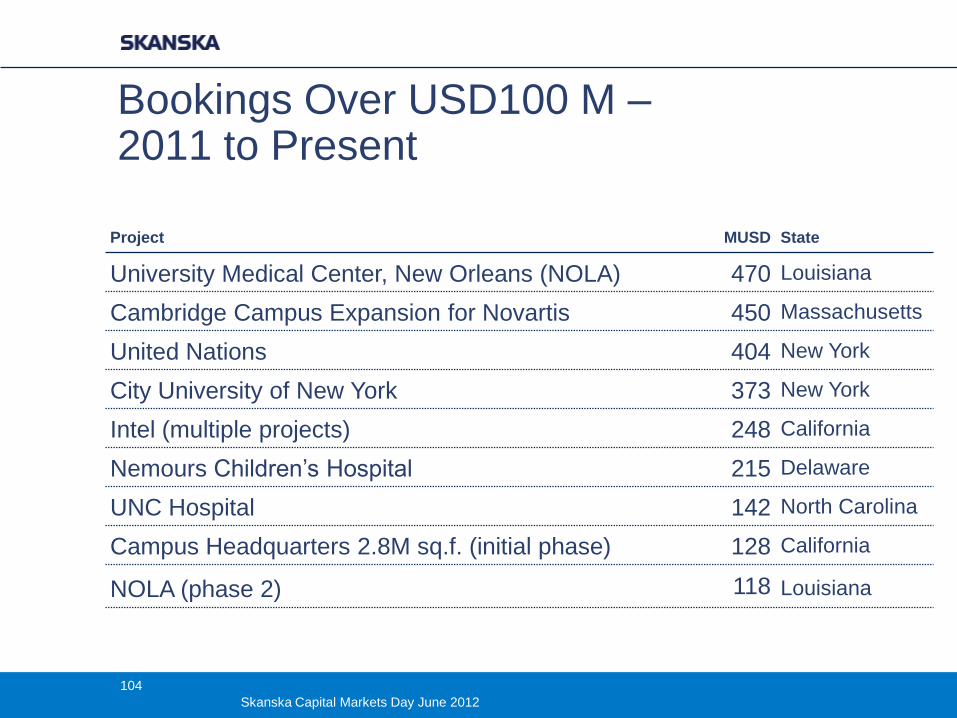
Bookings Over USD100 M – 2011 to Present
Project
MUSD State
University Medical Center, New Orleans (NOLA) 470 Louisiana
Cambridge Campus Expansion for Novartis 450 Massachusetts
United Nations 404 New York
City University of New York 373 New York
Intel (multiple projects) 248 California
Nemours Children’s Hospital 215 Delaware
UNC Hospital 142 North Carolina
Campus Headquarters 2.8M sq.f. (initial phase) 128 California
NOLA (phase 2) 118 Louisiana
104
Skanska Capital Markets Day June 2012
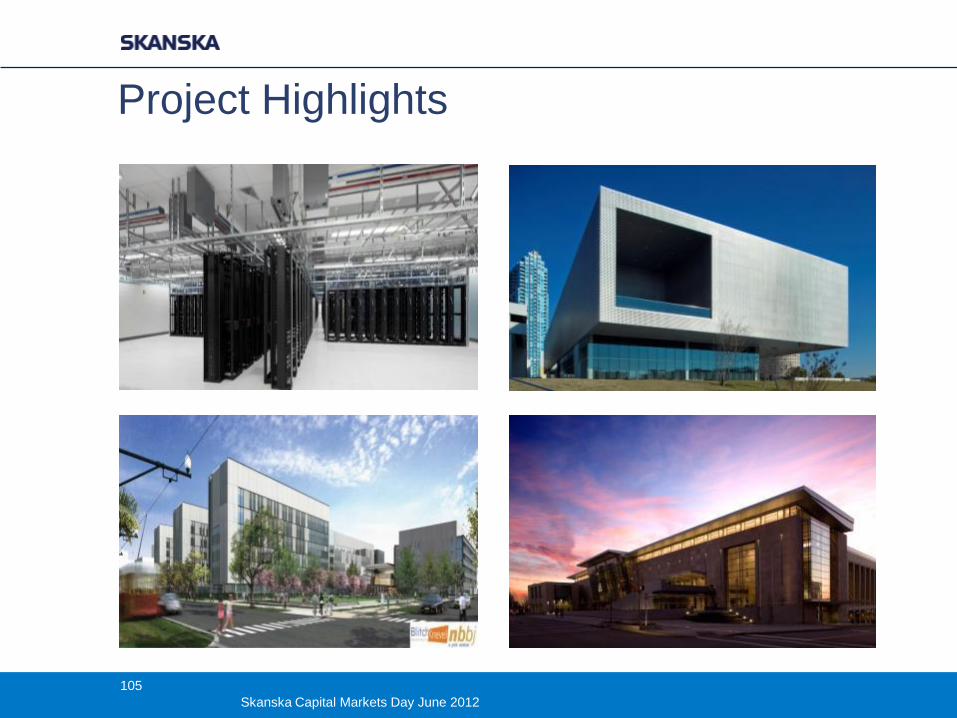
Project Highlights
105
Skanska Capital Markets Day June 2012
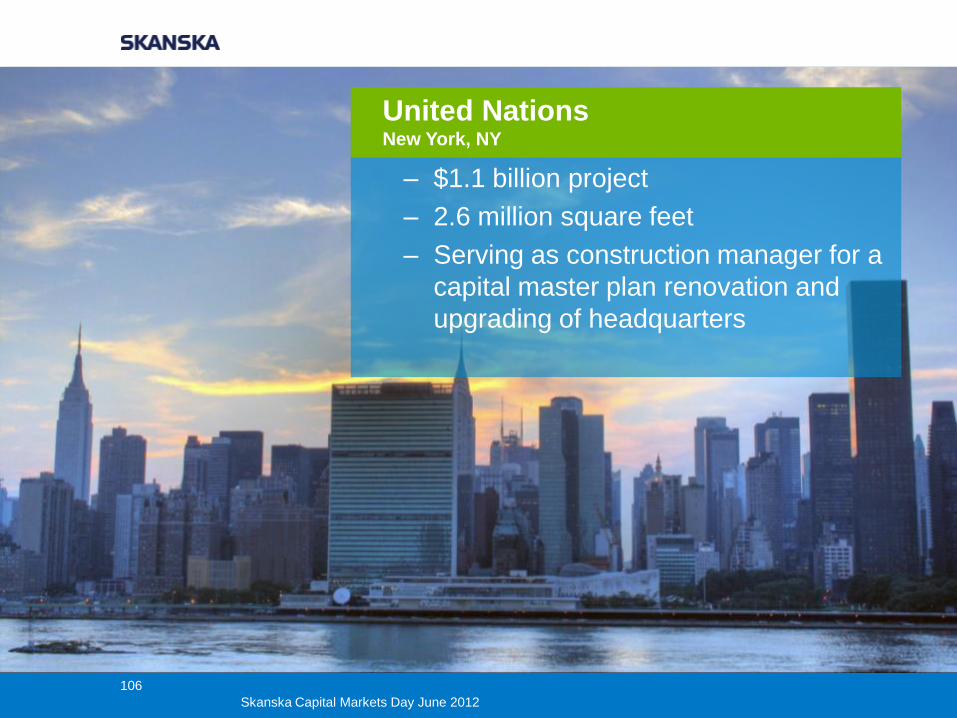
– $1.1 billion project
– 2.6 million square feet
– Serving as construction manager for a
capital master plan renovation and
upgrading of headquarters
United Nations New York, NY
106
Skanska Capital Markets Day June 2012
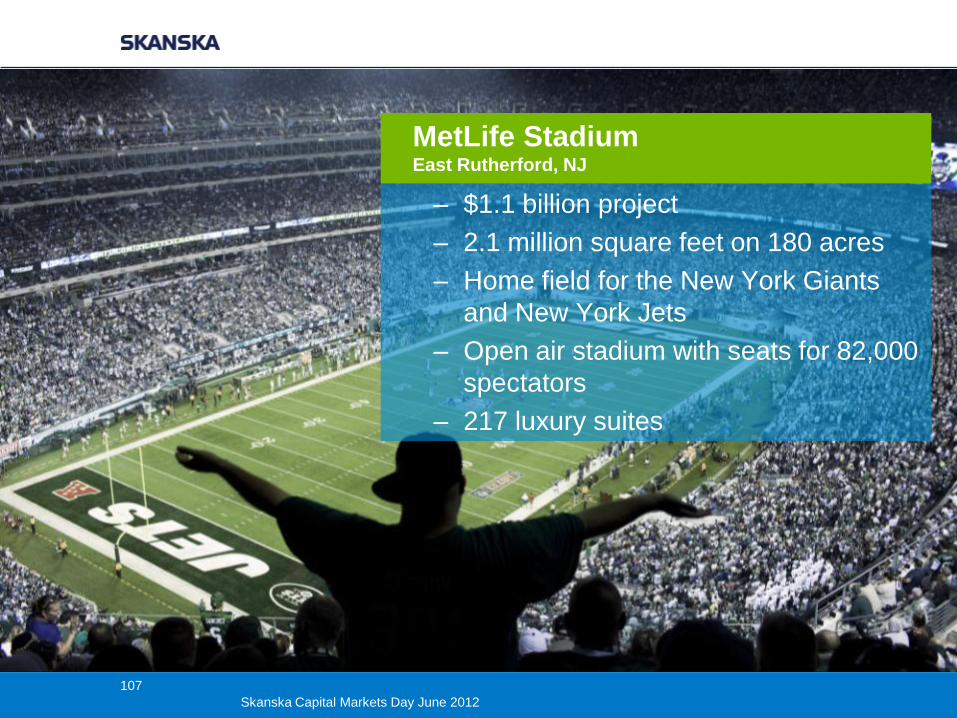
– $1.1 billion project
– 2.1 million square feet on 180 acres
– Home field for the New York Giants
and New York Jets
– Open air stadium with seats for 82,000
spectators
– 217 luxury suites
MetLife Stadium East Rutherford, NJ
107
Skanska Capital Markets Day June 2012
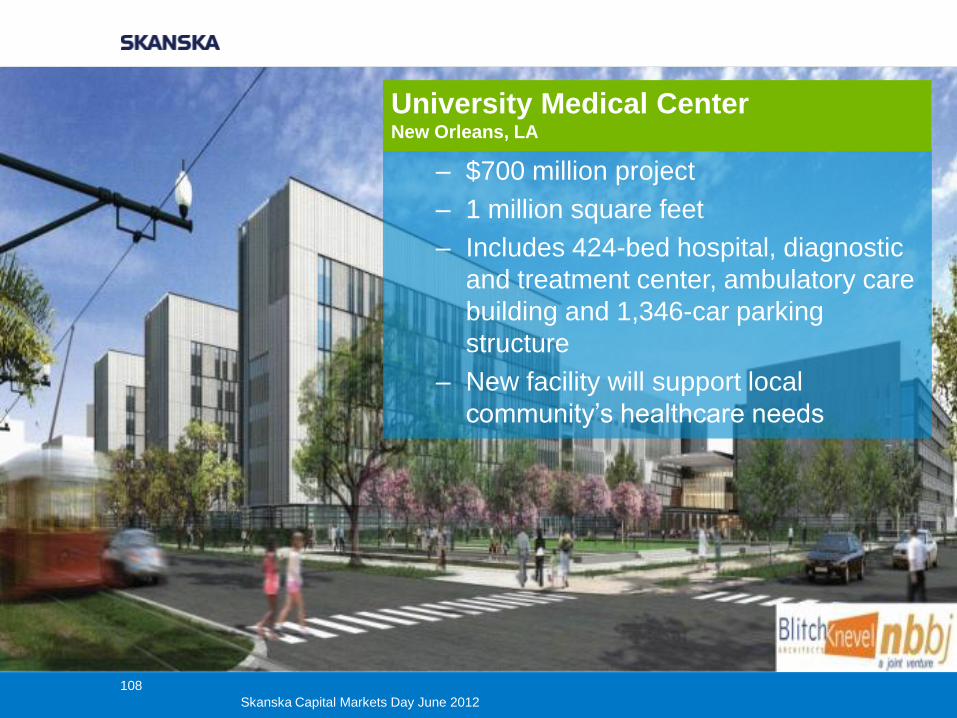
– $700 million project
– 1 million square feet
– Includes 424-bed hospital, diagnostic
and treatment center, ambulatory care
building and 1,346-car parking
structure
– New facility will support local
community’s healthcare needs
University Medical Center New Orleans, LA
108
Skanska Capital Markets Day June 2012
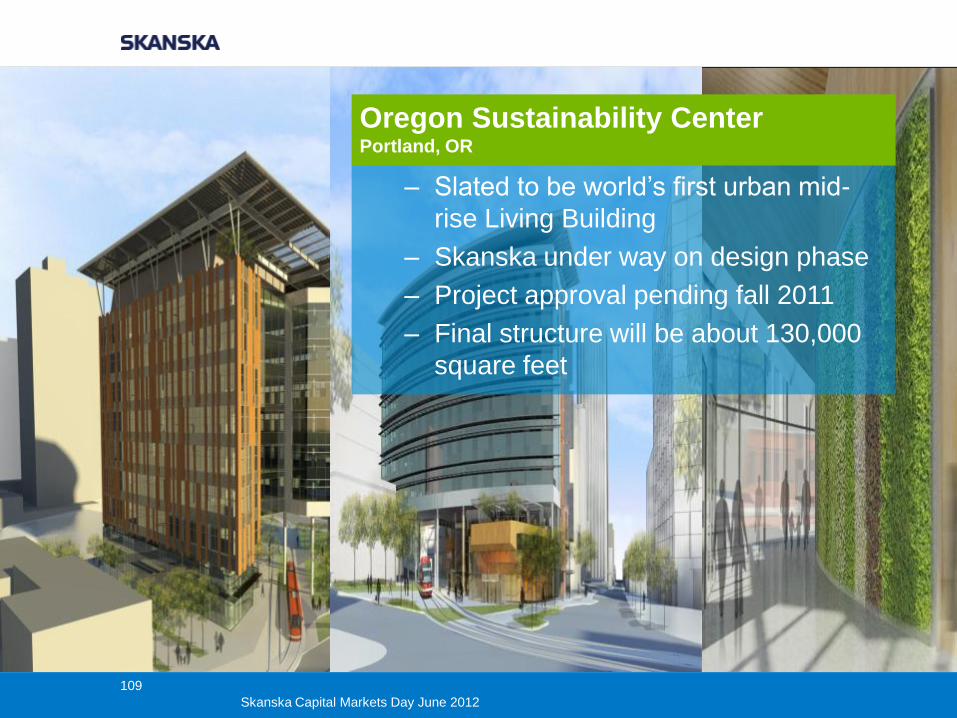
– Slated to be world’s first urban mid-
rise Living Building
– Skanska under way on design phase
– Project approval pending fall 2011
– Final structure will be about 130,000
square feet
Oregon Sustainability Center Portland, OR
109
Skanska Capital Markets Day June 2012
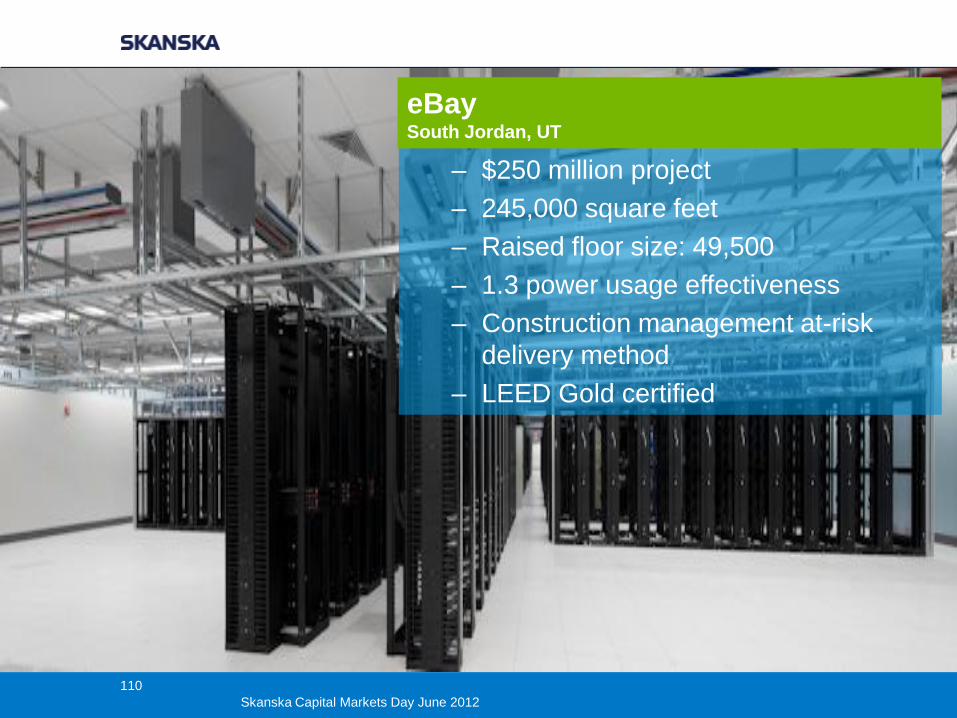
– $250 million project
– 245,000 square feet
– Raised floor size: 49,500
– 1.3 power usage effectiveness
– Construction management at-risk
delivery method
– LEED Gold certified
eBay South Jordan, UT
110
Skanska Capital Markets Day June 2012
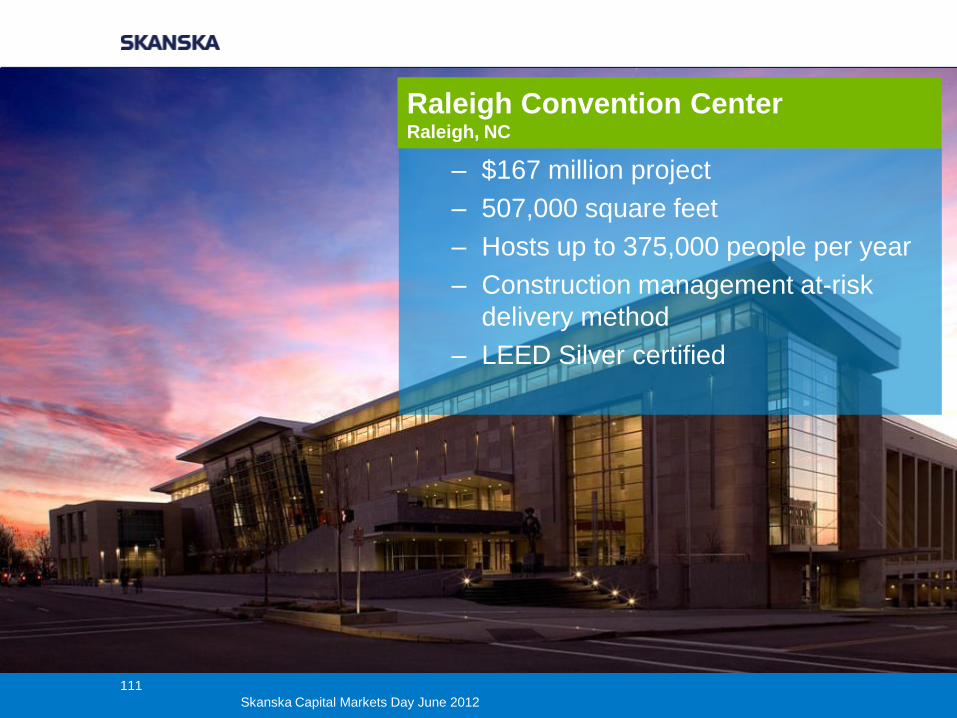
– $167 million project
– 507,000 square feet
– Hosts up to 375,000 people per year
– Construction management at-risk
delivery method
– LEED Silver certified
Raleigh Convention Center Raleigh, NC
111
Skanska Capital Markets Day June 2012
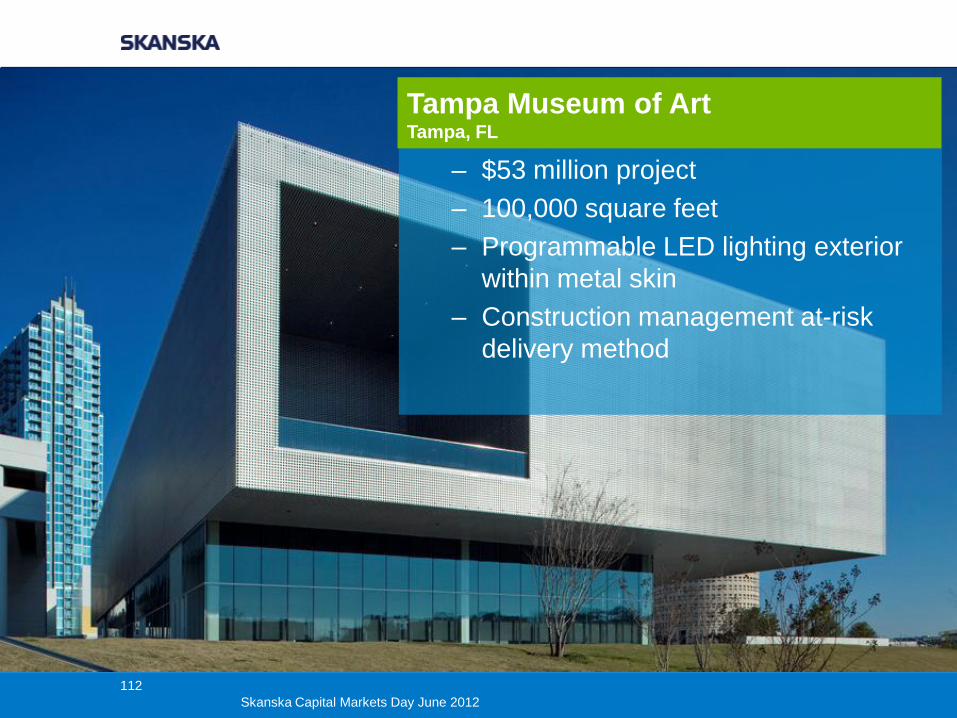
– $53 million project
– 100,000 square feet
– Programmable LED lighting exterior
within metal skin
– Construction management at-risk
delivery method
Tampa Museum of Art Tampa, FL
112
Skanska Capital Markets Day June 2012
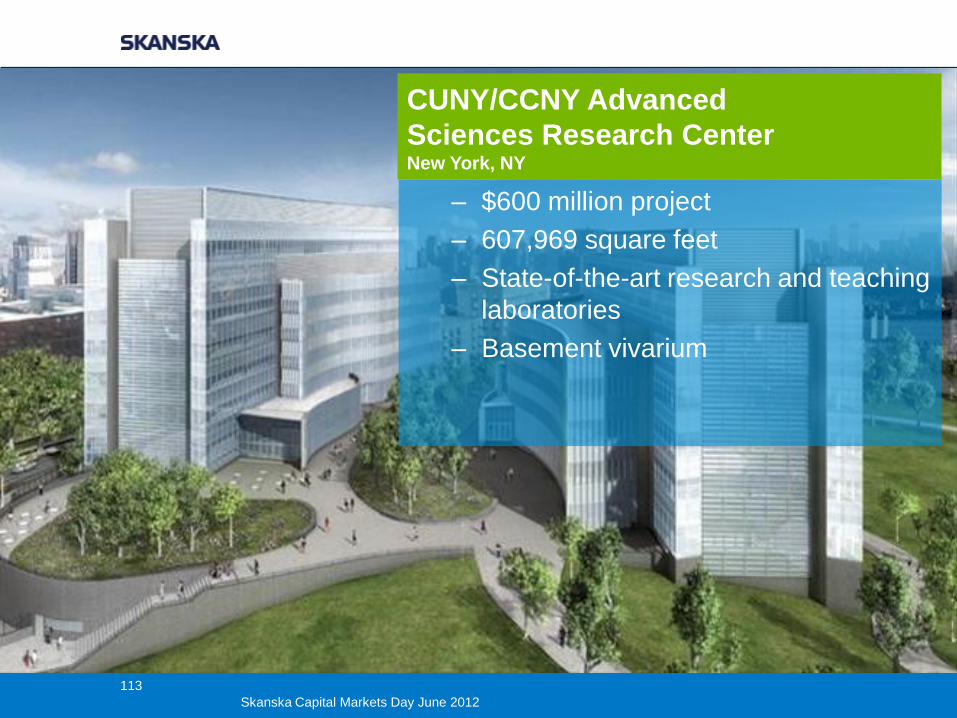
– $600 million project
– 607,969 square feet
– State-of-the-art research and teaching
laboratories
– Basement vivarium
CUNY/CCNY Advanced
Sciences Research Center New York, NY
113
Skanska Capital Markets Day June 2012
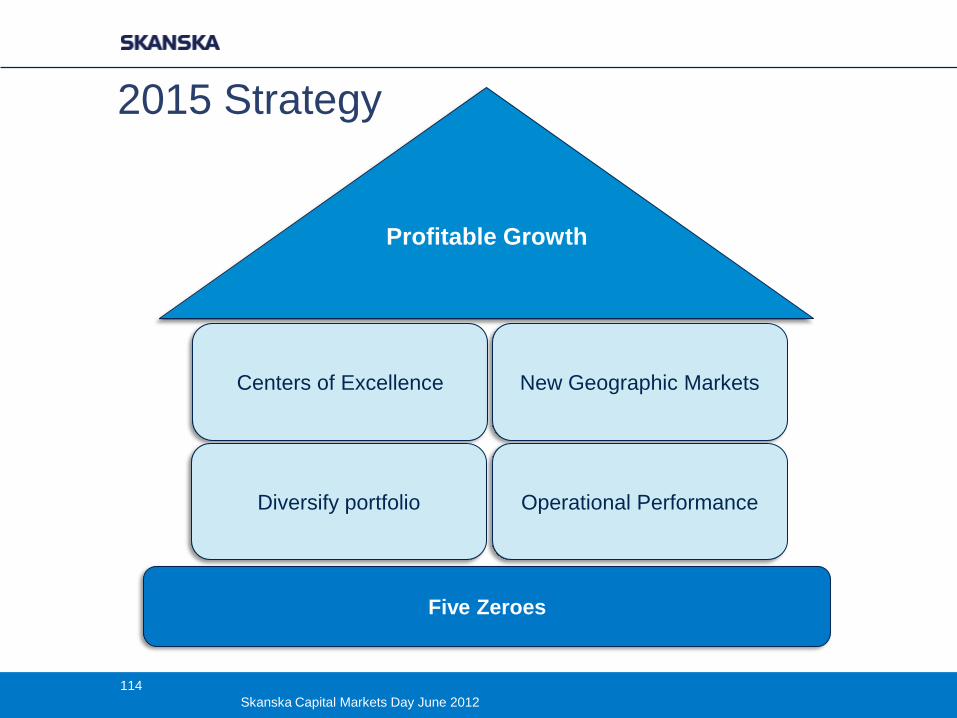
Profitable Growth
Centers of Excellence
Five Zeroes
New Geographic Markets
Diversify portfolio Operational Performance
2015 Strategy
114
Skanska Capital Markets Day June 2012
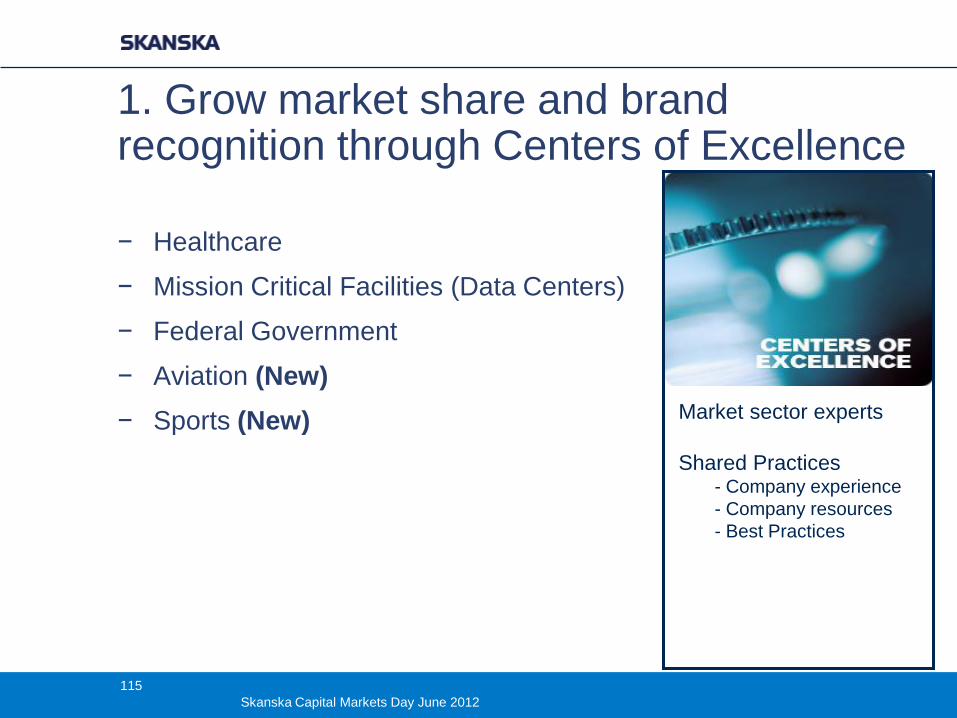
1. Grow market share and brand recognition through Centers of Excellence
− Healthcare
− Mission Critical Facilities (Data Centers)
− Federal Government
− Aviation (New)
− Sports (New) Market sector experts
Shared Practices - Company experience
- Company resources
- Best Practices
115
Skanska Capital Markets Day June 2012
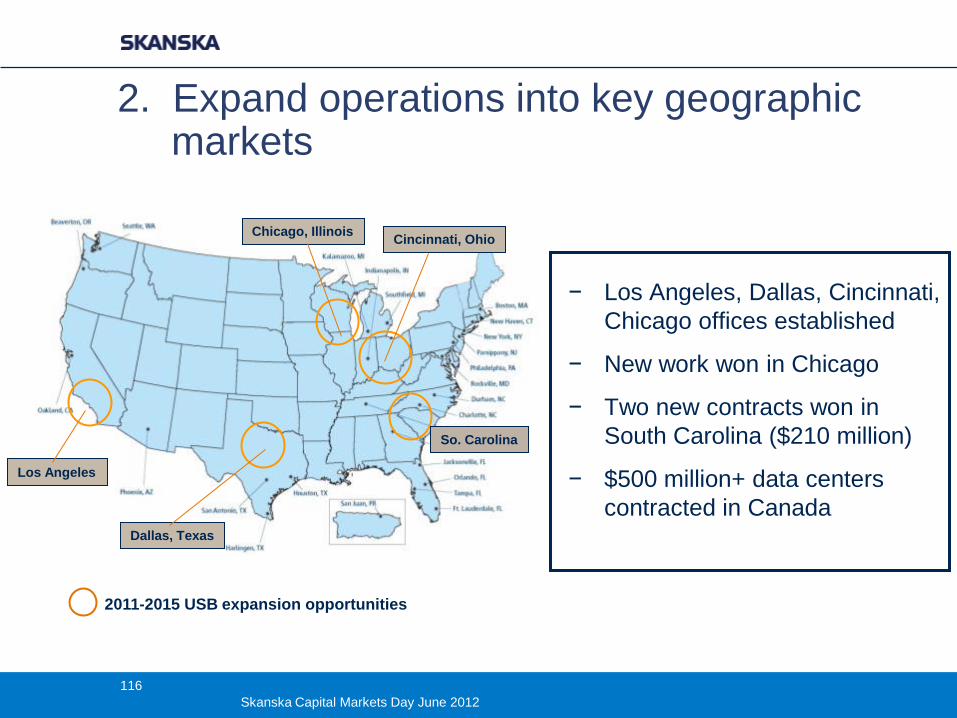
2. Expand operations into key geographic markets
2011-2015 USB expansion opportunities
− Los Angeles, Dallas, Cincinnati,
Chicago offices established
− New work won in Chicago
− Two new contracts won in
South Carolina ($210 million)
− $500 million+ data centers
contracted in Canada
Los Angeles
So. Carolina
Dallas, Texas
Chicago, Illinois Cincinnati, Ohio
116
Skanska Capital Markets Day June 2012
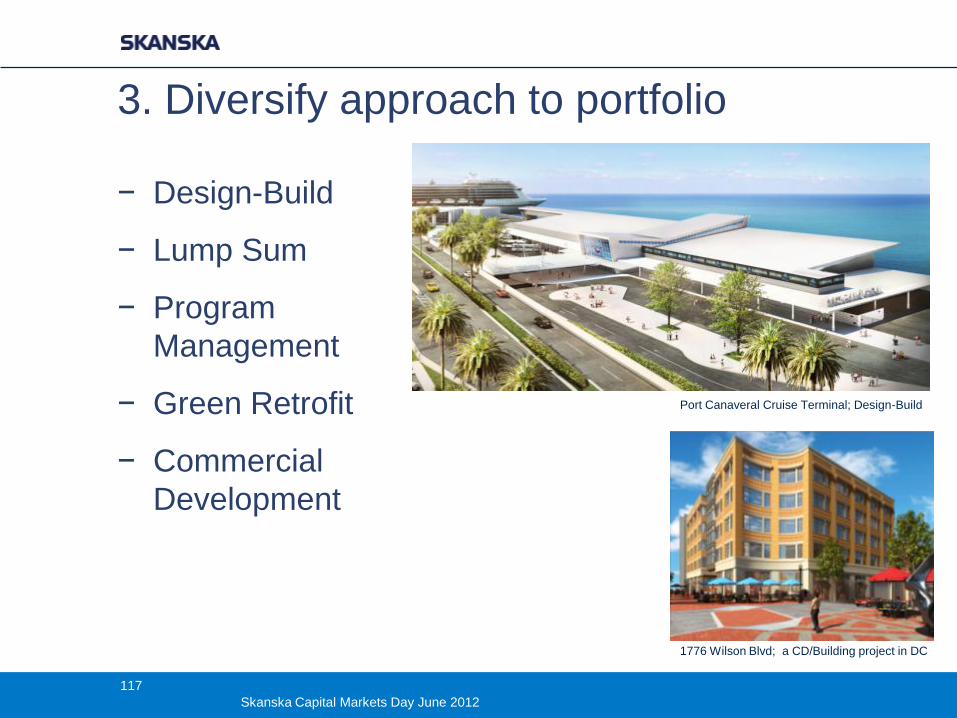
3. Diversify approach to portfolio
− Design-Build
− Lump Sum
− Program
Management
− Green Retrofit
− Commercial
Development
1776 Wilson Blvd; a CD/Building project in DC
Port Canaveral Cruise Terminal; Design-Build
117
Skanska Capital Markets Day June 2012
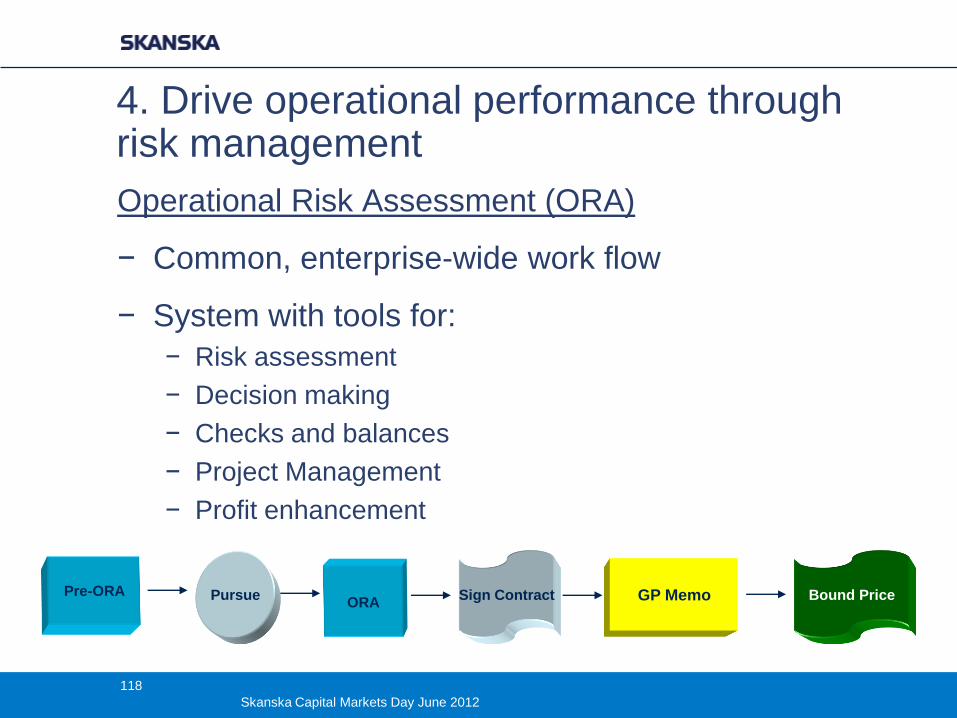
4. Drive operational performance through risk management Operational Risk Assessment (ORA)
− Common, enterprise-wide work flow
− System with tools for:
− Risk assessment
− Decision making
− Checks and balances
− Project Management
− Profit enhancement
Pre-ORA ORA
GP Memo Bound Price Sign Contract Pursue
118
Skanska Capital Markets Day June 2012
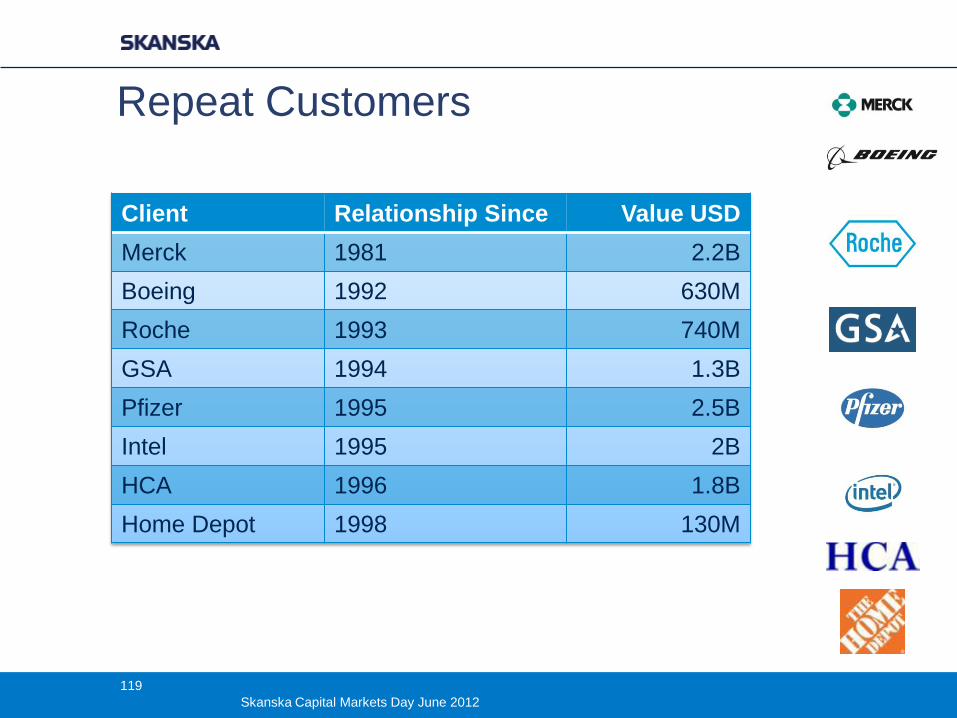
Repeat Customers
Client Relationship Since Value USD
Merck 1981 2.2B
Boeing 1992 630M
Roche 1993 740M
GSA 1994 1.3B
Pfizer 1995 2.5B
Intel 1995 2B
HCA 1996 1.8B
Home Depot 1998 130M
119
Skanska Capital Markets Day June 2012
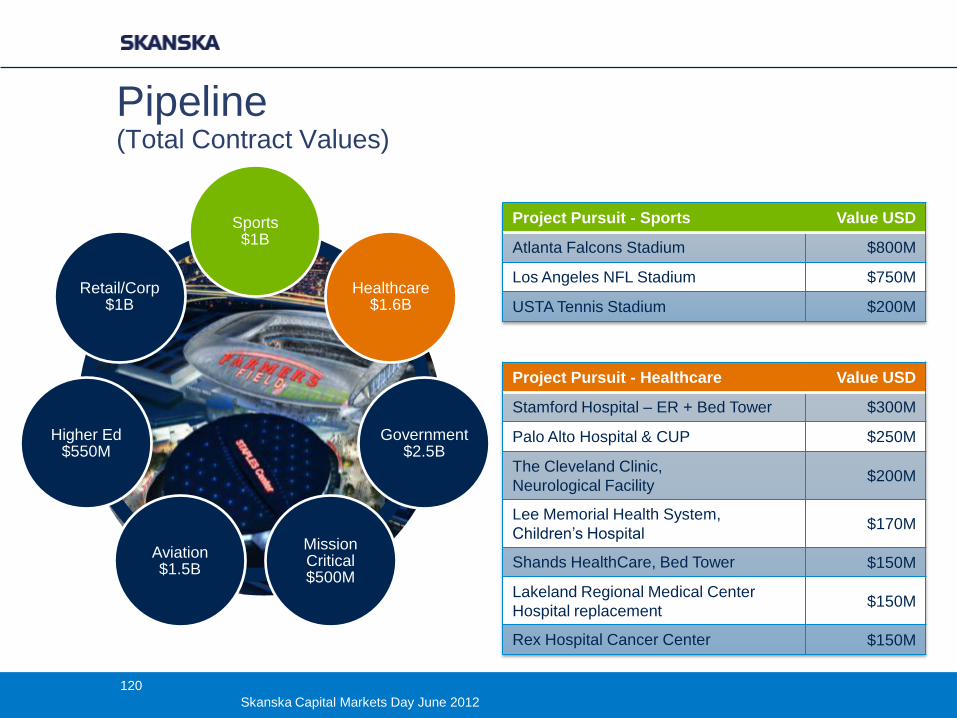
Pipeline (Total Contract Values)
Project Pursuit - Healthcare Value USD
Stamford Hospital – ER + Bed Tower $300M
Palo Alto Hospital & CUP $250M
The Cleveland Clinic,
Neurological Facility $200M
Lee Memorial Health System,
Children’s Hospital $170M
Shands HealthCare, Bed Tower $150M
Lakeland Regional Medical Center
Hospital replacement $150M
Rex Hospital Cancer Center $150M
Project Pursuit - Sports Value USD
Atlanta Falcons Stadium $800M
Los Angeles NFL Stadium $750M
USTA Tennis Stadium $200M
2012 Sports $1B
Healthcare $1.6B
Government $2.5B
Mission Critical $500M
Aviation $1.5B
Higher Ed $550M
Retail/Corp $1B
120
Skanska Capital Markets Day June 2012
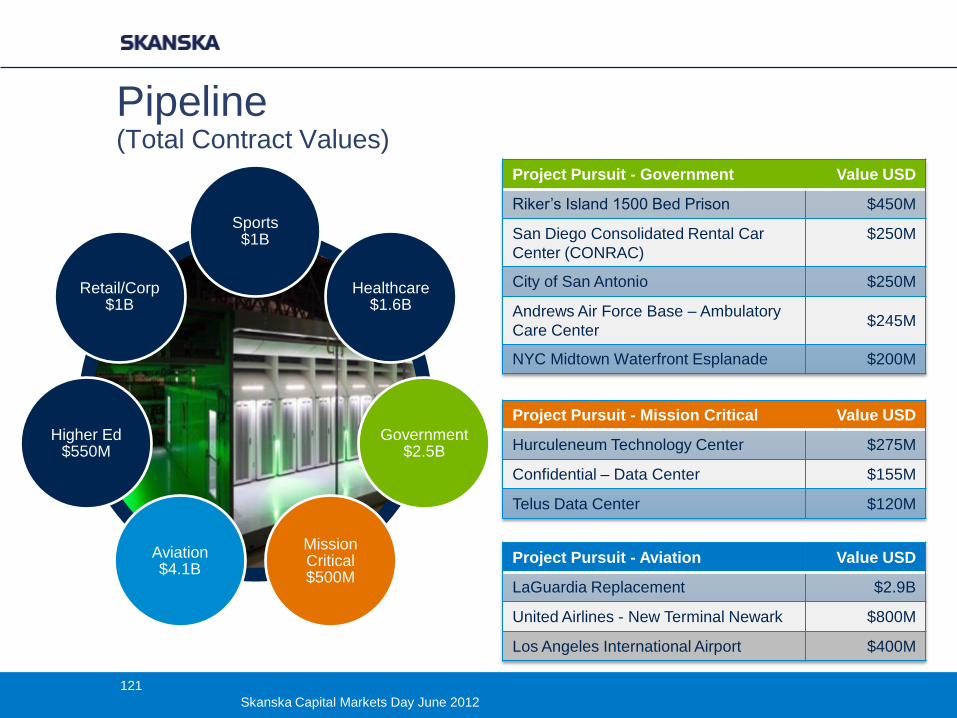
Pipeline (Total Contract Values)
Project Pursuit - Mission Critical Value USD
Hurculeneum Technology Center $275M
Confidential – Data Center $155M
Telus Data Center $120M
Project Pursuit - Government Value USD
Riker’s Island 1500 Bed Prison $450M
San Diego Consolidated Rental Car
Center (CONRAC)
$250M
City of San Antonio $250M
Andrews Air Force Base – Ambulatory
Care Center $245M
NYC Midtown Waterfront Esplanade $200M
Project Pursuit - Aviation Value USD
LaGuardia Replacement $2.9B
United Airlines - New Terminal Newark $800M
Los Angeles International Airport $400M
2012 Sports $1B
Healthcare $1.6B
Government $2.5B
Mission Critical $500M
Aviation $4.1B
Higher Ed $550M
Retail/Corp $1B
121
Skanska Capital Markets Day June 2012
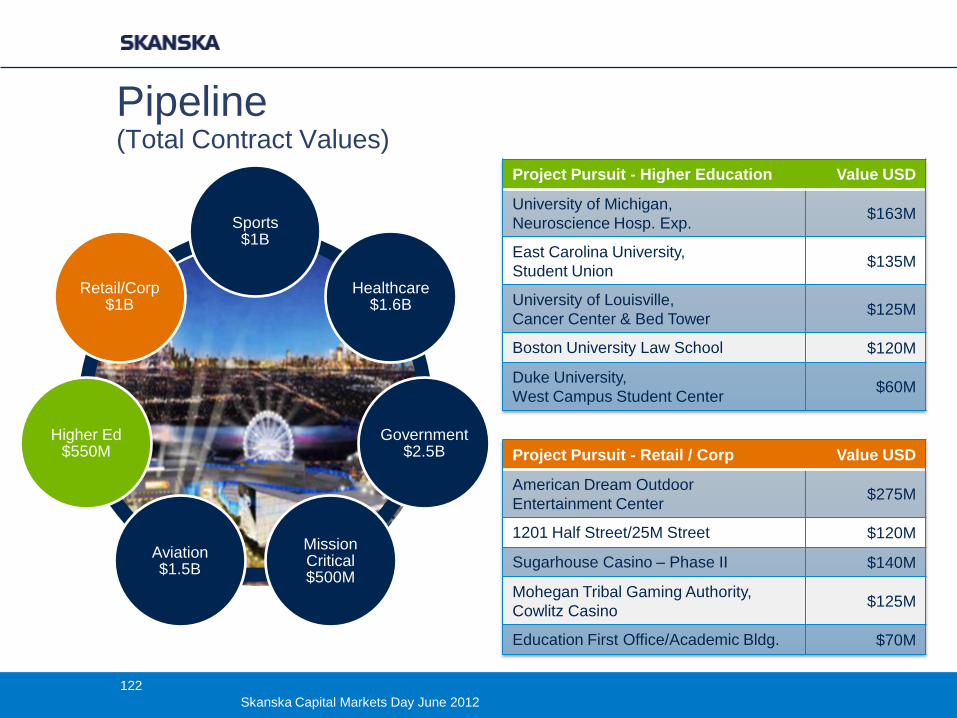
Pipeline (Total Contract Values)
Project Pursuit - Retail / Corp Value USD
American Dream Outdoor
Entertainment Center $275M
1201 Half Street/25M Street $120M
Sugarhouse Casino – Phase II $140M
Mohegan Tribal Gaming Authority,
Cowlitz Casino $125M
Education First Office/Academic Bldg. $70M
Project Pursuit - Higher Education Value USD
University of Michigan,
Neuroscience Hosp. Exp. $163M
East Carolina University,
Student Union $135M
University of Louisville,
Cancer Center & Bed Tower $125M
Boston University Law School $120M
Duke University,
West Campus Student Center $60M
2012 Sports $1B
Healthcare $1.6B
Government $2.5B
Mission Critical $500M
Aviation $1.5B
Higher Ed $550M
Retail/Corp $1B
122
Skanska Capital Markets Day June 2012
Skanska Commercial Property Development in the U.S.
Mats Johansson
123
Skanska Capital Markets Day June 2012
Agenda
− U.S. real estate market
− Status of the market
− Commercial Development USA
− Select markets and drivers
− Markets strategy
− Project pipeline
− Ongoing and upcoming investments
− Moving forward
124
Skanska Capital Markets Day June 2012
The U.S. Real Estate Market
− Very competitive and mature markets
− Fragmented and local
− Big difference between markets
− Specialized roles
− developer, investor, lender and contractor
− Real estate brokers have a very strong position
− Broad range of equity investors
− Private equity
− Insurance companies
− Opportunistic pension funds
125
Skanska Capital Markets Day June 2012
Status of the market
− Slow recovery but with huge regional differences
− Several markets show positive job creation
− Distressed deals are declining
− A lot of capital looking for core deals
− Construction financing available for urban multifamily
but still difficult for office projects
126
Skanska Capital Markets Day June 2012
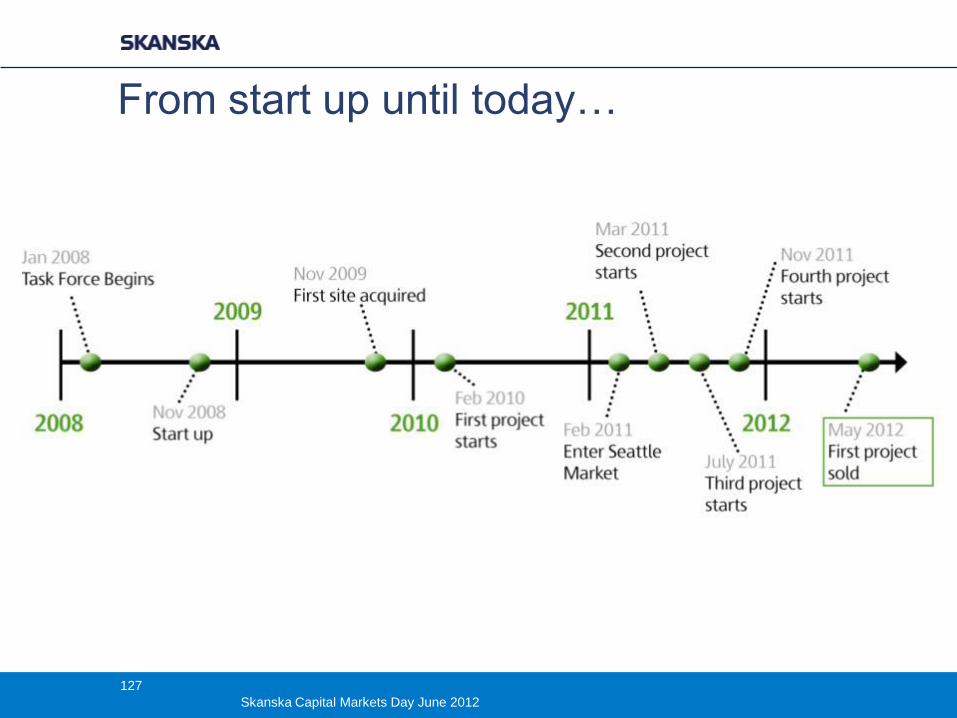
From start up until today…
127
Skanska Capital Markets Day June 2012
Our operational philosophy
− Focused & Selective
− Two project types
− Four markets
− Selected submarkets
− Local
− Staff
− Knowledge
− Long term
− Risk mitigation & use of Skanska synergies
− People
− Solutions
− Consider equity partners
128
Skanska Capital Markets Day June 2012
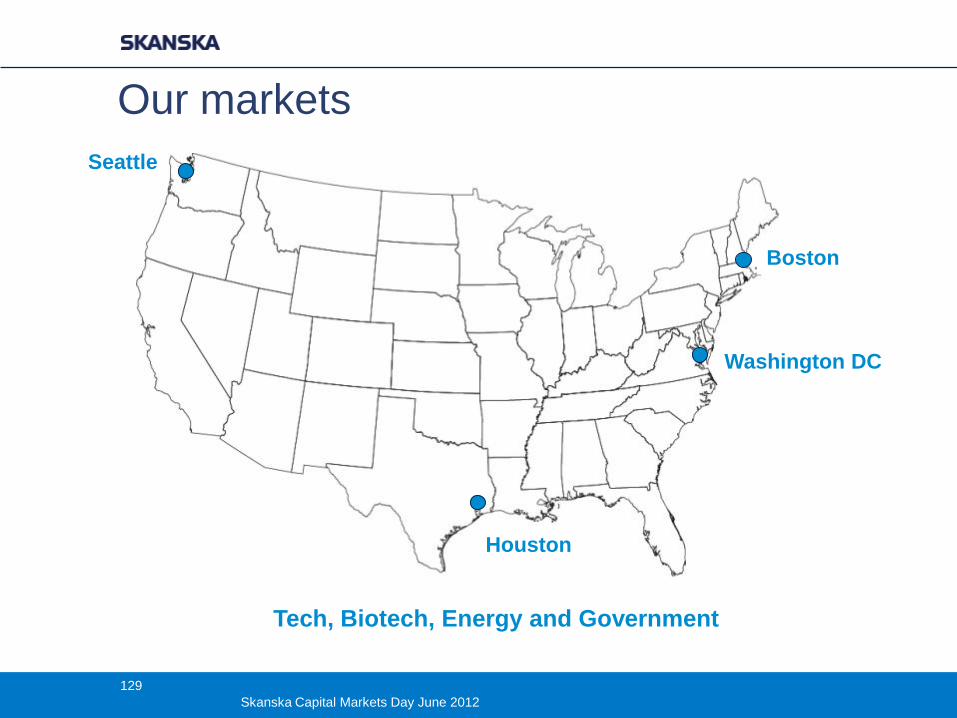
Our markets
Boston
Houston
Washington DC
Seattle
Tech, Biotech, Energy and Government
129
Skanska Capital Markets Day June 2012
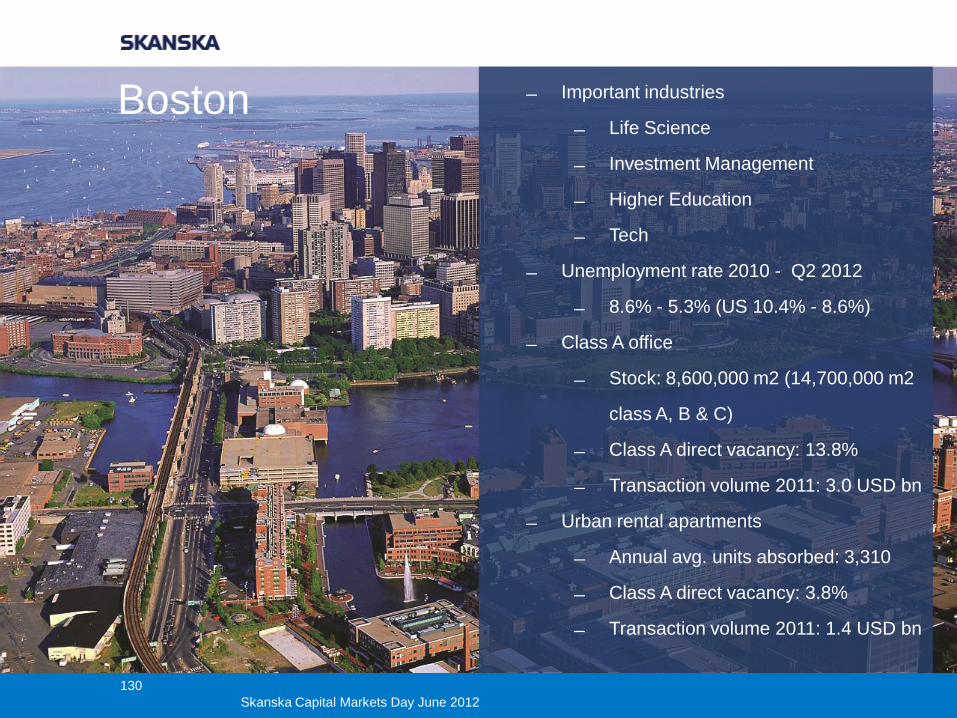
Boston Important industries
Life Science
Investment Management
Higher Education
Tech
Unemployment rate 2010 - Q2 2012
8.6% - 5.3% (US 10.4% - 8.6%)
Class A office
Stock: 8,600,000 m2 (14,700,000 m2
class A, B & C)
Class A direct vacancy: 13.8%
Transaction volume 2011: 3.0 USD bn
Urban rental apartments
Annual avg. units absorbed: 3,310
Class A direct vacancy: 3.8%
Transaction volume 2011: 1.4 USD bn
130
Skanska Capital Markets Day June 2012
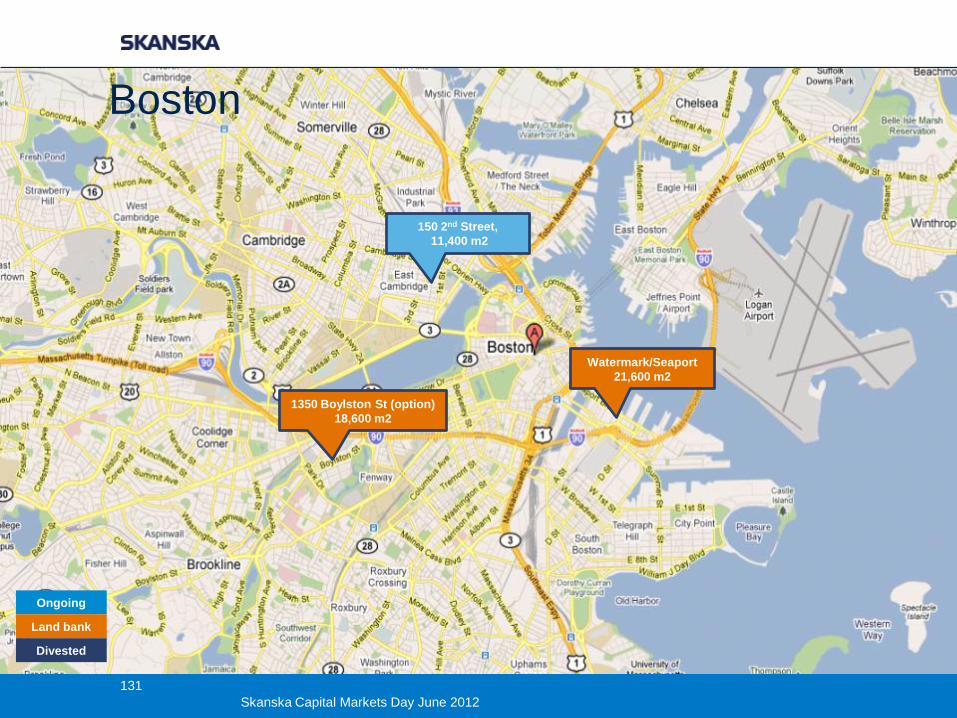
Boston
150 2nd Street,
11,400 m2
Watermark/Seaport
21,600 m2
Ongoing
Land bank
Divested
Boston
1350 Boylston St (option)
18,600 m2
131
Skanska Capital Markets Day June 2012
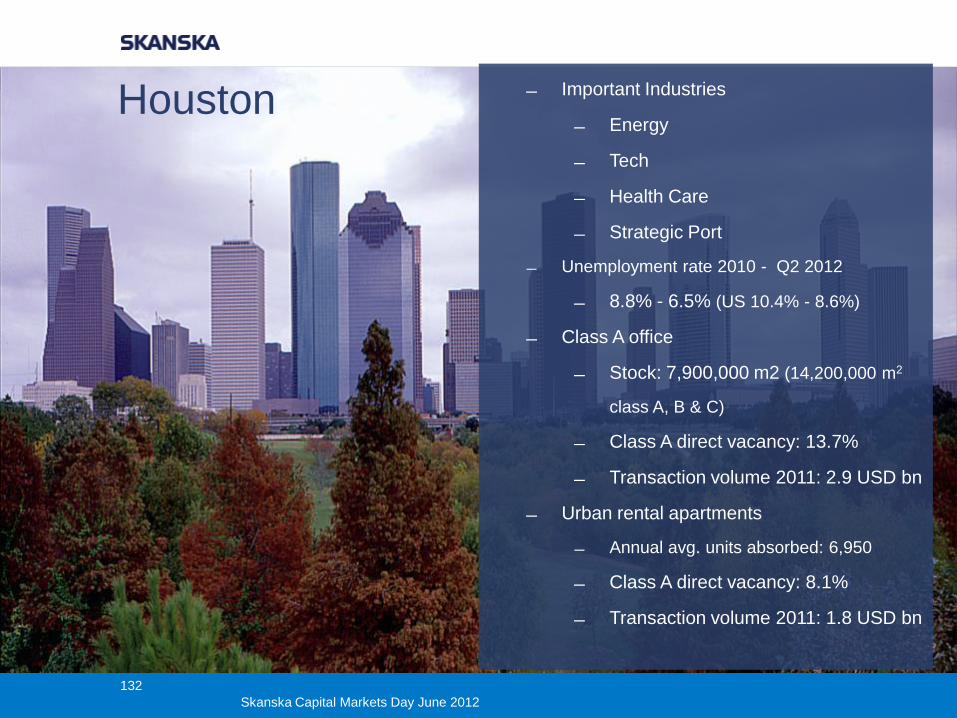
Houston Important Industries
Energy
Tech
Health Care
Strategic Port
Unemployment rate 2010 - Q2 2012
8.8% - 6.5% (US 10.4% - 8.6%)
Class A office
Stock: 7,900,000 m2 (14,200,000 m2
class A, B & C)
Class A direct vacancy: 13.7%
Transaction volume 2011: 2.9 USD bn
Urban rental apartments
Annual avg. units absorbed: 6,950
Class A direct vacancy: 8.1%
Transaction volume 2011: 1.8 USD bn
132
Skanska Capital Markets Day June 2012
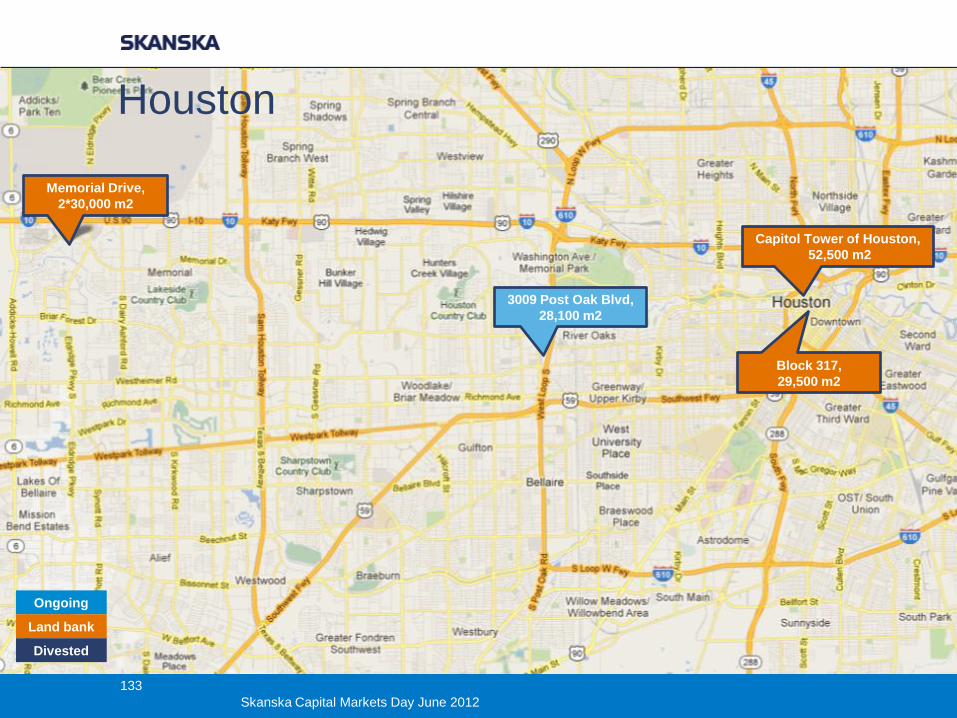
Houston
3009 Post Oak Blvd,
28,100 m2
Capitol Tower of Houston,
52,500 m2
Block 317,
29,500 m2
Ongoing
Land bank
Divested
Memorial Drive,
2*30,000 m2
133
Skanska Capital Markets Day June 2012
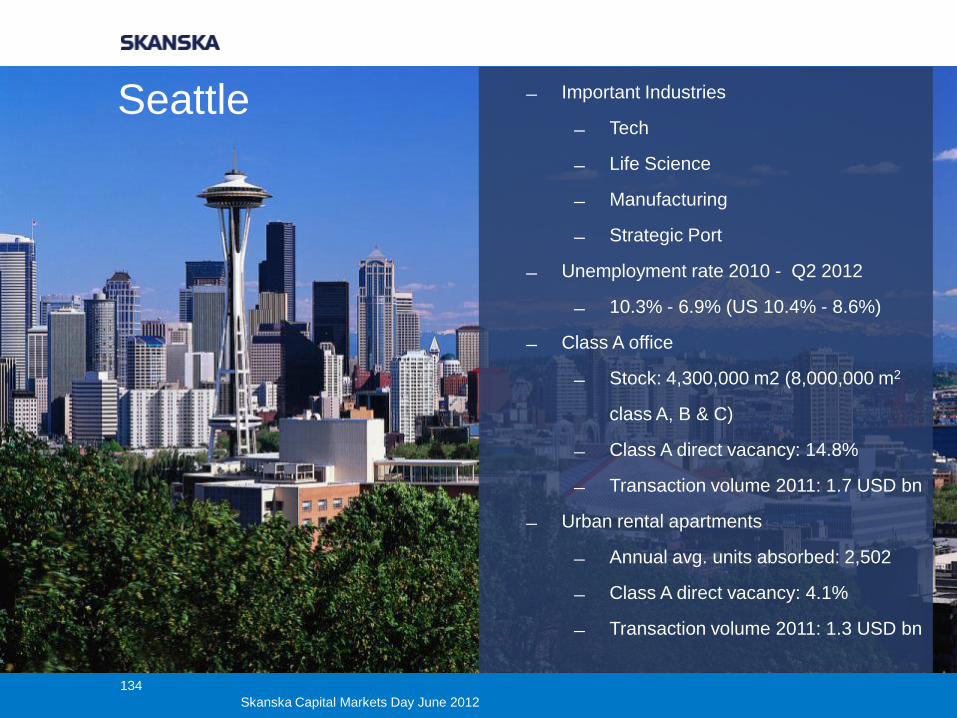
Seattle Important Industries
Tech
Life Science
Manufacturing
Strategic Port
Unemployment rate 2010 - Q2 2012
10.3% - 6.9% (US 10.4% - 8.6%)
Class A office
Stock: 4,300,000 m2 (8,000,000 m2
class A, B & C)
Class A direct vacancy: 14.8%
Transaction volume 2011: 1.7 USD bn
Urban rental apartments
Annual avg. units absorbed: 2,502
Class A direct vacancy: 4.1%
Transaction volume 2011: 1.3 USD bn
134
Skanska Capital Markets Day June 2012
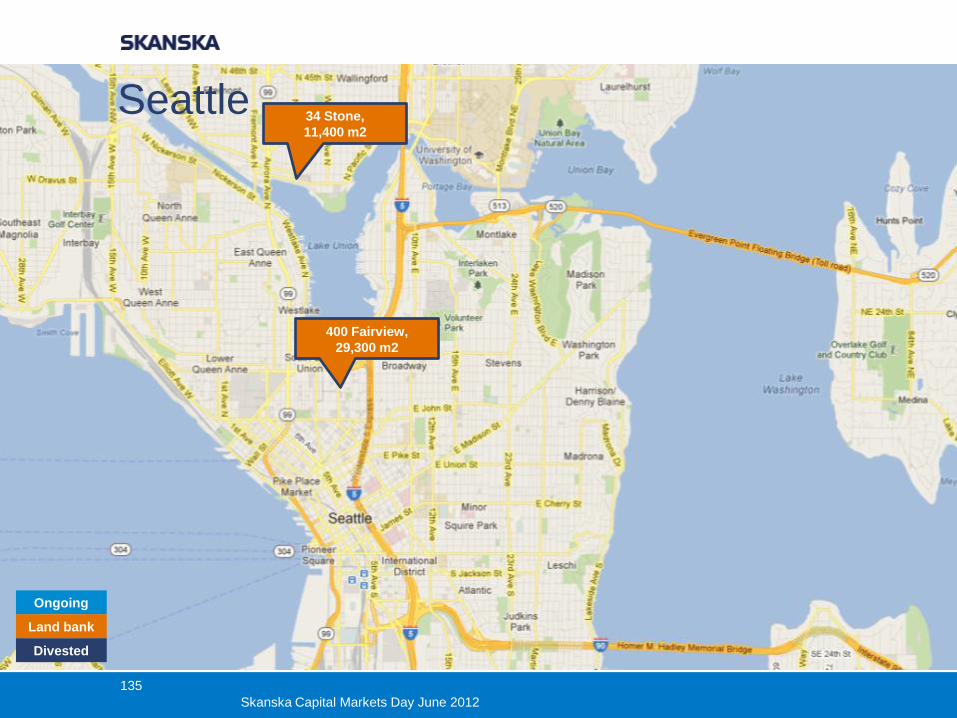
Seattle 34 Stone,
11,400 m2
400 Fairview,
29,300 m2
Ongoing
Land bank
Divested
135
Skanska Capital Markets Day June 2012
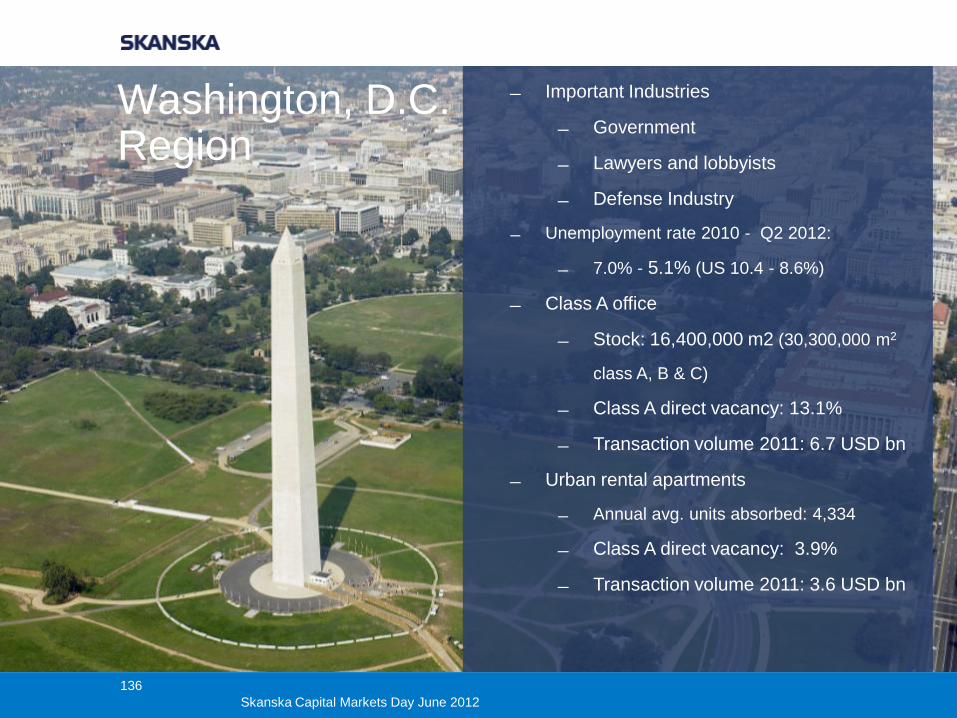
Washington, D.C. Region
Important Industries
Government
Lawyers and lobbyists
Defense Industry
Unemployment rate 2010 - Q2 2012:
7.0% - 5.1% (US 10.4 - 8.6%)
Class A office
Stock: 16,400,000 m2 (30,300,000 m2
class A, B & C)
Class A direct vacancy: 13.1%
Transaction volume 2011: 6.7 USD bn
Urban rental apartments
Annual avg. units absorbed: 4,334
Class A direct vacancy: 3.9%
Transaction volume 2011: 3.6 USD bn
136
Skanska Capital Markets Day June 2012
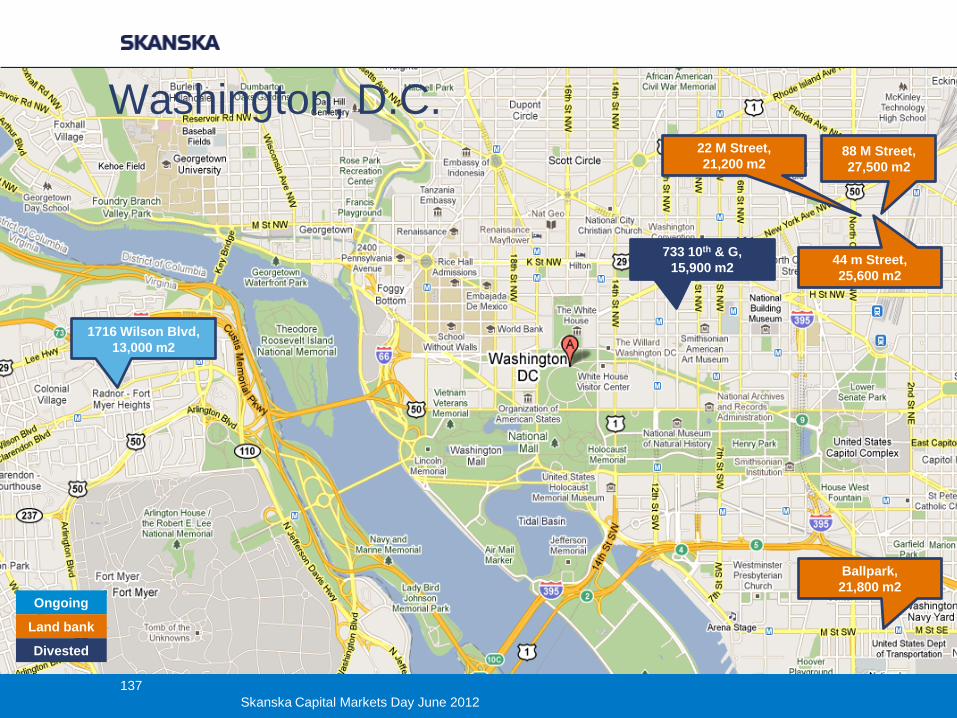
1716 Wilson Blvd,
13,000 m2
733 10th & G,
15,900 m2
22 M Street,
21,200 m2
44 m Street,
25,600 m2
88 M Street,
27,500 m2
Ongoing
Land bank
Divested
Ballpark,
21,800 m2
Washington, D.C.
137
Skanska Capital Markets Day June 2012
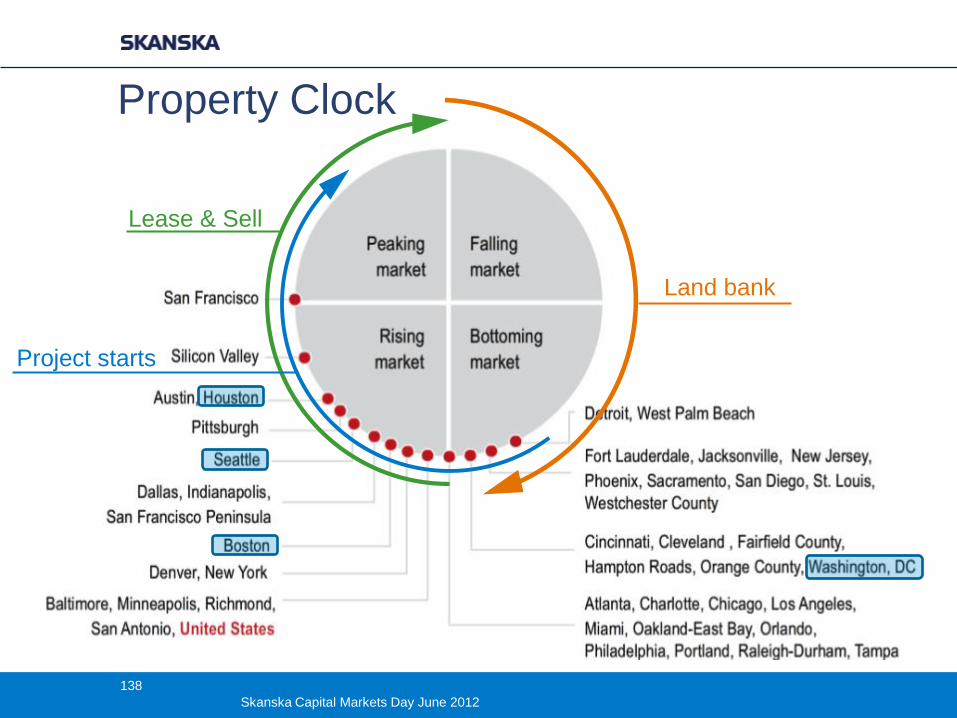
Property Clock
Land bank
Lease & Sell
Project starts
138
Skanska Capital Markets Day June 2012
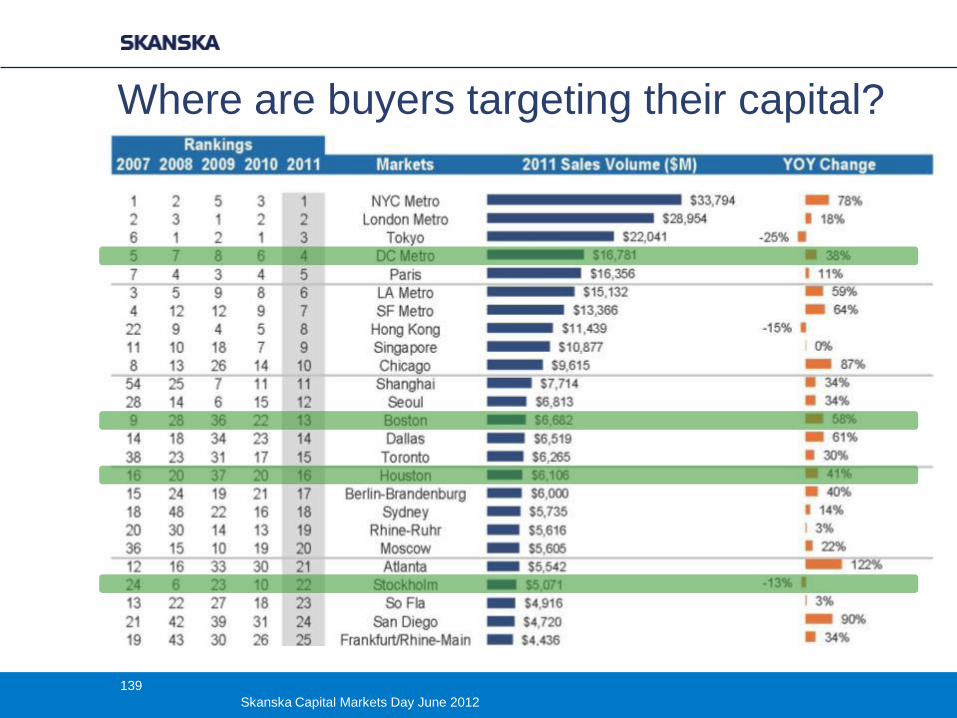
Where are buyers targeting their capital?
139
Skanska Capital Markets Day June 2012
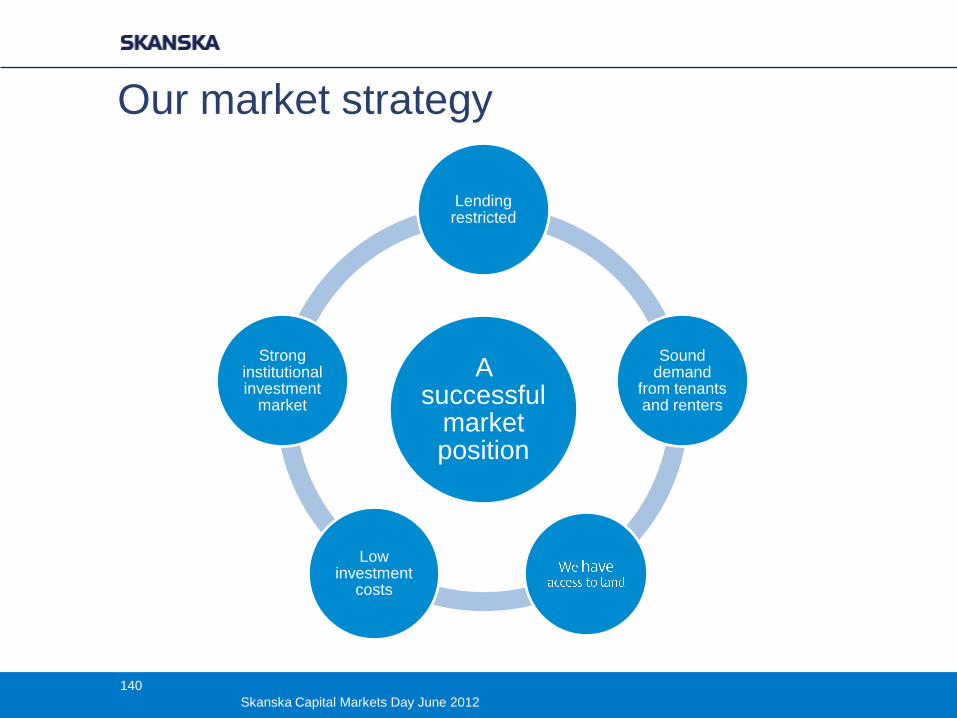
Our market strategy
A successful
market position
Lending restricted
Sound demand
from tenants and renters
Low investment
costs
Strong institutional investment
market
140
Skanska Capital Markets Day June 2012
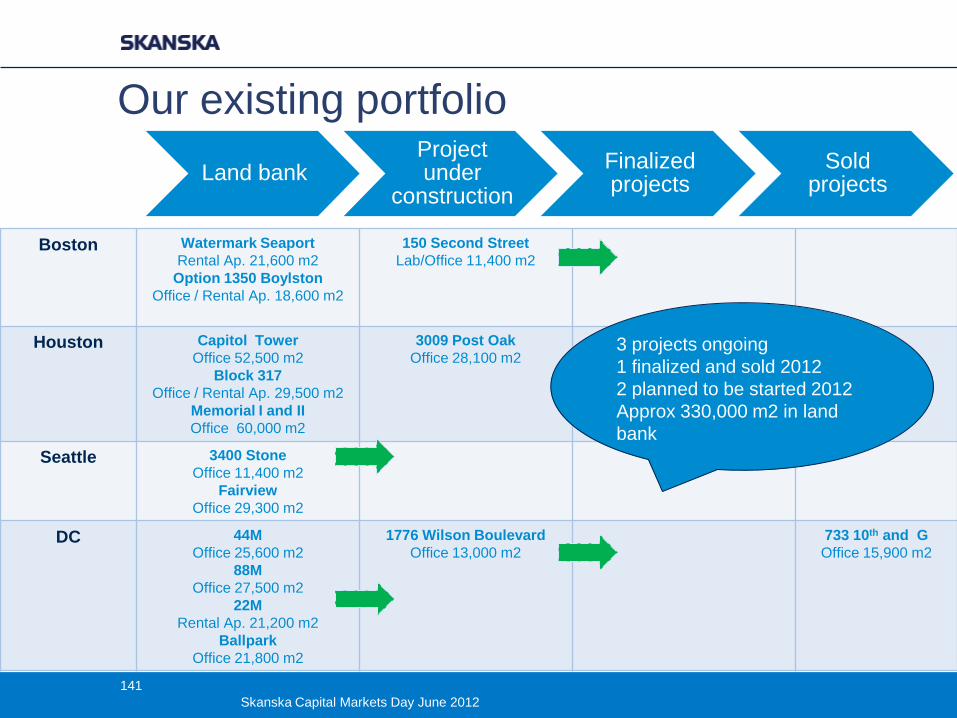
Land bank Project under
construction
Finalized projects
Sold projects
Our existing portfolio
Boston Watermark Seaport
Rental Ap. 21,600 m2
Option 1350 Boylston
Office / Rental Ap. 18,600 m2
150 Second Street
Lab/Office 11,400 m2
Houston Capitol Tower
Office 52,500 m2
Block 317
Office / Rental Ap. 29,500 m2
Memorial I and II
Office 60,000 m2
3009 Post Oak
Office 28,100 m2
Seattle 3400 Stone
Office 11,400 m2
Fairview
Office 29,300 m2
DC 44M
Office 25,600 m2
88M
Office 27,500 m2
22M
Rental Ap. 21,200 m2
Ballpark
Office 21,800 m2
1776 Wilson Boulevard
Office 13,000 m2
733 10th and G
Office 15,900 m2
3 projects ongoing
1 finalized and sold 2012
2 planned to be started 2012
Approx 330,000 m2 in land
bank
141
Skanska Capital Markets Day June 2012
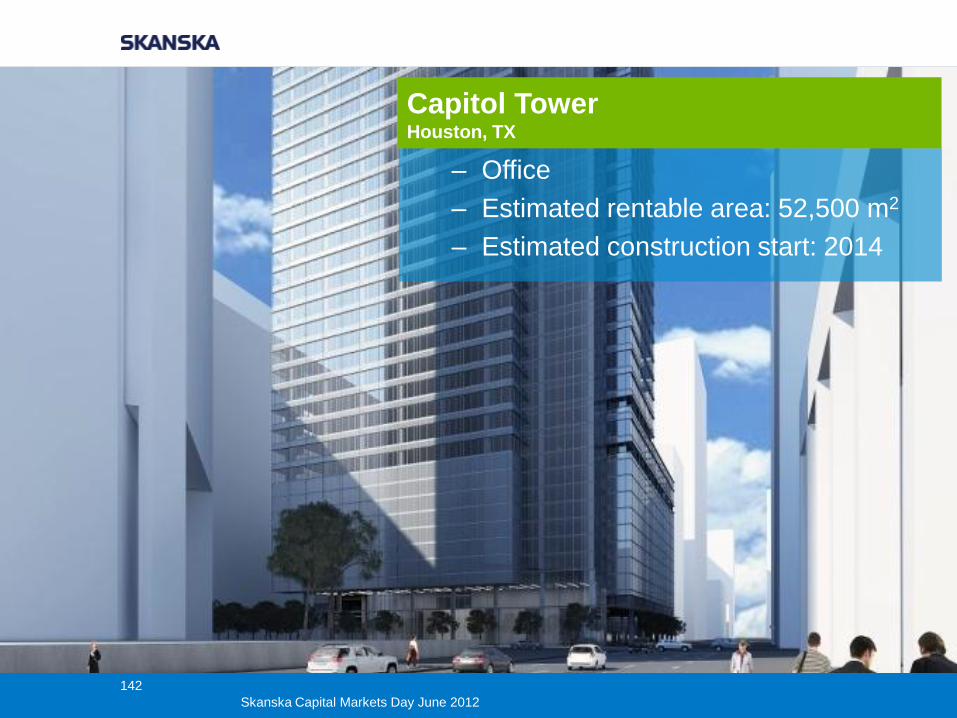
– Office
– Estimated rentable area: 52,500 m2
– Estimated construction start: 2014
Capitol Tower Houston, TX
142
Skanska Capital Markets Day June 2012
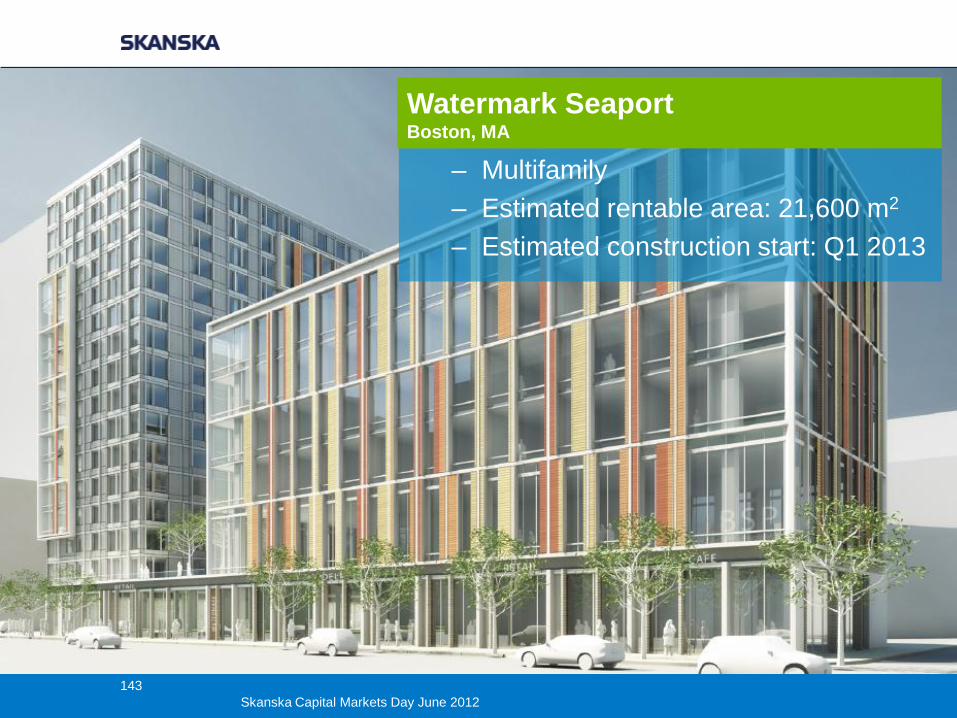
– Multifamily
– Estimated rentable area: 21,600 m2
– Estimated construction start: Q1 2013
Watermark Seaport Boston, MA
143
Skanska Capital Markets Day June 2012
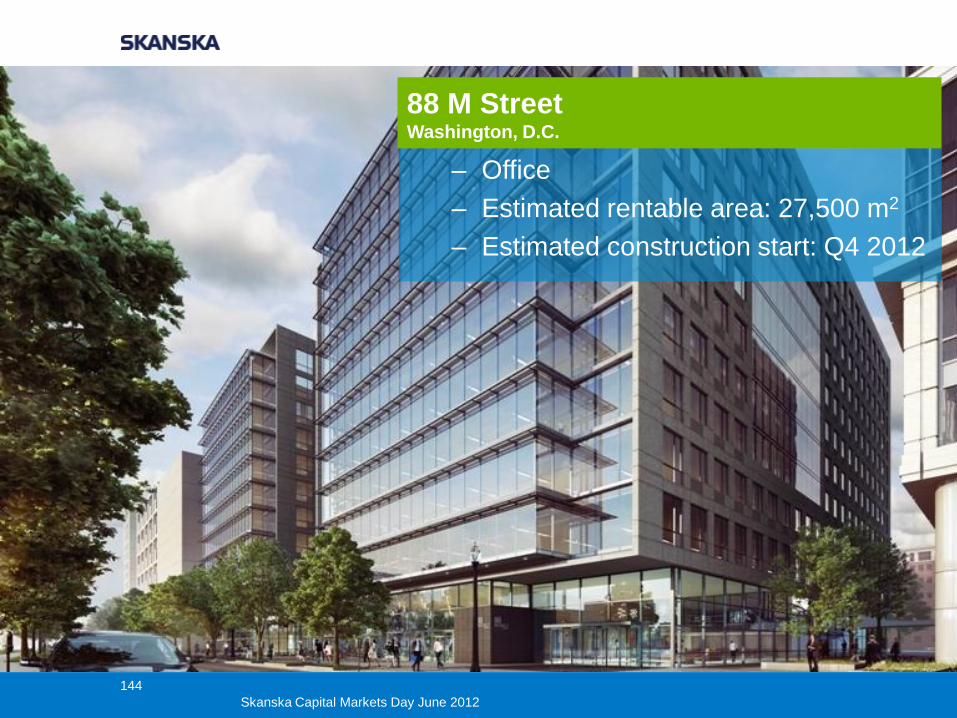
– Office
– Estimated rentable area: 27,500 m2
– Estimated construction start: Q4 2012
88 M Street Washington, D.C.
144
Skanska Capital Markets Day June 2012
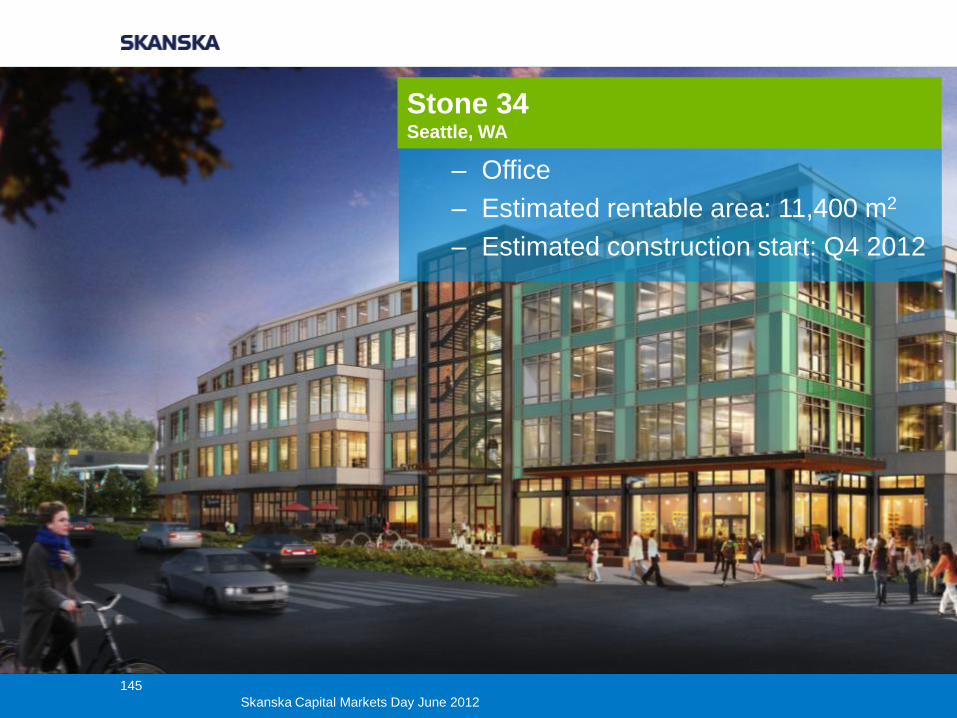
– Office
– Estimated rentable area: 11,400 m2
– Estimated construction start: Q4 2012
Stone 34 Seattle, WA
145
Skanska Capital Markets Day June 2012
Strategy going forward
− Lease up started projects
− Selective starts of new projects
− Show EBIT results in all markets
− Buy more land
− Manage the real estate cycles over time
− Consider doing more in existing markets or establish
ourselves in a few more markets
146
Skanska Capital Markets Day June 2012
Q & A
147
Skanska Capital Markets Day June 2012


