62
Skanska Commercial Property Development Stockholm New, Sweden
Skanska Commercial Property Development
Stockholm New, Sweden
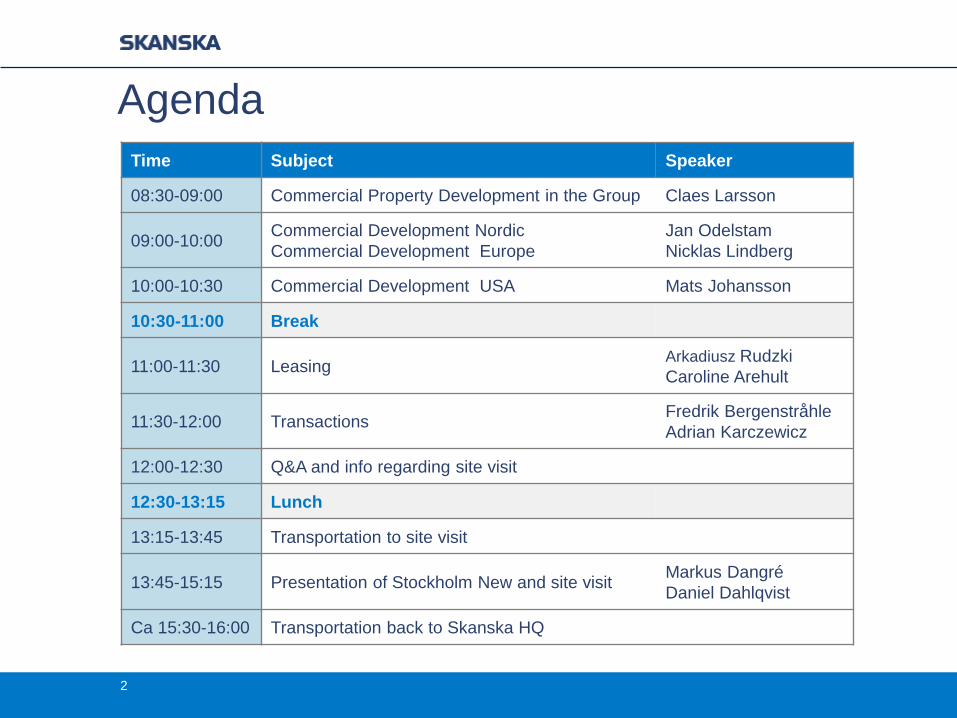
Agenda
Time Subject Speaker
08:30-09:00 Commercial Property Development in the Group Claes Larsson
09:00-10:00Commercial Development Nordic
Commercial Development Europe
Jan Odelstam
Nicklas Lindberg
10:00-10:30 Commercial Development USA Mats Johansson
10:30-11:00 Break
11:00-11:30 LeasingArkadiusz Rudzki
Caroline Arehult
11:30-12:00 TransactionsFredrik Bergenstråhle
Adrian Karczewicz
12:00-12:30 Q&A and info regarding site visit
12:30-13:15 Lunch
13:15-13:45 Transportation to site visit
13:45-15:15 Presentation of Stockholm New and site visitMarkus Dangré
Daniel Dahlqvist
Ca 15:30-16:00 Transportation back to Skanska HQ
2
Stockholm New, Sweden
Skanska Commercial Property Development
Claes LarssonExecutive Vice President
3
4
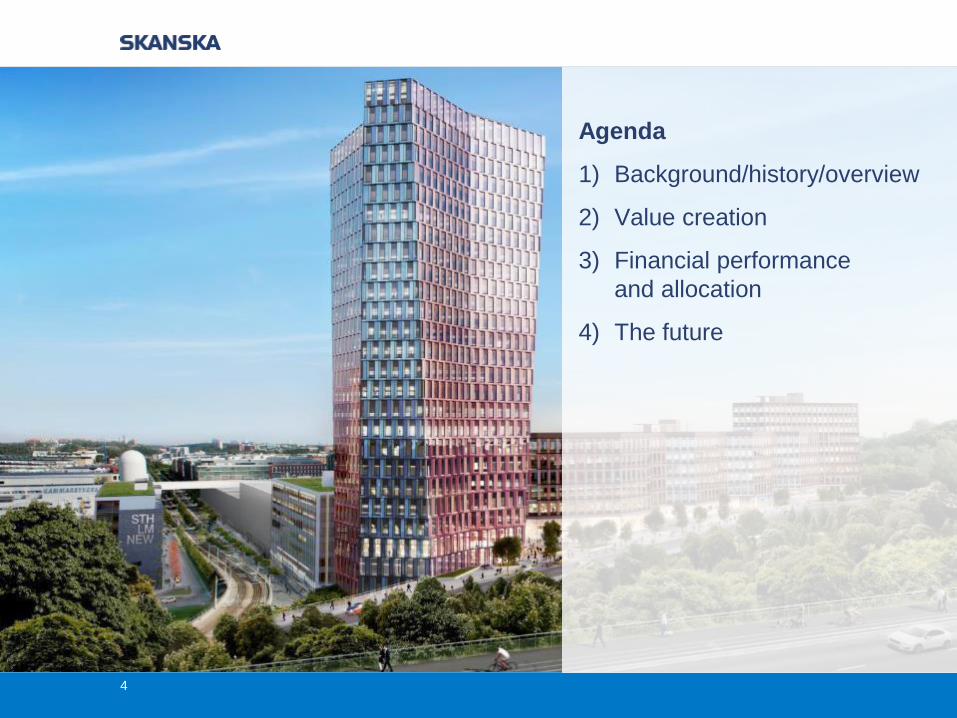
Agenda
1) Background/history/overview
2) Value creation
3) Financial performance
and allocation
4) The future
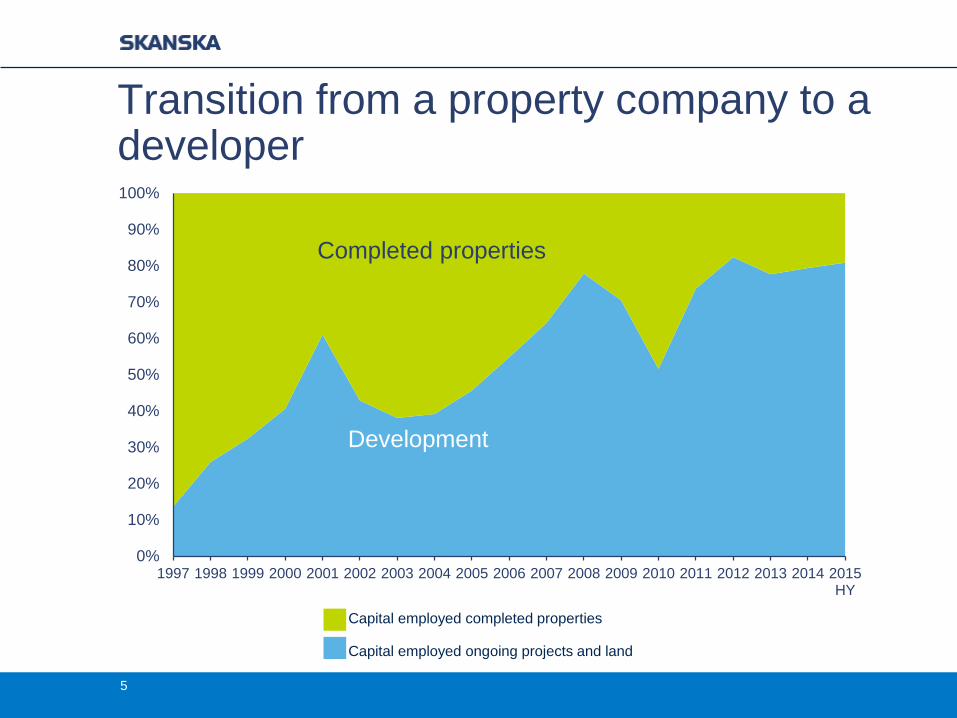
Transition from a property company to a developer
0%
10%
20%
30%
40%
50%
60%
70%
80%
90%
100%
1997 1998 1999 2000 2001 2002 2003 2004 2005 2006 2007 2008 2009 2010 2011 2012 2013 2014 2015HY
Development
Completed properties
Capital employed completed properties
Capital employed ongoing projects and land
5
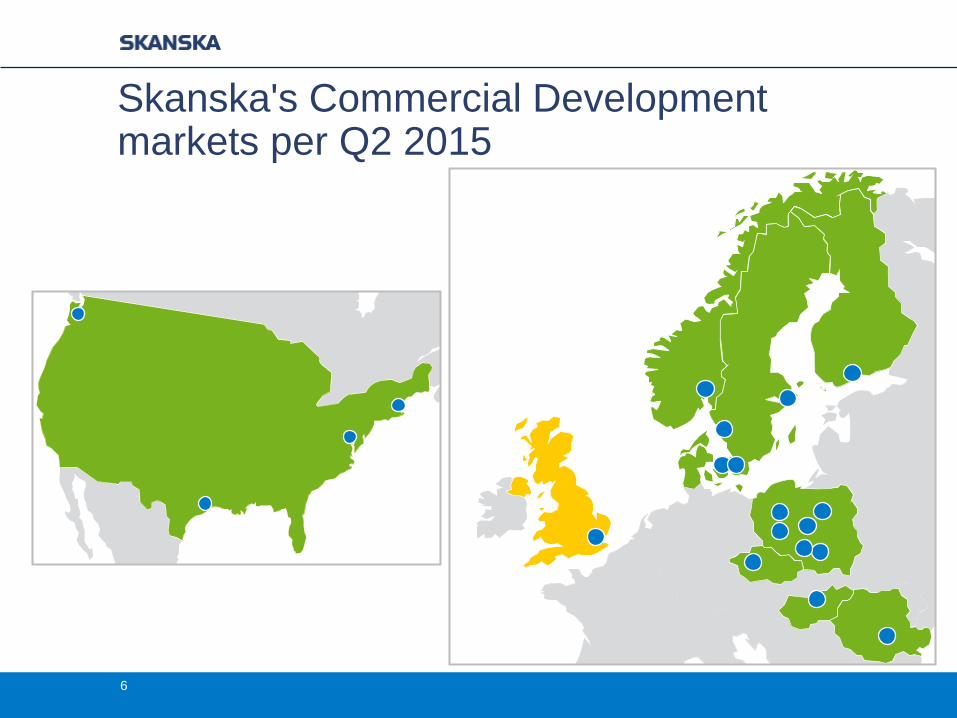
Skanska's Commercial Development markets per Q2 2015
6
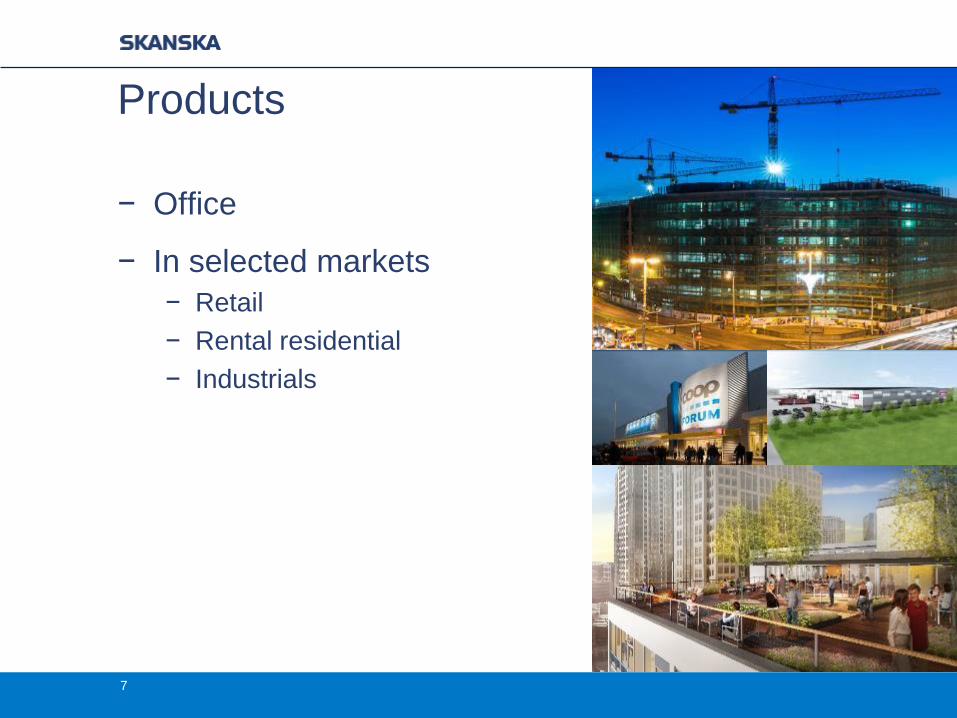
Products
− Office
− In selected markets
− Retail
− Rental residential
− Industrials
7

8
Agenda
1) Background/history/overview
2) Value creation
‒ The value chain
‒ Key functions
‒ Risk management
3) Financial performance
and allocation
4) The future
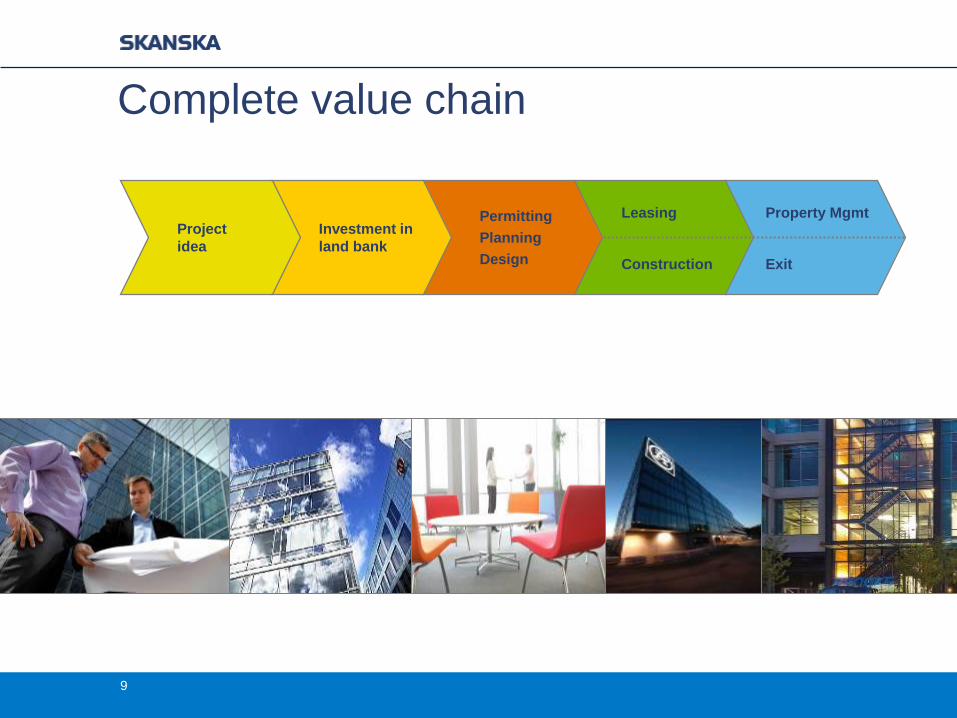
Complete value chain
9
Permitting
Planning
Design
Investment in
land bank
Project
idea
Leasing
Construction
Property Mgmt
Exit
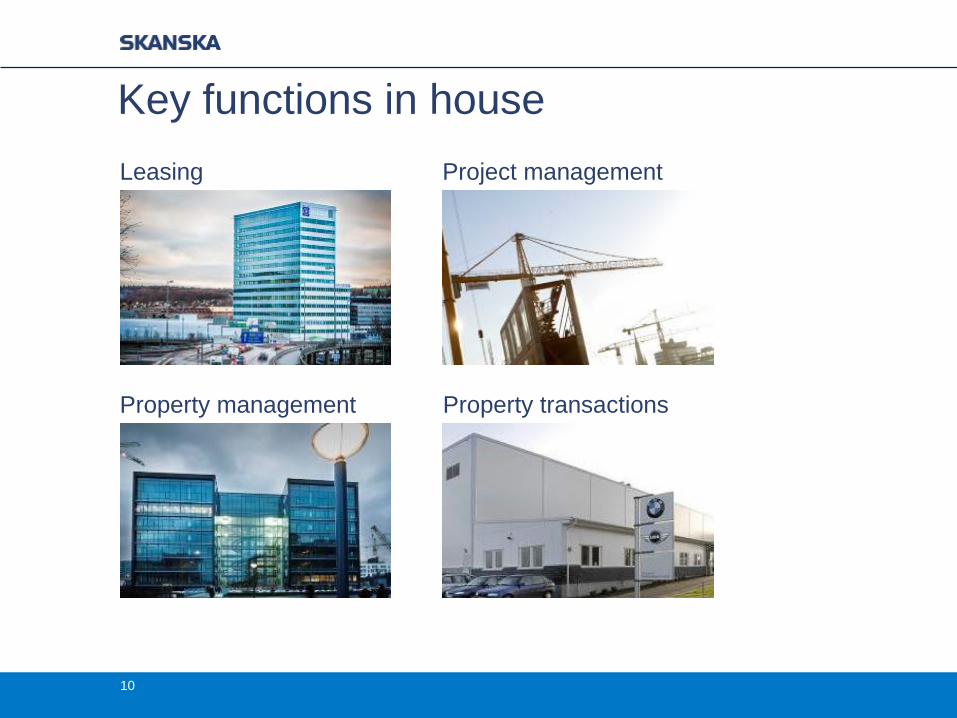
Key functions in house
10
Property management Property transactions
Leasing Project management
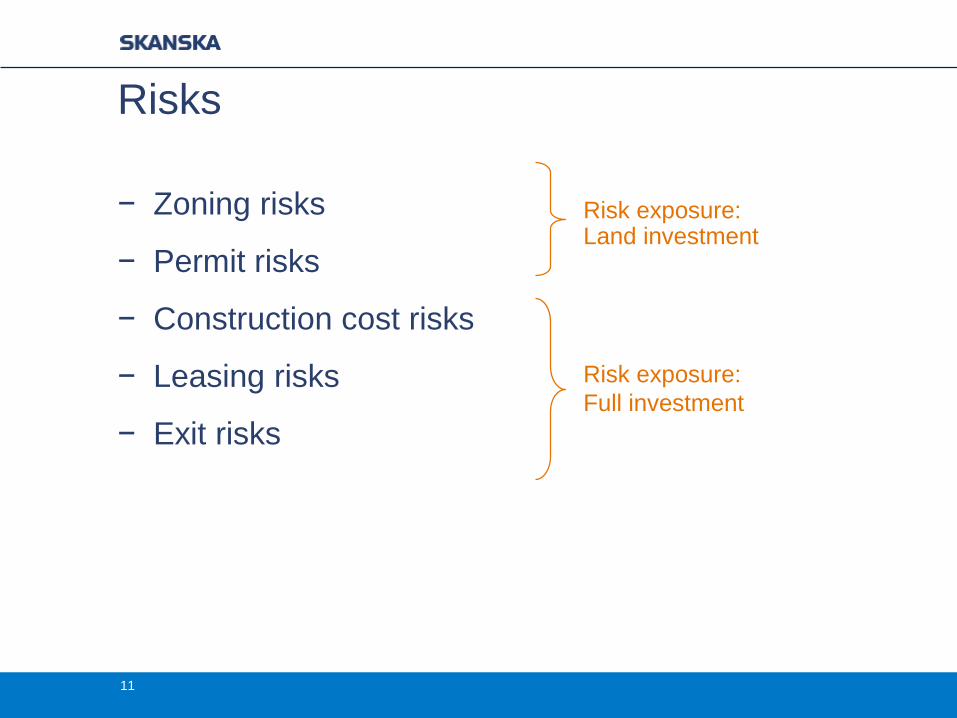
Risks
− Zoning risks
− Permit risks
− Construction cost risks
− Leasing risks
− Exit risks
Risk exposure:
Full investment
Risk exposure: Land investment
11
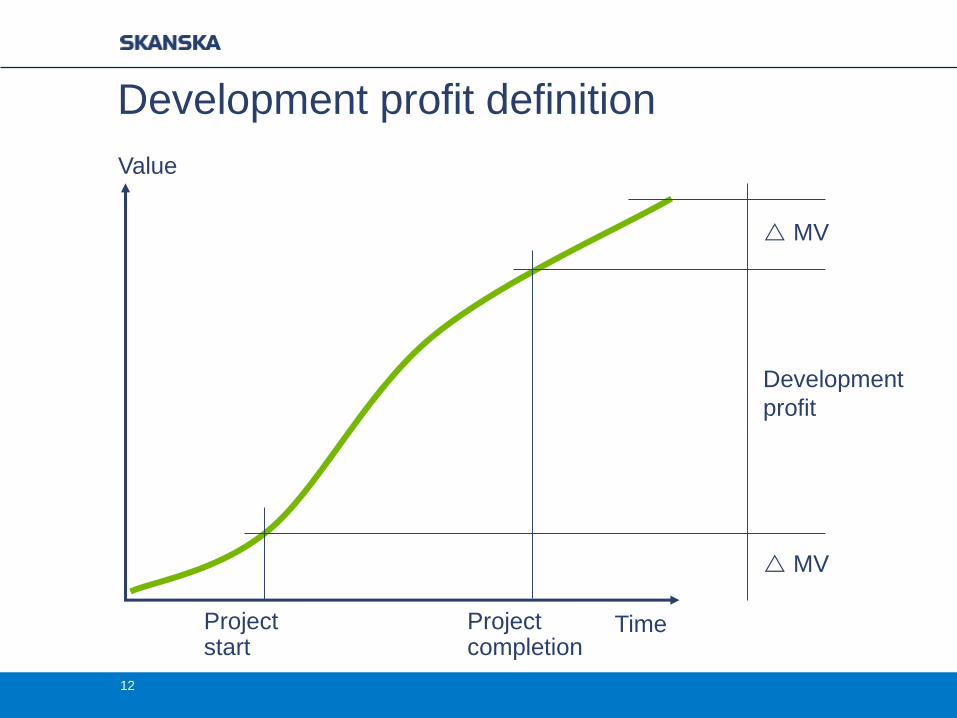
Development profit definition
MV
MV
Development
profit
Value
TimeProject start
Project completion
12
13
Agenda
1) Background/history/overview
2) Value creation
3) Financial performance
and allocation
4) The future
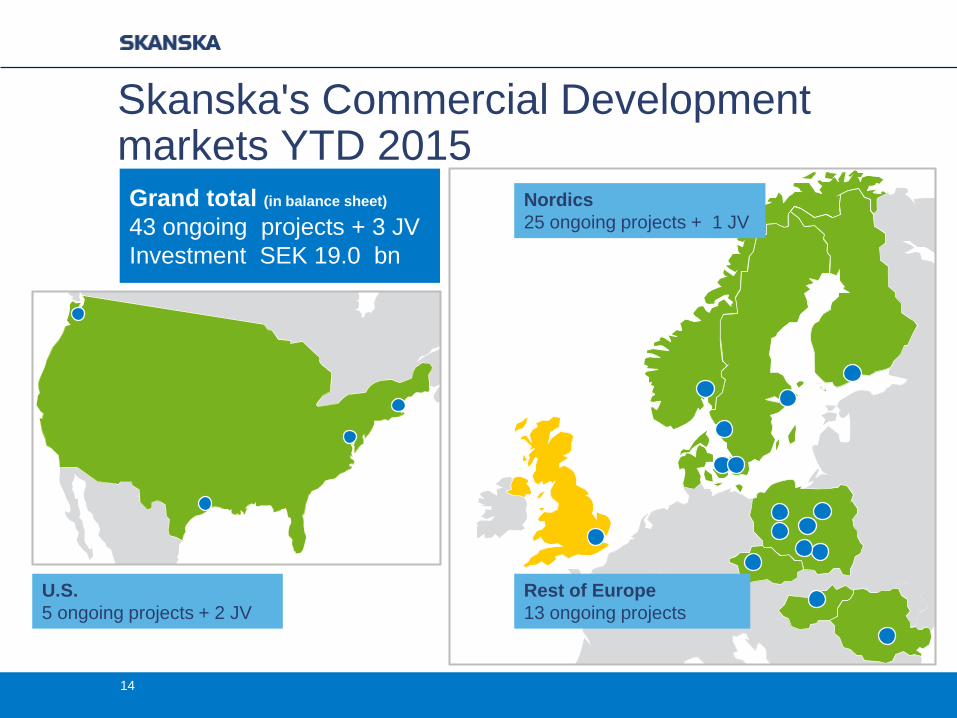
Grand total (in balance sheet)
43 ongoing projects + 3 JV
Investment SEK 19.0 bn
Skanska's Commercial Development markets YTD 2015
14
U.S.
5 ongoing projects + 2 JV
Nordics
25 ongoing projects + 1 JV
Rest of Europe
13 ongoing projects
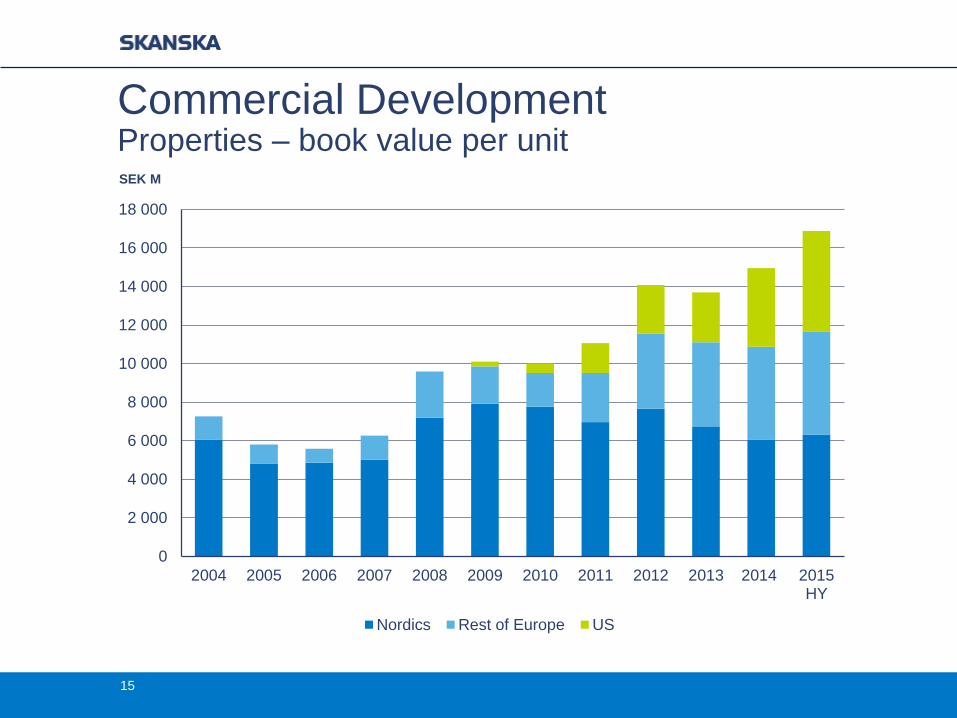
Commercial DevelopmentProperties – book value per unit
0
2 000
4 000
6 000
8 000
10 000
12 000
14 000
16 000
18 000
2004 2005 2006 2007 2008 2009 2010 2011 2012 2013 2014 2015HY
Nordics Rest of Europe US
15
SEK M
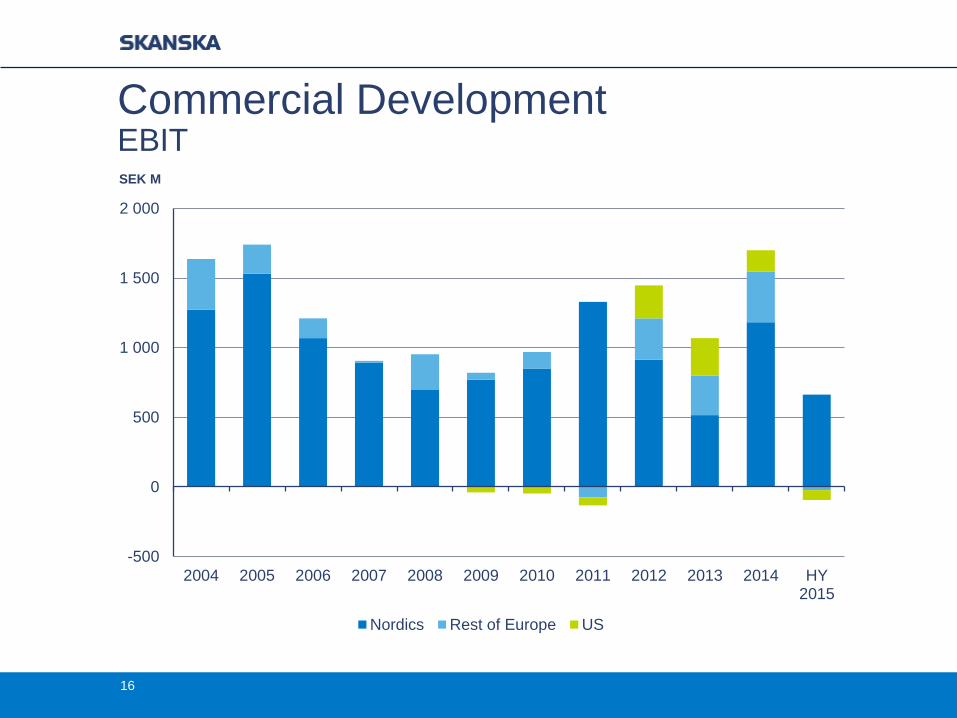
Commercial Development EBIT
-500
0
500
1 000
1 500
2 000
2004 2005 2006 2007 2008 2009 2010 2011 2012 2013 2014 HY2015
Nordics Rest of Europe US
16
SEK M
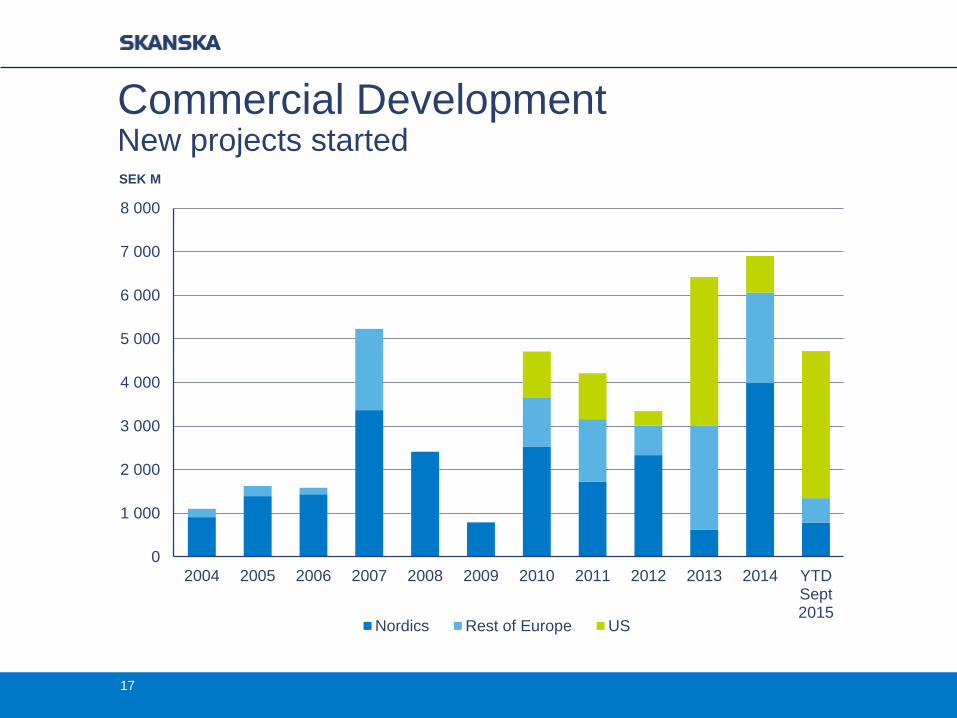
Commercial DevelopmentNew projects started
0
1 000
2 000
3 000
4 000
5 000
6 000
7 000
8 000
2004 2005 2006 2007 2008 2009 2010 2011 2012 2013 2014 YTDSept2015
Nordics Rest of Europe US
17
SEK M
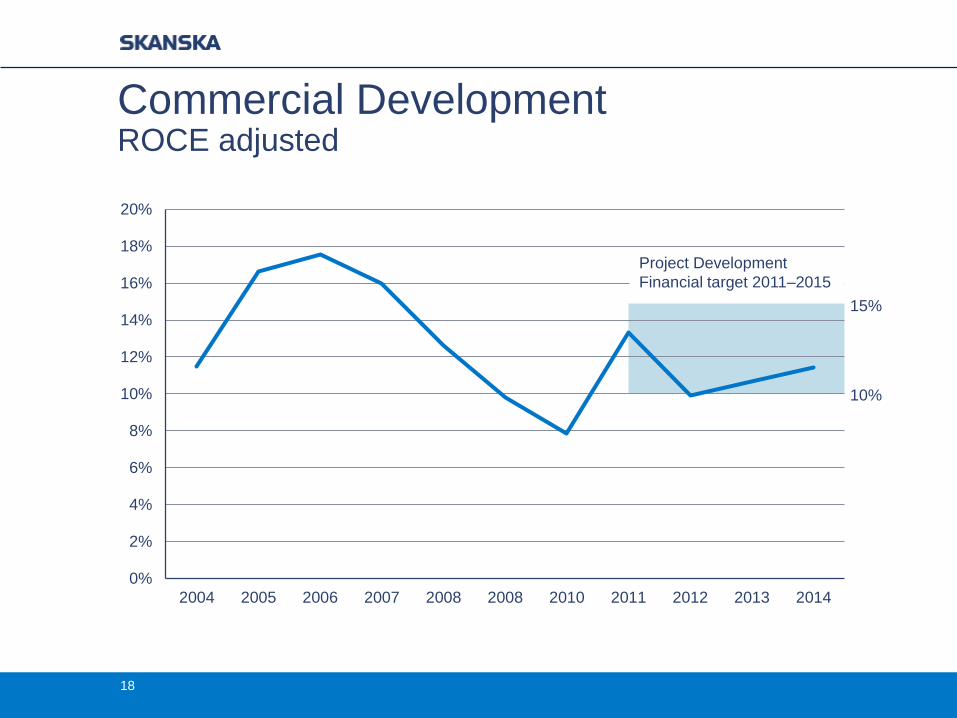
Commercial Development ROCE adjusted
0%
2%
4%
6%
8%
10%
12%
14%
16%
18%
20%
2004 2005 2006 2007 2008 2008 2010 2011 2012 2013 2014
15%
10%
18
Project Development
Financial target 2011–2015
0
50
100
150
200
250
300
350
400
Q3 Q4 Q12011
Q2 Q3 Q4 Q12012
Q2 Q3 Q4 Q12013
Q2 Q3 Q4 Q12014
Q2 Q3 Q4 Q12015
Q2
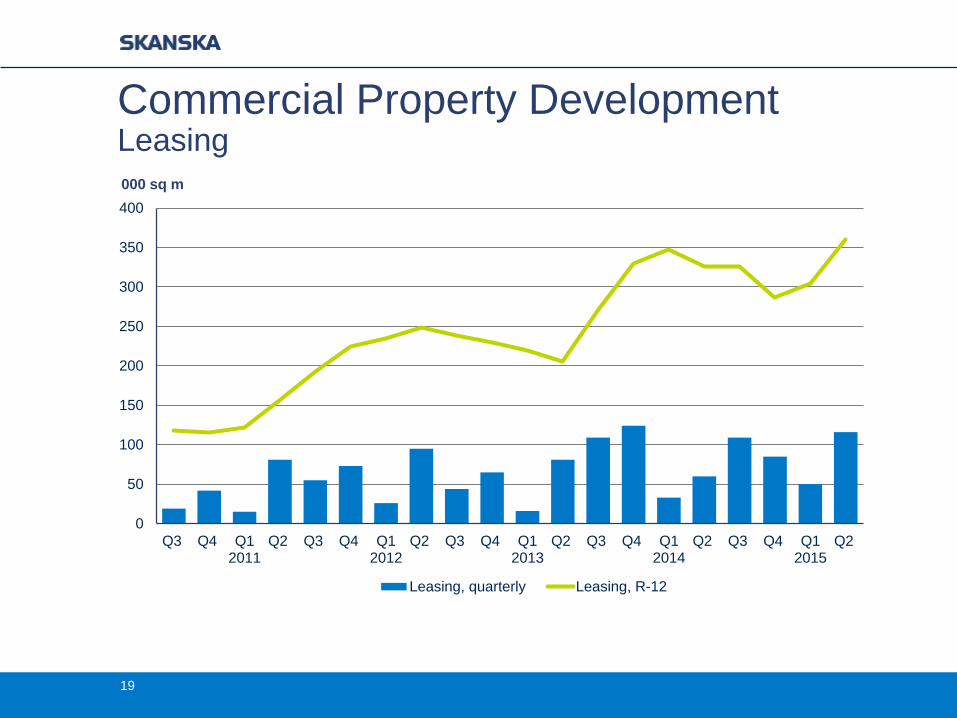
Leasing, quarterly Leasing, R-12
000 sq m
Commercial Property Development Leasing
19
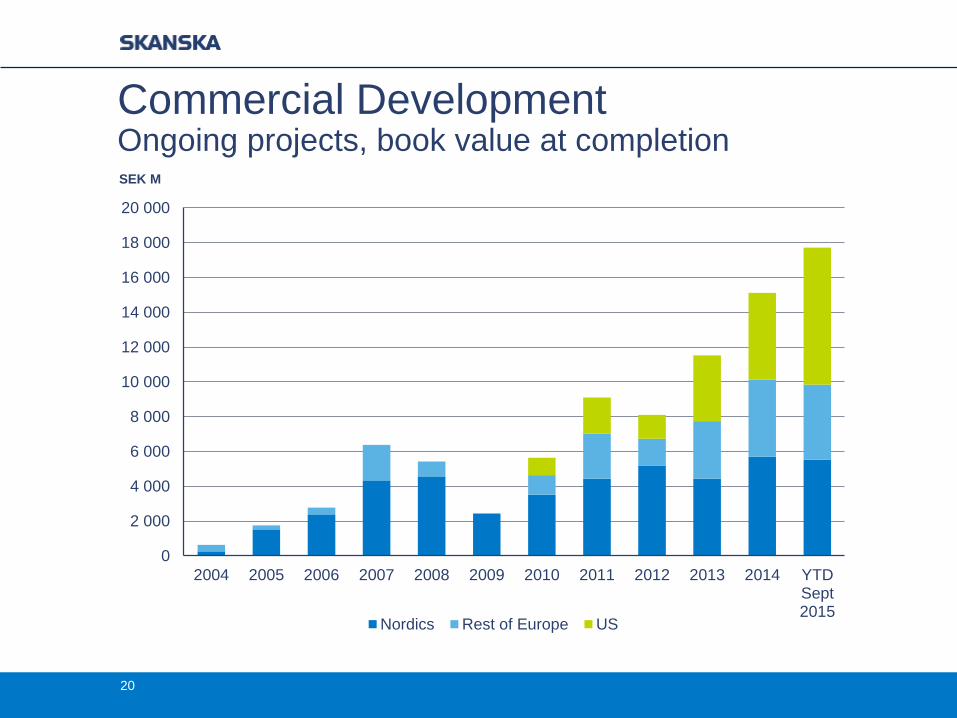
Commercial DevelopmentOngoing projects, book value at completion
0
2 000
4 000
6 000
8 000
10 000
12 000
14 000
16 000
18 000
20 000
2004 2005 2006 2007 2008 2009 2010 2011 2012 2013 2014 YTDSept2015
Nordics Rest of Europe US
20
SEK M
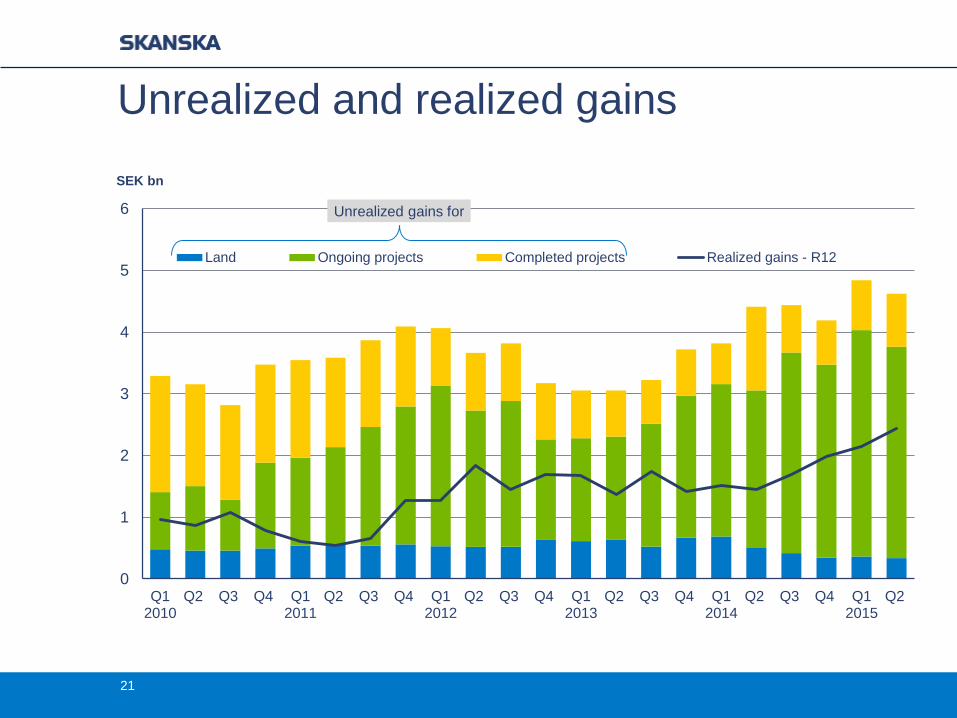
Unrealized and realized gains
21
0
1
2
3
4
5
6
Q12010
Q2 Q3 Q4 Q12011
Q2 Q3 Q4 Q12012
Q2 Q3 Q4 Q12013
Q2 Q3 Q4 Q12014
Q2 Q3 Q4 Q12015
Q2
Land Ongoing projects Completed projects Realized gains - R12
SEK bn
Unrealized gains for

Timing is crucial
22
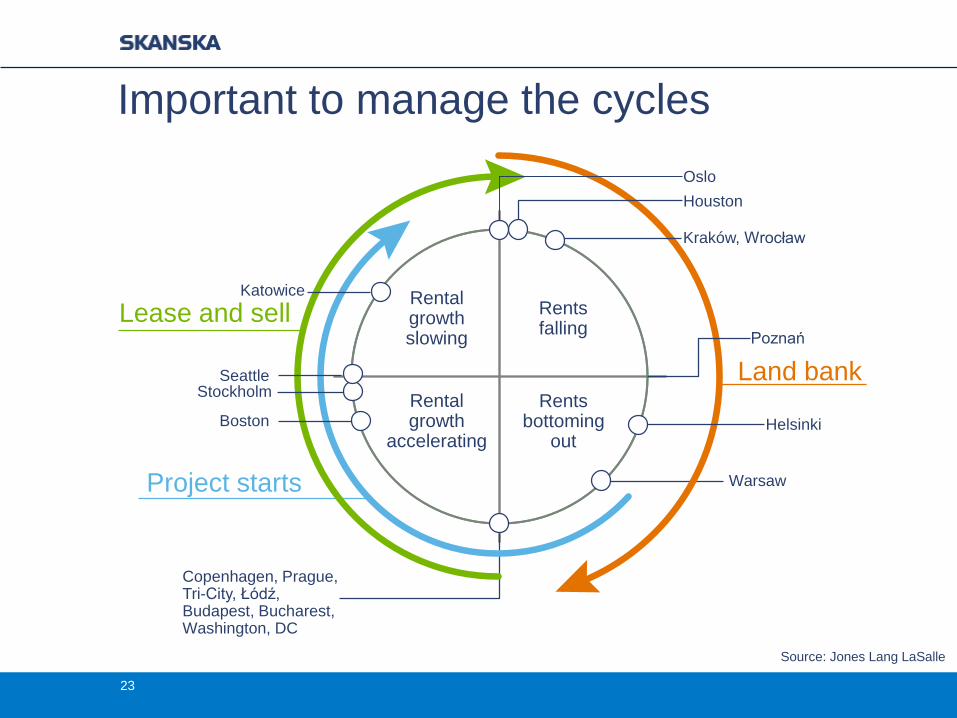
Important to manage the cycles
Rentsfalling
Rental growth slowing
Rentsbottoming
out
Rentalgrowth
accelerating
Source: Jones Lang LaSalle
Katowice
Warsaw
Copenhagen, Prague, Tri-City, Łódź, Budapest, Bucharest, Washington, DC
Project starts
Lease and sell
Land bank
Helsinki
Seattle
Boston
Houston
Stockholm
Kraków, Wrocław
Poznań
Oslo
23
Occu
pa
ncy r
ate
, %
Completion rate, %
0%
20%
40%
60%
80%
100%
0% 20% 40% 60% 80% 100%
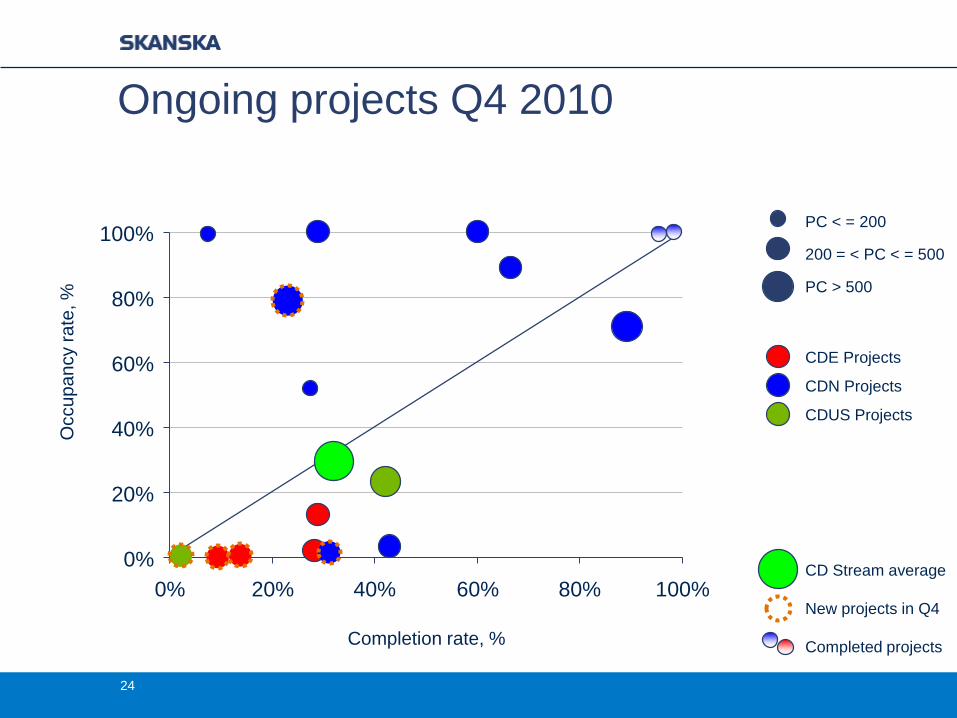
PC < = 200
200 = < PC < = 500
PC > 500
CDE Projects
CDN Projects
CDUS Projects
Ongoing projects Q4 2010
CD Stream average
New projects in Q4
Completed projects
24
Occu
pa
ncy r
ate
, %
Completion rate, %
0%
20%
40%
60%
80%
100%
0% 20% 40% 60% 80% 100%
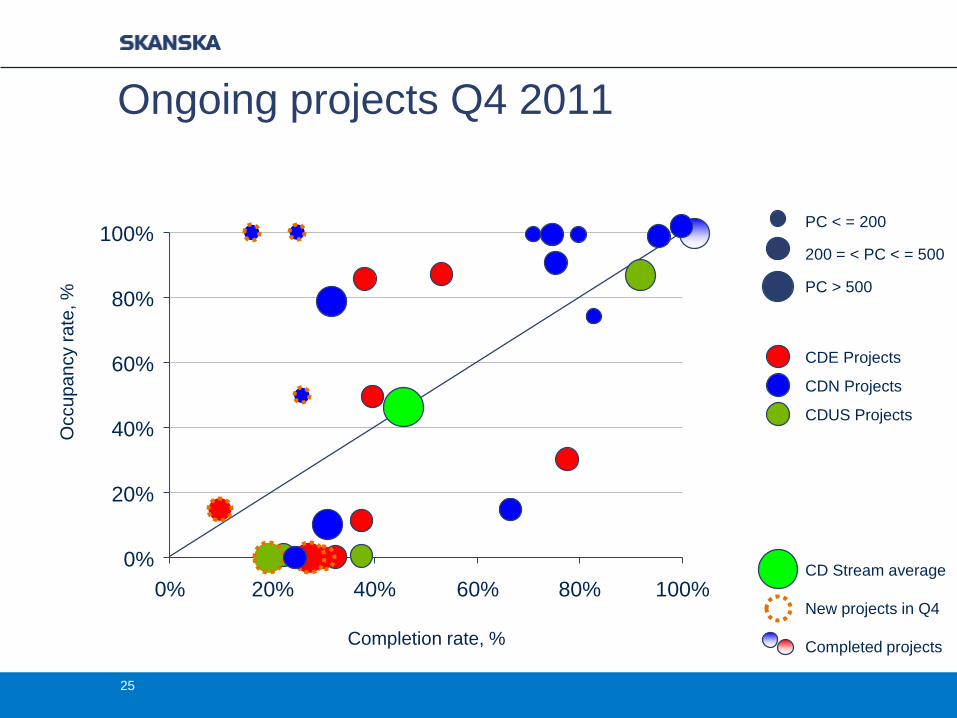
PC < = 200
200 = < PC < = 500
PC > 500
CDE Projects
CDN Projects
CDUS Projects
Ongoing projects Q4 2011
CD Stream average
New projects in Q4
Completed projects
25
Occu
pa
ncy r
ate
, %
Completion rate, %
0%
20%
40%
60%
80%
100%
0% 20% 40% 60% 80% 100%
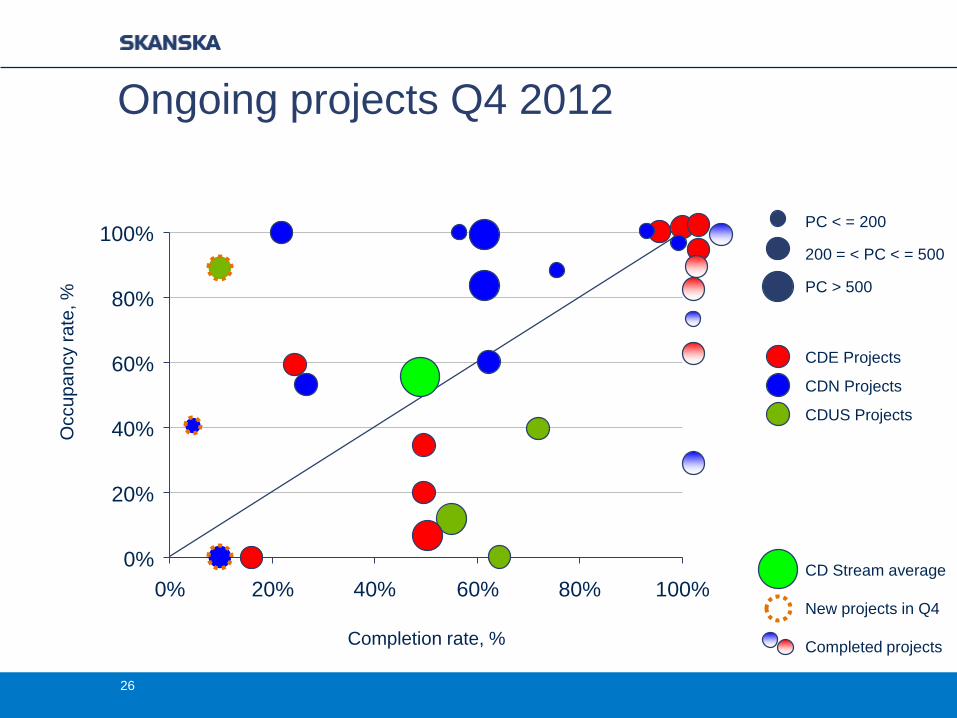
PC < = 200
200 = < PC < = 500
PC > 500
CDE Projects
CDN Projects
CDUS Projects
Ongoing projects Q4 2012
CD Stream average
New projects in Q4
Completed projects
26
Occu
pa
ncy r
ate
, %
Completion rate, %
0%
20%
40%
60%
80%
100%
0% 20% 40% 60% 80% 100%
PC < = 200
200 = < PC < = 500
PC > 500
CDE Projects
CDN Projects
CDUS Projects
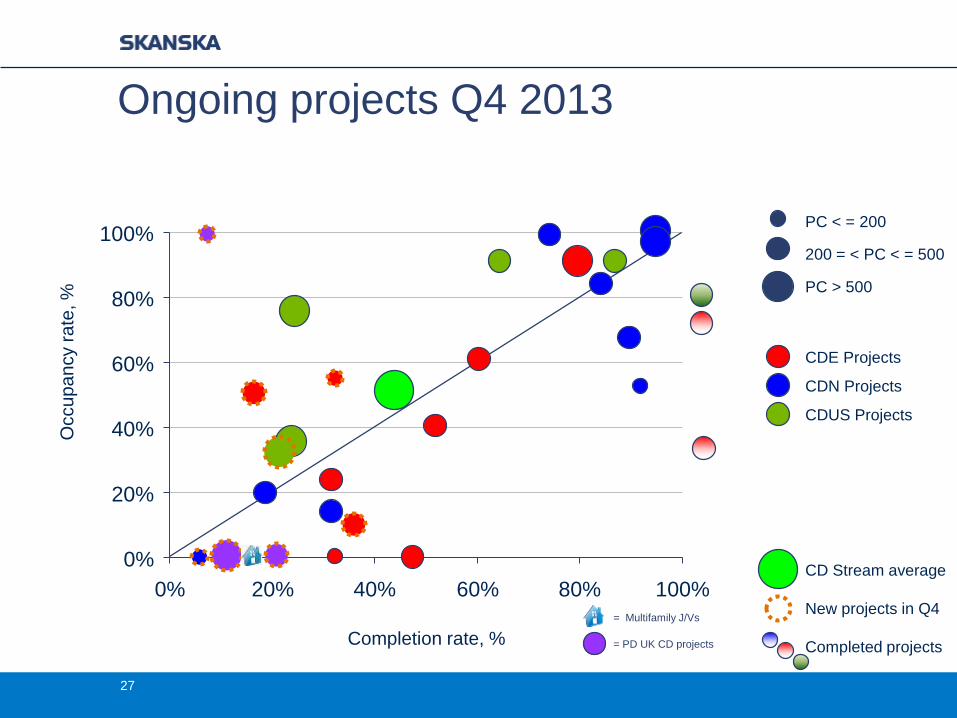
Ongoing projects Q4 2013
= Multifamily J/Vs
= PD UK CD projects
CD Stream average
New projects in Q4
Completed projects
27
Occu
pa
ncy r
ate
, %
Completion rate, %
0%
20%
40%
60%
80%
100%
0% 20% 40% 60% 80% 100%
PC < = 200
200 = < PC < = 500
PC > 500
CDE Projects
CDN Projects
CDUS Projects
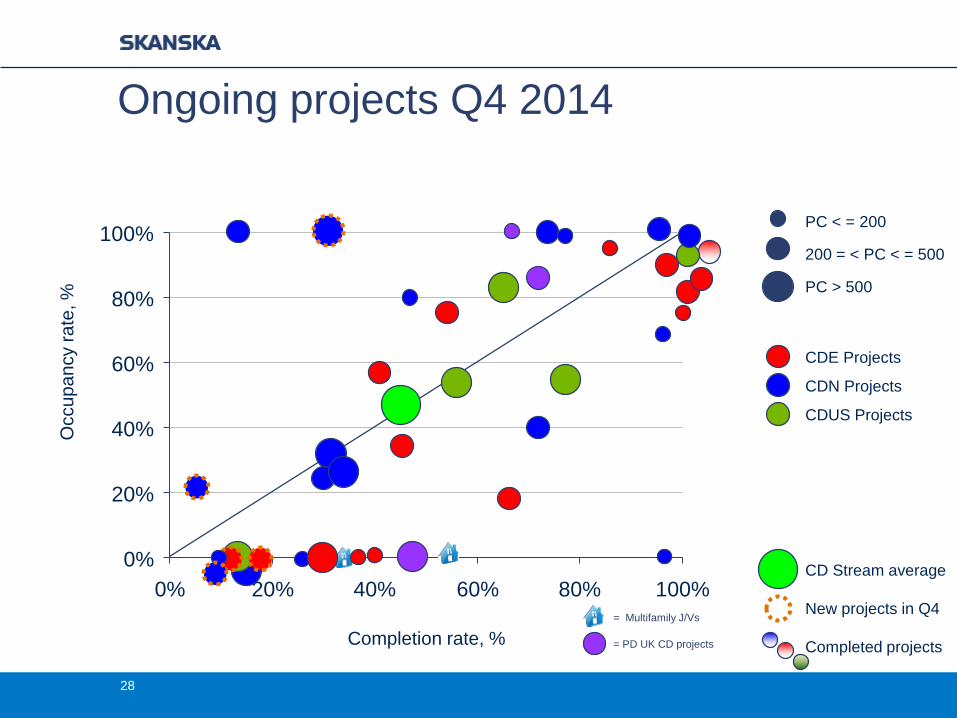
Ongoing projects Q4 2014
= PD UK CD projects
= Multifamily J/Vs
CD Stream average
New projects in Q4
Completed projects
28
Occu
pa
ncy r
ate
, %
Completion rate, %
0%
20%
40%
60%
80%
100%
0% 20% 40% 60% 80% 100%
PC < = 200
200 = < PC < = 500
PC > 500
CDE Projects
CDN Projects
CDUS Projects
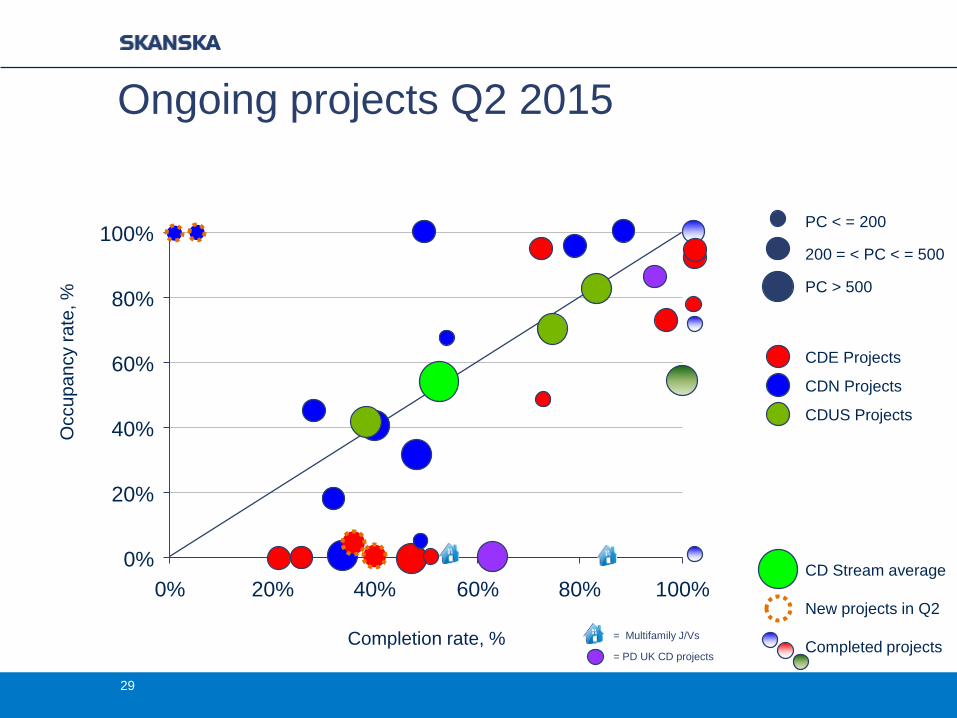
Ongoing projects Q2 2015
= Multifamily J/Vs
= PD UK CD projects
CD Stream average
New projects in Q2
Completed projects
29
30
Agenda
1) Background/history/overview
2) Value creation
3) Financial performance
and allocation
4) The future
The future for Commercial Development
− Transfer/rotation and development
of key people
− Keep proven business model
− Evaluate new markets
− Land bank focus to backfill pipeline
− Market orientation
− Key client management
− Cost efficiency
− Manage the cycles
31

Commercial DevelopmentNordic
Jan Odelstam
Business Unit President
Stockholm New, Sweden
32
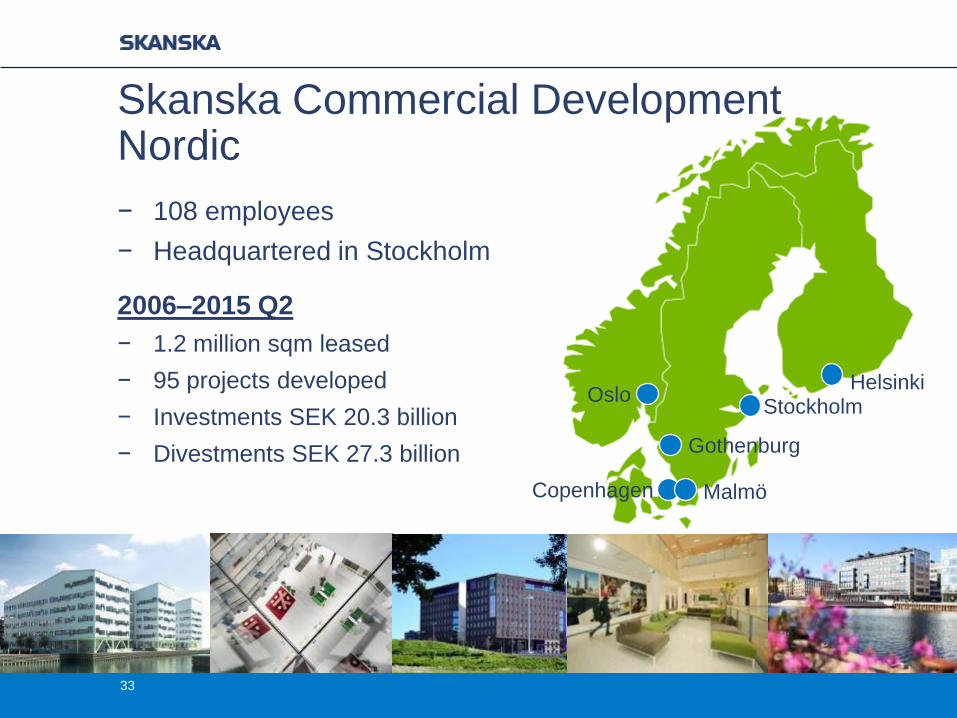
Skanska Commercial Development Nordic
33
− 108 employees
− Headquartered in Stockholm
2006–2015 Q2
− 1.2 million sqm leased
− 95 projects developed
− Investments SEK 20.3 billion
− Divestments SEK 27.3 billion
HelsinkiStockholm
MalmöCopenhagen
Gothenburg
Oslo
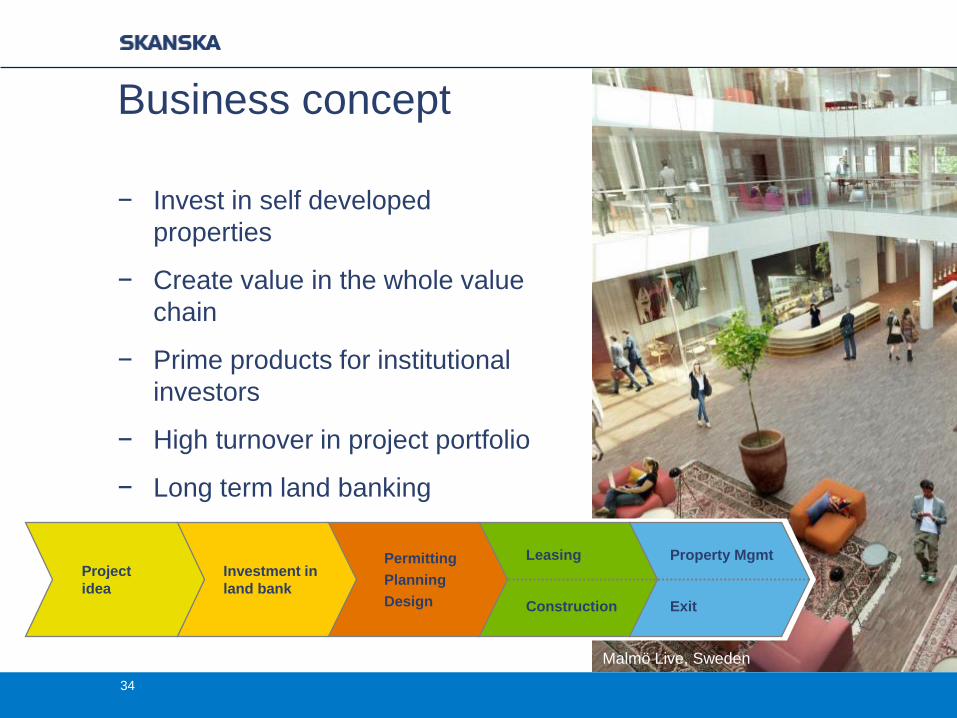
Business concept
− Invest in self developed
properties
− Create value in the whole value
chain
− Prime products for institutional
investors
− High turnover in project portfolio
− Long term land banking
34
Malmö Live, Sweden
Permitting
Planning
Design
Investment in
land bank
Project
idea
Leasing
Construction
Property Mgmt
Exit
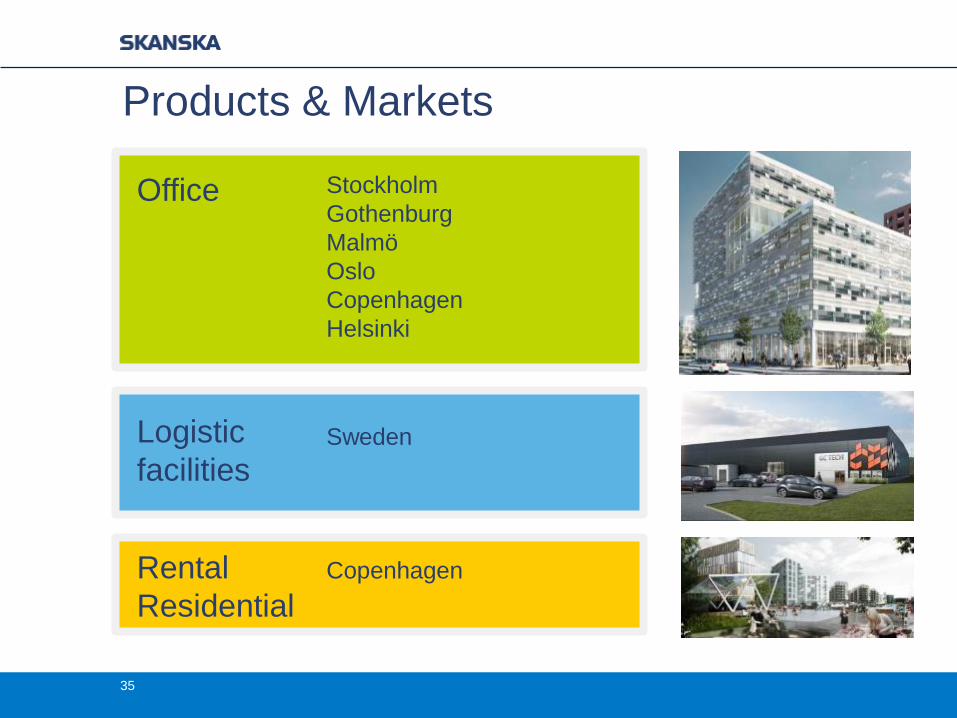
Products & Markets
35
Office Stockholm
Gothenburg
Malmö
Oslo
Copenhagen
Helsinki
Logistic
facilitiesSweden
Rental
Residential
Copenhagen
36
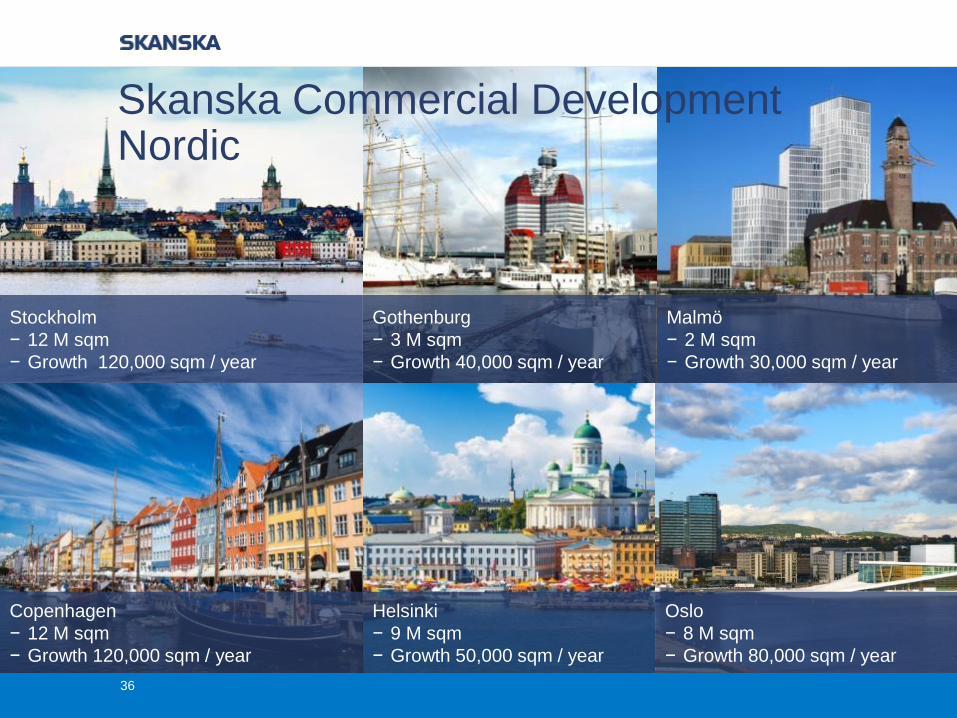
Stockholm
− 12 M sqm
− Growth 120,000 sqm / year
Gothenburg
− 3 M sqm
− Growth 40,000 sqm / year
Oslo
− 8 M sqm
− Growth 80,000 sqm / year
Helsinki
− 9 M sqm
− Growth 50,000 sqm / year
Copenhagen
− 12 M sqm
− Growth 120,000 sqm / year
Skanska Commercial DevelopmentNordic
Malmö
− 2 M sqm
− Growth 30,000 sqm / year
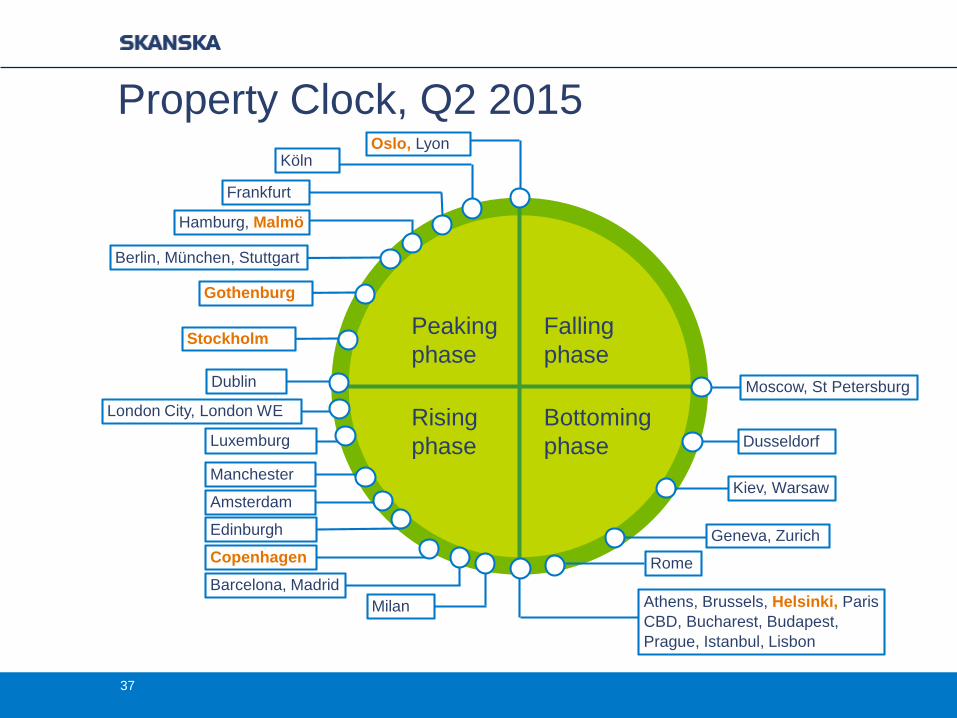
Property Clock, Q2 2015
37
Peaking
phase
Falling
phase
Rising
phase
Bottoming
phase
Edinburgh
Copenhagen
Milan Athens, Brussels, Helsinki, Paris
CBD, Bucharest, Budapest,
Prague, Istanbul, Lisbon
Frankfurt
Oslo, Lyon
Hamburg, Malmö
Berlin, München, Stuttgart
Stockholm
Dublin
Manchester
Amsterdam
Barcelona, Madrid
Geneva, Zurich
Kiev, Warsaw
Dusseldorf
Moscow, St Petersburg
Rome
Luxemburg
London City, London WE
Gothenburg
Köln
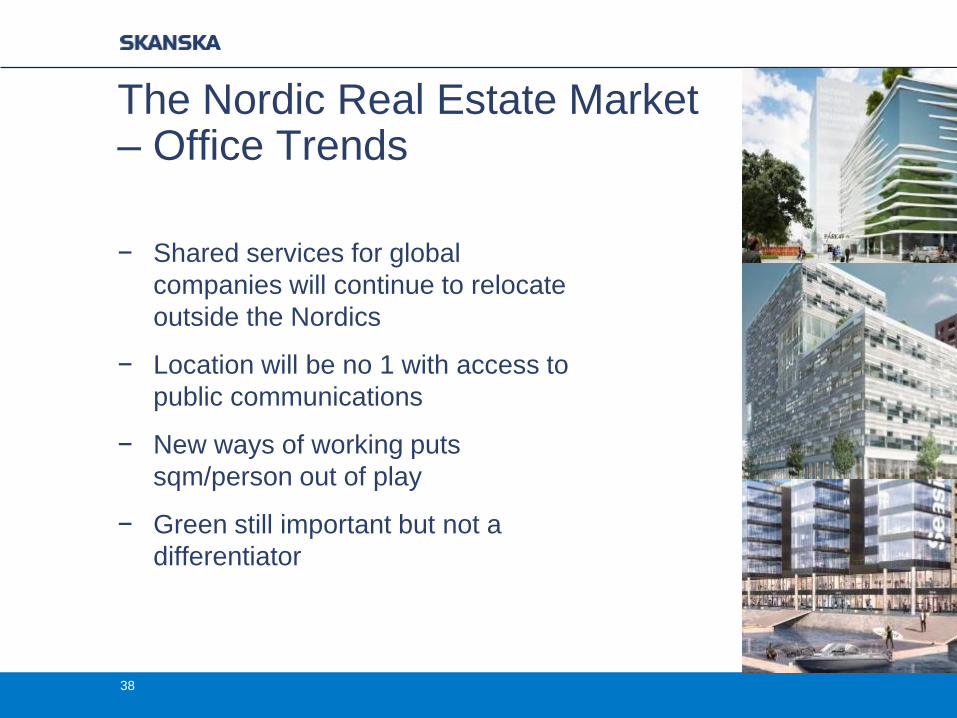
The Nordic Real Estate Market– Office Trends
38
− Shared services for global
companies will continue to relocate
outside the Nordics
− Location will be no 1 with access to
public communications
− New ways of working puts
sqm/person out of play
− Green still important but not a
differentiator
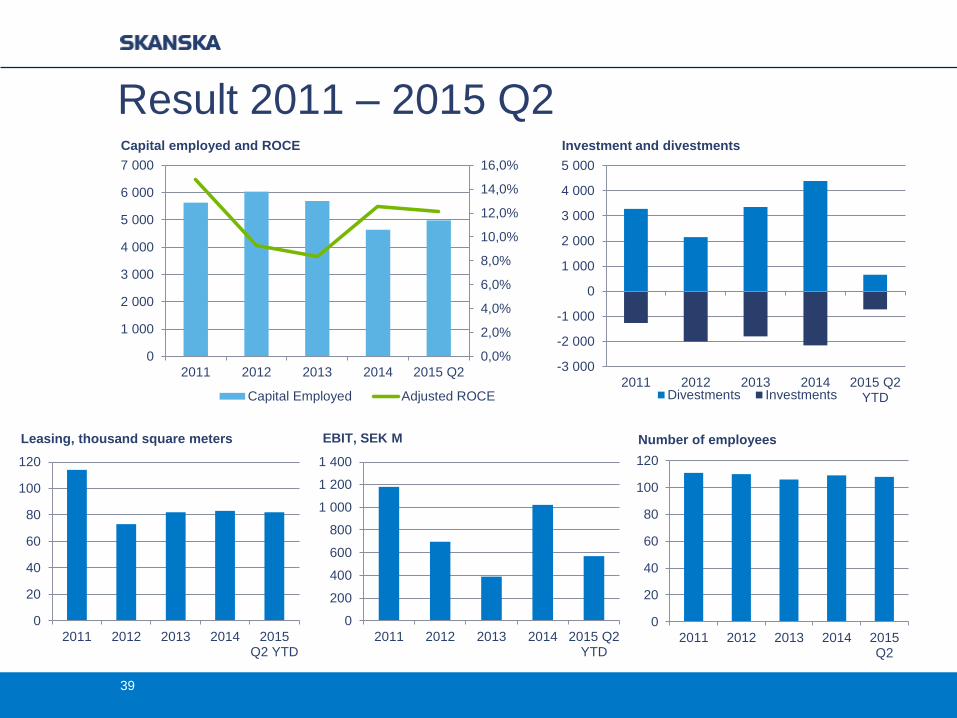
Result 2011 – 2015 Q2
39
-3 000
-2 000
-1 000
0
1 000
2 000
3 000
4 000
5 000
2011 2012 2013 2014 2015 Q2YTDDivestments Investments
0
20
40
60
80
100
120
2011 2012 2013 2014 2015Q2
Number of employees
0
20
40
60
80
100
120
2011 2012 2013 2014 2015Q2 YTD
Leasing, thousand square meters
0
200
400
600
800
1 000
1 200
1 400
2011 2012 2013 2014 2015 Q2YTD
EBIT, SEK M
0,0%
2,0%
4,0%
6,0%
8,0%
10,0%
12,0%
14,0%
16,0%
0
1 000
2 000
3 000
4 000
5 000
6 000
7 000
2011 2012 2013 2014 2015 Q2
Capital employed and ROCE
Capital Employed Adjusted ROCE
Investment and divestments
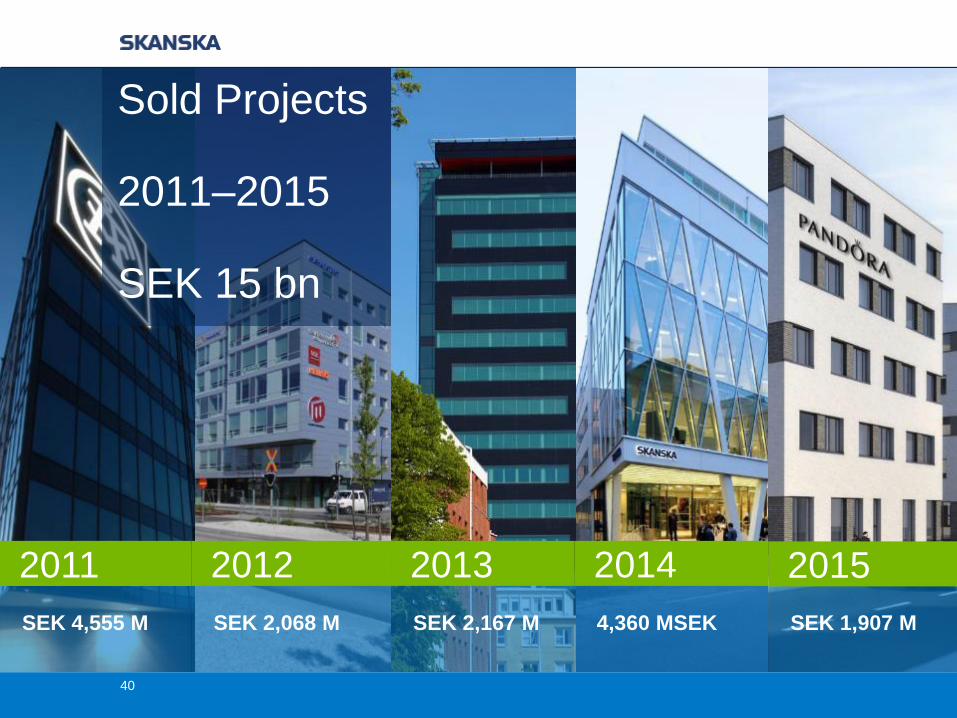
SEK 2,068 M
2012
SEK 4,555 M
2011
SEK 2,167 M
2013
4,360 MSEK
2014
Sold Projects
2011–2015
SEK 15 bn
40
SEK 1,907 M
2015
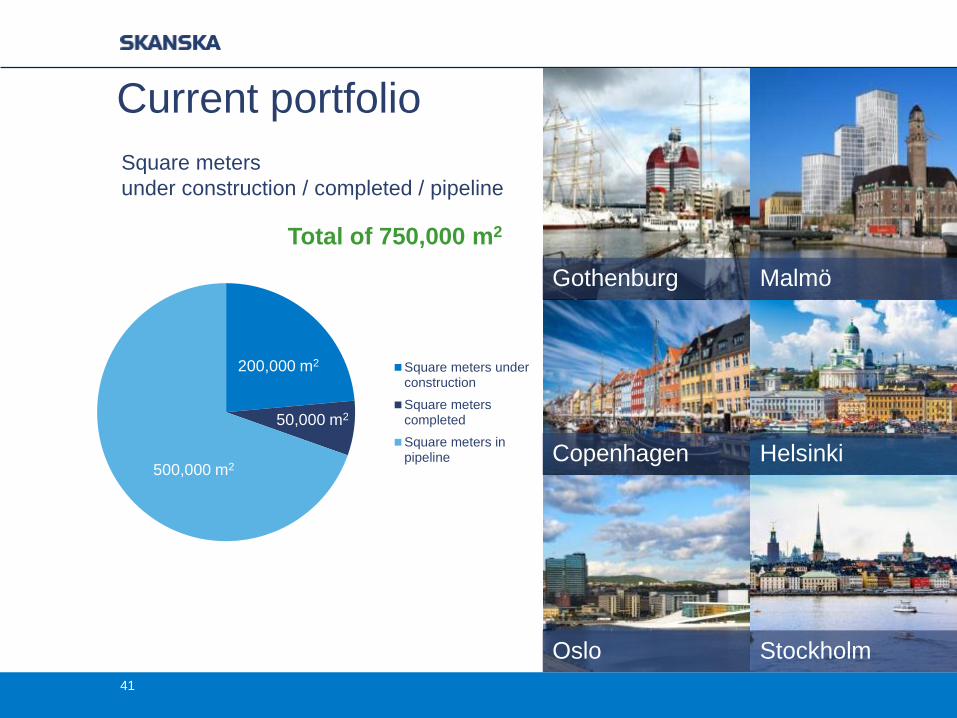
Current portfolio
41
Square meters
under construction / completed / pipeline
Total of 750,000 m2
Copenhagen Helsinki
Oslo Stockholm
MalmöGothenburg
Square meters underconstruction
Square meterscompleted
Square meters inpipeline
500,000 m2
200,000 m2
50,000 m2
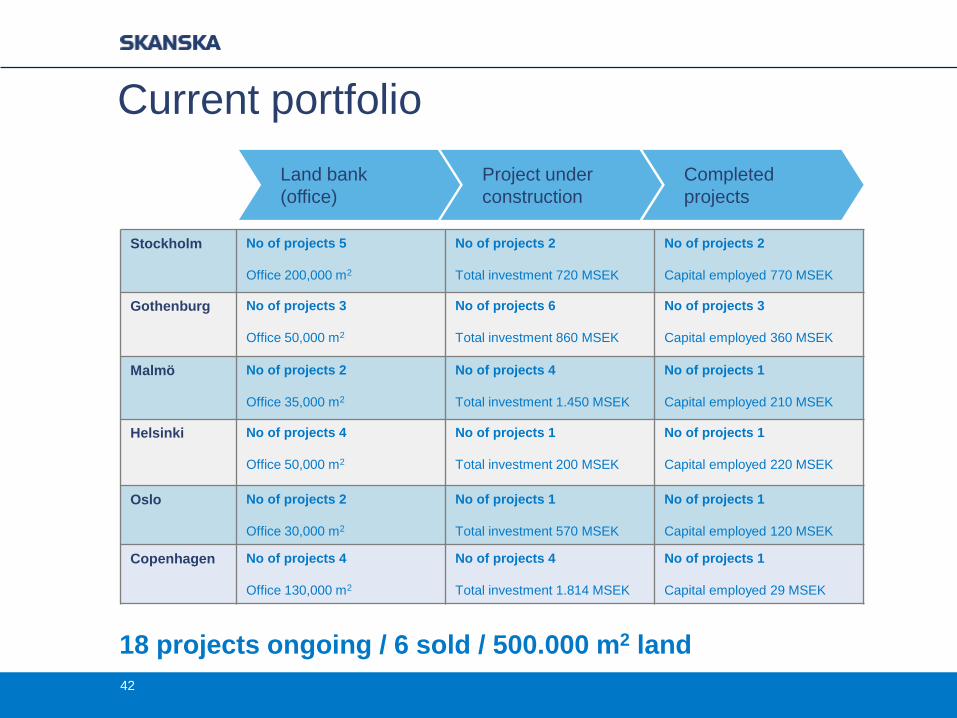
Current portfolio
42
Stockholm No of projects 5
Office 200,000 m2
No of projects 2
Total investment 720 MSEK
No of projects 2
Capital employed 770 MSEK
Gothenburg No of projects 3
Office 50,000 m2
No of projects 6
Total investment 860 MSEK
No of projects 3
Capital employed 360 MSEK
Malmö No of projects 2
Office 35,000 m2
No of projects 4
Total investment 1.450 MSEK
No of projects 1
Capital employed 210 MSEK
Helsinki No of projects 4
Office 50,000 m2
No of projects 1
Total investment 200 MSEK
No of projects 1
Capital employed 220 MSEK
Oslo No of projects 2
Office 30,000 m2
No of projects 1
Total investment 570 MSEK
No of projects 1
Capital employed 120 MSEK
Copenhagen No of projects 4
Office 130,000 m2
No of projects 4
Total investment 1.814 MSEK
No of projects 1
Capital employed 29 MSEK
Land bank
(office)
Project under
construction
Completed
projects
18 projects ongoing / 6 sold / 500.000 m2 land
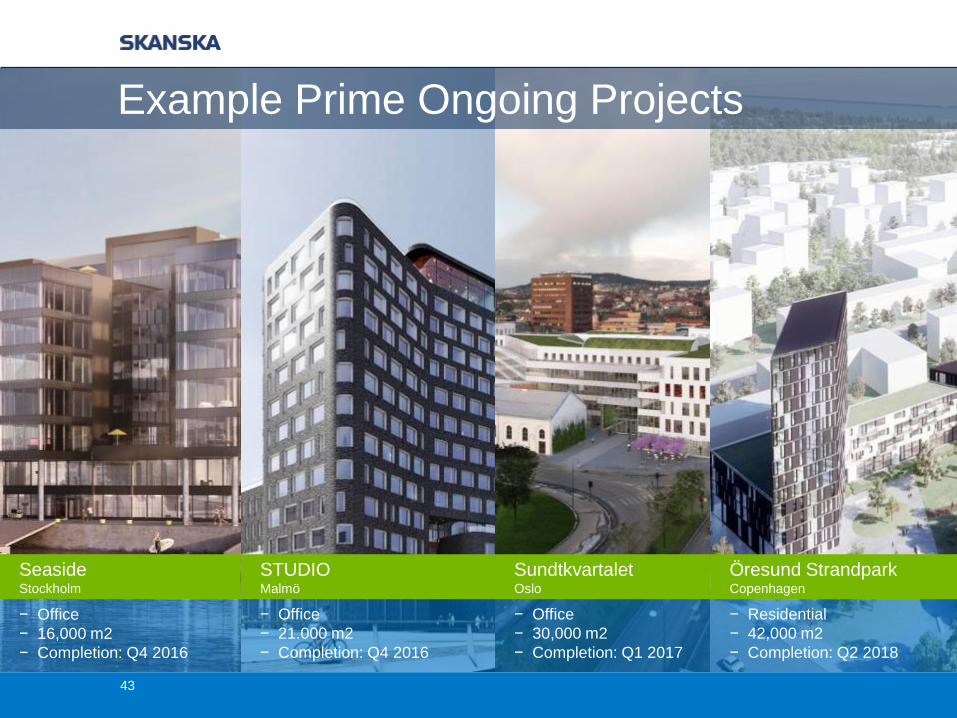
− Office
− 21.000 m2
− Completion: Q4 2016
− Office
− 30,000 m2
− Completion: Q1 2017
− Residential
− 42,000 m2
− Completion: Q2 2018
− Office
− 16,000 m2
− Completion: Q4 2016
Example Prime Ongoing Projects
43
STUDIOMalmö
SeasideStockholm
SundtkvartaletOslo
Öresund StrandparkCopenhagen
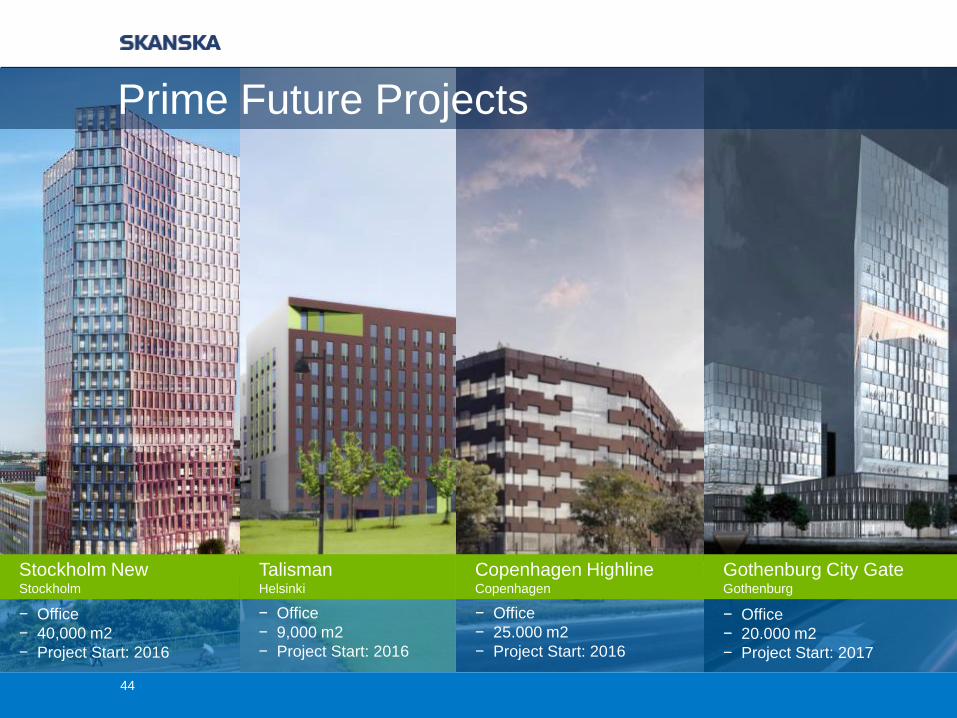
− Office
− 9,000 m2
− Project Start: 2016
− Office
− 20.000 m2
− Project Start: 2017
− Office
− 40,000 m2
− Project Start: 2016
44
− Office
− 25.000 m2
− Project Start: 2016
TalismanHelsinki
Gothenburg City GateGothenburg
Stockholm NewStockholm
Copenhagen HighlineCopenhagen
Prime Future Projects
45
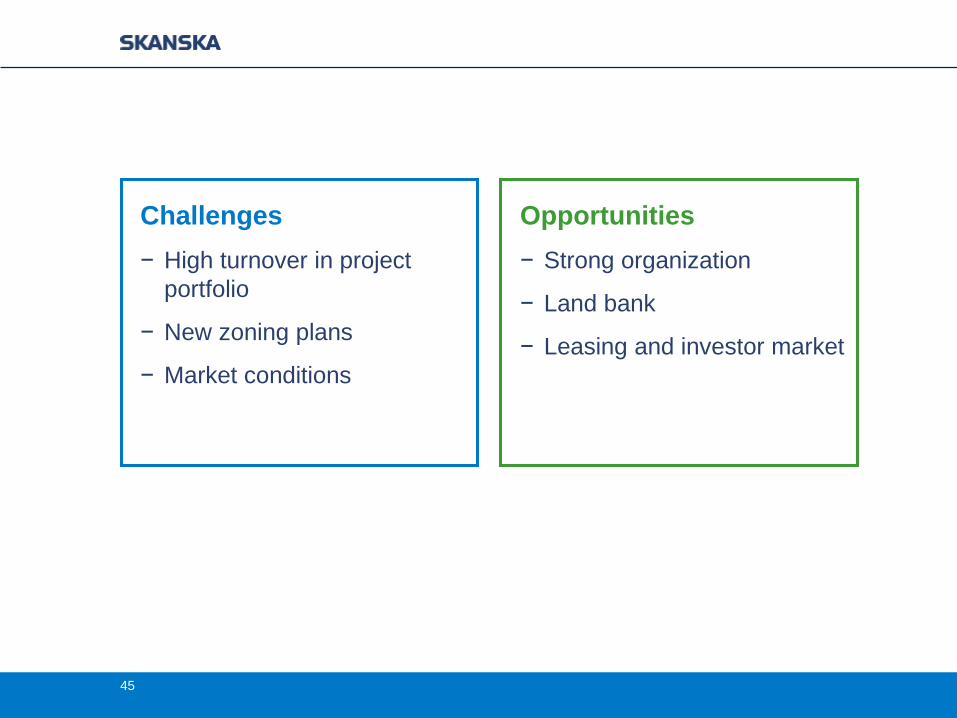
Challenges
− High turnover in project
portfolio
− New zoning plans
− Market conditions
Opportunities
− Strong organization
− Land bank
− Leasing and investor market
46
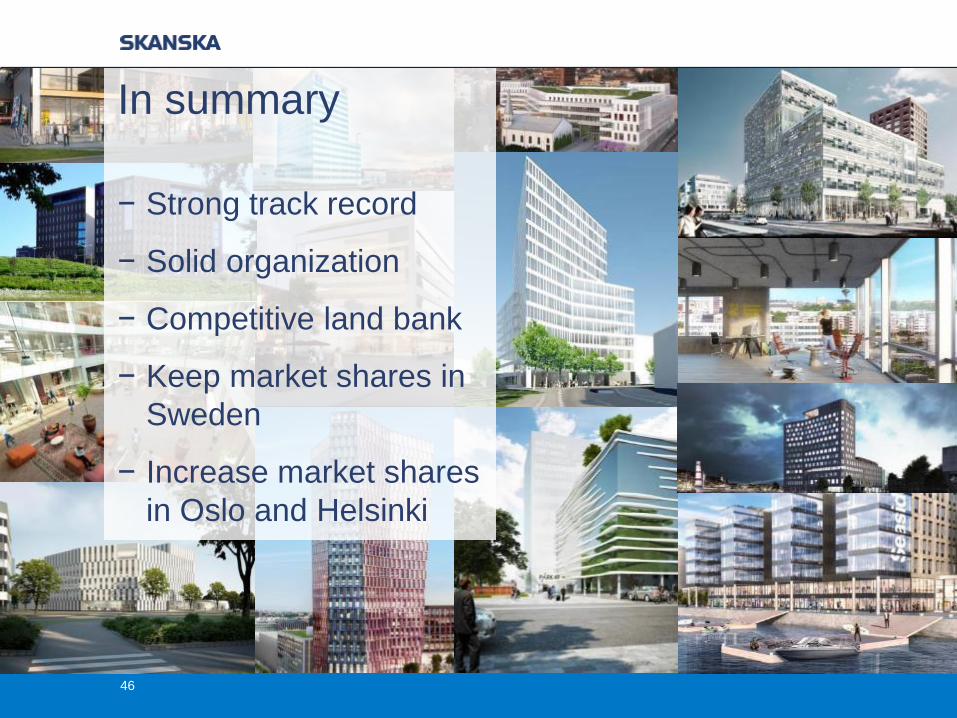
In summary
− Strong track record
− Solid organization
− Competitive land bank
− Keep market shares in
Sweden
− Increase market shares
in Oslo and Helsinki
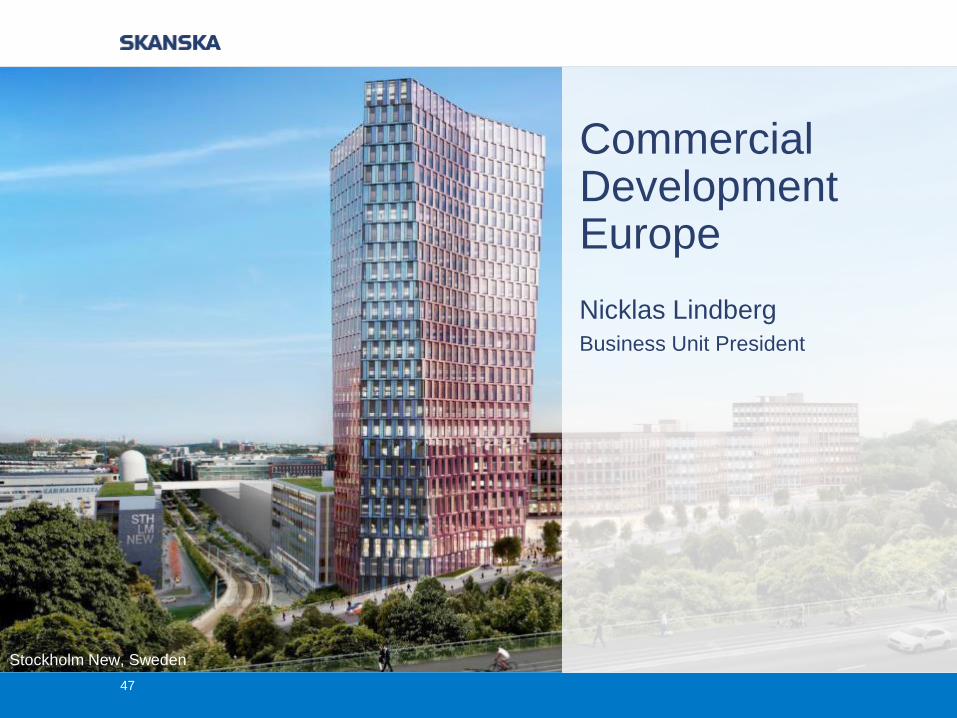
Stockholm New, Sweden
Commercial Development Europe
Nicklas Lindberg
Business Unit President
47
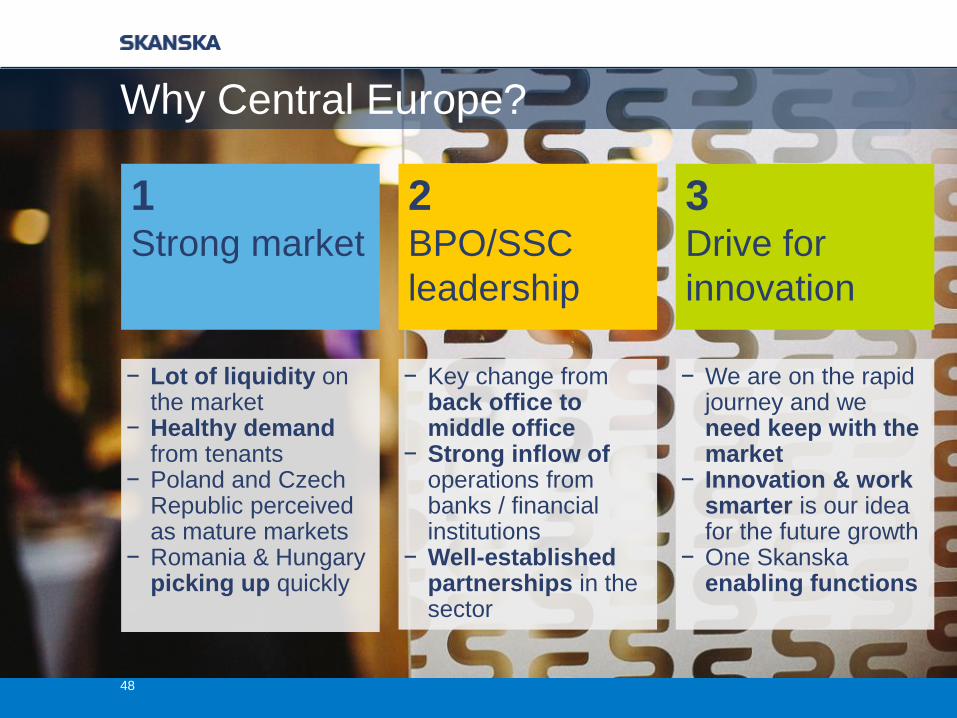
1Strong market
2BPO/SSC
leadership
3Drive for
innovation
− Lot of liquidity on the market
− Healthy demand from tenants
− Poland and Czech Republic perceived as mature markets
− Romania & Hungary picking up quickly
− Key change from back office to middle office
− Strong inflow of operations from banks / financial institutions
− Well-established partnerships in the sector
− We are on the rapid journey and we need keep with the market
− Innovation & work smarter is our idea for the future growth
− One Skanska enabling functions
Why Central Europe?
48
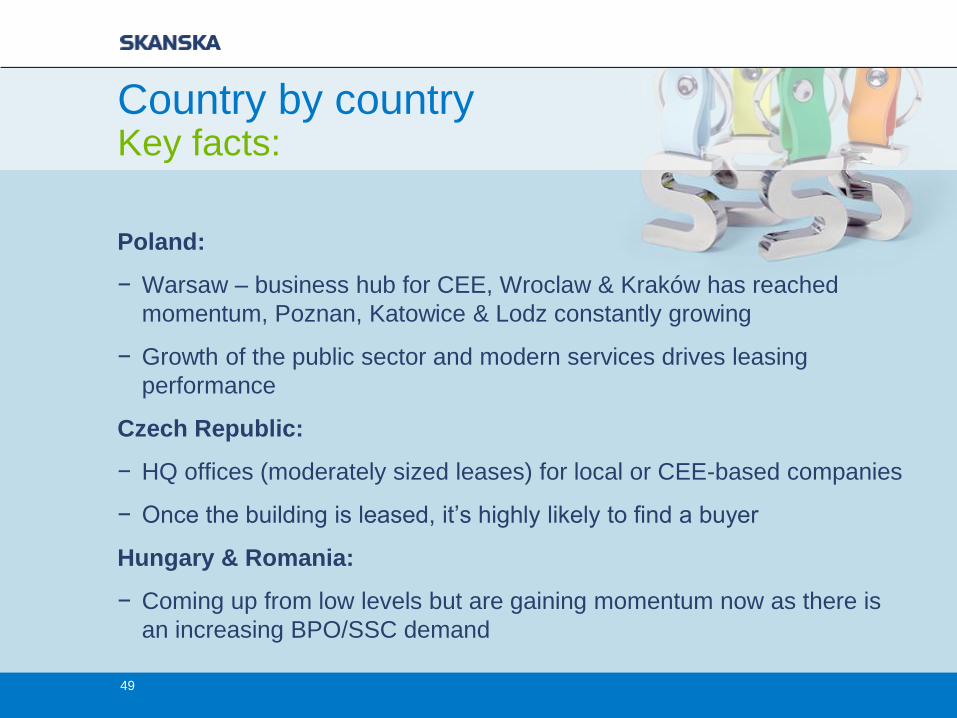
Country by countryKey facts:
Poland:
− Warsaw – business hub for CEE, Wroclaw & Kraków has reached
momentum, Poznan, Katowice & Lodz constantly growing
− Growth of the public sector and modern services drives leasing
performance
Czech Republic:
− HQ offices (moderately sized leases) for local or CEE-based companies
− Once the building is leased, it’s highly likely to find a buyer
Hungary & Romania:
− Coming up from low levels but are gaining momentum now as there is
an increasing BPO/SSC demand
49
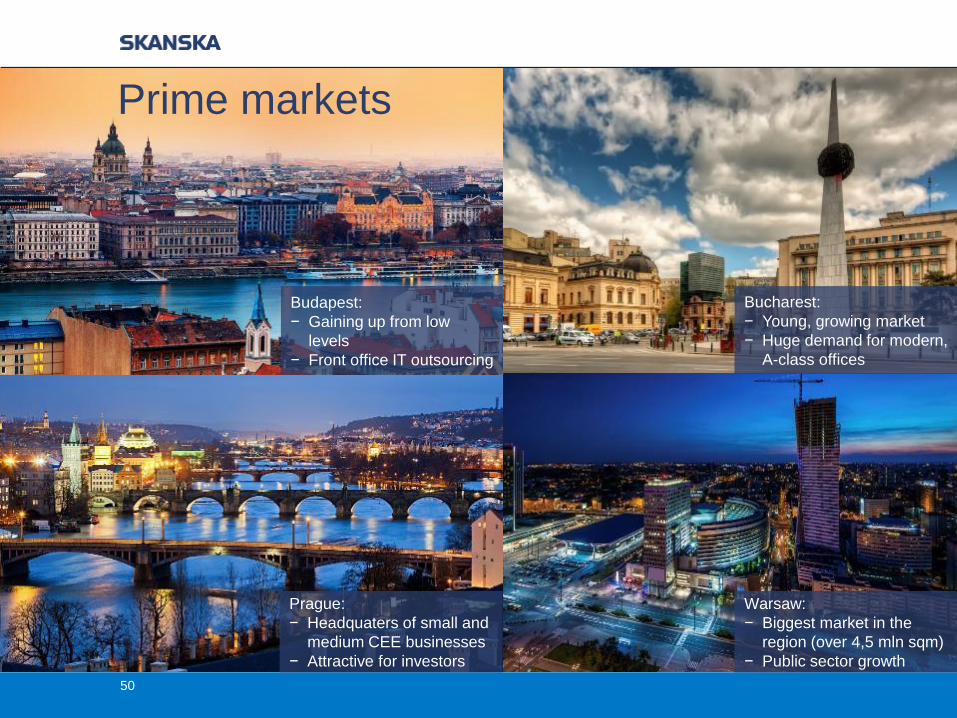
Prague:
− Headquaters of small and
medium CEE businesses
− Attractive for investors
Warsaw:
− Biggest market in the
region (over 4,5 mln sqm)
− Public sector growth
Prime markets
Budapest:
− Gaining up from low
levels
− Front office IT outsourcing
Bucharest:
− Young, growing market
− Huge demand for modern,
A-class offices
50
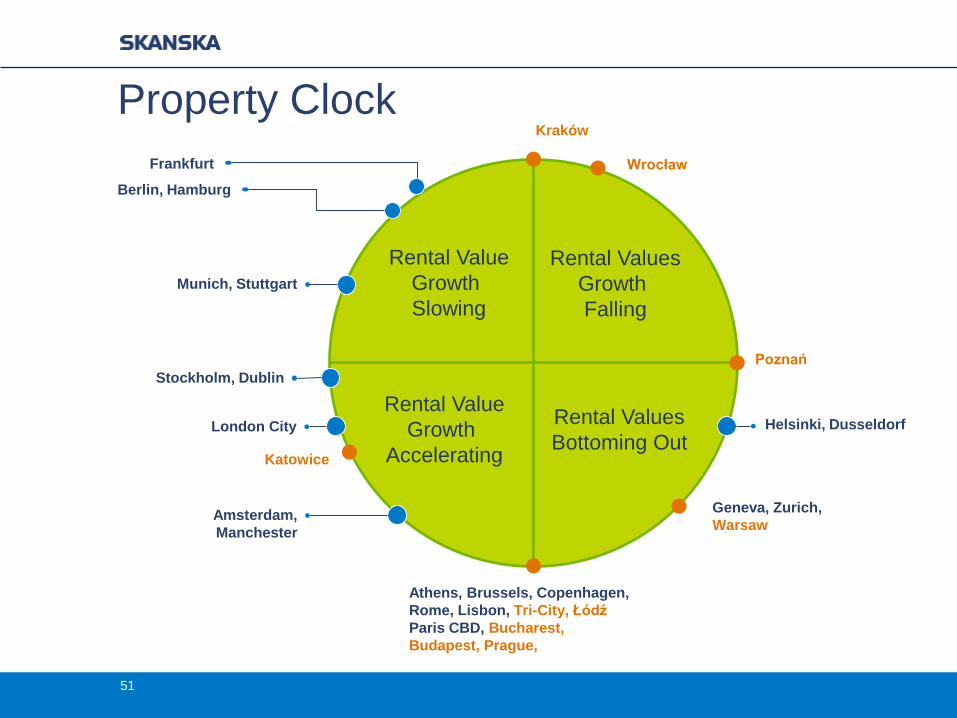
Property Clock
Rental Value
Growth
Slowing
Rental Values
Growth
Falling
Rental Value
Growth
Accelerating
Rental Values
Bottoming Out
Kraków
Wrocław
Poznań
Katowice
Athens, Brussels, Copenhagen,
Rome, Lisbon, Tri-City, Łódź
Paris CBD, Bucharest,
Budapest, Prague,
Berlin, Hamburg
London City
Munich, Stuttgart
Geneva, Zurich,
WarsawAmsterdam,
Manchester
Stockholm, Dublin
Helsinki, Dusseldorf
Frankfurt
51
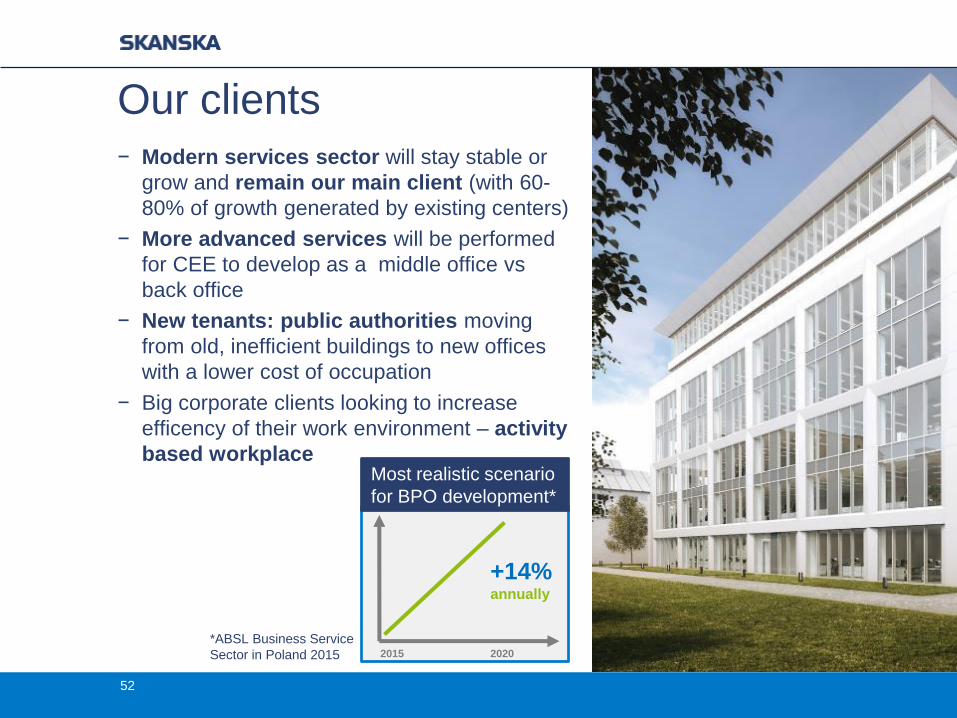
*ABSL Business Service
Sector in Poland 2015
Our clients
− Modern services sector will stay stable or
grow and remain our main client (with 60-
80% of growth generated by existing centers)
− More advanced services will be performed
for CEE to develop as a middle office vs
back office
− New tenants: public authorities moving
from old, inefficient buildings to new offices
with a lower cost of occupation
− Big corporate clients looking to increase
efficency of their work environment – activity
based workplace
+14%annually
2015 2020
Most realistic scenario
for BPO development*
52
Acquiring & retaining great people is key
53
Risks and challenges:
− Keep the company culture in a growing organization
− Getting people ready to deliver and understand what creates value
− Process management balanced with creativity, innovation and flexible
approach
− How to retain best people – more independent generations, more
competitive labor market and mobility
54
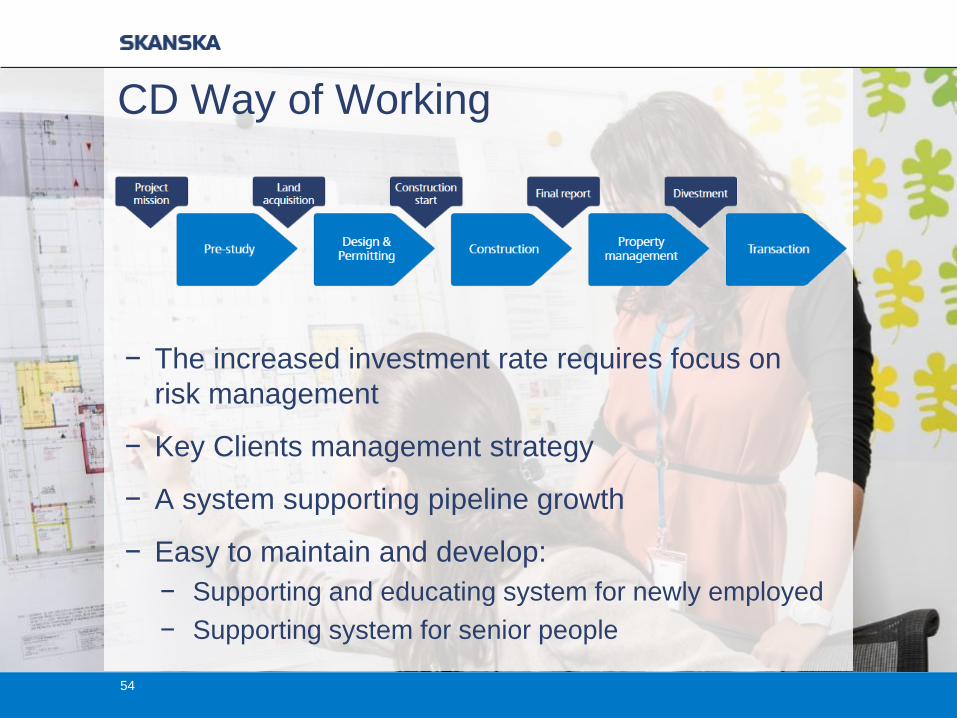
− The increased investment rate requires focus on
risk management
− Key Clients management strategy
− A system supporting pipeline growth
− Easy to maintain and develop:
− Supporting and educating system for newly employed
− Supporting system for senior people
CD Way of Working
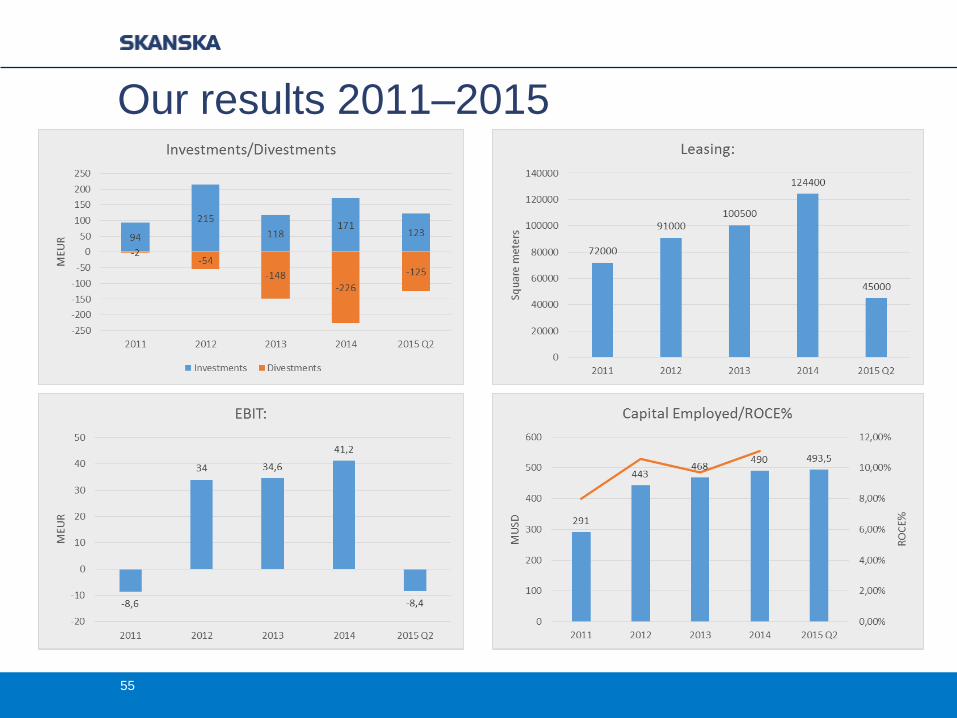
Our results 2011–2015
55
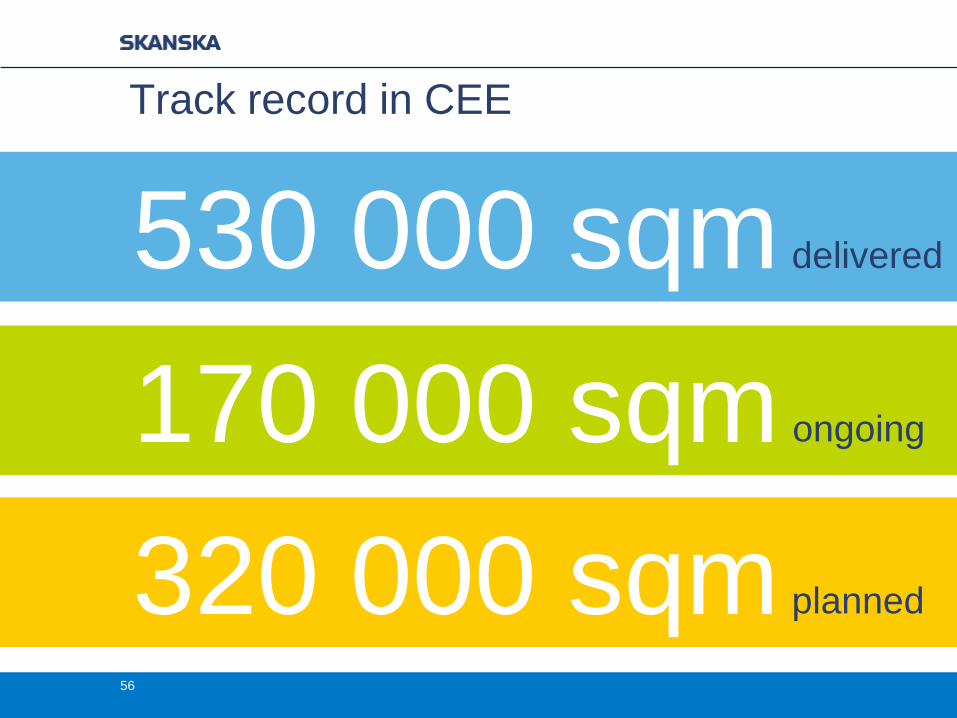
530 000 sqm
170 000 sqm
320 000 sqm
delivered
ongoing
planned
Track record in CEE
56
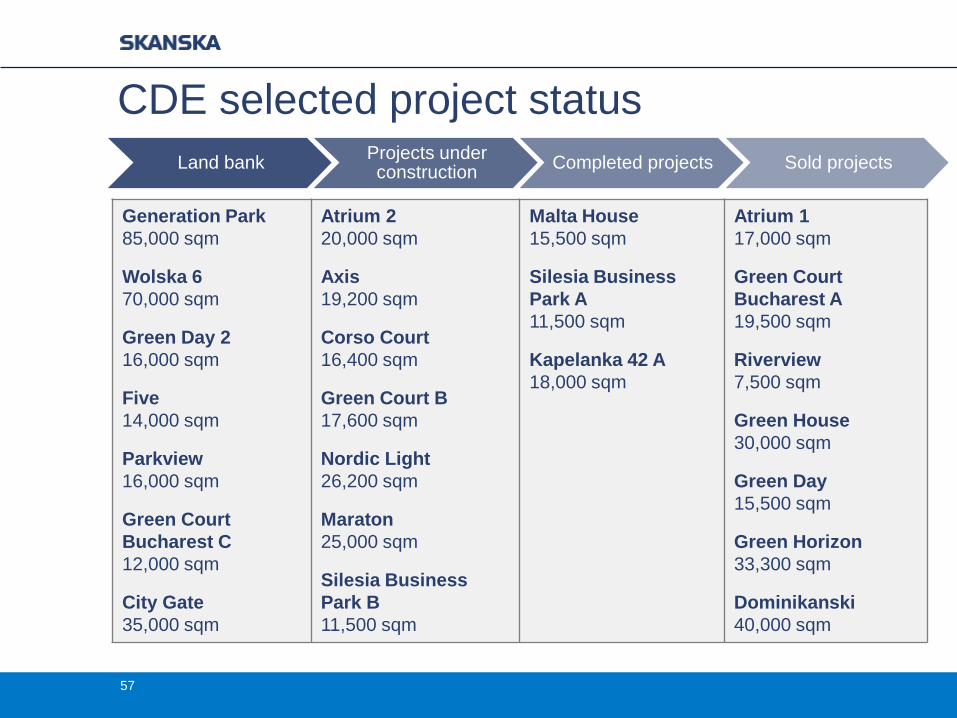
Generation Park
85,000 sqm
Wolska 6
70,000 sqm
Green Day 2
16,000 sqm
Five
14,000 sqm
Parkview
16,000 sqm
Green Court
Bucharest C
12,000 sqm
City Gate
35,000 sqm
Atrium 2
20,000 sqm
Axis
19,200 sqm
Corso Court
16,400 sqm
Green Court B
17,600 sqm
Nordic Light
26,200 sqm
Maraton
25,000 sqm
Silesia Business
Park B
11,500 sqm
Malta House
15,500 sqm
Silesia Business
Park A
11,500 sqm
Kapelanka 42 A
18,000 sqm
Atrium 1
17,000 sqm
Green Court
Bucharest A
19,500 sqm
Riverview
7,500 sqm
Green House
30,000 sqm
Green Day
15,500 sqm
Green Horizon
33,300 sqm
Dominikanski
40,000 sqm
Land bankProjects under construction
Completed projects Sold projects
CDE selected project status
57
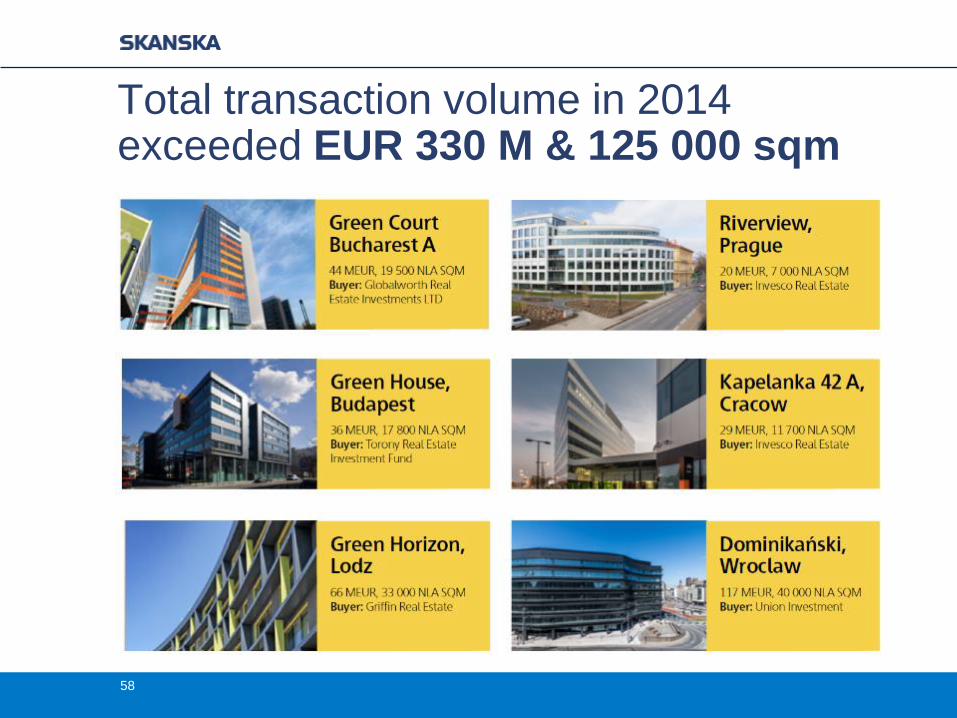
Total transaction volume in 2014exceeded EUR 330 M & 125 000 sqm
58
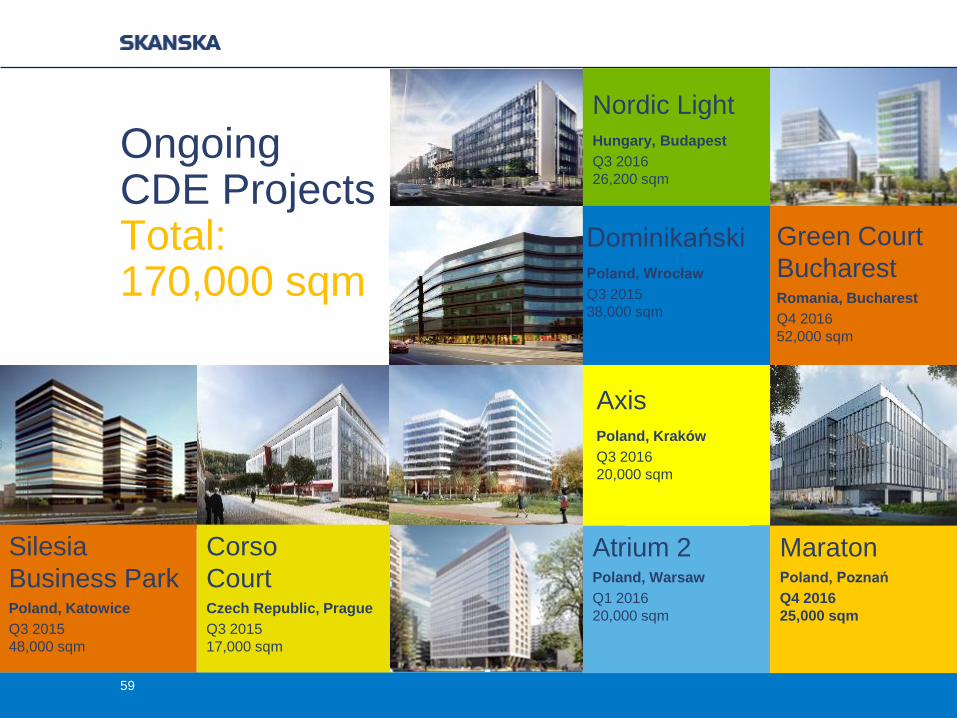
Atrium 2Poland, Warsaw
Q1 2016
20,000 sqm
OngoingCDE Projects Total: 170,000 sqm
MaratonPoland, Poznań
Q4 2016
25,000 sqm
Green Court
BucharestRomania, Bucharest
Q4 2016
52,000 sqm
Nordic Light
Hungary, Budapest
Q3 2016
26,200 sqm
Dominikański
Poland, Wrocław
Q3 2015
38,000 sqm
Axis
Poland, Kraków
Q3 2016
20,000 sqm
59
Corso
CourtCzech Republic, Prague
Q3 2015
17,000 sqm
Silesia
Business ParkPoland, Katowice
Q3 2015
48,000 sqm
City GatePoland, Łódź
2018-19
32,000 sqm
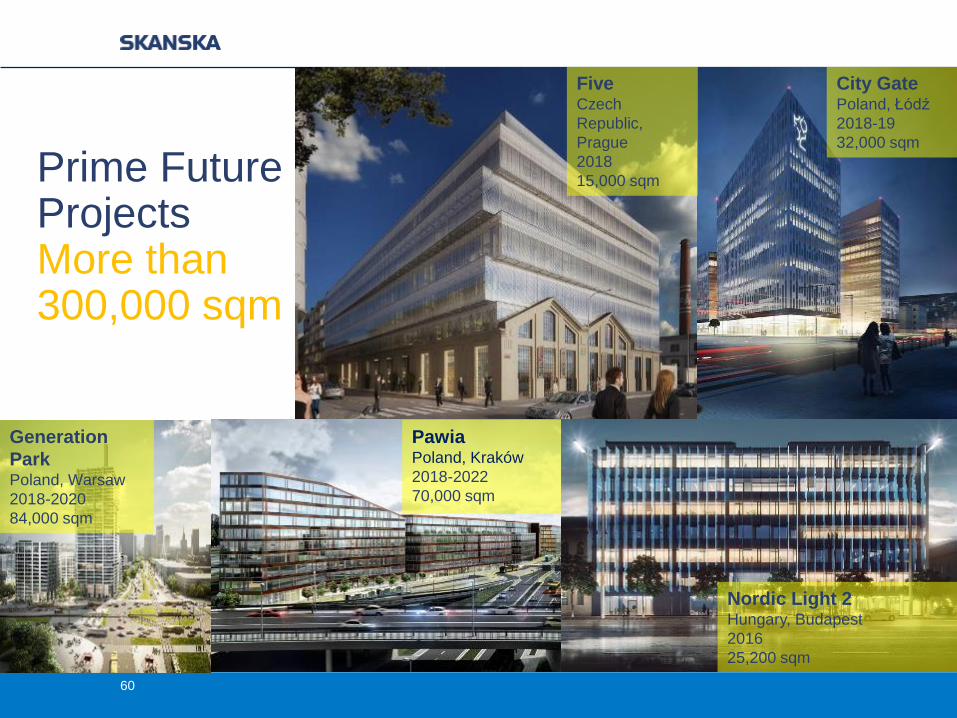
Prime Future Projects More than300,000 sqm
Generation
ParkPoland, Warsaw
2018-2020
84,000 sqm
PawiaPoland, Kraków
2018-2022
70,000 sqm
Nordic Light 2Hungary, Budapest
2016
25,200 sqm
FiveCzech
Republic,
Prague
2018
15,000 sqm
60
61
Challenges
− Future land bank, lack of
easy plots on the market
− Easy money on the market-
competition catching up
Opportunities
− Macro economical stability
in the region
− Strong inflows of foreign
capital
− Domestic investment funds
becoming active
62
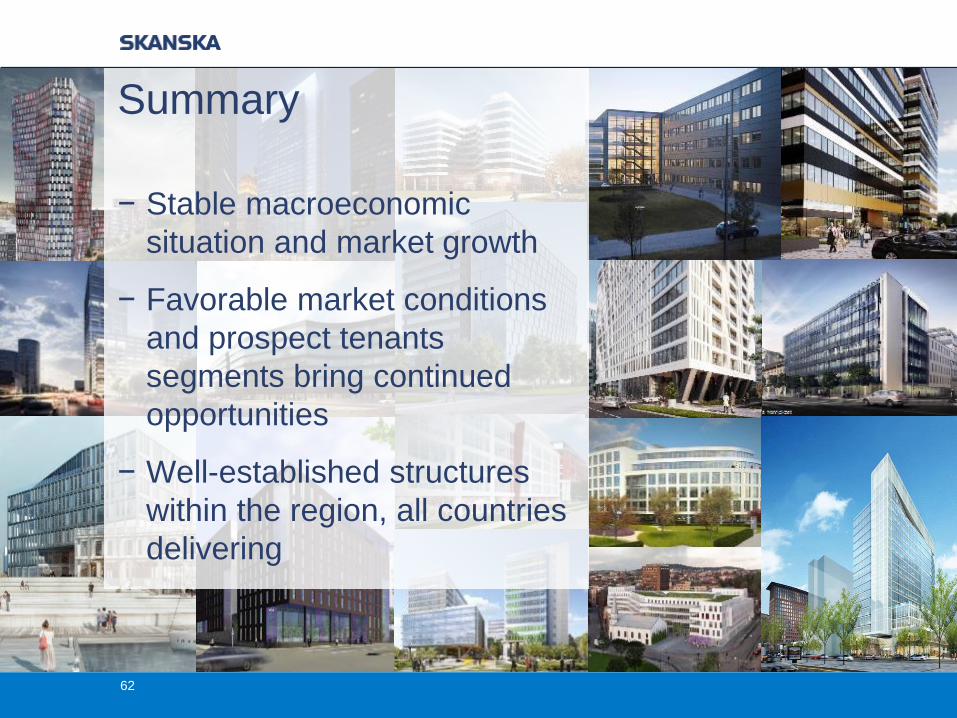
− Stable macroeconomic
situation and market growth
− Favorable market conditions
and prospect tenants
segments bring continued
opportunities
− Well-established structures
within the region, all countries
delivering
Summary


