Total Accessible Stream Length (km) Skeena Salmon: Chum Conservation Unit (CU) Location Introduction This habitat report card was developed by the Pacific Salmon Foundation with technical support from ESSA Technologies. This project summarizes pressures on habitat used by Skeena salmon for migration, spawning, rearing and incubation, as well as their relative vulnerability to those pressures. For an explanation of the indicators shown here, please see the accompanying Report Card Summaries . Full methods and results can be found in the main report, Skeena Salmon Conservation Units Habitat Report Cards: Chinook, coho, pink, chum, and river sockeye (2014). An online interactive version of this information is available at www.skeenasalmonprogram.ca . Definitions Conservation Unit (CU): A group of wild salmon sufficiently isolated from other groups that, if extirpated, is very unlikely to re-colonize naturally within an acceptable timeframe. Pressure indicator: Measurable extent/intensity of natural processes or human activities that can induce changes in habitat condition/state. Vulnerability indicator: Measures of habitat quantity or quality used to represent the intrinsic habitat vulnerability/sensitivity to watershed disturbances for each life-stage. Zone of influence (ZOI): Areas adjacent to and upstream/upslope of habitats used by salmon CUs that represent the geographic extent for capture/measurement of pressure and vulnerability indicators. Status: Condition of habitat relative to a defined indicator benchmark. Risk: Risk of adverse effects to salmon habitats within a defined zone of influence. Levels of increasing risk are defined based on the extent/ intensity of impacts relative to defined benchmarks of concern. Benchmark: A standard (quantified metric) against which habitat condition can be measured or judged, and by which status can be compared over time and space to determine the risk of adverse effects. Chum Habitat Report Cards: Upper Skeena 1 Version 1.0 Jan 2014 Upper Skeena See the Skeena River Basin report card for information on escapement, climate, flows, glaciers and snow conditions across the Skeena watershed. See the Skeena estuary report card for information on habitat pressures and vulnerabilities to salmon in the estuary. Narrative This CU supports one spawning population in Bear River, downstream of Sapolio Lake and Triple Creek. There are no known chum spawning records or DNA samples collected for this population. Williams et al. (1985) reported low densities of chum salmon fry caught in their upper and lower IPTs and beach seines. Shirvell and Anderson (1990) reported one chum spawner in the upper Bear River, September 9, 1990 with good visibility conditions. There are no known habitat issues.
Transcript
Total Accessible Stream Length (km)
Skeena Salmon: Chum Conservation Unit (CU)
Location
Introduction
This habitat report card was developed by the Pacific Salmon Foundation with technical support from ESSA Technologies. This project summarizes pressures on habitat used by Skeena salmon for migration, spawning, rearing and incubation, as well as their relative vulnerability to those pressures. For an explanation of the indicators shown here, please see the accompanying Report Card Summaries . Full methods and results can be found in the main report, Skeena Salmon Conservation Units Habitat Report Cards: Chinook, coho, pink, chum, and river sockeye (2014). An online interactive version of this information is available at www.skeenasalmonprogram.ca.
Definitions
Conservation Unit (CU): A group of wild salmon sufficiently isolated from other groups that, if extirpated, is very unlikely to re -colonize naturally within an acceptable timeframe.
Pressure indicator: Measurable extent/intensity of natural processes or human activities that can induce changes in habitat condition/state.
Vulnerability indicator: Measures of habitat quantity or quality used to represent the intrinsic habitat vulnerability/sensitivity to watershed disturbances for each life-stage.
Zone of influence (ZOI): Areas adjacent to and upstream/upslope of habitats used by salmon CUs that represent the geographic extent for capture/measurement of pressure and vulnerability indicators.
Status: Condition of habitat relative to a defined indicator benchmark.
Risk: Risk of adverse effects to salmon habitats within a defined zone of influence. Levels of increasing risk are defined based on the extent/intensity of impacts relative to defined benchmarks of concern.
Benchmark: A standard (quantified metric) against which habitat condition can be measured or judged, and by which status can be compared over time and space to determine the risk of adverse effects.
Chum Habitat Report Cards: Upper Skeena 1
Version 1.0 Jan 2014
Upper Skeena
See the Skeena River Basin report card for information on escapement, climate, flows, glaciers and snow conditions across the Skeena watershed.
See the Skeena estuary report card for information on habitat pressures and vulnerabilities to salmon in the estuary.
Narrative
This CU supports one spawning population in Bear River, downstream of
Sapolio Lake and Triple Creek.
There are no known chum spawning records or DNA samples collected
for this population.
Williams et al. (1985) reported low densities of chum salmon fry caught in their upper and lower IPTs and beach seines. Shirvell and Anderson (1990) reported one chum spawner in the upper Bear River, September 9, 1990 with good visibility conditions.
CU overview of habitat vulnerabilities & pressures Pressure indicators were grouped into seven relatively independent habitat “impact categories” representing key factors affecting general watershed condition:
Hydrologic Processes (Forest disturbance; ECA) Vegetation Quality (Insect and disease defoliation; Riparian disturbance) Surface Erosion (Road development) Fish passage/Habitat connectivity (Stream crossing density) Water quantity (Water licenses) Human development footprint (Total land cover alteration; Impervious surfaces; Linear development; Mining development) Water quality (Mining development acid generating; Wastewater discharges)
Indicators were also developed reflecting relative vulnerability to habitat pressures within the life stage-specific “zones of influence” defined for each CU:
Rearing/Migration ZOI: Accessible stream length; Length & percentage of accessible streams considered flow sensitive - all seasons Spawning ZOI: Total spawning length; Length & percentage of spawning reaches considered flow sensitive (summer period - spawning, winter period - incubation)
Proposed linear development (% increase) 0.004 km/km2
(0.8%) 0 km/km2 (0%)
Proposed water licenses (% increase) 18 (12%) 0 (0%)
Proposed power tenures 116 km2 0 km2
Upper Skeena Chum CU summary
1
These CU habitat report cards are intended to allow assessment and comparison of CU habitat ‘status’ based on a combination of (1) intrinsic vulnerability of CU freshwater habitats, and (2) intensity and extent of human pressures/stressors on those habitats. A full description of indicators and data sources used for Skeena salmon CUs can be found in the main report (Skeena salmon Conservation Units habitat report cards: Chinook, coho, pink, chum, and river sockeye. Porter et al. 2014) available from PSF at: www.skeenasalmonprogram.ca.
Page 1
1. Introduction and Definitions. Brief description of the CU reporting exercise undertaken to assess salmon CU habitats and definitions for key terms that are used throughout the reporting.
2. Narrative. Short bulleted descriptions of key issues affecting the CU. This includes the principal habitat pressures on CU habitats as determined from the broad-scale analyses undertaken here, as well as more localized habitat impacts affecting the CU as identified by Skeena regional experts. Data source: Skeena TAC [2013].
3. Location. Map showing (i) the location of the CU boundary currently designated by DFO, (ii) spawning1 and rearing/migration
2 zones of
influence (ZOIs), as defined within this project for the Skeena drainage, and (iii) the location of the Skeena drainage within BC. DFO’s delineated CU boundary is indicated by the dark black outline, the CU spawning ZOI is indicated by yellow shading, and the CU rearing/migration ZOI is indicated by grey shading (the spawning ZOI is nested within the rearing/migration ZOI such that yellow shaded areas of the map belong to both ZOIs). Note that egg incubation occurs in the same locations as spawning (although at a different time of year); therefore, habitat within the spawning ZOI is relevant to both spawning and incubation life stages although for brevity this is labeled simply as “spawning ZOI” throughout.
Page 2
CU overview of habitat vulnerabilities & pressures
4. Description of terms. Identification of the GIS-based habitat pressure indicators, habitat pressure ‘Impact Categories’, and habitat vulnerability indicators developed and used for analyses of salmon CU habitat status for rearing/migration, spawning, and incubation life stages.
5. Cumulative pressure—rearing/migration. Map of cumulative habitat pressure scores for watersheds located within the CU rearing/migration corridor zone of influence. Given the more diffuse nature of potential impacts affecting migrating salmon, the cumulative pressures scores are assigned to rearing/migration corridor watersheds based on the sum of the seven individual Impact Category scores for each watershed (rather than through a lower, moderate, higher risk categorical rule set across Impact Categories)
3. Within each watershed,
each Impact Category is scored as 0 (for a lower risk Impact Category), 1 (for a moderate risk Impact Category), or 2 (for a higher risk Impact Category). The cumulative pressure scores for the migration corridor watersheds can therefore range from 0 to 14 and are colour-gradated accordingly. Darker shaded watersheds represent areas within the rearing/migration corridor where relatively higher risk habitat impacts may be occurring.
6. Summary of pressure indicators—spawning. Area-weighted average of all watershed pressure indicator scores for 1:20K FWA (Freshwater Atlas) assessment watersheds within or intersecting the CU spawning ZOI. The area-weighted average score is normalized for each indicator
1 The spawning zone of influence (ZOI) for each CU is defined as the 1:20K FWA assessment watersheds within DFO-delineated CU boundaries
that overlap or intersect with the species-identified spawning reaches. 2 The rearing/migration ZOI for each CU is defined as all 1:20K FWA assessment watersheds within the Skeena subdrainages (as delineated
within the province’s major watershed GIS layer) in which CU-specific spawning has been identified, plus the subdrainages along the required route from the CU spawning areas downstream through the Lower Skeena subdrainage to the Skeena estuary. For these salmon species, it has not been possible to identify the multiple potential localized migration routes and specific rearing areas, or to differentiate migration vs. rearing life-stage-specific differences in habitat use; consequently the CU rearing/migration life stages have been merged into a single combined and broadly-defined ZOI for habitat risk analyses. 3 Note that the scoring approach to risk classifications (green, amber, red) for each Impact Category is based on the same defined indicator roll-
up rule set that is used for watersheds within spawning ZOIs.
Skeena Salmon CU Habitat Report Card Summaries – Chinook,
coho, pink, chum, and river sockeye Vers ion 1.0, January 2014
so that the lower to moderate risk threshold ( ) occurs at 0.33 ( ) and the moderate to higher risk threshold ( ) is at 0.66 ( on a scale of 0 to 1
4. The greyed areas within the figure represent the separation of the individual indicators into the seven Impact Category groupings.
7. Cumulative pressure—spawning. Map of cumulative risk from habitat pressures for each watershed found within the CU spawning ZOI. The cumulative risk rating is based on the risk scoring of seven habitat pressure indicator Impact Categories (hydrologic processes, vegetation quality, surface erosion, fish passage/habitat connectivity, water quantity, human development footprint, and water quality).
Categorical roll-up rule set for watersheds in rearing & spawning zones of influence: if 3 impact categories are rated as higher risk, then the
watershed’s cumulative risk classification = red (higher risk), else if 5 Impact Categories are rated as lower risk then the watershed’s cumulative risk classification = green (lower risk), else the watershed’s cumulative risk classification = amber (moderate risk).
8. Integrated vulnerability/habitat pressures—rearing/migration, spawning, & incubation. Figures representing bivariate indices of the relative rankings across salmon CUs for scored cumulative habitat pressures and scored vulnerability to these pressures within CU ZOIs for rearing/migration, spawning, and incubation. Methods used for selecting scored CU cumulative habitat pressures and vulnerabilities are different for each life stage evaluated (see Porter et al. 2014). The larger solid blue circle in each figure represents the ranking of the particular CU relative to the other Skeena CUs for that species, and identifies its ranked position relative to a coloured gradation representing both increasing cumulative habitat pressure and increasing vulnerability to those pressures.
Page 3
Rearing/Migration vulnerability & pressures
Rearing/Migration period pressure
9. Rearing/Migration period pressures. Large-scale map of the identified CU rearing/migration areas showing cumulative rearing/migration risk scoring for watersheds within the CU’s rearing/migration ZOI and the location of the ZOI within the larger Skeena River Basin.
Rearing/Migration period vulnerability
10. Fish accessible habitat (km)5. The total length all 1:20K FWA-defined stream reaches occurring within the CU rearing/migration ZOI that
are considered accessible to salmonids. This reflects the total amount of stream habitat that could ‘potentially’ be available to salmonids for spawning or rearing, with a greater accessible length indicating a lower CU vulnerability to habitat pressures. The figure indicates the accessible habitat length within the CU rearing/migration ZOI and illustrates the degree of this vulnerability (blue bar graph or blue dotted line, dependent on presentation format used for the species) relative to other CUs for the species within the Skeena drainage. Data source: BC MOE Fish Passage layer [Oct 2011].
11. Flow sensitive accessible habitat (km) (all seasons). The total length of streams within the CU rearing/migration ZOI that is considered prone to experiencing low water flows (in either summer, winter, or both seasons), with associated potential for altered water temperatures. Low flow conditions experienced over extended distances can impact fish health and can increase encounters with flow- related obstacles/delays to adult fish passage etc. The figure indicates the total stream length for the CU that is considered to be within zones of low flow sensitivity and illustrates the degree of this vulnerability (blue bar graph or blue dotted line, dependent on presentation format used for the species) relative to other CUs for the species within the Skeena drainage. Data source: BC MOE ecoregional flow sensitivity map [Feb 23, 2011].
12. Flow sensitive accessible habitat (%) (all seasons). The total proportion of the stream length within the CU rearing/migration ZOI that is considered prone to experiencing low water flows (in summer, winter, or both seasons), with associated potential for altered water temperatures. Low flow conditions over extended distances can impact fish health and create obstacles/delays to adult fish passage, etc. The figure indicates the total proportion of the CU migration route that is considered to be within zones of low flow sensitivity (all seasons) and illustrates the degree of this vulnerability (blue bar graph or blue dotted line, dependent on presentation format used for the species) relative to other CUs for the species within the Skeena drainage. Data source: BC MOE ecoregional flow sensitivity mapping [Feb 23, 2011].
13. Coho CUs ONLY: Lake area (km2). The total area of lakes present within the CU rearing/migration ZOI. Lakes can provide rearing areas
and overwintering refugia for juvenile coho, with a smaller area of lakes indicating a potentially greater CU vulnerability to habitat pressures. The figure indicates the total lake area within the CU rearing/migration ZOI and illustrates the degree of this vulnerability (blue dotted line)
4 Where the average score ̅ , the normalized score ̅ ̅ ; where ̅ , ̅ ̅ .
5 Note that the Fish Passage layer used for this analysis is based on a model developed by the province that defines stream accessibility to
salmonids in general and is not specific to species-specific passage abilities/constraints. As such, we have adjusted the general model to improve resolution for our analyses, such that for pink, chum, and river sockeye accessibility was restricted only to streams that were > 4
th
order (as defined with the 1:20K FWS stream hydrology network) (i.e. smaller streams were not considered accessible to chum, pink and river sockeye for rearing purposes). SummariesSalmon Habitat Report Cards:
3
relative to other coho CUs within the Skeena drainage. Data source: FWA Lakes [2008], Skeena TAC [Sept 2013].
14. Coho CUs ONLY: Wetland area (km2). The total area of wetlands present within the CU rearing/migration ZOI. Wetlands can provide
rearing areas and overwintering refugia for juvenile coho, with a smaller area of wetlands indicating a potentially greater CU vulnerability to habitat pressures. The figure indicates the total wetland area within the CU rearing/migration ZOI and illustrates the degree of this vulnerability (blue dotted line) relative to other coho CUs within the Skeena drainage. Data source: FWA Lakes [2008], Skeena TAC [Sept 2013].
Page 4
Spawning & incubation vulnerability
Spawning period vulnerability
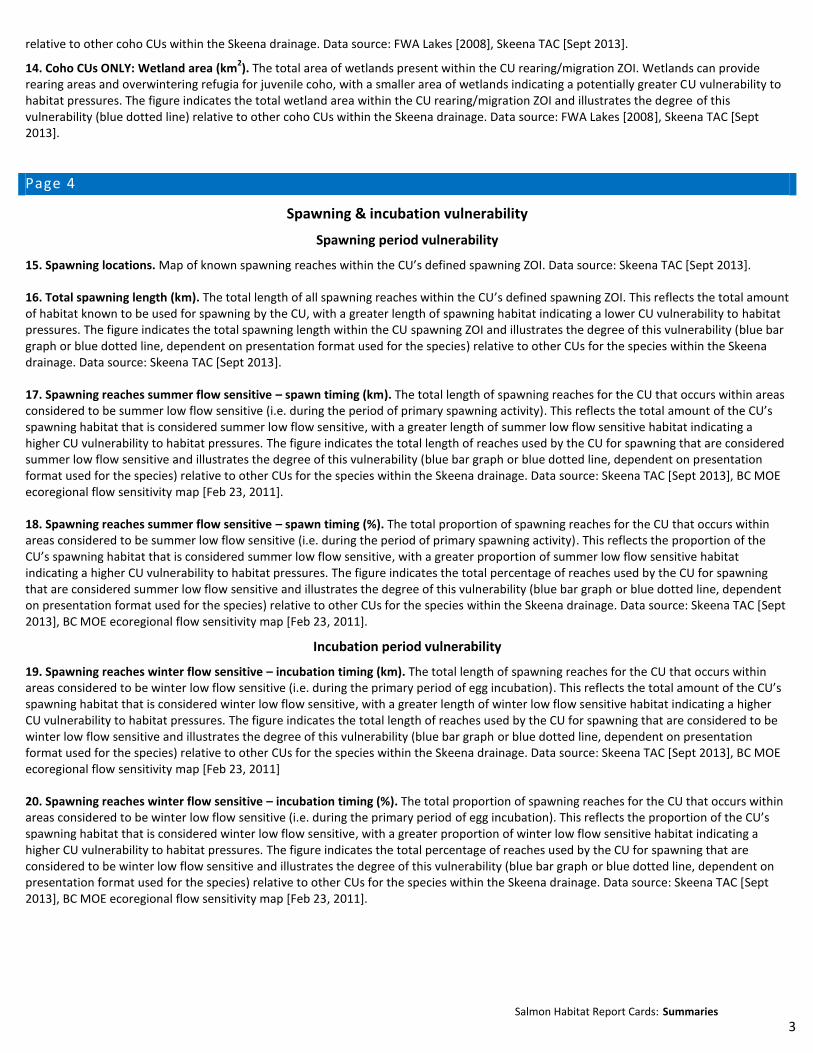
15. Spawning locations. Map of known spawning reaches within the CU’s defined spawning ZOI. Data source: Skeena TAC [Sept 2013].
16. Total spawning length (km). The total length of all spawning reaches within the CU’s defined spawning ZOI. This reflects the total amount of habitat known to be used for spawning by the CU, with a greater length of spawning habitat indicating a lower CU vulnerability to habitat pressures. The figure indicates the total spawning length within the CU spawning ZOI and illustrates the degree of this vulnerability (blue bar graph or blue dotted line, dependent on presentation format used for the species) relative to other CUs for the species within the Skeena drainage. Data source: Skeena TAC [Sept 2013].
17. Spawning reaches summer flow sensitive – spawn timing (km). The total length of spawning reaches for the CU that occurs within areas considered to be summer low flow sensitive (i.e. during the period of primary spawning activity). This reflects the total amount of the CU’s spawning habitat that is considered summer low flow sensitive, with a greater length of summer low flow sensitive habitat indicating a higher CU vulnerability to habitat pressures. The figure indicates the total length of reaches used by the CU for spawning that are considered summer low flow sensitive and illustrates the degree of this vulnerability (blue bar graph or blue dotted line, dependent on presentation format used for the species) relative to other CUs for the species within the Skeena drainage. Data source: Skeena TAC [Sept 2013], BC MOE ecoregional flow sensitivity map [Feb 23, 2011].
18. Spawning reaches summer flow sensitive – spawn timing (%). The total proportion of spawning reaches for the CU that occurs within areas considered to be summer low flow sensitive (i.e. during the period of primary spawning activity). This reflects the proportion of the CU’s spawning habitat that is considered summer low flow sensitive, with a greater proportion of summer low flow sensitive habitat indicating a higher CU vulnerability to habitat pressures. The figure indicates the total percentage of reaches used by the CU for spawning that are considered summer low flow sensitive and illustrates the degree of this vulnerability (blue bar graph or blue dotted line, dependent on presentation format used for the species) relative to other CUs for the species within the Skeena drainage. Data source: Skeena TAC [Sept 2013], BC MOE ecoregional flow sensitivity map [Feb 23, 2011].
Incubation period vulnerability
19. Spawning reaches winter flow sensitive – incubation timing (km). The total length of spawning reaches for the CU that occurs within areas considered to be winter low flow sensitive (i.e. during the primary period of egg incubation). This reflects the total amount of the CU’s spawning habitat that is considered winter low flow sensitive, with a greater length of winter low flow sensitive habitat indicating a higher CU vulnerability to habitat pressures. The figure indicates the total length of reaches used by the CU for spawning that are considered to be winter low flow sensitive and illustrates the degree of this vulnerability (blue bar graph or blue dotted line, dependent on presentation format used for the species) relative to other CUs for the species within the Skeena drainage. Data source: Skeena TAC [Sept 2013], BC MOE ecoregional flow sensitivity map [Feb 23, 2011]
20. Spawning reaches winter flow sensitive – incubation timing (%). The total proportion of spawning reaches for the CU that occurs within areas considered to be winter low flow sensitive (i.e. during the primary period of egg incubation). This reflects the proportion of the CU’s spawning habitat that is considered winter low flow sensitive, with a greater proportion of winter low flow sensitive habitat indicating a higher CU vulnerability to habitat pressures. The figure indicates the total percentage of reaches used by the CU for spawning that are considered to be winter low flow sensitive and illustrates the degree of this vulnerability (blue bar graph or blue dotted line, dependent on presentation format used for the species) relative to other CUs for the species within the Skeena drainage. Data source: Skeena TAC [Sept 2013], BC MOE ecoregional flow sensitivity map [Feb 23, 2011].
SummariesSalmon Habitat Report Cards:
4
Page 5
Spawning pressure
Hydrologic Processes
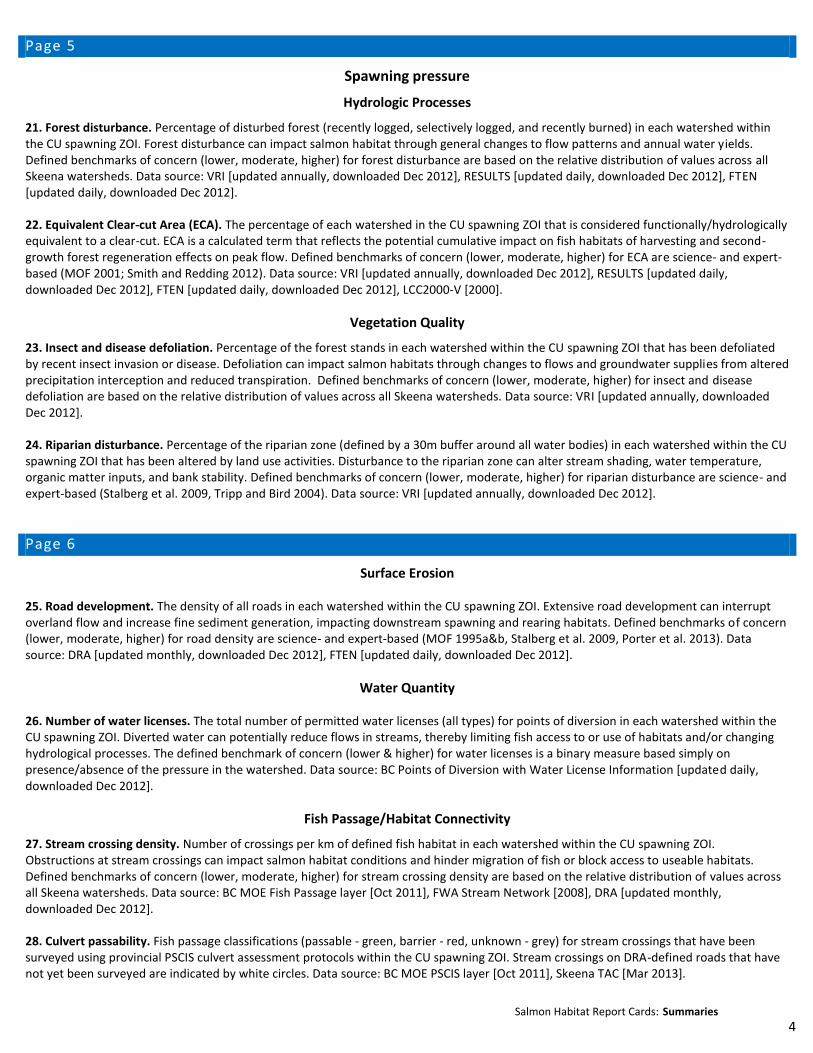
21. Forest disturbance. Percentage of disturbed forest (recently logged, selectively logged, and recently burned) in each watershed within the CU spawning ZOI. Forest disturbance can impact salmon habitat through general changes to flow patterns and annual water yields. Defined benchmarks of concern (lower, moderate, higher) for forest disturbance are based on the relative distribution of values across all Skeena watersheds. Data source: VRI [updated annually, downloaded Dec 2012], RESULTS [updated daily, downloaded Dec 2012], FTEN [updated daily, downloaded Dec 2012].
22. Equivalent Clear-cut Area (ECA). The percentage of each watershed in the CU spawning ZOI that is considered functionally/hydrologically equivalent to a clear-cut. ECA is a calculated term that reflects the potential cumulative impact on fish habitats of harvesting and second-growth forest regeneration effects on peak flow. Defined benchmarks of concern (lower, moderate, higher) for ECA are science- and expert-based (MOF 2001; Smith and Redding 2012). Data source: VRI [updated annually, downloaded Dec 2012], RESULTS [updated daily, downloaded Dec 2012], FTEN [updated daily, downloaded Dec 2012], LCC2000-V [2000].
Vegetation Quality
23. Insect and disease defoliation. Percentage of the forest stands in each watershed within the CU spawning ZOI that has been defoliated by recent insect invasion or disease. Defoliation can impact salmon habitats through changes to flows and groundwater supplies from altered precipitation interception and reduced transpiration. Defined benchmarks of concern (lower, moderate, higher) for insect and disease defoliation are based on the relative distribution of values across all Skeena watersheds. Data source: VRI [updated annually, downloaded Dec 2012].
24. Riparian disturbance. Percentage of the riparian zone (defined by a 30m buffer around all water bodies) in each watershed within the CU spawning ZOI that has been altered by land use activities. Disturbance to the riparian zone can alter stream shading, water temperature, organic matter inputs, and bank stability. Defined benchmarks of concern (lower, moderate, higher) for riparian disturbance are science- and expert-based (Stalberg et al. 2009, Tripp and Bird 2004). Data source: VRI [updated annually, downloaded Dec 2012].
Page 6
Surface Erosion
25. Road development. The density of all roads in each watershed within the CU spawning ZOI. Extensive road development can interrupt overland flow and increase fine sediment generation, impacting downstream spawning and rearing habitats. Defined benchmarks of concern (lower, moderate, higher) for road density are science- and expert-based (MOF 1995a&b, Stalberg et al. 2009, Porter et al. 2013). Data source: DRA [updated monthly, downloaded Dec 2012], FTEN [updated daily, downloaded Dec 2012].
Water Quantity
26. Number of water licenses. The total number of permitted water licenses (all types) for points of diversion in each watershed within the CU spawning ZOI. Diverted water can potentially reduce flows in streams, thereby limiting fish access to or use of habitats and/or changing hydrological processes. The defined benchmark of concern (lower & higher) for water licenses is a binary measure based simply on presence/absence of the pressure in the watershed. Data source: BC Points of Diversion with Water License Information [updated daily, downloaded Dec 2012].
Fish Passage/Habitat Connectivity
27. Stream crossing density. Number of crossings per km of defined fish habitat in each watershed within the CU spawning ZOI. Obstructions at stream crossings can impact salmon habitat conditions and hinder migration of fish or block access to useable habitats. Defined benchmarks of concern (lower, moderate, higher) for stream crossing density are based on the relative distribution of values across all Skeena watersheds. Data source: BC MOE Fish Passage layer [Oct 2011], FWA Stream Network [2008], DRA [updated monthly, downloaded Dec 2012].
28. Culvert passability. Fish passage classifications (passable - green, barrier - red, unknown - grey) for stream crossings that have been surveyed using provincial PSCIS culvert assessment protocols within the CU spawning ZOI. Stream crossings on DRA-defined roads that have not yet been surveyed are indicated by white circles. Data source: BC MOE PSCIS layer [Oct 2011], Skeena TAC [Mar 2013].
SummariesSalmon Habitat Report Cards:
5
Page 7
Human Development Footprint
29. Total land cover alteration. Land alteration (agriculture, residential/agriculture mix, recently burned, recently logged, selectively logged, mining, recreation, and urban) as a percentage of watershed area for each watershed within the CU spawning ZOI. Land cover alteration reflects a suite of potential changes to hydrological processes and sediment generation, with potential downstream impacts on spawning and rearing habitats. Defined benchmarks of concern (lower, moderate, higher) for land cover alteration are based on the relative distribution of values across all Skeena watersheds. Data source: LCC2000-V [2000], VRI [updated annually, downloaded Dec 2012], DRA [updated monthly, downloaded Dec 2012], FTEN [updated daily, downloaded Dec 2012], RESULTS [updated daily, downloaded Dec 2012], NTS [1998], Crown Tenure [updated daily, downloaded Dec 2012], Current Fire Perimeters [updated daily, downloaded Dec 2012], Historical Fire Perimeters [updated monthly, downloaded Dec 2012], BTM [1992].
30. Impervious surfaces. Percentage of each watershed within the CU spawning ZOI that is considered impervious: a calculated term that reflects the area covered by hard man-made surfaces (e.g. asphalt, concrete, brick, etc.). Extensive impervious surfaces from urban/rural development in a watershed can impact rainwater infiltration and groundwater recharge, and lead to stream habitat degradation through changes in geomorphology and hydrology. Impervious surfaces are also associated with increased loading of nutrients and contaminants in developed areas. Defined benchmarks of concern for impervious surfaces (lower, moderate, higher) are science- and expert-based (Paul and Meyer 2000; Smith 2005). Note that impervious surface coefficients (ISC) for land surface types used for this exercise were not Skeena-drainage-specific but were instead generalized from those used in other jurisdictions. Data source: LCC2000-V [2000], VRI [updated annually, downloaded Dec 2012], DRA [updated monthly, downloaded Dec 2012], FTEN [updated daily, downloaded Dec 2012], NTS [1998].
31. Linear development. Density of all linear construction (e.g. roads, utility corridors, pipelines, right of ways, railways, etc.) in each watershed within the CU spawning ZOI. Linear development is a general indicator of potential human impacts on fish habitats. Defined benchmarks of concern (lower, moderate, higher) for linear development are based on the relative distribution of values across all Skeena watersheds. Data source: DRA [updated monthly, downloaded Dec 2012], FTEN [updated daily, downloaded Dec 2012], NTS [1998].
32. Mining development (total number of mines). Total number of mines in each watershed within the CU spawning ZOI. The general footprint of a mine and its associated processes of mining can change geomorphology and the hydrological processes of nearby water bodies. Mining can also generate deposition of fine sediments which can affect salmon survival and prey densities. The defined benchmark of concern (lower & higher) for mines is a binary measure based simply on presence/absence of the pressure in the watershed. Data source: BCGOV MEM & PR databases [updated regularly, accessed Dec 2012].
Page 8
Water Quality
33. Mining development (acid generating mines). Total number of acid generating mines in each watershed within the CU spawning ZOI. Acid generating mines have increased risk for potential outflow of acidic water, heavy metals and other contaminants, with associated harm to fish habitats. The defined benchmark of concern (lower & higher) for acid generating mines is a binary measure based on presence/absence of the pressure in the watershed. Data source: BCGOV MEM & PR databases [updated regularly, accessed Dec 2012], Skeena TAC identification of acid generating mines [2012].
34. Permitted waste water discharges. Total number of permitted waste water discharge sites in each watershed within the CU spawning ZOI. High levels of waste water discharge have the potential to impact water quality through excessive nutrient enrichment or chemical contamination. The defined benchmark of concern (lower & higher) for waste water discharge sites is a binary measure based simply on presence/absence of the pressure in the watershed. Data source: MOE Wastewater Discharge and Permits database [updated regularly, downloaded Dec 2012].
Page 9
Future pressure
Proposed resource development projects (as of 2010)
35. Skeena overview map of the locations of new resource development projects proposed within the Skeena Basin (across a range of activities). This map includes an overlay of the CU rearing/migration and spawning ZOIs to show the locations of proposed new resource development projects in relation to watersheds used by this CU. Data source: Skeena TAC, extracted from multiple sources [2012].
SummariesSalmon Habitat Report Cards:
6
36. CU summary of resource development projects. The total number or extent of resource development related projects that are known to be proposed for future development within watersheds affecting the CU (i.e., within rearing/migration and spawning ZOIs), and the potential increases (total and %) in these pressures (if any) over the current baselines. Data source: Skeena TAC, extracted from multiple sources [2012].
Additional notes
Key to interpreting pressure indicator box plots:
Data deficient areas. Mapped areas delineated as “data deficient” are those that have incomplete coverage for the core VRI or LCC2000 GIS data used for generation of some habitat indicators. These areas are mapped explicitly to identify any watersheds that have some level of relative uncertainty around a particular habitat indicator value. These areas have either been supplemented (i.e., patched) with GIS data from alternate sources, sometimes at a coarser resolution, to allow indicator generation/scoring, or else are areas lacking only minor elements of a larger suite of data components with limited influence on the final derived habitat indicator values.
MOF (B.C. Ministry of Forests). 2001. Watershed assessment procedure guidebook. 2nd ed., Version 2.1, Forest Practices Branch, Ministry of Forests, Victoria, B.C. Forest Practices Code Guidebook.
Paul, M.J., and J.L. Meyer. 2001. Streams in the urban landscape. Annual Review of Ecological Systems. 32: 333-365.
Porter, M., D. Pickard, S. Casley, N. Ochoski, K. Bryan, and S. Huang. 2013. Skeena lake sockeye Conservation Units: Habitat report cards. Prepared by ESSA Technologies Ltd. for the Pacific Salmon Foundation, Vancouver, BC.
Porter, M., D. Pickard, S. Casley, and N. Ochoski. 2014. Skeena salmon Conservation Units habitat report cards: Chinook, coho, pink, chum, and river sockeye. Prepared by ESSA Technologies Ltd. for the Pacific Salmon Foundation, Vancouver, BC.
Smith, C.J. 2005. Salmon habitat limiting factors in Washington State. Washington State Conservation Commission, Olympia, Washington.
Stalberg, H.C., R.B. Lauzier, E.A MacIsaac, M. Porter, and C. Murray. 2009. Canada’s policy for conservation of wild pacific salmon: Stream, lake, and estuarine habitat indicators. Can. Manuscr. Fish. Aquat. Sci. 2859. http://www.dfo-mpo.gc.ca/Library/338996.pdf.
Tripp, D.B., and S. Bird. 2004. Riparian effectiveness evaluation. Ministry of Forests Research Branch, Victoria, BC.
Acknowledgements
The Pacific Salmon Foundation and ESSA Technologies Ltd. would like to sincerely thank the members of the Skeena Technical Advisory Committee (TAC) for giving of their time and knowledge to guide the development of these CU habitat report cards. Their assistance has been invaluable. The following people participated in one or more workshops and many also contributed data to the project: Mark Cleveland, Sandra Devcic, David DeWitt, Alana Dickson, Hannes Eddinger, Jessica Hawryshyn, Walter Joseph, Derek Kingston, Greg Knox, Siegi Kriegl, Chrissy Melymick, Lana Miller, Don Morgan, Johanna Pfalz, Ken Rabnett, and Bruce Watkinson.
We would also like to offer our thanks to the following additional people and organizations for generously providing data towards this project: Selina Agbayani (WWF-Canada), Matthew Beedle, James Casey (WWF-Canada), Barb Faggetter, North Coast-Skeena First Nations Stewardship Society, Craig Outhet (NCFSNSS), Ron Ptolemy, Skeena Wild Conservation Trust, Russell Smith, Jack Stanford, World Wildlife Fund Canada.
This project is funded by the Gordon and Betty Moore Foundation.