ASIAN DEVELOPMENT BANK ADB ECONOMICS WORKING PAPER SERIES NO. 496 August 2016 SKILLS AND ACTIVITY UPGRADING IN GLOBAL VALUE CHAINS: TRENDS AND DRIVERS FOR ASIA Gaaitzen de Vries, Quanrun Chen, Rana Hasan, and Zhigang Li
Transcript
ASIAN DEVELOPMENT BANK
AsiAn Development BAnk6 ADB Avenue, Mandaluyong City1550 Metro Manila, Philippineswww.adb.org
Skills and Activity Upgrading in Global Value Chains: Trends and Drivers for Asia
This paper examines the main trends and drivers of upgrading by Asian countries in global value chains using the newly constructed ADB multiregion input–output tables in combination with occupation data. Our results suggest an ongoing specialization process in high-income Asian countries and in developing member countries toward high-skilled knowledge-intensive activities. The pace of upgrading differs across Asian countries. We use a structural decomposition method to account for the drivers of the trends observed. In particular, technological change in global value chains that is biased toward skilled activities is important in accounting for the trends observed.
About the Asian Development Bank
ADB’s vision is an Asia and Pacific region free of poverty. Its mission is to help its developing member countries reduce poverty and improve the quality of life of their people. Despite the region’s many successes, it remains home to half of the world’s extreme poor. ADB is committed to reducing poverty through inclusive economic growth, environmentally sustainable growth, and regional integration.
Based in Manila, ADB is owned by 67 members, including 48 from the region. Its main instruments for helping its developing member countries are policy dialogue, loans, equity investments, guarantees, grants, and technical assistance.
adb economicsworking paper series
NO. 496
august 2016
SkillS AND ACTiViTy UpGrADiNG iN GlOBAl VAlUe ChAiNS: TreNDS AND DriVerS fOr ASiAGaaitzen de Vries, Quanrun Chen, Rana Hasan, and Zhigang Li
ADB Economics Working Paper Series
Skills and Activity Upgrading in Global Value Chains: Trends and Drivers for Asia Gaaitzen de Vries, Quanrun Chen, Rana Hasan, and Zhigang Li
No. 496 | August 2016
Gaaitzen de Vries ([email protected]) is assistantprofessor at the Groningen Growth and Development Centre, University of Groningen. Quanrun Chen ([email protected]) is assistant professor of Economics at the University of International Business and Economics. Rana Hasan ([email protected]) is director and Zhigang Li ([email protected]) is economist at the Economic Research and Regional Cooperation Department, Asian Development Bank (ADB). This paper benefited from detailed discussions with Mahinthan Joseph Mariasingham on the ADB Multi-Region Input-Output database used here and comments and discussions with participants at the ADB 2016 Key Indicators workshop in Manila, January 2016.
Creative Commons Attribution 3.0 IGO license (CC BY 3.0 IGO)
Asian Development Bank.Skills and activity upgrading in global value chains: Trends and drivers for Asia.
Mandaluyong City, Philippines: Asian Development Bank, 2016.
1. Functional upgrading. 2. Global multiregional input–output model. 3. Global supply chains.4. Structural decomposition analysis. 5. World input-output database. I. Asian Development Bank.
The views expressed in this publication are those of the authors and do not necessarily reflect the views and policies of the Asian Development Bank (ADB) or its Board of Governors or the governments they represent.
ADB does not guarantee the accuracy of the data included in this publication and accepts no responsibility for any consequence of their use. The mention of specific companies or products of manufacturers does not imply that they are endorsed or recommended by ADB in preference to others of a similar nature that are not mentioned.
By making any designation of or reference to a particular territory or geographic area, or by using the term “country” in this document, ADB does not intend to make any judgments as to the legal or other status of any territory or area.
This work is available under the Creative Commons Attribution 3.0 IGO license (CC BY 3.0 IGO) https://creativecommons.org/licenses/by/3.0/igo/. By using the content of this publication, you agree to be bound by the terms of this license.
This CC license does not apply to non-ADB copyright materials in this publication. If the material is attributed to another source, please contact the copyright owner or publisher of that source for permission to reproduce it. ADB cannot be held liable for any claims that arise as a result of your use of the material.
Development Bank. All rights reserved. The quality of this translation and its coherence with the original text is the sole responsibility of the [translator]. The English original of this work is the only official version.
authors and do not necessarily reflect the views and policies of ADB or its Board of Governors or the governments they represent. ADB does not endorse this work or guarantee the accuracy of the data included in this publication and accepts no responsibility for any consequence of their use.
Please contact [email protected] if you have questions or comments with respect to content, or if you wish to obtain copyright permission for your intended use that does not fall within these terms, or for permission to use the ADB logo.
Notes:1. In this publication, “$” refers to US dollars.2. Corrigenda to ADB publications may be found at: http://www.adb.org/publications/corrigenda
CONTENTS TABLES AND FIGURES iv ABSTRACT v I. INTRODUCTION 1 II. JOBS IN GLOBAL VALUE CHAINS: CONCEPT, DATA, AND EXAMPLES 2 A. Data 3 B. Global Value Chain Example 4 III. MAIN TRENDS IN SKILL AND ACTIVITY UPGRADING 6 IV. ACCOUNTING FOR THE DRIVERS OF CHANGES IN JOBS BY SKILL AND ACTIVITY ACROSS ASIAN COUNTRIES 10 A. Trade 13 B. Technology 13 C. Consumption 14 V. MAIN DRIVERS OF SKILL AND ACTIVITY UPGRADING 14 VI. CONCLUDING REMARKS 18 APPENDIX 19 REFERENCES 23
TABLES AND FIGURES TABLES 1 An Accounting Framework for Global Value Chains 3 2 Manufactures GVC Jobs by Sector, 2000 and 2011 7 3 Manufactures GVC Workers by Skill Type, 2000 and 2011 and Change 8 4 Manufactures GVC Workers by Business Activity, 2000 and 2011 and Change 9 5 Decomposition of Change in Jobs by Skill Type, Total Economy 16 6 Decomposition of Change in Jobs by Business Activity, Total Economy 17 A.1 Supplement to Table 3; Direct Manufactures GVC Workers
by Skill Type, 2000 and 2011 and Change 19 A.2 Supplement to Table 3; Indirect Manufactures GVC Workers
by Skill Type, 2000 and 2011 and Change 19 A.3 Supplement to Table 4; Direct Manufactures GVC Workers
by Business Activity, 2000 and 2011 and Change 20 A.4 Supplement to Table 4; Indirect Manufactures GVC Workers
by Business Activity, 2000 and 2011 and Change 20 A.5 Supplement to Table 5; Decomposition of Change in Jobs
by Skill Type, Total Economy 21 A.6 Supplement to Table 6; Decomposition of Change in Jobs
by Business Activity, Total Economy 22 FIGURES 1 GVC Jobs in Chinese Electronics 5 2 Change in Employment Share of GVC Workers by Activity, 2000–2001 10
ABSTRACT This paper examines the trends in skill and activity upgrading in global value chains (GVCs) and the drivers of upgrading in Asian economies. It uses the newly constructed ADB Multi-Region Input-Output Tables as well as occupation data on jobs by educational attainment and business activities, namely research and development; production; logistics, sales, and marketing; administration and back-office; and headquarter activities. Our results suggest an ongoing specialization process in high-income Asian countries and in developing member countries (DMCs) toward high-skilled knowledge-intensive activities. The pace of upgrading differs across Asian countries, being more rapid and encompassing in the People’s Republic of China in comparison to other DMCs. We use a structural decomposition method to account for the drivers of the trends observed. In particular, technological change in GVCs that is biased toward knowledge-intensive activities is important in accounting for the trends observed. Keywords: functional upgrading, global multiregional input–output model, global supply chains, structural decomposition analysis, World Input-Output Database JEL codes: D57, F16, F63
I. INTRODUCTION The employment structure in Asia is rapidly evolving. Throughout the region, the workforce is moving out of agriculture. It is also becoming more educated as the average years of schooling of Asia’s population has risen from around 4 years in 1970 to 8 years in 2010 (ADB 2015a) and the share of tertiary educated youth (those aged between 15 and 29) has rapidly increased. Concomitant to the increase in educational attainment, there is an ongoing expansion of production networks in Asia. Baldwin and Lopez-Gonzalez (2015) document the rapid emergence and expansion of Factory Asia during the past decades. At the same time, Felipe, Mehta, and Rhee (2015) emphasize premature deindustrialization in Asia. They argue manufacturing employment shares have peaked at (too) low levels of economic development. How are these trends connected? Do Asian economies that educate their workforce also upgrade in global value chains (GVCs) by increasingly undertaking more skill-intensive services activities instead of core production activities?
A rich literature uses case studies to examine upgrading. This literature identifies upgrading
trajectories by companies, initially focusing on production to ultimately branding their own manufactures (Gereffi 1999). As firms upgrade, they acquire new functions in GVCs, such as design or marketing that require enhanced human competences (Humphrey 2004). Thus, the increase in skills of Asia’s labor force is seen as going hand in hand with upgrading in chains. So far, however, much of the analysis has been qualitative. We lack information about macro trends of upgrading by Asian countries in GVCs.
Analyzing upgrading in GVCs and quantifying the drivers that account for the trends observed
is not straightforward. A major bottleneck is the empirical identification of global supply chains and their evolution. Typically, use is made of measures of foreign direct investment, imports, and exports over GDP or the share of intermediate imports in overall imports. But even when this type of data is available, it still does not capture how activities are combined in global supply chains.
One of the contributions of this paper is the adaptation of empirical methods for identifying
GVCs and to measure the participation of Asian economies in these value chains. Another contribution we make is the estimation of the job content of trade, where we distinguish between different activities and skill types. What matters for the effect of expanding production networks on domestic labor demand is its job content, which can only be inferred from data on the skill or activity content of all activities carried out by a country that is involved in GVCs (Krugman 2008).
Our analysis is a relevant extension of what has been done so far. Recently, researchers have
measured the domestic value added content of exports (see, for example, ADB 2015b). This provides important information on the income generated by Asian countries from participating in GVCs. An increase in the domestic content of exports may signal the substitution of domestic for imported intermediate inputs (Kee and Tang 2015). However, changes in the domestic value added of exports are not necessarily informative of upgrading in GVCs as changes in the domestic content may originate from alterations that have little to do with upgrading. For example, an increase in the share of domestic value added may simply come from changes in the industry composition (e.g., a shift toward natural resource exports that typically have a higher share of domestic content). In addition, these studies do not examine the job content of exports. Generating jobs—good jobs—in GVCs is typically of primary concern to policy makers.
We examine functional upgrading in GVCs defined as the integration or the move into more
sophisticated knowledge-intensive activities in GVCs (Humphrey and Schmitz 2002). A typical
2 | ADB Economics Working Paper Series No. 496
industrial upgrading pattern would be from doing mainly assembly activities to own-equipment manufacturing to ultimately own-brand manufacturing (Gereffi 1999). This will be reflected in increasing employment shares of more skill-intensive activities by Asian economies in GVCs. In particular, we would expect a shift from production to research and development (R&D), design, and marketing activities.
As such, the perspective in this paper shifts from a pure sector focus on manufacturing toward a
focus on activities undertaken. Historically, industrialization is intimately related to economic development (Felipe, Mehta, and Rhee 2015). Premature deindustrialization is therefore an important concern for academics and policy makers. However, manufacturing firms in Asia may have been actively engaged in outsourcing services activities. In addition, the reorganization of global supply chains increasingly relates to the organization of business support functions (e.g., call centers, information and communications technology support; see Sturgeon and Gereffi 2009), which mainly take place in services sectors. A focus on activities is therefore necessary and adds new information about the development path of Asian countries.
We have collected new data on the use of labor by industry classified by occupation and
educational attainment in various Asian economies. This data is combined with World Input-Output Tables (WIOT) to analyze upgrading in GVCs in a number of Asian economies, namely Bangladesh; India; Indonesia; Japan; Malaysia; the Philippines; the People’s Republic of China (PRC); the Republic of Korea; Taipei,China; Thailand; and Viet Nam. We also present results on the relative importance of the drivers that account for changes in skill and functional labor demand for a limited set of Asian economies.
The paper is organized as follows. In section II, the data and GVC concept is introduced and
illustrated using the Chinese electronics GVC. Section III describes the main trends in skill/functional upgrading in GVCs across Asian countries. We then evaluate to what extent the changes in jobs per skill/function type and country can be explained by each of the different channels affecting labor demand in sections IV (method) and V (results). Section VI provides concluding remarks.
II. JOBS IN GLOBAL VALUE CHAINS: CONCEPT, DATA, AND EXAMPLES The GVC approach measures the contribution of countries to global production. It captures the jobs generated in a country by participating in global production of a particular set of products, abbreviated by the terms “GVC jobs” (Timmer et al. 2014). Meng, Peters, and Wang (2015) label this approach a backward industrial-linkage-based decomposition as it identifies all production stages of a final good or service in a GVC. It answers the question how much jobs a country adds to the global production of a particular set of final products.
A particular row in Table 1 provides information on the jobs from a particular country-industry to all GVCs in the world. Obviously, this includes jobs in the production of its own final products, but also jobs for production in other GVCs, by means of delivering intermediate inputs. Note that this includes jobs delivered directly to the industry-of-completion, but also indirectly through other industries.1 1 It is important to note that a country’s manufactures GVC jobs reflects work related to a particular set of activities, namely those directly and
indirectly related to the production of final manufactures. This includes activities in the manufacturing sector itself but also in supporting industries such as business, transport and communication, and financial services through the delivery of intermediate inputs. These indirect contributions will be explicitly accounted for through the modeling of input–output linkages across sectors. Consider the example of car
Skills and Activity Upgrading in Global Value Chains: Trends and Drivers for Asia | 3
Table 1: An Accounting Framework for Global Value Chains
Final Products of a Global Value Chain, Identified by Country-Industry of Completion Jobs
Country 1 … Country M Industry 1 … Industry N … Industry 1 … Industry N
Jobs from country-industries participating in global value chains
Country 1 Industry 1 …
Industry N … …
Country M Industry 1 …
Industry N Total jobs for each GVC World jobs
GVC = global value chain. Note: Cell values represent the jobs generated in the country-industry given in the row, within the global value chain corresponding to the country-industry of completion given by the column. Source: Modification of Figure 1 in Timmer et al. (2014).
In this section and the next, we focus on the contribution to the global production of final manufacturing goods, denoted by the term “manufactures.” Production systems of manufactures are highly prone to international fragmentation, as activities have a high degree of international contestability: they can be undertaken in any country with little variation in quality. GVC jobs of a country are then defined as the contribution of its industries to the global production of manufactures. The GVC jobs of a country in global production of manufactures is equal to the sum of jobs by all its industries to the production of all final manufacturing goods where the last stage of production takes place in any country in the world. Note that this includes not only activities in the manufacturing sector, but also activities in all other sectors, such as agriculture, utilities, business services, and so on, that provide inputs in any stage of the production process. A. Data We combine WIOT with detailed information on jobs. For the GVC analysis in the first part of this paper, we use the ADB Multi-Region Input-Output Tables (MRIOs; see Mariasingham 2015). ADB has added more Asian economies to the WIOT that were constructed in the World Input-Output Database (WIOD) project. This to facilitate analysis related to the Asia and Pacific region. Five Asian countries, Bangladesh, Malaysia, the Philippines, Thailand, and Viet Nam, have been added. This comes on top of the Asian economies that were already available in the WIOTs, namely the PRC; Japan; the Republic of Korea; India; Indonesia; and Taipei,China.
To account for the drivers of changes in jobs in the second part of this paper, we use a structural decomposition method. This structural decomposition analysis requires WIOTs in previous years’ prices. Tables in previous years’ prices are only available in the original WIOD project and not in
production in the Republic of Korea. Demand for Korean cars will in first instance raise the output of the Republic of Korea’s car industry. But production in this industry relies on parts and components that are produced elsewhere, such as engines, braking systems, car bodies, paint, seat upholstery or window screens, but also energy, and various business services such as logistics, transport, marketing and financial services. These intermediate goods and services need to be produced as well, thus raising output in the industries delivering these, say the Japanese business services industry, the Czech braking systems industry and the Indian textile industry.
4 | ADB Economics Working Paper Series No. 496
the ADB MRIOs. Hence we can only account for the drivers of changes in jobs in the PRC; Japan; the Republic of Korea; India; Indonesia; and Taipei,China.
The MRIO tables are an important improvement of the existing statistical framework, because
it allows one to examine and study the implications of global production fragmentation. However, there is substantial scope for improving these tables. Timmer et al. (2015) discuss possible improvements and extensions of the tables. One particular limiting assumption in the tables is the assumption of homogeneity within industries. A column in an MRIO table only provides the average production structure across all firms in a particular industry. But these production structures might be rather different for various types of firms. For example, Chen et al. (2012) and Koopman, Wang, and Wei (2012) found that for the PRC the import content of exports differed substantially between foreign processing firms and domestic firms. Likewise, there are differences in trade and interindustry relations between formal and informal firms. Typically, informal firms are less active in exporting goods directly and often also indirectly. Hence, using average production structures across all firms in an industry may imply that the employment effects are exaggerated. Incorporating information on heterogeneity in production processes from firm-level data is an important avenue for future work, since aggregation errors in value chain analyses would be reduced.
Information on jobs by skill type and business activity is obtained from labor force surveys (LFSs). For the countries that are included in the WIOD project, detailed socioeconomic accounts are already available. We used these to get information on jobs by skill type. This data is available annually from 1995 to 2009. Employment by industry data is available until 2011. We applied skill shares from 2009 to employment by industry data for 2010 and 2011. To obtain data by business activity we used occupational employment data, described in Timmer and de Vries (2015). In contrast to Timmer and de Vries (2015), this study uses better and more detailed information on occupations by industry for the PRC based on the 2000 and 2010 population census and for India based on various rounds of the National Sample Survey.
For the five additional Asian countries included in the ADB MRIO we estimated jobs by skill type
and business activity, where we closely followed the approach by Timmer and de Vries (2015). For Bangladesh we used the 2006 LFS; for Malaysia, the 2000 population census; for the Philippines, the 2004, 2009, and 2013 LFS; for Viet Nam, the 2007 and 2013 LFS; and for Thailand, the 2000, 2005, and 2010 LFS. Shares were approximated for those years for which we did not have the necessary data. For example, shares from the 2013 LFS for the Philippines are assumed fixed and also used for 2011. We applied these skill and activity shares to employment estimates by industry in order to have the annual number of jobs by skill type and activity. Employment by broad sectors was obtained from the ADB Key Indicators. Value added by industry is available from the ADB MRIOs and industries within the same broad industry are assumed to have the same labor productivity to estimate employment by industry.
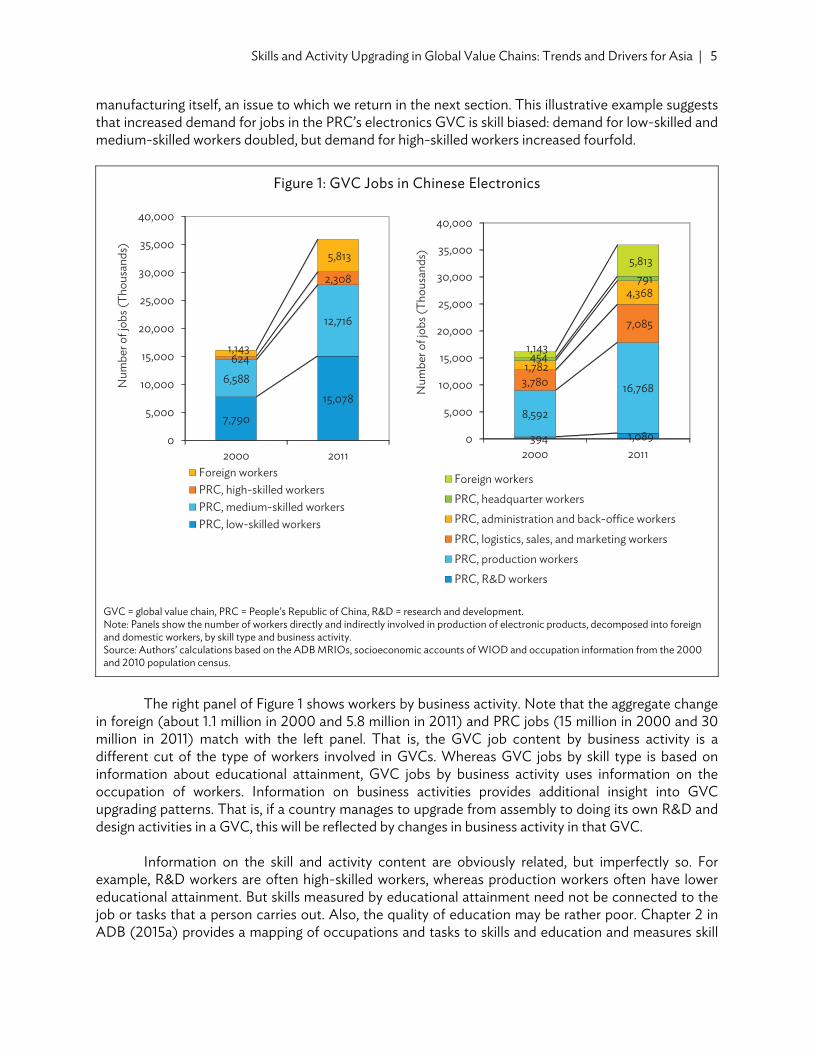
B. Global Value Chain Example Figure 1 shows an illustration of the GVC concept for final electronics equipment products from the PRC. Basically, the GVC of electronics equipment in the PRC is a column in Table 1 and the rows in that column give the jobs originating from a country-industry participating in the Chinese electronics GVC. The left panel of Figure 1 shows workers by skill type involved in the production of Chinese electronic products. Our findings suggest that increased demand for Chinese electronic products resulted in an increase in jobs in the PRC, from about 15 million in 2000 to 30 million in 2011. Note that these are jobs both directly as well as indirectly involved in the production of Chinese final electronic products and hence these jobs can originate from industries outside of the electronics
Skills and Activity Upgrading in Global Value Chains: Trends and Drivers for Asia | 5
manufacturing itself, an issue to which we return in the next section. This illustrative example suggests that increased demand for jobs in the PRC’s electronics GVC is skill biased: demand for low-skilled and medium-skilled workers doubled, but demand for high-skilled workers increased fourfold.
Figure 1: GVC Jobs in Chinese Electronics
GVC = global value chain, PRC = People’s Republic of China, R&D = research and development. Note: Panels show the number of workers directly and indirectly involved in production of electronic products, decomposed into foreign and domestic workers, by skill type and business activity. Source: Authors’ calculations based on the ADB MRIOs, socioeconomic accounts of WIOD and occupation information from the 2000 and 2010 population census.
The right panel of Figure 1 shows workers by business activity. Note that the aggregate change
in foreign (about 1.1 million in 2000 and 5.8 million in 2011) and PRC jobs (15 million in 2000 and 30 million in 2011) match with the left panel. That is, the GVC job content by business activity is a different cut of the type of workers involved in GVCs. Whereas GVC jobs by skill type is based on information about educational attainment, GVC jobs by business activity uses information on the occupation of workers. Information on business activities provides additional insight into GVC upgrading patterns. That is, if a country manages to upgrade from assembly to doing its own R&D and design activities in a GVC, this will be reflected by changes in business activity in that GVC.
Information on the skill and activity content are obviously related, but imperfectly so. For
example, R&D workers are often high-skilled workers, whereas production workers often have lower educational attainment. But skills measured by educational attainment need not be connected to the job or tasks that a person carries out. Also, the quality of education may be rather poor. Chapter 2 in ADB (2015a) provides a mapping of occupations and tasks to skills and education and measures skill
Foreign workersPRC, headquarter workersPRC, administration and back-office workersPRC, logistics, sales, and marketing workersPRC, production workersPRC, R&D workers
Num
ber o
f job
s (Th
ousa
nds)
Num
ber o
f job
s (Th
ousa
nds)
6 | ADB Economics Working Paper Series No. 496
mismatches. Using occupations data is more appropriate if skill mismatches are pervasive. We use detailed occupations to map workers into different business activities.2 Clearly, business functions at both ends of the GVC (R&D at the upstream end; and logistics, sales, marketing, and headquarter activities at the downstream end) are typically associated with higher skill requirements.
Our findings suggest rapid growth in the amount of PRC’s R&D workers involved in the
electronics GVC of the PRC. This growth was faster compared to growth of production workers and administration and back-office workers. In addition, headquarter workers expanded from about 454 thousand in 2000 to 791 thousand in 2011. However, it should be noted that most GVC jobs in 2011 still relate to production (16.8 million workers) and back-office (7.1 million) activities, reflecting the PRC’s strong comparative advantage in these activities.
III. MAIN TRENDS IN SKILL AND ACTIVITY UPGRADING This section describes aggregate trends in the distribution of jobs in GVCs using the method that was introduced in the previous section. We will use the ADB MRIOs in this section to be able to examine upgrading in more Asian countries.3 We will use the term ‘manufactures’ to denote all production activities that are directly or indirectly involved in the production of final manufacturing goods. Production of manufacturing products is prone to international fragmentation as many activities have a high degree of international “contestability”—i.e. they can be undertaken in any country, usually with little variation in quality. It is important to note that GVCs of manufactures do not necessarily include all activities in the manufacturing sector, and neither all activities that are internationally contestable. Some activities in the manufacturing sector are geared toward production of intermediates for final nonmanufacturing products and services and are not part of manufactures GVCs, such as the use of cement in the construction industry. On the other hand, GVCs of manufactures also include jobs outside the manufacturing sector, such as business services, transport and communication and finance, and in raw materials production. These indirect contributions will be explicitly accounted for through the modeling of input–output linkages across sectors.
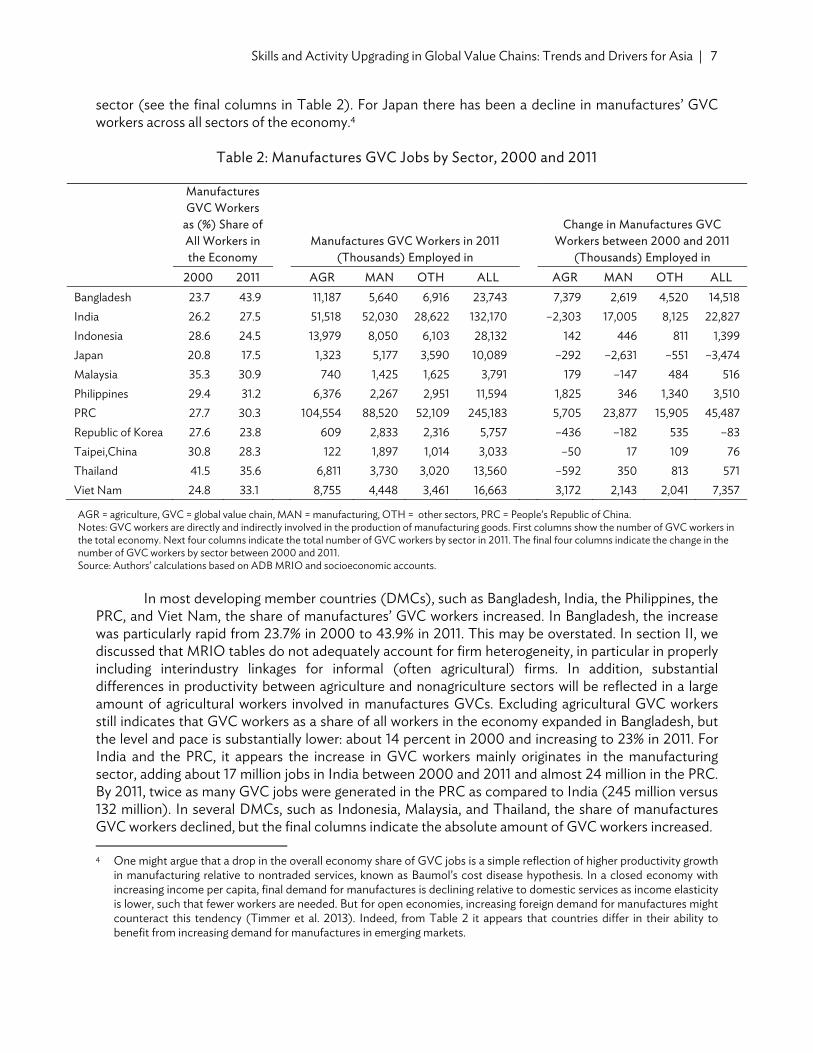
We use the number of workers per unit of output to trace the number of workers directly and indirectly involved in the production of manufacturing goods and their sector of employment. Results are shown in Table 2. Columns (1) and (2) show the share of GVC jobs in total employment. The next four columns show the sectoral employment structure, where we distinguish between agriculture, manufacturing, and other sector jobs. The final four columns show the change in jobs by sector over the period from 2000 to 2011.
The first two columns in Table 2 are indicative of the increasing (or decreasing) importance of
manufacturing GVCs in providing jobs across Asia. The findings suggest substantial differences across economies. In several high-income East Asian economies, namely Japan; the Republic of Korea; and Taipei,China, the employment share of GVC workers declined. For the Republic of Korea, we observe a shift in employment of GVC workers, away from the manufacturing sector and toward the services
2 Linking all these occupations to skills, tasks, and education is outside the scope of the current paper. 3 Calculations using the WIOTs indicate that the main trends identified here do not differ substantially for Asian countries
distinguished in the WIOTs. This suggests that analysis based on the ADB MRIOs or the WIOTs is qualitatively similar.
Skills and Activity Upgrading in Global Value Chains: Trends and Drivers for Asia | 7
sector (see the final columns in Table 2). For Japan there has been a decline in manufactures’ GVC workers across all sectors of the economy.4
Table 2: Manufactures GVC Jobs by Sector, 2000 and 2011
Manufactures GVC Workers
as (%) Share of All Workers in the Economy
Manufactures GVC Workers in 2011 (Thousands) Employed in
Change in Manufactures GVC Workers between 2000 and 2011
(Thousands) Employed in 2000 2011 AGR MAN OTH ALL AGR MAN OTH ALL
AGR = agriculture, GVC = global value chain, MAN = manufacturing, OTH = other sectors, PRC = People’s Republic of China. Notes: GVC workers are directly and indirectly involved in the production of manufacturing goods. First columns show the number of GVC workers in the total economy. Next four columns indicate the total number of GVC workers by sector in 2011. The final four columns indicate the change in the number of GVC workers by sector between 2000 and 2011. Source: Authors’ calculations based on ADB MRIO and socioeconomic accounts.
In most developing member countries (DMCs), such as Bangladesh, India, the Philippines, the
PRC, and Viet Nam, the share of manufactures’ GVC workers increased. In Bangladesh, the increase was particularly rapid from 23.7% in 2000 to 43.9% in 2011. This may be overstated. In section II, we discussed that MRIO tables do not adequately account for firm heterogeneity, in particular in properly including interindustry linkages for informal (often agricultural) firms. In addition, substantial differences in productivity between agriculture and nonagriculture sectors will be reflected in a large amount of agricultural workers involved in manufactures GVCs. Excluding agricultural GVC workers still indicates that GVC workers as a share of all workers in the economy expanded in Bangladesh, but the level and pace is substantially lower: about 14 percent in 2000 and increasing to 23% in 2011. For India and the PRC, it appears the increase in GVC workers mainly originates in the manufacturing sector, adding about 17 million jobs in India between 2000 and 2011 and almost 24 million in the PRC. By 2011, twice as many GVC jobs were generated in the PRC as compared to India (245 million versus 132 million). In several DMCs, such as Indonesia, Malaysia, and Thailand, the share of manufactures GVC workers declined, but the final columns indicate the absolute amount of GVC workers increased. 4 One might argue that a drop in the overall economy share of GVC jobs is a simple reflection of higher productivity growth
in manufacturing relative to nontraded services, known as Baumol’s cost disease hypothesis. In a closed economy with increasing income per capita, final demand for manufactures is declining relative to domestic services as income elasticity is lower, such that fewer workers are needed. But for open economies, increasing foreign demand for manufactures might counteract this tendency (Timmer et al. 2013). Indeed, from Table 2 it appears that countries differ in their ability to benefit from increasing demand for manufactures in emerging markets.
8 | ADB Economics Working Paper Series No. 496
Aggregate changes in jobs are informative about the involvement of countries in GVCs. However, to examine whether countries are upgrading in GVCs we need additional information. In particular, we will examine whether more skilled workers and more knowledge-intensive activities are undertaken across Asia in manufactures GVCs. We will first examine this by analyzing the number of workers by skill type that is needed for the production of manufactured GVC goods. We use skill requirements data where workers in each industry and country are characterized by their educational attainment level. We will distinguish between low-, medium-, and high-skilled GVC workers.
Across Asian economies, a first distinction is apparent between high-income Asian economies (Japan; the Republic of Korea; and Taipei,China) and DMCs. From Table 3 we observe that the change in GVC jobs in the Republic of Korea is unevenly spread across workers by skill type. In particular, the number of low-skilled GVC workers declined by 406 thousand between 2000 and 2011 (a decline of 40% from the initial level), whereas the number of high-skilled workers increased by 502 thousand (an increase of 27%). These relative trends between low- and high-skilled workers are also found for Japan and Taipei,China. This suggests increasing specialization of high-skilled activities in GVCs by high-income Asian economies.
Table 3: Manufactures GVC Workers by Skill Type, 2000 and 2011 and Change
GVC = global value chain, PRC = People’s Republic of China. Notes: GVC workers are directly and indirectly involved in the production of manufacturing goods. See Appendix Tables 1 and 2 where direct and indirect effects are distinguished. Source: Authors’ calculations based on ADB MRIO and socioeconomic accounts.
In most DMCs, there was a formidable increase in low- and medium-skilled GVC workers. In
absolute terms, India and the PRC stand out, but also in Bangladesh, the Philippines, and Viet Nam we observe a substantial increase in GVC workers. These findings are in line with expectations from traditional Heckscher-Ohlin theory of comparative advantage, where one expects that DMCs specialize in their relatively abundantly available factors of production, namely low- and medium-skilled workers.
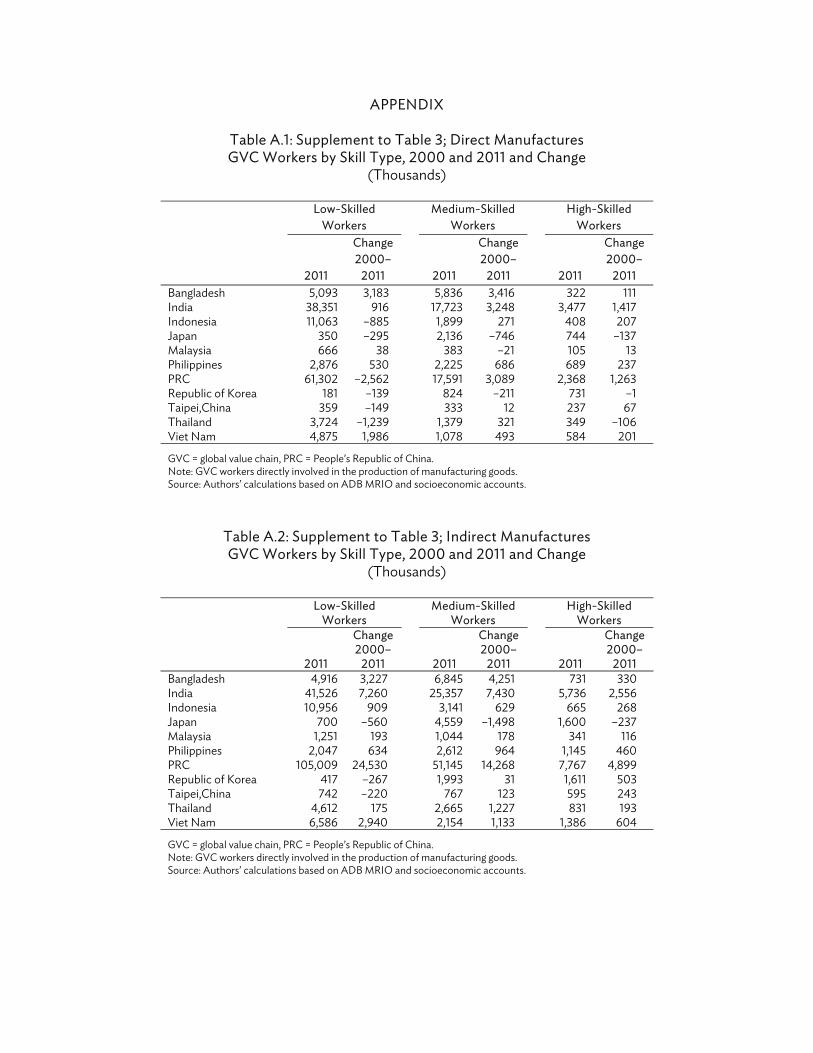
Our findings suggest the PRC generates more GVC jobs for its low-skilled workers compared
to India (166 million in the PRC in 2011 versus 80 million in India). Interestingly, the generation of low-skilled GVC jobs by the PRC seems to mainly originate from indirect activities, such as the delivery of intermediate inputs (see Appendix Tables 1 and 2). Besides the importance of upgrading in GVCs, it is
Skills and Activity Upgrading in Global Value Chains: Trends and Drivers for Asia | 9
also important for emerging Asian countries to provide jobs for its large less-skilled workforce. The PRC appears to be able to do so.
In DMCs, the number of high-skilled workers increased. The relative increase in high-skilled
workers was typically fast, suggesting an upgrading process in GVCs by DMCs although from low initial levels.
We can further examine the specialization of economies in GVCs by studying changes in jobs related to the various business activities in GVCs using occupations data instead of information on workers classified by educational attainment. Table 4 shows changes in jobs across activities. In high-income Asian economies—the Republic of Korea and Taipei,China—there was a decline in production workers involved in manufactures’ GVCs and a rapid increase in R&D workers. This relative pattern is also observed in Japan, but the total number of GVC jobs declined there (both R&D workers directly and indirectly related to the production of manufactures; see Appendix Tables 3 and 4). In contrast, in DMCs the amount of production workers increased. Interestingly, in DMCs we also observe an increase in R&D and headquarter workers, but from low initial levels or small in relative terms.
Figure 2 shows changes in employment shares by activity, based on the information provided in Table 4. Several additional insights emerge from this figure. First, although the number of production GVC workers increased in most Asian economies, the relative employment shares decreased. The increase in the share of production jobs in Bangladesh appears an important exception to this overall trend. Second, in most Asian economies the share of R&D workers; logistics, sales, and marketing workers; and administration and back-office workers increased. This is further indicative evidence of activity upgrading in GVCs by Asian economies. However, the share of headquarter workers only appears to substantially increase in the Republic of Korea and Taipei,China. This suggests that the upgrading process is ongoing across Asia, but proceeds at different speed across economies.
Table 4: Manufactures GVC Workers by Business Activity, 2000 and 2011 and Change (Thousands)
GVC = global value chain, PRC = People’s Republic of China, R&D = research and development. Notes: GVC workers are directly and indirectly involved in the production of manufacturing goods. See Appendix Tables 3 and 4 where direct and indirect effects are distinguished. Source: Authors’ calculations based on ADB MRIO and the occupations database (see main text).
10 | ADB Economics Working Paper Series No. 496
Figure 2: Change in Employment Share of GVC Workers by Activity, 2000–2001
ADM = administrative and back-office; GVC = global value chain; HQ = headquarters; LSM = logistics, sales, and marketing; PRC = People’s Republic of China; PROD = production; RD = research and development. Source: Authors’ calculations based on ADB MRIO and the occupations database (see main text).
IV. ACCOUNTING FOR THE DRIVERS OF CHANGES IN JOBS BY SKILL AND ACTIVITY ACROSS ASIAN COUNTRIES
In this and the subsequent section, we seek to examine the drivers of the changes in GVC workers by skill type and business activity observed in the previous section. This section presents an adaptation of the structural decomposition method introduced by Los, Timmer, and de Vries (2013) to examine what accounts for changes in skill demand and activity upgrading in Asian countries.
We explicitly frame the quantification of changes in GVC jobs in a setting with internationally fragmented global supply chains. To model these international production linkages, we rely on a fundamental input–output identity introduced by Leontief (1936). But in contrast to Leontief’s use of a national input–output table, we consider his input–output identity in a multicountry setting as production processes are unbundled across national borders. Leontief’s identity states that
q=Bq+f,
where q denotes outputs, f is final consumption, and B a world input–output matrix with intermediate input coefficients. The matrix describes how a given product in a country is produced with different combinations of intermediate inputs from anywhere in the world. The identity states that a good is either used as intermediate input in another production process or consumed. This identity can be rewritten as
–10–8–6–4–2
02468
10
Bang
lade
sh
Indi
a
Indo
nesia
Japa
n
Mal
aysia
Phili
ppin
es
PRC
Repu
blic
of K
orea
Taip
ei,C
hina
Thai
land
Viet
Nam
RD PROD LSM ADM HQ
%
Skills and Activity Upgrading in Global Value Chains: Trends and Drivers for Asia | 11
q=(I-B)-1f,
with I an identity matrix.5 (I-B)-1 is the Leontief inverse. It represents the total production value that is directly and indirectly required to produce for final demand. To see this, let z be a vector column with the first element representing the global consumption of iPads produced in the PRC, and the rest zeros. This is the total final output of the Chinese iPad industry. Then Bz is the vector of direct intermediate inputs, both Chinese and foreign, needed to assemble the iPads in the PRC, such as the hard disk drive, battery, and processors. But these intermediates need to be produced as well. B2z indicates the intermediate inputs directly needed to produce Bz, and so on. Thus
2n
n zB represents all intermediate inputs indirectly needed for the iPad production. By adding the final output to all direct and indirect intermediate input requirements, the total gross output value related to the production of final output z is given by
zBIzBzBBzz
n
n
n
n 1
02
)(
.
We can use this insight to derive GVC jobs from any final output value. Let g be the direct
amount of jobs by skill type or activity per unit of gross output. Elements in the vector g are country and industry specific. For example, one element in vector g is the amount of production workers in the Chinese electronics industry to produce $1 of gross output. The elements in g are direct jobs in the industry, as they do not account for jobs embodied in intermediate inputs used by the industry (say the hard disk drive from the Republic of Korea’s electronics industry or the processor from Japan’s electronics industry, which are other elements in the vector g). To measure all direct and indirect jobs, we need to define a matrix A= ĝ(I – B)-1 where A is the matrix of jobs per unit of final demand. Note that, as above, we use the Leontief inverse such that A includes both direct and indirect jobs. The total amounts of jobs that can be attributed to observed levels of final demand can then be found by
Jobsi,b = uk ĝ(I – B)-1f, (1) where Jobsi,b are the total jobs in country i by skill type or activity b, f is an mn-vector with final demand levels for each of the n products delivered by each of the m countries, and uk is an appropriately chosen summation vector.
In what follows, we specify determinants of intertemporal changes in Jobsi,b that affect the product ĝ(I – B)-1 and determinants that affect f. The former effects relate to changes within GVCs, whereas the latter are associated with changes in the relative weights of GVCs.
First, look at demand for final products and trade in final products. We consider three
determinants that account for changes in f. First, total final demand in countries increases as they grow richer. Second, the composition of consumption bundles can change due to Engel effects. For example, if consumers become wealthier in the PRC it is likely that their consumption bundle changes, for example, increasing their demand for cars. Finally, market shares of countries in selling final products might change over time. For example, relocation of electronics assembly activities in Japan to the PRC will imply that market shares of Chinese final electronics products will increase at the expense
5 See Miller and Blair (2009) for an introduction to input–output analysis. Matrices are indicated by boldfaced capital
letters (e.g. B), vectors are columns by definition and are indicated by boldfaced lowercase letters (e.g. q), and scalars (including elements of matrices or vectors) are indicated by italicized letters (e.g. Jobsi,b). A prime indicates transposition (e.g. ). A hat (e.g. ĝ) indicates a diagonal matrix, with the elements of the vector g on the diagonal.
12 | ADB Economics Working Paper Series No. 496
of market shares of Japanese final electronics products. These three factors can be incorporated into the analysis by expressing the final demand vector as6 f ∗
°∗ ∙ ̂ , (2)
where c is an m-vector. Its typical element ci contains total final demand exerted by country i. S* is an mnxm-matrix constructed by stacking m identical nxm-matrices of final demand shares for each of the n outputs. S* reflects consumption bundles of countries. The rows of the nxm matrices that together form S* are obtained by aggregating over final goods supplied by each of the trade partners: if Chinese consumers would spend 0.1 of their total consumption on Chinese food and 0.05 of their total consumption on Thai food, the share of food in Chinese consumption would amount to 0.15. T* is an mnxm-matrix of final product trade coefficients. It reflects market shares of countries in selling final products. It is constructed by stacking mnxm-matrices T, of which the typical element tij represents the share of the country considered in final demand for product i in country j. u is an m-elements summation vector consisting of ones.
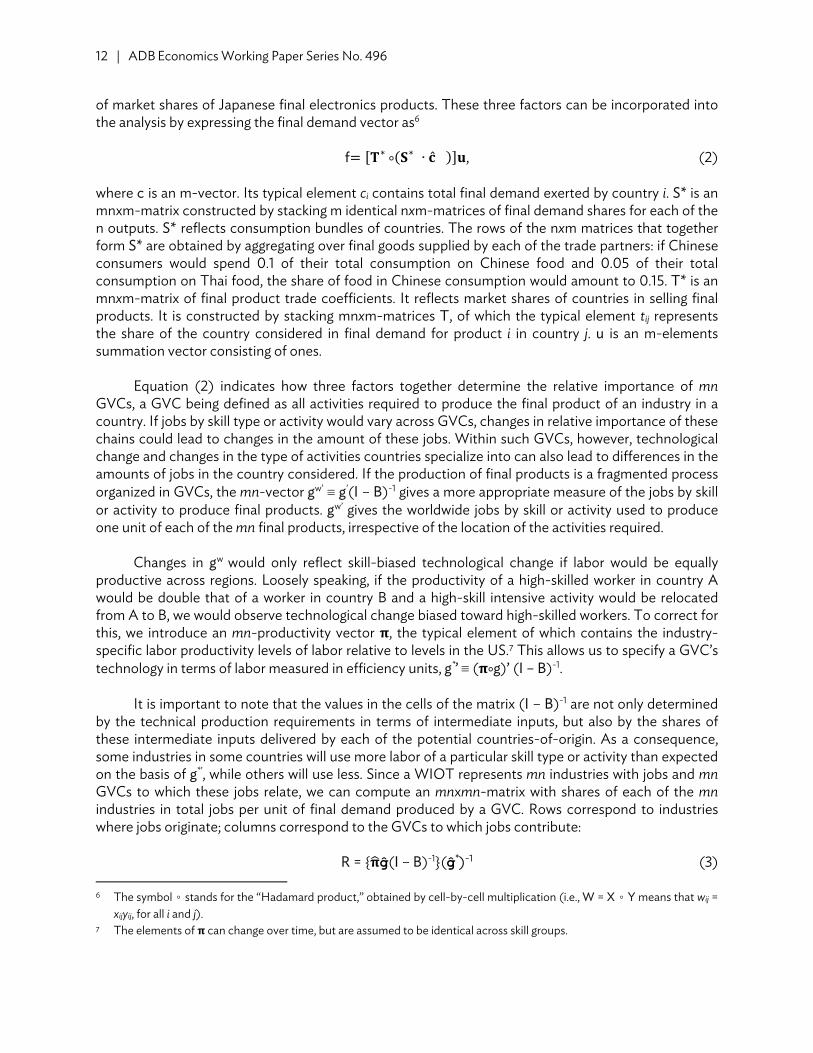
Equation (2) indicates how three factors together determine the relative importance of mn GVCs, a GVC being defined as all activities required to produce the final product of an industry in a country. If jobs by skill type or activity would vary across GVCs, changes in relative importance of these chains could lead to changes in the amount of these jobs. Within such GVCs, however, technological change and changes in the type of activities countries specialize into can also lead to differences in the amounts of jobs in the country considered. If the production of final products is a fragmented process organized in GVCs, the mn-vector gw’ ≡ g’(I – B)-1 gives a more appropriate measure of the jobs by skill or activity to produce final products. gw’ gives the worldwide jobs by skill or activity used to produce one unit of each of the mn final products, irrespective of the location of the activities required.
Changes in gw would only reflect skill-biased technological change if labor would be equally
productive across regions. Loosely speaking, if the productivity of a high-skilled worker in country A would be double that of a worker in country B and a high-skill intensive activity would be relocated from A to B, we would observe technological change biased toward high-skilled workers. To correct for this, we introduce an mn-productivity vector , the typical element of which contains the industry-specific labor productivity levels of labor relative to levels in the US.7 This allows us to specify a GVC’s technology in terms of labor measured in efficiency units, g*’ ≡ ( °g)’ (I – B)-1.
It is important to note that the values in the cells of the matrix (I – B)-1 are not only determined
by the technical production requirements in terms of intermediate inputs, but also by the shares of these intermediate inputs delivered by each of the potential countries-of-origin. As a consequence, some industries in some countries will use more labor of a particular skill type or activity than expected on the basis of g*’, while others will use less. Since a WIOT represents mn industries with jobs and mn GVCs to which these jobs relate, we can compute an mnxmn-matrix with shares of each of the mn industries in total jobs per unit of final demand produced by a GVC. Rows correspond to industries where jobs originate; columns correspond to the GVCs to which jobs contribute: R = { ĝ(I – B)-1}(ĝ*)-1 (3) 6 The symbol ◦ stands for the “Hadamard product,” obtained by cell-by-cell multiplication (i.e., W = X ◦ Y means that wij =
xijyij, for all i and j). 7 The elements of can change over time, but are assumed to be identical across skill groups.
Skills and Activity Upgrading in Global Value Chains: Trends and Drivers for Asia | 13
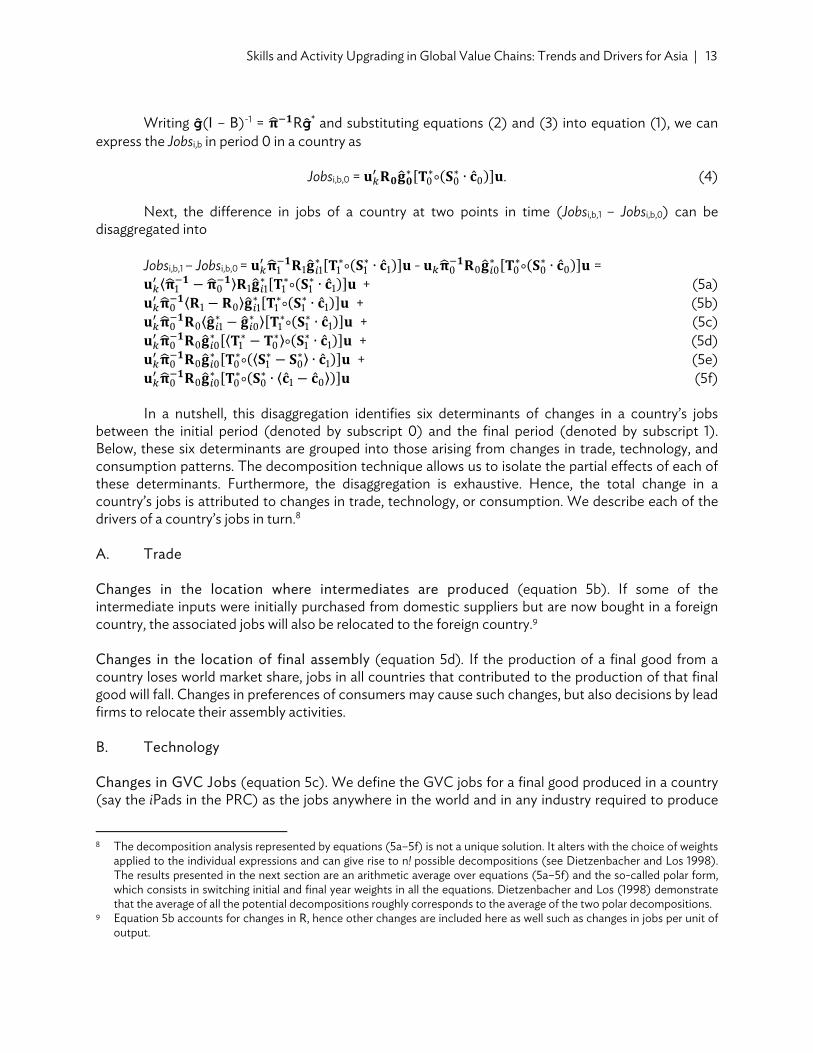
Writing ĝ(I – B)-1 = Rĝ* and substituting equations (2) and (3) into equation (1), we can
express the Jobsi,b in period 0 in a country as Jobsi,b,0 = ∗ ∗
°∗ ∙ ̂ . (4)
Next, the difference in jobs of a country at two points in time (Jobsi,b,1 – Jobsi,b,0) can be
disaggregated into
Jobsi,b,1 – Jobsi,b,0 = ∗ ∗°
∗ ∙ ̂ - ∗ ∗°
∗ ∙ ̂ = ⟨ ⟩ ∗ ∗
°∗ ∙ ̂ + (5a)
⟨ ⟩ ∗ ∗°
∗ ∙ ̂ + (5b) ⟨ ∗ ∗ ⟩ ∗
°∗ ∙ ̂ + (5c)
∗ ⟨ ∗ ∗⟩°∗ ∙ ̂ + (5d)
∗ ∗° ⟨
∗ ∗⟩ ∙ ̂ + (5e) ∗ ∗
°∗ ∙ ⟨ ̂ ̂ ⟩ (5f)
In a nutshell, this disaggregation identifies six determinants of changes in a country’s jobs
between the initial period (denoted by subscript 0) and the final period (denoted by subscript 1). Below, these six determinants are grouped into those arising from changes in trade, technology, and consumption patterns. The decomposition technique allows us to isolate the partial effects of each of these determinants. Furthermore, the disaggregation is exhaustive. Hence, the total change in a country’s jobs is attributed to changes in trade, technology, or consumption. We describe each of the drivers of a country’s jobs in turn.8 A. Trade Changes in the location where intermediates are produced (equation 5b). If some of the intermediate inputs were initially purchased from domestic suppliers but are now bought in a foreign country, the associated jobs will also be relocated to the foreign country.9 Changes in the location of final assembly (equation 5d). If the production of a final good from a country loses world market share, jobs in all countries that contributed to the production of that final good will fall. Changes in preferences of consumers may cause such changes, but also decisions by lead firms to relocate their assembly activities. B. Technology Changes in GVC Jobs (equation 5c). We define the GVC jobs for a final good produced in a country (say the iPads in the PRC) as the jobs anywhere in the world and in any industry required to produce
8 The decomposition analysis represented by equations (5a–5f) is not a unique solution. It alters with the choice of weights
applied to the individual expressions and can give rise to n! possible decompositions (see Dietzenbacher and Los 1998). The results presented in the next section are an arithmetic average over equations (5a–5f) and the so-called polar form, which consists in switching initial and final year weights in all the equations. Dietzenbacher and Los (1998) demonstrate that the average of all the potential decompositions roughly corresponds to the average of the two polar decompositions.
9 Equation 5b accounts for changes in R, hence other changes are included here as well such as changes in jobs per unit of output.
14 | ADB Economics Working Paper Series No. 496
$1 million of final output of the final good in that country. Increased efficiency in this GVC will, ceteris paribus, lead to lower demand for jobs of a particular skill type or activity. Changes in efficiency of a country (equation 5a). If productivity in a country catches up to the productivity leader (say Chinese electronics industry catches up to US electronics), fewer jobs are needed to produce the same amount of output. C. Consumption Changes in the consumption bundle (equation 5e). If the composition of the consumption bundle (both at home and abroad) changes, this affects the relative demand for final products. Since final products differ in terms of their embodied jobs, these Engel effects induce changes in jobs in a country. Changes in consumption levels (equation 5f). Demand for final goods increases if consumers become wealthier and purchase more goods and services.
We use the WIOT in previous year’s prices to describe the world production structure from 2000 onward. WIOTs in previous year’s prices are only available up to 2009, which restricts our analysis to the period from 2000 to 2009. In addition, Bangladesh, Malaysia, the Philippines, Thailand, and Viet Nam are not distinguished separately in the WIOTs (they are part of the ‘Rest of the World’ block in the WIOTs). Thus, we disaggregate total jobs by activity in each country considered. Below, we discuss the key findings from our disaggregation of the change in jobs between 2000 and 2009.
V. MAIN DRIVERS OF SKILL AND ACTIVITY UPGRADING This section presents the main results from the decomposition analysis. We focus on quantifying the actual changes in demand for skills and business activities across all jobs in an economy. Hence, this is a broader perspective on jobs compared to the focus on manufactures GVC jobs in section III, but we will explicitly account for GVCs in the analysis here. Changes in jobs are split into the changes in underlying factors using the decomposition methodology.
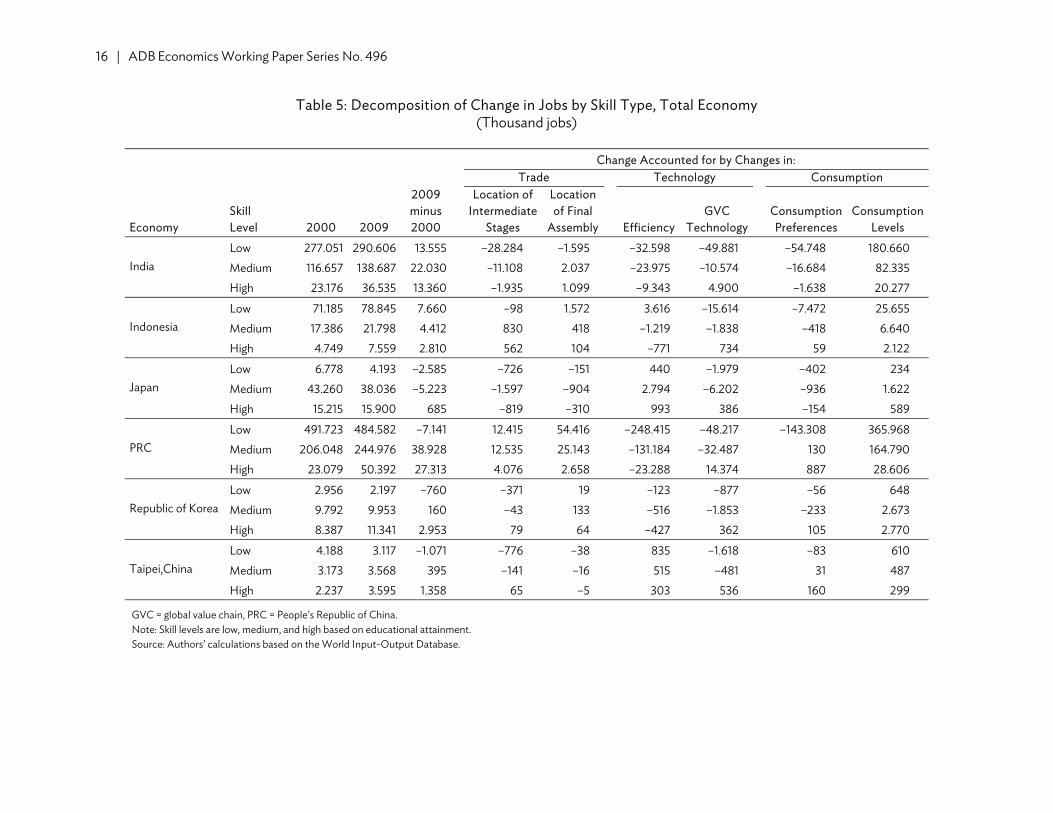
Table 5 shows changes in jobs by skill type and an account of the drivers of these changes. The first columns show the number of jobs by skill type in 2000 and 2009 and the change between 2000 and 2009. High-income Asian economies, such as Japan; the Republic of Korea; and Taipei,China have specialized in high-skilled jobs. For example, low-skilled jobs in the Republic of Korea declined by 760,000 between 2000 and 2009, whereas the number of high-skilled jobs increased by almost 3 million. In contrast in DMCs, such as India and Indonesia, we observe an increase in low-skilled jobs. A noticeable exception is the PRC, where the total number of low-skilled jobs declined by about 7 million, but from a very high initial level of almost 492 million. Interestingly, in all Asian economies distinguished, there was a substantial increase in high-skilled jobs. This is suggestive of an increase in demand for skills in Asia.
The subsequent columns in Table 5 show the drivers of the change in the number of jobs. The
sum of the columns for trade, technology, and consumption is equal to the change in jobs between 2000 and 2009. Our decomposition analysis suggests that technological change in GVCs is related to a reduced demand for jobs. Due to efficiency improvements, fewer workers are needed to produce the same amount of output. Our results suggest that technological change in GVCs has been skill biased. Technological change lowered demand for low-skilled workers relatively more compared to high-
Skills and Activity Upgrading in Global Value Chains: Trends and Drivers for Asia | 15
skilled workers. Other drivers in our decomposition analysis also had a substantial effect on the relative demand for workers by skill type. In particular, changes in the consumption bundle in the PRC, toward manufacturing and services and away from agriculture, lowered demand for low-skilled workers.
The final column in Table 5 suggests that the biggest effects on the demand for workers
originate from increased consumption levels. Increased consumer demand lifted all boats: it did not substantially affect the relative demand for workers by skill type. In the Appendix Table 5, we split the change in consumption levels into foreign and domestic demand. This split suggests that the consumption level effect mainly originates from domestic demand. The relocation of intermediate production and final assembly increased demand for high-skilled workers relative to low-skilled workers, in particular in the Republic of Korea and Taipei,China.10 However, the effects from trade appear less important compared to the effect from technological change.
Table 6 shows jobs by business activity in 2000 and 2009 as well as the six factors accounting for the change in jobs between 2000 and 2009. This table is complementary to Table 5. The total number of jobs and the changes in jobs for each country in the first columns match with those in Table 5. For example, in both Table 5 and Table 6 one can observe that the amount of jobs in the PRC expanded by about 59 million between 2000 and 2009. Table 6 provides additional insights as it examines functional upgrading.
In the PRC, jobs related to production activities declined whereas it increased in India and
Indonesia. These findings accord with the increase in low-skilled jobs in India and Indonesia and the decrease in low-skilled jobs in the PRC observed in Table 5. In all Asian countries, except India and Japan, there was an increase in the number of R&D jobs.11 This is suggestive macro evidence of functional upgrading by Asian countries in GVCs. But our findings suggest that functional upgrading proceeds at different speed across countries. In particular, the increase in R&D jobs in the PRC has been impressive. The subsequent columns in Table 6 suggest that the main drivers of the increase in R&D jobs are changes in trade, the increase in consumption levels (again mainly changes in domestic demand; see Appendix Table 6), and the shift in consumer preference toward goods that require more innovative activities.
Also, when looking at changes in jobs by business activities, our results suggest that
technological change within GVCs had a big effect on the relative demand for higher value added and more skill-intensive activities, such as R&D and headquarter jobs. For example, improvements in GVC technology lowered demand for production workers by about 55 million workers in the PRC, but it hardly affected demand for R&D jobs. This is suggestive evidence of technological change being to the benefit of more knowledge-intensive activities.
10 In Appendix Table 5, we also split the relocation of intermediate production to other domestic industries (outsourcing)
and to foreign industries (offshoring). The decomposition results suggest that most of the relation of intermediate stages is to foreign industries.
11 The substantial level and increase in headquarter jobs in India is surprising and might be anomalous due to matching of various occupations to headquarter activities that probably should be mapped into administrative and back-office activities. If more detailed occupation data becomes available, the estimates should be improved.
16 | ADB Economics Working Paper Series No. 496
Table 5: Decomposition of Change in Jobs by Skill Type, Total Economy (Thousand jobs)
GVC = global value chain, PRC = People’s Republic of China. Note: Skill levels are low, medium, and high based on educational attainment. Source: Authors’ calculations based on the World Input-Output Database.
Skills and Activity Upgrading in Global Value Chains: Trends and Drivers for Asia | 17
Table 6: Decomposition of Change in Jobs by Business Activity, Total Economy (Thousand jobs)
ADM = administrative and back-office; GVC = global value chain; HQ = headquarters; LSM = logistics, sales, and marketing; PRC = People’s Republic of China; PROD = production; RD = research and development. Source: Authors’ calculations based on the World Input Output-Database and the occupations database.
18 | ADB Economics Working Paper Series No. 496
VI. CONCLUDING REMARKS This paper combines MRIO tables with new data on jobs by skill type and business activity to examine upgrading by Asian countries in GVCs and quantify the contributions of changes in (i) technology, (ii) trade, and (iii) consumption to changes in employment levels of jobs.
The MRIO tables allow us to view the world economy as a network of GVCs. Technological change affects the factor requirements per unit of output in these chains. Furthermore, changes in the location of the production of raw materials, parts and components as well as final products have an impact on employment levels in countries. Finally, changes in the composition and volume of national consumption bundles have effects on the relative sizes of GVCs and therefore on the amount of skills demanded in countries contributing to GVCs.
Our findings suggest that economies differ in their ability to create jobs and upgrade in GVCs.
In particular, the PRC appears to have generated a lot of jobs for its large low-skilled workforce in line with its comparative advantage. But at the same time, since 2000 we observe substantial upgrading reflected in rapidly increasing numbers of Chinese R&D workers involved in GVCs. Other DMCs also appear to upgrade in GVCs but at a slower pace. We also find that high-income Asian economies—Japan; the Republic of Korea; and Taipei,China—specialize in high-skilled activities in GVCs.
The decomposition method suggests technological change is the main driver of downward
pressures on employment of low-skilled and medium-skilled workers relative to high-skilled workers. Also, technological change is related to an increase in R&D relative to production workers. Relocations of stages of production (both of intermediate stages and the final stage) add substantially to this relative demand effect for workers by skill type, but at the same time the increased participation in production networks has led to a substantial increase in jobs demanded. Growth of consumption and investment demand has had employment-enhancing effects. In general, these consumption effects were sufficiently large to make employment growth positive.
A word of caution is appropriate. Our analysis is grounded in a relatively simple model that has
its limitations. It is an ex post accounting exercise in which final demand is considered exogenous. The various drivers of changes in jobs are ‘proximate sources’ that are not necessarily independent. New analysis in a more encompassing framework is needed to uncover the deeper determinants. Furthermore, considerable scope remains for WIOT to expand country coverage and improve data quality, in particular by explicitly incorporating firm heterogeneity.
APPENDIX
Table A.1: Supplement to Table 3; Direct Manufactures GVC Workers by Skill Type, 2000 and 2011 and Change
GVC = global value chain, PRC = People’s Republic of China. Note: GVC workers directly involved in the production of manufacturing goods. Source: Authors’ calculations based on ADB MRIO and socioeconomic accounts.
Table A.2: Supplement to Table 3; Indirect Manufactures GVC Workers by Skill Type, 2000 and 2011 and Change
GVC = global value chain, PRC = People’s Republic of China. Note: GVC workers directly involved in the production of manufacturing goods. Source: Authors’ calculations based on ADB MRIO and socioeconomic accounts.
20 | Appendix
Table A.3: Supplement to Table 4; Direct Manufactures GVC Workers by Business Activity, 2000 and 2011 and Change
GVC = global value chain, PRC = People’s Republic of China, R&D = research and development. Source: Authors’ calculations based on ADB MRIO and the occupations database (see main text).
Table A.4: Supplement to Table 4; Indirect Manufactures GVC Workers by Business Activity, 2000 and 2011 and Change
GVC = global value chain, PRC = People’s Republic of China, R&D = research and development. Source: Authors’ calculations based on ADB MRIO and the occupations database (see main text).
Appendix | 21
Table A.5: Supplement to Table 5; Decomposition of Change in Jobs by Skill Type, Total Economy
(Thousand jobs)
Economy Business Activity
Location of Intermediate
Stages
Of which:
Domestic
Of which:
Foreign Consumption
Levels
Of which:
Domestic
Of which:
Foreign
India Low –28,284 –3,251 –25,033 180,660 172,725 7,936 Medium –11,108 –345 –10,764 82,335 78,366 3,969 High –1,935 366 –2,302 20,277 19,309 968
Indonesia Low –98 1,739 –1,837 25,655 22,242 3,414 Medium 830 465 365 6,640 5,815 825 High 562 144 418 2,122 1,968 155
Japan Low –726 –252 –474 234 39 195 Medium –1,597 –1,088 –509 1,622 207 1,415 High –819 –567 –252 589 52 537
PRC = People’s Republic of China. Notes: Location of intermediates stages and final consumption levels are split into domestic and foreign. The totals equal those reported in Table 5. Skill levels are low, medium and high based on educational attainment. Source: Authors’ calculations based on the World Input-Output Database.
22 | Appendix
Table A.6: Supplement to Table 6; Decomposition of Change in Jobs by Business Activity, Total Economy
ADM = administrative and back-office; HQ = headquarters; LSM = logistics, sales, and marketing; PRC = People’s Republic of China; PROD = production; RD = research and development. Notes: Location of intermediates stages and final consumption levels are split into domestic and foreign. The totals equal those reported in Table 6. Source: Authors’ calculations based on the World Input-Output Database and the occupations database.
REFERENCES Asian Development Bank (ADB). 2015a. “A Smarter Future: Skills, Education, and Growth in Asia.”
Manila. ————. 2015b. “Global Value Chains Indicators for International Production Sharing.” Manila.
Baldwin, Richard, and Javier Lopez-Gonzalez. 2015. “Supply-Chain Trade: A Portrait of Global Patterns
and Severable Testable Hypotheses.” The World Economy 38 (11): 1682–721. Chen, Xikang, Leonard K. Cheng, K. C. Fung, Lawrence J. Lau, Yun-Wing Sung, K. Zhu, C. Yang, J. Pei,
and Y. Duan. 2012. “Domestic Value Added and Employment Generated by Chinese Exports: A Quantitative Estimation.” China Economic Review 23 (4): 850–64.
Dietzenbacher, Erik, and Bart Los. 1998. “Structural Decomposition Techniques: Sense and
Sensitivity.” Economic Systems Research 10 (4): 307–23. Felipe, Jesus, Aashish Mehta, and Changyong Rhee. 2015. “Manufacturing Matters…but It’s the Jobs
That Count.” ADB Economics Working Paper Series No. 420. Gereffi, Gary. 1999. “International Trade and Industrial Upgrading in the Apparel Commodity Chain.”
Journal of International Economics 48 (1): 37–70. Humphrey, John. 2004. “Upgrading in Global Value Chains” ILO Working Paper No. 28. Humphrey, John, and Hubert Schmitz. 2002. “How Does Insertion in Global Value Chains Affect
Upgrading in Industrial Clusters?” Regional Studies 36 (9): 1017–27. Kee, Hiau Looi, and Heiwai Tang. 2016. “Domestic Value Added in Exports: Theory and Firm Evidence
from China.” American Economic Review 106 (6): 1402–36. Koopman, Robert, Zhi Wang, and Shang-Jin Wei. 2012. “Estimating Domestic Content in Exports
when Processing Trade is Pervasive.” Journal of Development Economics 99 (1): 178–89. Krugman, Paul R. 2008. “Trade and Wages Reconsidered.” Brookings Paper on Economic Activity.
Spring issue, pp. 103–54. Leontief, Wassily. 1936. “Quantitative Input-Output Relations in the Economic System of the United
States.” Review of Economics and Statistics 18 (3): 105–25. Los, Bart, Marcel P. Timmer, and Gaaitzen J. de Vries. 2013. “The Demand for Skills 1995-2008: A
Global Supply Chain Perspective.” OECD Economics Department Working Papers No. 1141. Mariasingham, Joseph. 2015. “ADB Multi-Region Input-Output Database: Sources and Methods.”
Mimeo. http://www.wiod.org/new_site/otherdata/ADB/ADB_MRIO_SM.pdf ADB recognizes “China” as the People’s Republic of China.
24 | References
Meng, Bo, Glen Peters, and Zhi Wang. 2015. “Tracing CO2 Emissions in Global Value Chains.” IDE Discussion Paper No. 486.
Miller, Ronald E., and Peter D. Blair. 2009. Input-Output Analysis, 2nd Edition. Cambridge, UK:
Cambridge University Press. Sturgeon, Timothy J., and Gary Gereffi. 2009. “Measuring Success in the Global Economy:
International Trade, Industrial Upgrading, and Business Function Outsourcing in Global Value Chains.” Transnational Corporation 18 (2): 1–36.
Timmer, Marcel P., and Gaaitzen J. de Vries. 2015. “Are Emerging Countries Catching Up? The Spatial
Geography of Knowledge-Intensive Activities in Global Production of Manufactures.” University of Groningen. Mimeo.
Timmer, Marcel P., Erik Dietzenbacher, Bart Los, Robert Stehrer, and Gaaitzen J. de Vries. 2015. “An
Illustrated User Guide to the World Input-Output Database: The Case of Global Automotive Production.” Review of International Economics 23 (3): 575–605.
Timmer, Marcel P., Abdul Azeez Erumban, Bart Los, Robert Stehrer, and Gaaitzen J. de Vries. 2014.
“Slicing Up Global Value Chains.” Journal of Economic Perspectives 28 (2): 99–118. Timmer, Marcel P., Bart Los, Robert Stehrer, and Gaaitzen J. de Vries. 2013. “Fragmentation, Incomes
and Jobs. An Analysis of European Competitiveness.” Economic Policy 11 (4): 613–61.
ASIAN DEVELOPMENT BANK
AsiAn Development BAnk6 ADB Avenue, Mandaluyong City1550 Metro Manila, Philippineswww.adb.org
Skills and Activity Upgrading in Global Value Chains: Trends and Drivers for Asia
This paper examines the main trends and drivers of upgrading by Asian countries in global value chains using the newly constructed ADB multiregion input–output tables in combination with occupation data. Our results suggest an ongoing specialization process in high-income Asian countries and in developing member countries toward high-skilled knowledge-intensive activities. The pace of upgrading differs across Asian countries. We use a structural decomposition method to account for the drivers of the trends observed. In particular, technological change in global value chains that is biased toward skilled activities is important in accounting for the trends observed.
About the Asian Development Bank
ADB’s vision is an Asia and Pacific region free of poverty. Its mission is to help its developing member countries reduce poverty and improve the quality of life of their people. Despite the region’s many successes, it remains home to half of the world’s extreme poor. ADB is committed to reducing poverty through inclusive economic growth, environmentally sustainable growth, and regional integration.
Based in Manila, ADB is owned by 67 members, including 48 from the region. Its main instruments for helping its developing member countries are policy dialogue, loans, equity investments, guarantees, grants, and technical assistance.
adb economicsworking paper series
NO. 496
august 2016
SkillS AND ACTiViTy UpGrADiNG iN GlOBAl VAlUe ChAiNS: TreNDS AND DriVerS fOr ASiAGaaitzen de Vries, Quanrun Chen, Rana Hasan, and Zhigang Li