140
Skills forecast trends and challenges to 2030 EN ISSN 2363-216X

Skills forecasttrends and challenges to 2030
ENEN ISSN 2363-216X


Skills forecast: trends and challenges to 2030
Cedefop reference series 108
Luxembourg: Publications Office of the European Union, 2018

Designed by Missing Element Prague Printed in the European Union
Please cite this publication as:Cedefop, Eurofound (2018). Skills forecast: trends and challenges to 2030. Luxembourg: Publications Office. Cedefop reference series; No 108. http://data.europa.eu/doi/10.2801/4492
A great deal of additional information on the European Union is available on the Internet.It can be accessed through the Europa server (http://europa.eu).
Luxembourg: Publications Office of the European Union, 2018
Copyright © European Centre for the Development of Vocational Training (Cedefop) / European Foundation for the Improvement of Living and Working Conditions (Eurofound), 2018 All rights reserved.
PRINTISBN: 978-92-896-2711-5doi:10.2801/626296ISSN: 1608-7089TI-RF-18-002-EN-C
PDFISBN: 978-92-896-2712-2doi:10.2801/4492ISSN: 2363-216XTI-RF-18-002-EN-N

The European Centre for the Development of Vocational Training (Cedefop) is the European Union’s
reference centre for vocational education and training. We provide information on and analyses of vocational
education and training systems, policies, research and practice.Cedefop was established in 1975
by Council Regulation (EEC) No 337/75.
Europe 123, 570 01 Thessaloniki (Pylea), GREECEPO Box 22427, 551 02 Thessaloniki, GREECE
Tel. +30 2310490111, Fax +30 2310490020Email: [email protected]
www.cedefop.europa.eu
Mara Brugia, Acting DirectorTatjana Babrauskiene, Chair of the Governing Board

Foreword
In highly dynamic and competitive labour markets, investing in people’s skills and competences is key. But which skills and for which jobs? This question is central to national, European and international debate. If education and training throughout their lives is to be a smart choice for people, it needs to be relevant: it needs to adjust to, and anticipate, changes that affect our economies and societies and, therefore the labour market. This applies particularly to vocational education and training (VET).
But how to foretell future skill needs, especially if the impact of the fourth industrial revolution is not yet clear. As Paul Saffo pointed out: ‘The goal of forecasting is not to predict the future; but to tell you what you need to know to take meaningful action in the present’ (Saffo, 2007, p. 1). Cedefop’s new European skills forecast up to 2030 serves this very purpose. It helps us to make informed choices to avoid deciding on education and training investments in the dark. Awareness of skills and qualification needs and job prospects can assist young people and adults in their education and career choices or encourage further learning.
Education and training investments take years to yield results and return. Acting as an early warning system, the forecast allows policy-makers to take decisions in time. Anticipating potential future challenges allows us to design better informed policies now. Working at the interface between education and training and the labour market, informing VET policy has been at the heart of Cedefop’s work. Cedefop pioneered the first pan-European forecast of skill needs 10 years ago. Acknowledging the benefit of this initiative, the Council entrusted Cedefop with regular EU-wide skill supply and demand projections – the only comparable outlook of future labour market trends across countries, sectors and occupations. The European Commission’s continued political interest and financial support allowed Cedefop to develop a sound methodology using harmonised data for all Member States. Today Cedefop’s forecast is well-known and widely used by policy-makers, international institutions, analysists and journalists. It has also inspired several countries in their endeavour to set up or improve their own skills projection systems.
Learning and use of skills at the workplace are also key to job quality, an area widely researched by Eurofound. With its European jobs monitor,

5
Foreword
Eurofound examines the kind of jobs that are created and destroyed in the labour market and assesses these shifts in terms of wages, skill levels and other features to understand job quality. In this report Cedefop and Eurofound joined forces. The European job monitor approach has been applied to the Cedefop baseline scenario to identify how wage structure and job tasks are changing.
With the skills forecast, the European jobs monitor, and other skills anticipation activities, Cedefop and Eurofound aim to encourage proactive policy approaches and informed decision-making. Acting proactively is more effective, and often cheaper, than fixing adverse effects at a later stage. Taking informed decisions is the best way for stakeholders and citizens to prepare themselves for the future.
Juan Menendez-ValdesEurofound Director
Mara BrugiaActing Director

6 Skills forecast: trends and challenges to 2030
Acknowledgements
This joint Cedefop-Eurofound publication was produced by Cedefop, Department for skills and labour market under the supervision of Pascaline Descy and Alena Zukersteinova. Ilias Livanos was the Cedefop expert responsible for the publication; Donald Storrie, Eurofound chief researcher, was responsible for the Eurofound contribution. The Cedefop research was conducted from December 2015 to December 2017 under the project Production of skills supply and demand forecasts, AO/DSL/VKVET/Skills forecasts/001/16. Cedefop would like to acknowledge the research team lead by Cambridge Econometrics that developed forecasting results and drafted key findings in various reports which created the basis for this publication. Special appreciation goes to group of individual country experts (ICEs) who vitally contributed to project development and validation of results. The publication was peer-reviewed by Vladimir Kvetan.
ContentsForeword 4Executive summary 10Introduction 13
1.1. Cedefop’s skill supply and demand projections 131.2. General approach 131.3. Publication structure 14
Prospects for employment and labour force trends in Europe 162.1. Introduction 162.2. Economic growth 162.3. Prospects for employment in Europe 192.4. Labour force trends 262.5. Imbalances between labour supply and demand 292.6. Dealing with uncertainty 322.7. Concluding remarks 35
The implications for occupations 403.1. Introduction 403.2. Factors influencing occupational employment 403.3. Replacement demand 563.4. Concluding remarks 59
Qualifications and skill mismatch 624.1. Introduction 624.2. Implications for qualifications 624.3. Concluding remarks 73
Examining the job task content 775.1. Introduction 775.2. European jobs monitor framework 775.3. Framework for analysing structural change in Europe 805.4. Projected structural change, wage distribution and tasks 835.5. Concluding remarks 93
Discussion and future challenges 95Acronyms 99Glossary of definitions used 100References 101Annex 1. Contributing national experts 104Annex 2. Additional Chapter 2 tables 106

8 Skills forecast: trends and challenges to 2030
List of tables, figures and boxes
TablesTable 1. Baseline employment by broad industry (% pa), EU-28+3 21Table 2. Projected change by broad occupation, 2011-30 (EU-28+3) 46Table 3. Supply trends, stocks: population (EU-28+3, aged 15+) 66Table 4. Supply trends: labour force (EU-28+3, aged 15+) 67Table 5. Projected demand for qualifications: constrained (EU-28+3) 76Table 6. Unemployment by qualification level (%), EU-28+3 76Table 7. Classification of tasks according to their content and methods 82Table A1. Employment growth rates by country (% pa) 106Table A2. Baseline employment by detailed sector (% pa), EU-28+3 108Table A3. Summary country results, 2030 compared to 2016 110Table A4. Summary results by labour group, 2030 compared to 2016 112Table A5. Employment comparison between sensitivities
(% difference from baseline), 2030 113Table A6. Employment change by detailed occupation,
2011-30 (EU-28+3) 114Table A7. Projected change by occupation, 2016-30:
shift-share analysis (EU-28+3) 118
Annex 3. Additional Chapter 3 figures 114Annex 4. Additional Chapter 5 figures 134
Figures
Figure 1. Modelling skill supply and demand 15Figure 2. GDP annual growth rate (%), EU-28+3 17Figure 3. Employment annual growth rate, EU-28+3 19Figure 4. Baseline employment growth by detailed sector 2016-30
(% pa), EU-28+3 24Figure 5. Labour force, EU-28+3 27Figure 6. Labour participation rates, EU-28+3 28Figure 7. Baseline labour supply: average annual growth rate, 2016-30 30Figure 8. Baseline unemployment rate (%), in EU regions 32Figure 9. GDP growth (%), in EU-28+3 34Figure 10. EU revival: percentage differences from baseline in 2030 36Figure 11. EU stagnation: percentage differences from baseline in 2030 38

9
Contents
BoxesBox 1. Featured sector: automotive 23
Figure 15. Broad trends in occupational employment (EU-28+3) 52Figure 16. Changing occupational structure of employment (EU-28+3) 53Figure 17. Occupational change (%), two-digit ISCO-08 categories, 2016-30 54Figure 19. Replacement demand rates (% pa) per ISCO one-digit level:
overview by occupation 58Figure 20. Replacement demand rates (% pa) per ISCED one-digit level:
overview by education level 58Figure 21. Replacement demand (total requirements and net changes) by
broad occupations, 2016-30 (EU-28+3) 60Figure 22. Supply of qualified people (EU-28+3) 64Figure 23. Past and likely future supply of qualifications (EU-28+3) 65Figure 24. Labour market participation rates by qualification category 68Figure 25. Projected net change, labour force by education level, 2016-30 69Figure 26. Demand by qualification: unconstrained, 2011-30 (EU-28+3) 72Figure 27. Demand by qualification: constrained, 2011-30 (EU-28+3) 74Figure 28. Past and projected demand for qualifications: constrained
(EU-28+3) 75Figure 29. Ranking of jobs (an occupation in a sector) by wages and
assignment to employment quintiles 81Figure 30. Employment change (% pa) by job-wage quintile, 1998-2016 (EU) 84Figure 31. Employment change (% pa) by job-wage quintile, 2015-30 86Figure 32. Employment change (% pa) by job-wage quintile, 2015-30:
EU, by qualifications, occupation and economic sector 88Figure 33. Task indices change, 2015-30 (EU) 91Figure A1. Projected change by two-digit occupations, 2016-30 (EU-28+3) 122Figure A2. Projected change, shift-share analysis, two-digit occupations,
2016-30 (EU-28+3) 126Figure A3. Total requirements and net changes detailed occupation,
2011-30 (EU-28+3) 130Figure A4. Task indices change, 2015-30 (EU): total and for first
(lowest) wage quintile 134Figure A5. Task indices change, 2015-30 (EU): total and for third
(middle) wage quintile 135Figure A6. Task indices change, 2015-30 (EU): total and for fifth
(top) wage quintile 136
Executive summary
Cedefop’s skill supply and demand projections provide comprehensive information about the current structure of Europe’s labour market and potential future trends. This report presents the results and findings from the most recent update to the projections along with Eurofound’s analysis on the task content of employment, using the jobs monitor approach.
Following the deep recession of the financial crisis, 2017 saw the fifth year of recovery in EU GDP growth. A modest recovery is expected to continue in the near term with GDP growth for the 28 European Union Member States (EU-28) plus three associate countries – Norway, Switzerland and Iceland – (EU-28+3) averaging around 1.8% until 2020 and slowing to 1.4% from 2021 onwards.
The working age population is expected to increase, but there is much variation in trends across countries. At aggregate level, the working age population is expected to increase by 3.7% between 2016 and 2030, while the labour force increases by 1%. At individual country level, Iceland, Ireland, Luxembourg, Norway and Switzerland are projected to experience strong increase in working age population and labour supply, while Bulgaria, Latvia and Lithuania undergo sharp decreases.
Modest employment growth is projected overall but a decline is expected in some countries. In the medium term, total employment is projected to grow by around 0.5% per annum over 2020-25 and then to slow down as long-term demographic trends constrain growth. Employment reduction is expected in Bulgaria, Germany, Estonia, Croatia, Latvia and Lithuania, driven by an aging population and/or outward migration. Service sectors are expected to be the main drivers of employment growth over 2016-30, while basic manufacturing employment is expected to decline. This trend highlights the shift towards a more service-based economy. Legal and accounting, R&D, advertising and market research, other professional and administrative services, and support service activities are the sectors expected to see the fastest employment growth.
Predicted employment trends will drive continued polarisation within the labour market. Significant growth in employment for high-skill occupations (managers, professionals and associate professionals) is expected, together with some growth for less skilled jobs related to sales, security, cleaning,

11
Executive summary
catering and caring occupations. Job losses are projected in medium-skill occupations, such as skilled manual workers (especially in agriculture), and for clerks.
These changes in occupational employment patterns result from a combination of two main factors:(a) continuing structural change in the economy in terms of its sectoral mix;(b) technological and other changes that influence the patterns of skill
demand within sectors.
These two factors are characterised as ‘industry’ and ‘occupational’ effects respectively. For most occupations the occupational effects are much more significant than the industry effects, although the latter remain significant in many cases. The continuing decline of employment in primary and manufacturing industries has an impact on many manual occupations, while the growth in employment in many parts of the service sector continues to benefit a number of non-manual occupations.
The Eurofound analysis confirms the indications of the main results with regard to job polarisation, suggesting an increasingly polarised occupational structure in the EU, driven by strong growth at the bottom of the wage distribution. The analysis also highlights a shift towards more autonomy, less routine, more information and communication technology (ICT), fewer physical tasks, and more social and intellectual tasks over the forecast period to 2030.
Medium-skill occupations are projected to see slow growth or even decline in the number of jobs, as automation and offshoring take their toll. But new workers will still be needed in these occupations to replace those who leave or retire. Replacement demand (RD) rates (job openings arising from a worker leaving a job) average 3.7% each year across all countries, though this varies by country and occupation. Average national RD ranges from 2.6% per annum in Hungary to 5.0% in Iceland. The highest rates throughout the EU are in occupations with more seniority (such as managers and senior officials), and in sectors such as agriculture and fishery, with their aged workforces. Summing expansion demand and RD gives a total requirement of 158 million job openings to be filled between 2016 and 2030.
There is considerable interest and concern in many countries about possible imbalances and mismatches between the demand for and supply of skills. The analysis highlights tensions between demand and supply trends. While the problem of overqualification of young graduates may be resolved

12 Skills forecast: trends and challenges to 2030
in the long term, as the effects of the crisis unwind, the immediate prospects are for overqualification for many people employed in both high and low-skill occupations. However, it is not easy to develop robust measurements of such phenomena. Overall, there are indications that the supply of those with higher-level qualifications may be growing faster than demand and of those with few or lower-level qualifications.

CHAPTER 1.
(1) For a more detailed description of the forecasting methodology, assumptions and the process of incorporating ICE comments, see the detailed methodology note (Cedefop, 2012); some improvements with respect to that description have been made in the recent forecast.
(2) Data for the former Yugoslav Republic of Macedonia and Turkey, due to various data issues, are considered experimental and are therefore not part of this publication. Detailed data are available on request from Cedefop.
Introduction
1.1. Cedefop’s skill supply and demand projections
Cedefop’s skill supply and demand projections provide comprehensive information about the current structure, and future trends, in the labour market. This report reflects the findings of the 2018 update to the projections in which Cedefop and Eurofound collaborated to identify changes in the occupational wage structure and the task content of jobs to up to 2030 (Chapter 5).
1.2. General approach
The methodology (1) uses a modular approach, with the following main elements:(a) the demand side (skill needs), focusing on employment (jobs); (b) the supply side, focusing on available skills, the number of people
economically active and the qualifications they hold; (c) imbalances, comparing the demand and supply side modules.
All modules adopt common data, methods and models for all countries (EU + former Yugoslav Republic of Macedonia, Iceland, Norway, Switzerland and Turkey (2) to produce a comprehensive and consistent set of skill projections. The database draws primarily on Eurostat sources, including demographic data, national accounts (NA) and the labour force survey (LFS).

14 Skills forecast: trends and challenges to 2030
Individual country experts (3) (ICEs) are involved in peer review and results validation. However, the use of common models and assumptions does not always allow incorporation of local data and factors that may affect skill supply and demand. Therefore, other country-specific information might be needed to complement the results.
Module 1 of the methodology contains the E3ME (macroeconomic) model. This is used to form projections of labour demand (employment) at sectoral level and labour supply (the economically active labour force) by demographic group.
Modules 2 and 3 cover employment levels and expansion demand for occupations and qualifications. Module 4 covers RD and looks at qualification supply model (stocks). Modules 5 and 5* focus on the supply of skills as measured by the highest qualification held, analysing stocks and flows, respectively. Module 6 reconciles skill demand and supply (Figure 1).
1.3. Publication structure
The structure of this publication is as follows. Chapter 2 summarises the overall macroeconomic forecast for Europe, and the implications for employment by sector, labour force trends and unemployment. From the economic and sectoral prospects described in Chapter 2, Chapter 3 summarises the implications for future skills as described by occupations, including replacement demand. Chapter 4 summarises the trends in future skill supply and demand (as described by broad levels of qualification), and implications for skill mismatch. Chapter 5 includes a special feature examining the tasks and skills content of the current and future employment structure of Europe. Chapter 6 concludes, discussing the results and posing some questions for policy intervention.
(3) The list of contributing ICEs is available in Annex 1.

15CHAPTER 1.
Introduction
Figure 1. Modelling skill supply and demand
MODULE 7Imbalances (supply-demand), 3 ISCED levels (BALMOD)
MODULE 1MULTISECTORAL MACROECONOMIC MODEL (E3ME)
Economic activity
Working age population by
age and gender (exogenous)
Labour market participation rates
Benefit rates
Active labour force by age and gender
Supply of skills Demand for skills
MODULE 6Flows and graduate numbers by ISCED category (FlowMOD)
Numbers in the population by ISCED category
Numbers in the labour force by ISCED category
MODULE 3Employment levels and expansion demand by qualification (QMOD)
Job openings by qualification (ISCED category)
Job openings by occupation (ISCO 2 digit)
Unemployment
Wage rates
MODULE 5Stocks of people by
qualifications, 3 ISCED levels and by economic status (QMOD)
MODULE 2Employment levels and expansion demand by occupation (EDMOD)
Employment (labour demand)
MODULE 4Replacement demand by
occupation/qualification (RDMOD)

CHAPTER 2.
Prospects for employment and labour force trends in Europe
Key messages
Employment growth is expected to be moderate over the medium term, slowing down considerably after 2025.Service sectors and some advanced manufacturing sectors are expected to see large increases in employment over the projection period in most Member States.Average labour participation rates are expected to decrease over the projection pe-riod as a result of the aging labour force.
2.1. Introduction
This chapter summarises the overall macroeconomic forecast for Europe, and the implications for employment by sector, labour force trends and unemployment. The final section summarises a sensitivity analysis that explores the extent to which the labour market outlook is affected by alternative macroeconomic assumptions.
2.2. Economic growth
To generate the employment and labour market projections, Cedefop uses external information to form a view on economic and population growth patterns across different Member States.
It is a substantial exercise to develop a sufficiently detailed set of population projections that use a consistent methodology and assumptions (such as on migration) across all countries modelled. This is done by Eurostat, and the approach draws on these official projections. Baseline assumptions

17CHAPTER 2.
Prospects for employment and labour force trends in Europe
for population growth match the most recent Eurostat baseline projections as shown in Europop 2015 (4). The Eurostat projection also includes explicit quantitative assumptions about migration patterns.
The approach for GDP growth assumptions similarly seeks to make best use of official and consistent data sources. Our assumptions for long-term GDP growth draw on official projections published by the European Commission. They are based on the latest ageing report of the European Commission (European Commission, 2017a), making them consistent with the published population projections.
The May 2017 GDP projections of the AMECO database (5) were used for the short-term GDP outlook. Figure 2 summarises the overall GDP growth trend used over the projection period.
(4) Eurostat population projection, data 2015. http://ec.europa.eu/eurostat/web/population-demography-migration-projections/population-projections-data
(5) European Commission’s annual macroeconomic database (AMECO). https://ec.europa.eu/info/business-economy-euro/indicators-statistics/economic-databases/macro-economic-database-ameco_en
2000 2005 2015 20252010 2020 2030
4
3
2
1
0
-1
-2
-3
-4
-5
Annu
al g
row
th ra
te (%
)
Figure 2. GDP annual growth rate (%), EU-28+3
Source: Cedefop (2018 skills forecast) based on official GDP projections.

18 Skills forecast: trends and challenges to 2030
Projections for EU GDP show relatively low growth rates in the short to medium term, averaging 1.9% per annum over 2015-20 and decreasing to 1.4% per annum over 2020-30. At the start of the projection period, EU Member States will continue to recover from the crisis and its legacy, in some cases delivering and adjusting to economic imbalances, but supported by higher global growth, particularly in China. Over the medium term, GDP growth is expected to stabilise at a lower rate, mainly because of aging and declining population. Population trends are expected to lead to a reduction in the share of consumer expenditure in 2030 compared to 2015. Consumers across countries shift spending patterns as they age, notably towards greater consumption of health-related services and goods, and less on leisure activities (with travel being the exception). This will result in a slowdown in growth and employment in consumer service sectors, such as wholesale and retail, hotel and restaurants and other entertainment sectors.
The share of government expenditure in GDP is expected to increase between 2015 and 2030, driven by increased expenditure in health and social care. We would expect to see increased employment in this sector.
Employment in the EU manufacturing sector is decreasing, despite relatively stable growth in production. The increase in production is supported by increased industrial investment, particularly in machinery and equipment and R&D, supporting the drive in robotisation. Although the increased focus on automation means that fewer new jobs are expected to be created in manufacturing sectors, it is also expected to lead in new jobs opening in the supporting service industries. Current robotisation trends in the EU are not expected to lead to job destruction on a large scale, although they are expected to result in new jobs not being created. The current assumption is that existing workers in automation-prone sectors are likely to keep their jobs when robots are brought in, though they may see a role change or accept lower wages.
The baseline developed for the 2018 forecasting exercise does not include any particular assumptions on the impacts of Brexit; for the time being the projections assumes a business-as-usual, with no immediate impacts felt. Making assumptions about the Brexit impact on macroeconomic trends is difficult and will depend on the outcome of the terms negotiated. It was suggested that this could be developed as a sensitivity to the main projection work.

19CHAPTER 2.
Prospects for employment and labour force trends in Europe
Other macroeconomic issues taken into consideration were:(a) international trade, impact of Brexit but also looking more broadly at
tendencies towards increased protectionism and higher trade tariffs;(b) migration;(c) technological change;(d) volume of remittances.
Sensitivities are being designed to look at these issues in more detail (see Section 2.6).
2.3. Prospects for employment in Europe
Figure 3 summarises the annual rate of employment growth 2000-30 for the EU-28+3. Modest growth is expected, with total employment rising by around 0.5% per annum between 2020 and 2025 but slowing after that.
2
1.5
1
0.5
0
-0.5
-1
-1.5
-2
-2.52000 2005 2015 20252010 2020 2030
Annu
al g
row
th ra
te (%
)
Figure 3. Employment annual growth rate, EU-28+3
Source: Cedefop (2018 skills forecast).

20 Skills forecast: trends and challenges to 2030
Following the crisis, most countries experienced a negative effect on employment; while employment is expected to recover over the forecast period, this growth is likely to be dampened by increased economic uncertainty in the short term and by demographic trends in the longer term. In the short term, GDP growth is dampened by expected low wage growth in the EU and external geopolitical risks. In the longer term, the EU’s aging population is likely to lead to slower economic growth, as employers increasingly struggle to fill available positions. Expected growth 2020-30 will be weaker than it was in pre-crisis. This finding needs to be interpreted in a context where rising participation rates and net migration will not be sufficient to reverse the declining trend.
While modest employment growth is projected for the EU-28+Norway and Switzerland, some decline is expected in some countries, such as Bulgaria, Croatia, Germany, Estonia, Latvia and Lithuania (Annex 2). This is mainly linked to the decline in working age population, either as a result of aging population or because of increased outward migration.
The heavy job losses caused by the various debt crises in countries such as Greece, Spain, Lithuania and Cyprus are reflected in the average rate of growth over the period 2010-15, characterised by increased volatility (see Figure 3). Over the period 2016-20 a modest recovery is expected for most countries.
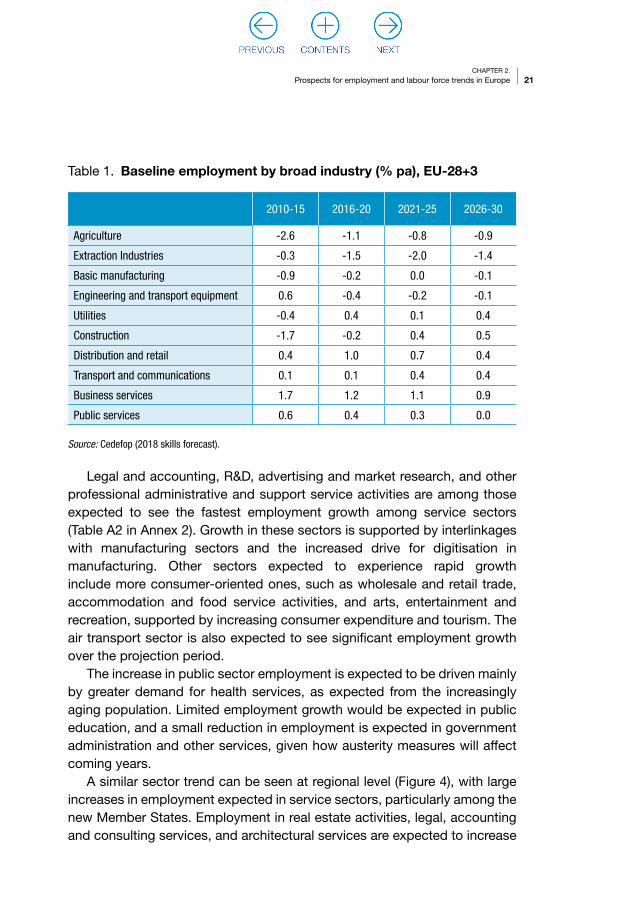
Table 1 summarises average annual employment growth across the EU-28+3 for 10 broad industry sectors. The numbers capture the decline in employment in primary industries and basic manufacturing. Service sectors are expected to be the main drivers of employment growth over 2016-30, although the pace of growth slows after 2025. The decline in basic manufacturing is expected to slow somewhat in the medium term, supported by increased activity in other sectors (such as construction), but the sector is not expected to bounce back to historical employment levels. The general trend for the region as a whole captured by these data is a transition towards a more service-based economy.
21CHAPTER 2.
Prospects for employment and labour force trends in Europe
Table 1. Baseline employment by broad industry (% pa), EU-28+3
2010-15 2016-20 2021-25 2026-30
Agriculture -2.6 -1.1 -0.8 -0.9
Extraction Industries -0.3 -1.5 -2.0 -1.4
Basic manufacturing -0.9 -0.2 0.0 -0.1
Engineering and transport equipment 0.6 -0.4 -0.2 -0.1
Utilities -0.4 0.4 0.1 0.4
Construction -1.7 -0.2 0.4 0.5
Distribution and retail 0.4 1.0 0.7 0.4
Transport and communications 0.1 0.1 0.4 0.4
Business services 1.7 1.2 1.1 0.9
Public services 0.6 0.4 0.3 0.0
Source: Cedefop (2018 skills forecast).
Legal and accounting, R&D, advertising and market research, and other professional administrative and support service activities are among those expected to see the fastest employment growth among service sectors (Table A2 in Annex 2). Growth in these sectors is supported by interlinkages with manufacturing sectors and the increased drive for digitisation in manufacturing. Other sectors expected to experience rapid growth include more consumer-oriented ones, such as wholesale and retail trade, accommodation and food service activities, and arts, entertainment and recreation, supported by increasing consumer expenditure and tourism. The air transport sector is also expected to see significant employment growth over the projection period.
The increase in public sector employment is expected to be driven mainly by greater demand for health services, as expected from the increasingly aging population. Limited employment growth would be expected in public education, and a small reduction in employment is expected in government administration and other services, given how austerity measures will affect coming years.
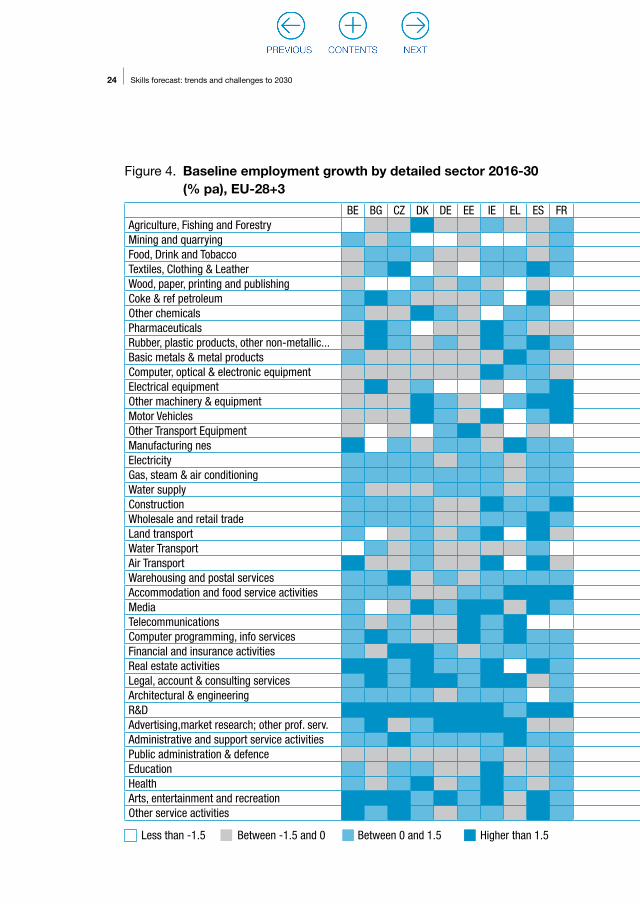
A similar sector trend can be seen at regional level (Figure 4), with large increases in employment expected in service sectors, particularly among the new Member States. Employment in real estate activities, legal, accounting and consulting services, and architectural services are expected to increase

22 Skills forecast: trends and challenges to 2030
significantly in most new Member States, particularly in Bulgaria, Latvia, Lithuania, Poland, Slovenia, Slovakia and Romania. Employment in R&D is expected to increase significantly across most EU countries, highlighting the leading position of the EU in R&D activity (6). Employment increases in the wholesale and retail sectors are more muted, as activity is more dependent on consumer activity, which is in turn affected by long-term declining population trends. Accommodation and food services activities is a more leisure and tourist-oriented sector, so larger employment increases are expected where tourism plays an important role in the economy (such as Greece, Spain and Portugal).
Some high value-added manufacturing sectors are also expected to see substantial employment growth in certain countries: examples are electrical equipment in France, and other machinery and equipment manufacturing and motor vehicles in Spain and France. Employment in the motor vehicles sector is expected to increase significantly in several EU countries, such as Ireland, France, Romania and some of the Baltic States. The increase in motor vehicles activity is not so much driven by internal demand – as the EU is a mature market – but by the prospect of increased exports to rapidly growing markets, such as China and countries in Latin America. Employment increases in computer, optical and electronic equipment are also expected in most countries, although the rates of increase are smaller than those in motor vehicles. Employment in basic manufacturing sectors (such as textiles, clothing and leather, wood, paper, printing and publishing, or basic metals and metal products) is expected to decrease by 2030 in almost all Member States. The trend is for increased focus on advanced manufacturing and high value-added activities, while more basic manufacturing activities remain in decline.
The analysis undertaken by Eurofound (see Chapter 5) looked at the future of manufacturing in Europe and discovered that, under certain circumstances, advanced manufacturing sectors are expected to benefit more when compared to current baseline trends.
Employment in public administration and defence is expected to see a reduction in almost all EU countries. Declining employment is also
(6) Some 30 EU companies are among the world's top 100 R&D investors. In the fiscal year 2015/16 the EU saw an annual increase in R&D expenditure of 7.5%, which puts EU companies ahead of the global (6.6%) and US (5.9%) trends: https://ec.europa.eu/jrc/en/news/eu-companies-rd-investment-grows-faster-global-and-us-trends
23CHAPTER 2.
Prospects for employment and labour force trends in Europe
expected in agriculture, and mining and quarrying sectors, but this varies across countries.
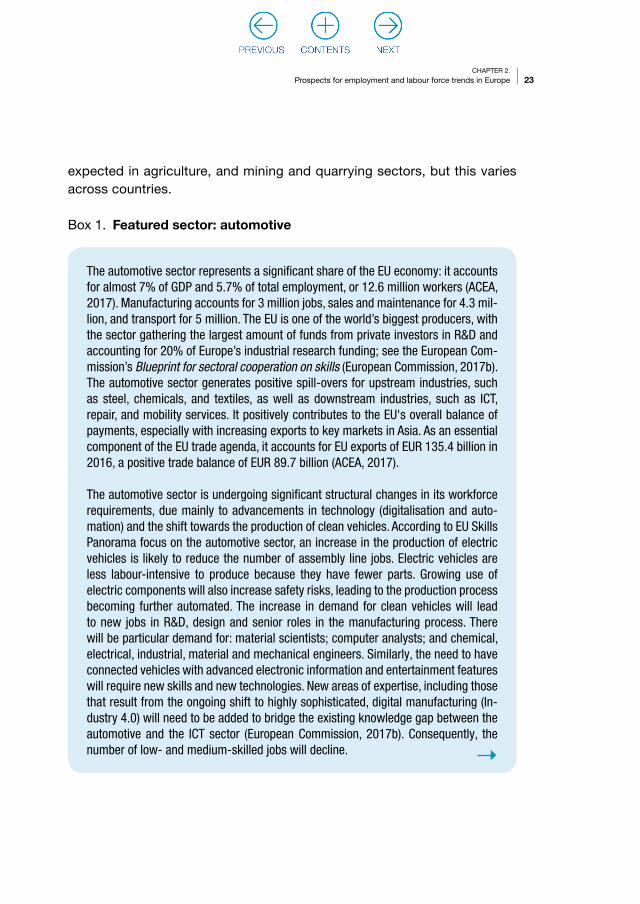
Box 1. Featured sector: automotive
The automotive sector represents a significant share of the EU economy: it accounts for almost 7% of GDP and 5.7% of total employment, or 12.6 million workers (ACEA, 2017). Manufacturing accounts for 3 million jobs, sales and maintenance for 4.3 mil-lion, and transport for 5 million. The EU is one of the world’s biggest producers, with the sector gathering the largest amount of funds from private investors in R&D and accounting for 20% of Europe’s industrial research funding; see the European Com-mission’s Blueprint for sectoral cooperation on skills (European Commission, 2017b). The automotive sector generates positive spill-overs for upstream industries, such as steel, chemicals, and textiles, as well as downstream industries, such as ICT, repair, and mobility services. It positively contributes to the EU's overall balance of payments, especially with increasing exports to key markets in Asia. As an essential component of the EU trade agenda, it accounts for EU exports of EUR 135.4 billion in 2016, a positive trade balance of EUR 89.7 billion (ACEA, 2017).
The automotive sector is undergoing significant structural changes in its workforce requirements, due mainly to advancements in technology (digitalisation and auto-mation) and the shift towards the production of clean vehicles. According to EU Skills Panorama focus on the automotive sector, an increase in the production of electric vehicles is likely to reduce the number of assembly line jobs. Electric vehicles are less labour-intensive to produce because they have fewer parts. Growing use of electric components will also increase safety risks, leading to the production process becoming further automated. The increase in demand for clean vehicles will lead to new jobs in R&D, design and senior roles in the manufacturing process. There will be particular demand for: material scientists; computer analysts; and chemical, electrical, industrial, material and mechanical engineers. Similarly, the need to have connected vehicles with advanced electronic information and entertainment features will require new skills and new technologies. New areas of expertise, including those that result from the ongoing shift to highly sophisticated, digital manufacturing (In-dustry 4.0) will need to be added to bridge the existing knowledge gap between the automotive and the ICT sector (European Commission, 2017b). Consequently, the number of low- and medium-skilled jobs will decline.
24 Skills forecast: trends and challenges to 2030
BE BG CZ DK DE EE IE EL ES FR HR IT CY LV LT LU HU MT NL AT PL PT RO SI SK FI SE UKAgriculture, Fishing and ForestryMining and quarryingFood, Drink and TobaccoTextiles, Clothing & LeatherWood, paper, printing and publishingCoke & ref petroleumOther chemicalsPharmaceuticalsRubber, plastic products, other non-metallic...Basic metals & metal productsComputer, optical & electronic equipmentElectrical equipmentOther machinery & equipmentMotor VehiclesOther Transport EquipmentManufacturing nesElectricityGas, steam & air conditioningWater supplyConstructionWholesale and retail tradeLand transportWater TransportAir TransportWarehousing and postal servicesAccommodation and food service activitiesMediaTelecommunicationsComputer programming, info servicesFinancial and insurance activitiesReal estate activitiesLegal, account & consulting servicesArchitectural & engineeringR&DAdvertising,market research; other prof. serv.Administrative and support service activitiesPublic administration & defenceEducationHealthArts, entertainment and recreationOther service activities
Less than -1.5 Between -1.5 and 0 Between 0 and 1.5 Higher than 1.5
Figure 4. Baseline employment growth by detailed sector 2016-30 (% pa), EU-28+3

25CHAPTER 2.
Prospects for employment and labour force trends in Europe
BE BG CZ DK DE EE IE EL ES FR HR IT CY LV LT LU HU MT NL AT PL PT RO SI SK FI SE UKAgriculture, Fishing and ForestryMining and quarryingFood, Drink and TobaccoTextiles, Clothing & LeatherWood, paper, printing and publishingCoke & ref petroleumOther chemicalsPharmaceuticalsRubber, plastic products, other non-metallic...Basic metals & metal productsComputer, optical & electronic equipmentElectrical equipmentOther machinery & equipmentMotor VehiclesOther Transport EquipmentManufacturing nesElectricityGas, steam & air conditioningWater supplyConstructionWholesale and retail tradeLand transportWater TransportAir TransportWarehousing and postal servicesAccommodation and food service activitiesMediaTelecommunicationsComputer programming, info servicesFinancial and insurance activitiesReal estate activitiesLegal, account & consulting servicesArchitectural & engineeringR&DAdvertising,market research; other prof. serv.Administrative and support service activitiesPublic administration & defenceEducationHealthArts, entertainment and recreationOther service activities
Source: Cedefop (2018 skills forecast).

26 Skills forecast: trends and challenges to 2030
Recognising the strategic importance of the automotive sector, the European Com-mission increased the funds available for cooperative research and innovation in the sector for 2014-20. In 2012, it launched the CARS 2020 action plan to steer the development of the sector, which was then facing hardship. The plan laid out a common view of the automotive sector focusing on four areas: financing innova-tions, improving market conditions, facilitating internationalisation and responding to change (European Commission, 2012; European Commission, 2014; European Commission, 2017c). Analysis of key automotive trends was deepened in 2015, with the launch of the high-level group GEAR 2030, bringing together public and private stakeholders to reflect on the competitiveness of the sector amid changes in value chains and advancements in technology. GEAR 2030 resulted in a series of policy recommendations to regulate, foster investments, accommodate structural changes brought by digitalisation and manage international trade. See GEAR 2030 final report (European Commission, 2017c).
The key challenges and opportunities for this sector are rapid policy and technology changes that have started to take place: demand for clean vehicles, sustainability and the potential for self-driving cars. These changes are expected to lead to a sub-stantial shift in the skill requirement of this sector, which may need support from policy-makers.
2.4. Labour force trends
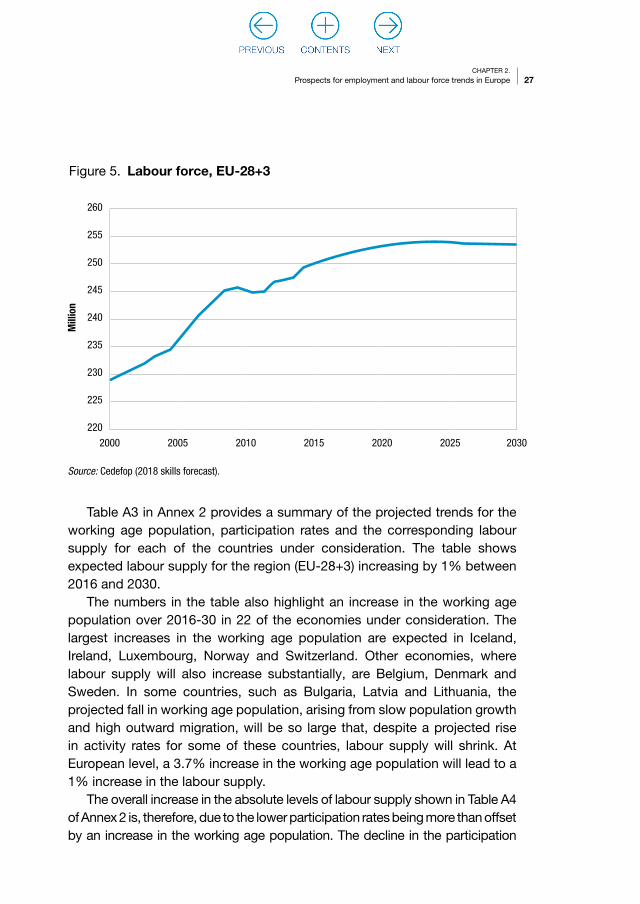
Figure 5 shows the projected path for the labour force in the EU-28+3. As can be seen from the figure, total labour force shows an upward trend following the modest economic growth after the crisis. This path stabilises from 2020 onwards, although a slow decline is expected to take place closer to 2030. The increase in the labour force in the aftermath of the economic crisis is partly explained by an increase in participation of the oldest cohorts; changes in regulations to extend working life and the unsustainable burden of public pension systems, seen in countries such as Spain, are contributory factors. The slow decline of the labour force in the medium term highlights the need for public intervention to encourage participation in the labour market.
27CHAPTER 2.
Prospects for employment and labour force trends in Europe
Table A3 in Annex 2 provides a summary of the projected trends for the working age population, participation rates and the corresponding labour supply for each of the countries under consideration. The table shows expected labour supply for the region (EU-28+3) increasing by 1% between 2016 and 2030.
The numbers in the table also highlight an increase in the working age population over 2016-30 in 22 of the economies under consideration. The largest increases in the working age population are expected in Iceland, Ireland, Luxembourg, Norway and Switzerland. Other economies, where labour supply will also increase substantially, are Belgium, Denmark and Sweden. In some countries, such as Bulgaria, Latvia and Lithuania, the projected fall in working age population, arising from slow population growth and high outward migration, will be so large that, despite a projected rise in activity rates for some of these countries, labour supply will shrink. At European level, a 3.7% increase in the working age population will lead to a 1% increase in the labour supply.
The overall increase in the absolute levels of labour supply shown in Table A4 of Annex 2 is, therefore, due to the lower participation rates being more than offset by an increase in the working age population. The decline in the participation
260
255
250
245
240
235
230
225
2202000 2005 2015 20252010 2020 2030
Mill
ion
Figure 5. Labour force, EU-28+3
Source: Cedefop (2018 skills forecast).

28 Skills forecast: trends and challenges to 2030
rate does not particularly reflect changes in the willingness of any particular age group to seek employment; it is related to changes in the relative sizes of the labour groups. The share of older (55+) workers in particular is increasing while the respective share of the ‘core’ workforce (25 to 54) is declining.
Figure 6 highlights the baseline projection for average labour participation rates in the EU-28+3; a steady decline can be observed from 2020 onwards. Although some countries (Denmark, Hungary) experience increases in average participation rates between 2016 and 2030, a reduction could be expected for most of the countries under scrutiny.
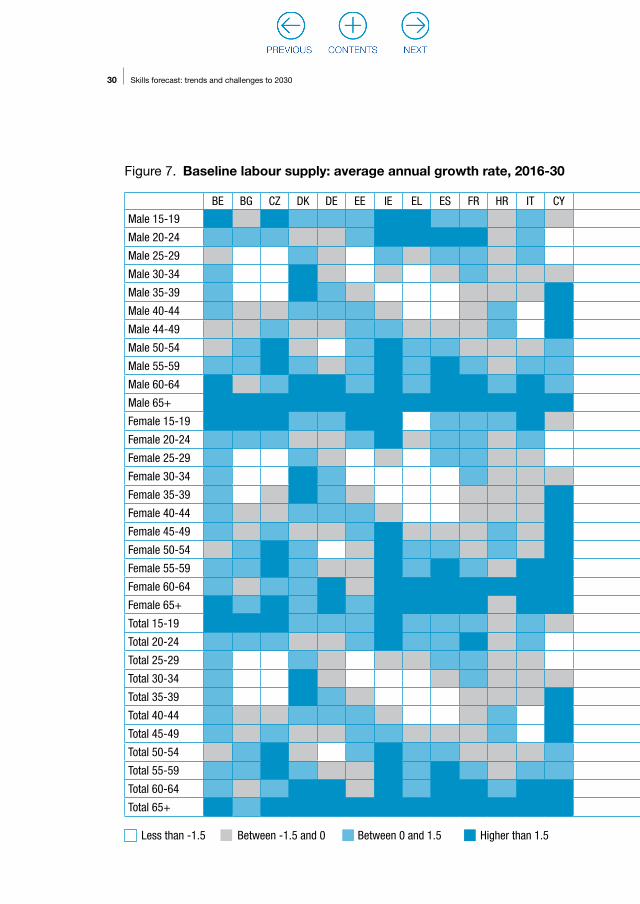
For a better understanding of the projected dynamics in each demographic group, Table A4 in Annex 2 provides a detailed breakdown by gender and age group. The figures show that the population in younger age groups is expected to fall substantially, while in the older age groups it will rise. This results in an ageing population, as both birth and death rates decline and more people enter into groups with lower participation rates. Participation rates among the older age groups, however, are expected to increase (from a low base), as general health and fitness improvements enable people to work longer and retirement ages rise along with pressure to continue working to
0.58
0.57
0.56
0.55
0.542000 2005 2015 20252010 2020 2030
Part
icip
atio
n ra
tes
(%)
Figure 6. Labour participation rates, EU-28+3
Source: Cedefop (2018 skills forecast).
29CHAPTER 2.
Prospects for employment and labour force trends in Europe
top up pensions. Increases in the participation rate are observed particularly in the 55 to 64 age group.
However, the increases in participation rates among the older age groups do not offset the large decreases in population (and, in some cases, participation rates) of the younger age groups. Participation of younger people is also declining in some cases because of the increasing trend to remain in education past the compulsory stage, as access to education and training becomes easier and the labour market becomes more competitive. This results in a decline in participation rates for the youngest age group.
For males, the age group that is expected to contribute substantially to the increase in labour supply is 65+ (2.7 million), while for females the main contribution is expected to come from those aged 60 to 64 (1.7 million). This is followed closely by the 60 to 64 age group (2.5 million) for males and the 65+ group for females (1.2 million).
Figure 7 shows clearly the general pattern of increased participation among older age groups alongside the fall among younger age groups. There are important differences in each country: for example, Cyprus, Latvia, Romania and Finland show a reduction in the average labour supply within older age groups, in contrast with the general trend.
2.5. Imbalances between labour supply and demand
This section focuses on the scale of differences between aggregate labour demand and supply. For a more detailed analysis of labour market imbalances and mismatches, please refer to Section 4.3.
Figure 8 summarises the expected unemployment rates that accompany the baseline projections of labour supply and demand. The figure reports the unemployment rate over the period 2000-30 by six broad European regions. An increase is observed in all regions in 2009, following the financial and economic crisis, although the group comprising Austria, Germany and Switzerland quickly returns to its long-term downward trend. The fact that UK and Ireland (combined) and the central and eastern European countries peaked in 2011 can be interpreted as a lagged response to the economic downturn. Many countries are forecast to return to pre-crisis unemployment levels by 2030, although the recovery in Southern Europe is much slower compared to the other groups.
30 Skills forecast: trends and challenges to 2030
Less than -1.5 Between -1.5 and 0 Between 0 and 1.5 Higher than 1.5
Figure 7. Baseline labour supply: average annual growth rate, 2016-30
BE BG CZ DK DE EE IE EL ES FR HR IT CY LV LT LU HU MT NL AT PL PT RO SI SK FI SE UK
Male 15-19
Male 20-24
Male 25-29
Male 30-34
Male 35-39
Male 40-44
Male 44-49
Male 50-54
Male 55-59
Male 60-64
Male 65+
Female 15-19
Female 20-24
Female 25-29
Female 30-34
Female 35-39
Female 40-44
Female 45-49
Female 50-54
Female 55-59
Female 60-64
Female 65+
Total 15-19
Total 20-24
Total 25-29
Total 30-34
Total 35-39
Total 40-44
Total 45-49
Total 50-54
Total 55-59
Total 60-64
Total 65+

31CHAPTER 2.
Prospects for employment and labour force trends in Europe
Source: Cedefop (2018 skills forecast).
BE BG CZ DK DE EE IE EL ES FR HR IT CY LV LT LU HU MT NL AT PL PT RO SI SK FI SE UK
Male 15-19
Male 20-24
Male 25-29
Male 30-34
Male 35-39
Male 40-44
Male 44-49
Male 50-54
Male 55-59
Male 60-64
Male 65+
Female 15-19
Female 20-24
Female 25-29
Female 30-34
Female 35-39
Female 40-44
Female 45-49
Female 50-54
Female 55-59
Female 60-64
Female 65+
Total 15-19
Total 20-24
Total 25-29
Total 30-34
Total 35-39
Total 40-44
Total 45-49
Total 50-54
Total 55-59
Total 60-64
Total 65+

32 Skills forecast: trends and challenges to 2030
The fall in unemployment rates should be considered in the context of a shrinking population and labour force. In most cases it may be more driven by a rapidly shrinking labour force rather than increased economic activity.
2.6. Dealing with uncertainty
As with any modelling, the projections are subject to a degree of uncertainty. This can be linked, for example, to the type of model used, model parameters and baseline, and to assumptions.
As part of the work to prepare the sectoral employment and labour force projections, a sensitivity analysis was carried out to explore the extent to which the labour market outlook is affected by alternative macroeconomic assumptions such as GDP growth. This section presents an analysis.
20
10
5
0
2000 2005 2015 20252010 2020 2030
%
Figure 8. Baseline unemployment rate (%), in EU regions
Source: Cedefop (2018 skills forecast).
Scandinavia France and Benelux Southern Europe CEEC Germany, Austria and Switzerland UK and Ireland
33CHAPTER 2.
Prospects for employment and labour force trends in Europe
The current short-term GDP trends were taken from the AMECO (7) May 2017 release, while the long-term projections were taken from the ageing report consistent with the Europop 2015 population projections (8).
There is still much uncertainty over the pace and sustainability of economic growth, given recent political and economic developments. While previous analyses focused on the impact of the external shock on EU economic growth, this sensitivity analysis offers alternative macroeconomic scenarios depending on the extent to which governments in Europe pursue policies that help to promote growth (9). Two scenarios are developed: ‘EU revival’ and ‘EU stagnation’. Under EU revival, governments take additional action to support research and innovation activities, and infrastructure projects, and to mitigate the skills gap. In the EU stagnation variant, support for innovation projects is reduced and limited infrastructure investment occurs, while the skill mismatch gap widens.
In what follows, the economic impacts of the scenarios are first summarised, providing an overall context for the more detailed labour market impacts. Then the results for employment demand are presented.
Figure 9 shows the evolution of GDP over time under the different sensitivities. In the EU revival sensitivity, increased support for innovation and skills leads to acceleration in growth, amounting to about an additional 1percentage point, to the annual growth rate each year until 2030. The EU stagnation case makes a similar difference in the opposite direction.
Table A5 in Annex 2 summarises the employment results in 2030 at Member State level. On average, employment in the EU in 2030 is 1.9% lower than the main projection in the EU stagnation case and 2.1% higher in the EU revival case.
There are large differences in employment impacts between the Member States, even though the sensitivity inputs for each Member State are broadly similar. The differences reflect the relative sectoral structure and trade patterns of each country. For example, output and employment in Germany are particularly affected in these sensitivities because its economy
(7) European Commission’s annual macroeconomic database (AMECO). https://ec.europa.eu/info/business-economy-euro/indicators-statistics/economic-databases/macro-economic-database-ameco_en
(8) Eurostat population projections 2015. http://ec.europa.eu/eurostat/web/population-demography-migration-projections/population-projections-data
(9) This analysis is more stylised compared to the work undertaken for the Eurofound project The future of manufacturing in Europe, which is presented in Chapter 5.

34 Skills forecast: trends and challenges to 2030
5
2.5
0
-2.5
-5
2000 2005 2015 20252010 2020 2030
Annu
al g
row
th ra
te (%
)
Figure 9. GDP growth (%), in EU-28+3
Source: Cedefop (2018 skills forecast).
EU revival
EU stagnation
is more sensitive to differences in investment and R&D spending (both within Germany and in the rest of the EU).
Figure 10 and Figure 11 present the sectoral impacts by Member State. Employment is typically most affected (in Figure 10, darker shades indicate positive effects; in Figure 11, lighter shades indicate a more negative impact) in the sectors that are most closely associated with investment and R&D activities. These are:(a) R&D, consulting services, computer programming and advanced
manufacturing;(b) sectors that form part of the supply chain for these.
Some sectors, such as agriculture, have results that go against the main trends in employment. In agriculture, there is little change in economic output as demand for food (agricultural products) is less affected during an economic downturn. Wages in the agricultural sector are more flexible, falling in the EU stagnation sensitivity and allowing for employment in this sector to be maintained.
35CHAPTER 2.
Prospects for employment and labour force trends in Europe
2.7. Concluding remarks
Employment growth in the EU is expected to be moderate over the projection period to 2030. Aging or declining populations in the larger EU economies mean that employers are likely to have difficulty filling existing and new jobs.
Most of the employment growth over the projection period is expected to be in service sectors, along with some advanced manufacturing sectors. The fastest growing service sectors are expected to be: legal and accounting; R&D; advertising and market research; other professional; and administrative and support service activities. Among manufacturing sectors, electrical equipment, other machinery and equipment, manufacturing, and motor vehicles are expected to see strong employment growth in some countries.
The European labour force is expected to continue to expand in the coming years, although the pace of increase will slow after 2020 when the labour force level is expected to remain stable. The increase in labour supply is caused by gradually rising participation rates, particularly among older workers, in part because of increases in the statutory retirement age and because of the unsustainable burden of public pension systems in some EU countries.

36 Skills forecast: trends and challenges to 2030
Less than -1.5 Between -1.5 and 0 Between 0 and 1.5 Higher than 1.5
Figure 10. EU revival: percentage differences from baseline in 2030
BE BG CZ DK DE EE IE EL ES FR HR IT CY LV LT LU HU MT NL AT PL PT RO SI SK FI SE UKAgriculture, Fishing and ForestryMining and quarryingFood, Drink and TobaccoTextiles, Clothing & LeatherWood, paper, printing and publishingCoke & ref petroleumOther chemicalsPharmaceuticalsRubber, plastic products, other non-metallic...Basic metals & metal productsComputer, optical & electronic equipmentElectrical equipmentOther machinery & equipmentMotor VehiclesOther Transport EquipmentManufacturing nesElectricityGas, steam & air conditioningWater supplyConstructionWholesale and retail tradeLand transportWater TransportAir TransportWarehousing and postal servicesAccommodation and food service activitiesMediaTelecommunicationsComputer programming, info servicesFinancial and insurance activitiesReal estate activitiesLegal, account & consulting servicesArchitectural & engineeringR&DAdvertising,market research; other prof. serv.Administrative and support service activitiesPublic administration & defenceEducationHealthArts, entertainment and recreationOther service activities

37CHAPTER 2.
Prospects for employment and labour force trends in Europe
Source: Cedefop (2018 skills forecast).
BE BG CZ DK DE EE IE EL ES FR HR IT CY LV LT LU HU MT NL AT PL PT RO SI SK FI SE UKAgriculture, Fishing and ForestryMining and quarryingFood, Drink and TobaccoTextiles, Clothing & LeatherWood, paper, printing and publishingCoke & ref petroleumOther chemicalsPharmaceuticalsRubber, plastic products, other non-metallic...Basic metals & metal productsComputer, optical & electronic equipmentElectrical equipmentOther machinery & equipmentMotor VehiclesOther Transport EquipmentManufacturing nesElectricityGas, steam & air conditioningWater supplyConstructionWholesale and retail tradeLand transportWater TransportAir TransportWarehousing and postal servicesAccommodation and food service activitiesMediaTelecommunicationsComputer programming, info servicesFinancial and insurance activitiesReal estate activitiesLegal, account & consulting servicesArchitectural & engineeringR&DAdvertising,market research; other prof. serv.Administrative and support service activitiesPublic administration & defenceEducationHealthArts, entertainment and recreationOther service activities

38 Skills forecast: trends and challenges to 2030
Less than -1.5 Between -1.5 and 0 Between 0 and 1.5 Higher than 1.5
Figure 11. EU stagnation: percentage differences from baseline in 2030
BE BG CZ DK DE EN IE EL ES FR HR IT CY LV LT LX HU MT NL AT PL PT RO SI SK FI SW UKAgriculture, Fishing and ForestryMining and quarryingFood, Drink and TobaccoTextiles, Clothing & LeatherWood, paper, printing and publishingCoke & ref petroleumOther chemicalsPharmaceuticalsRubber, plastic products, other non-metallic...Basic metals & metal productsComputer, optical & electronic equipmentElectrical equipmentOther machinery & equipmentMotor VehiclesOther Transport EquipmentManufacturing nesElectricityGas, steam & air conditioningWater supplyConstructionWholesale and retail tradeLand transportWater TransportAir TransportWarehousing and postal servicesAccommodation and food service activitiesMediaTelecommunicationsComputer programming, info servicesFinancial and insurance activitiesReal estate activitiesLegal, account & consulting servicesArchitectural & engineeringR&DAdvertising,market research; other prof. serv.Administrative and support service activitiesPublic administration & defenceEducationHealthArts, entertainment and recreationOther service activities

39CHAPTER 2.
Prospects for employment and labour force trends in Europe
Source: Cedefop (2018 skills forecast).
BE BG CZ DK DE EN IE EL ES FR HR IT CY LV LT LX HU MT NL AT PL PT RO SI SK FI SW UKAgriculture, Fishing and ForestryMining and quarryingFood, Drink and TobaccoTextiles, Clothing & LeatherWood, paper, printing and publishingCoke & ref petroleumOther chemicalsPharmaceuticalsRubber, plastic products, other non-metallic...Basic metals & metal productsComputer, optical & electronic equipmentElectrical equipmentOther machinery & equipmentMotor VehiclesOther Transport EquipmentManufacturing nesElectricityGas, steam & air conditioningWater supplyConstructionWholesale and retail tradeLand transportWater TransportAir TransportWarehousing and postal servicesAccommodation and food service activitiesMediaTelecommunicationsComputer programming, info servicesFinancial and insurance activitiesReal estate activitiesLegal, account & consulting servicesArchitectural & engineeringR&DAdvertising,market research; other prof. serv.Administrative and support service activitiesPublic administration & defenceEducationHealthArts, entertainment and recreationOther service activities

CHAPTER 3.
The implications for occupations
Key messages
Occupational employment trends will continue to be driven primarily by changes in sectoral employment patterns and (more importantly) by changes in occupational patterns within sectors driven by technological and other changes.There is expected to be continued polarisation within the labour market, with growth forecast in both high- and low-skill occupations.Replacement needs will outweigh expansion demands for most occupations and account for the bulk of new job openings.There remains a degree of uncertainty about occupational trends because of the short time series of data available on a consistent basis.
3.1. Introduction
Given the economic and sectoral prospects described in Chapter 2, this chapter summarises the implications for future skills. Skills are defined here by the occupation people are employed in. The way jobs are classified by occupation (using the international standard ISCO-08) provides a natural hierarchy, with some jobs being inherently more skilled than others. Demand for skills is measured by the levels of employment in different occupations. Skills can also be measured by the formal qualifications people hold or that are required in their jobs. This aspect is considered in Chapter 4.
3.2. Factors influencing occupational employment
The two main factors influencing the demand for skills in general are the changing sectoral structure of employment in the economy, and the impact of technological and other changes on the pattern of demand for skills within sectors.

41CHAPTER 3.
The implications for occupations
The sectoral projections drive the demands both for different occupations (the jobs people do) and for formal qualifications. Trends in occupational patterns (as a share of total employment) are expected to be less affected by the recession than sectoral trends. For many occupations, structural change at sectoral level is expected to be reinforced by changes within sectors, which affect the way goods and services are produced and delivered. These two factors are projected to produce a general increase in the demand for skills over the medium term (as measured by both occupation and qualification), as the economy recovers from recession.
Most of the increases in employment in recent years have been concentrated in higher skill level occupations, typically requiring higher-level formal qualifications, such as a university degree. These include areas such as management, professional and associate professional jobs. This pattern is expected to continue.
However, growth has also occurred in lower-level occupations (which do not normally require high-level formal qualifications), especially in parts of the service sector where it is difficult to automate tasks. This is also projected to continue.
There have been significant job losses for many traditional (especially manual) skills linked to the sectors where employment is in long-term decline. In many areas of manufacturing and primary industries, as well as some services, technology has enabled automation of production processes. These trends are expected to continue to 2030 and beyond. In many of these sectors output will continue to grow but growth will be ‘jobless’ (or even showing continued job losses).
Given the short time series of currently available consistent data, occupational trends are difficult to discern over recent years. Data are now available using the new ISCO-08 system of classifying occupations. However, projected trends are still largely reliant on the assumption of a continuation of past trends based on the nearest equivalent ISCO-88 category.
The main trends and key features of the changing occupational patterns of employment are illustrated in Table 2 (10). These results focus on the EU-28+3 countries. In most countries sectoral employment changes in favour of the
(10) The tables and graphs on occupations in this report do not include estimations for the armed forces. Therefore, the totals of occupational employment may differ from those presented elsewhere, for example on total sectoral employment where armed forces are implicitly included. The purpose of this estimation is to show trends in occupations rather than provide indications of total future employment.
42 Skills forecast: trends and challenges to 2030
service sector, and away from primary and manufacturing industries, are being reinforced by changes in the way work is organised and jobs are performed within sectors. In combination, these result in strong increases in demand for many high- and medium-skilled jobs, as well as for some lower-skilled occupations (especially those working in parts of the service sector) (11).
The fastest rates of growth at the one-digit level are projected for managerial professional, and associate professional and technical jobs (Table 2). These patterns are common to most countries and, rates of increases of above 10% are projected for these three categories between 2016 and 2030 across the EU-28+3. Some employment growth is also projected for some lower-level occupations, especially elementary ones, which form the least-skilled occupational group. This is also projected to see employment growth of over 10% between 2016 and 2030.
Table A6 in Annex 3 shows the results at the two-digit level, revealing a more complex picture. Rapid rates of growth are projected for occupations such as business and administration professionals and legal professionals; both are projected to grow by over 20% between 2016 and 2030. The fastest increases are projected for legal, social, cultural and related associate professionals. The fastest rates of job losses over the same period are projected for lower skill level clerical workers and for various occupations associated with manual work in manufacturing. These are categories where technological changes are continuing to result in job losses due to automation of many routine tasks.
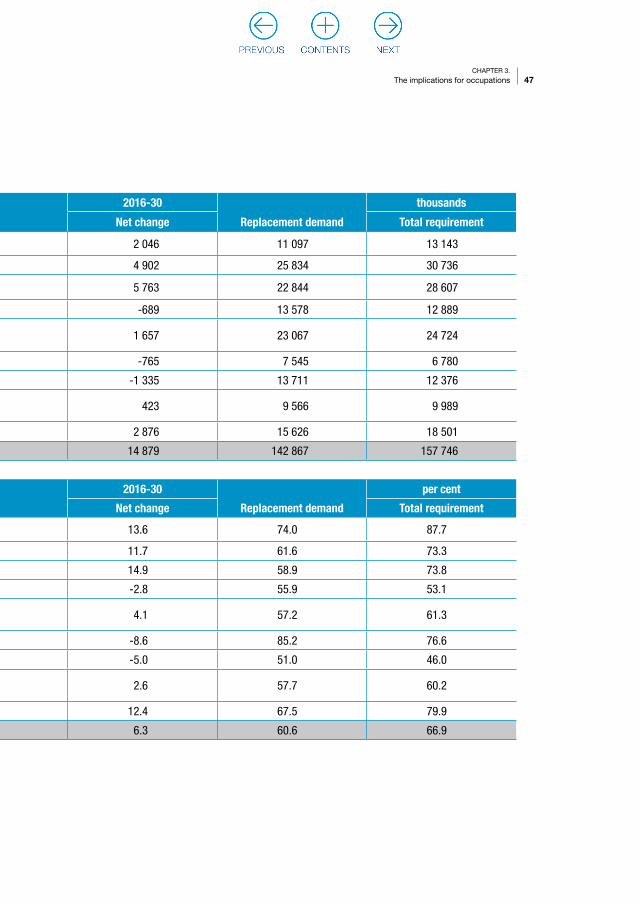
Table 2 shows the net changes in numbers in employment, at the one-digit and two-digit level of ISCO-08, respectively. Such changes are often referred to as expansion demand, although they may be negative; the term distinguishes such demand from replacement needs. The latter term refers to the number of job openings arising because of people leaving the employed workforce for retirement or other reasons. Table 2 distinguishes both elements. Total requirements are the sum of the net change (or expansion demands) and replacement demands. Together these represent the total number of job openings (net of any general labour turnover).
The results emphasise that replacement needs are generally much more significant than expansion demand. For all occupations, employment is projected to increase by around 6% between 2016 and 2030 (around 14
(11) High-skilled occupations are considered those in ISCO 1-3. Medium-skilled are considered those in ISCO 4-8, and low-skilled those in ISCO 9.

43CHAPTER 3.
The implications for occupations
million jobs for the EU-28+3 as a whole). Replacement needs are projected to be almost 10 times as large over the same period, as employers need to replace those leaving the workforce due to retirement and other factors. These issues are discussed in more detail in Section 3.3.
The results suggest significant growth in employment levels for higher skill level occupations (managers, professionals and associate professionals) with some growth also expected for less-skilled jobs: sales, security, cleaning, catering and caring occupations. Job losses are projected for many skilled manual workers (especially in agriculture) and for clerks. This can be characterised as a continuation of the trends towards a polarisation of skill demand, with hollowing out of many of the jobs at the middle skill level.
Figure 12 illustrates this graphically, focusing on the nine one-digit occupational categories. Positive trends are expected in management, professional and associate professional occupations, as well as for many service workers, especially in retail and distribution, and restaurants and hotels. There will be many extra jobs for occupations requiring few or no formal skills. Polarisation is a key feature of the results.
Table A6 in Annex 3 presents similar information at the two-digit level. The picture here is more complex but the general picture remains of some job growth at both high- and low-skill levels, and job losses among many middle-skilled jobs, especially those involved in more routine physical and non-manual tasks. The negative bars in the middle section of the figure indicate the hollowing out of many routine clerical and manual jobs.
A significant part of the changes in occupational employment levels projected can be attributed to changes in the sectoral structure of the economy, notably the continuing shift towards services and away from primary and manufacturing industries.
Because reliable information on trends on occupational employment patterns within industries is sparse, an initial projection is made on the assumption of fixed occupational shares: this means holding the occupational employment shares within industries fixed at their present values for all future years. In this case, changes in the mix of employment by occupation would entirely reflect changes in the mix of employment by sector.
Figure 13 and Table A7 in Annex 3 provide a formal analysis of historical experiences, using shift-share techniques. The part of the overall change in employment levels that is attributable to shifts in occupational employment structure within industries is set out for the 41 two-digit occupational
44 Skills forecast: trends and challenges to 2030
categories. Figure 13 and Table A7 illustrate this with bar charts that separate out the three main elements: scale, industry and occupational effects.
The employment level is projected to increase across all industries and services by about 6.4% between 2016 and 2030. For the EU-28+3 this represents about 15 million jobs. This is the so-called scale effect. If nothing else were to change, each occupation might be expected to grow by a similar percentage.
The second aspect identified is the so-called industry effect. This shows for each occupation how much employment would change if occupational employment patterns remained fixed over the projection period. This benefits those occupations in industries or sectors that are growing, at the expense of occupations concentrated in declining sectors. For example, the agriculture and fisheries sector is in long-term decline in terms of employment in many countries, reducing demand for occupations specific to that sector. By contrast, the health care sector has undergone rapid employment growth in most countries, resulting in more job opportunities for occupations such as doctor and nurse.
The ‘occupational effect’ is the residual. This shows those occupations projected to gain or lose from the assumption of changes in occupational employment patterns within industries based on the old ISCO-88 trends. It reflects technological changes, such as the impact of information and communications technology and artificial intelligence. These and other technological changes are leading to the automation of many routine jobs. Changes to the way work is organised and other working practices will also affect the mix of jobs by occupation within sectors.
By combining the scale and industry effects it is possible to produce an alternative projection for 2030 based on the assumption that occupational patterns within industries do not change from their 2016 values. From this comparison it is clear that occupational effects (technological change and other factors influencing the patterns of occupational employment within sectors) will be a key factor driving skill demand over the next decade or so.
Figure 13 and Figure A2 in Annex 3 illustrate this graphically. In Figure 13 the bars indicating the occupational effect (in grey) show that a large part of the polarisation phenomenon discussed above (for the one-digit level occupations) results from the assumed changes in employment shares of occupations within industries, rather than scale or industry effects.
For managerial, professional, associate professional and technical occupations, and elementary occupations, these effects are all strongly
45CHAPTER 3.
The implications for occupations
positive; for clerks, service workers, shop and market sales workers, and craft and related trades workers they are all strongly negative. These patterns are also observable at the two-digit occupational level in Figure A2.
Figure 14 to Figure 16 provide further illustration of the main features of the occupational projections. Figure 14 groups the occupations into four broad skill categories. It highlights that it is the high-skilled, non-manual category that is projected to increase its share of total employment over 2016-30. The skilled non-manual and skilled manual categories are both projected to see their employment shares decline, while the elementary occupations category maintains its share. In all cases the changes in shares are slow but, apparently, inexorable and common to most countries.
Figure 15 also shows the slow but steady patterns of change in occupational employment structure, this time focusing on the one-digit level categories. Figure 16 illustrates what this means for the overall structure of employment, highlighting the importance of occupations such as professionals, technicians and associate professionals, as well as service workers and shop and market sales workers. These three groups account for the lion’s share of employment in most countries but it is the first two categories that are continuing to increase their employment shares.
Figure 17 provides a ‘heat map’ illustrating how these patterns vary across countries within the EU-28+3. The diagram shows how rates of change in occupational employment at the two-digit level vary by country. Darker cells indicate faster growth; lighter shades a more rapid employment decline. The most-rapid growth is projected in the top part of the diagram: managerial, professional and associate professional technical occupations. Growth is also expected for some lower-level skilled occupations in the bottom part of the diagram. It is in the middle area that the main job losses are expected to occur, with focus on lower-skilled, non-manual workers, especially clerks and higher- and semi-skilled manual workers.
However, the situation in each country is dependent on a whole range of national factors, including its existing sectoral employment structure and general economic situation. The patterns, therefore, are complex and the heat map shows that the patterns of change are far from uniform. The broad picture sketched out above for the EU-28+3 as a whole can be observed in most individual countries.

46 Skills forecast: trends and challenges to 2030
Table 2. Projected change by broad occupation, 2011-30 (EU-28+3)
thousands 2016-30 thousands
Levels (000s) 2011 2016 2021 2026 2030 Net change Replacement demand Total requirement
Legislators, senior officials and managers 14 239 14 992 15 712 16 502 17 038 2 046 11 097 13 143
Professionals 39 335 41 947 43 690 45 647 46 849 4 902 25 834 30 736
Technicians and associate professionals 36 572 38 757 40 766 42 980 44 520 5 763 22 844 28 607
Clerks 24 755 24 281 24 114 23 975 23 592 -689 13 578 12 889
Service workers and shop and market sales workers 39 254 40 354 41 357 42 067 42 011 1 657 23 067 24 724
Skilled agricultural and fishery workers 9 840 8 855 8 552 8 326 8 090 -765 7 545 6 780
Craft and related trades workers 28 511 26 898 26 266 25 947 25 563 -1 335 13 711 12 376
Plant and machine operators and assemblers 16 830 16 584 16 732 16 945 17 007 423 9 566 9 989
Elementary occupations 21 900 23 144 24 250 25 394 26 020 2 876 15 626 18 501
All occupations 231 237 235 812 241 438 247 782 250 691 14 879 142 867 157 746
per cent 2016-30 per cent
Shares (per cent) 2011 2016 2021 2026 2030 Net change Replacement demand Total requirement
Legislators, senior officials and managers 6.2 6.4 6.5 6.7 6.8 13.6 74.0 87.7
Professionals 17.0 17.8 18.1 18.4 18.7 11.7 61.6 73.3
Technicians and associate professionals 15.8 16.4 16.9 17.3 17.8 14.9 58.9 73.8
Clerks 10.7 10.3 10.0 9.7 9.4 -2.8 55.9 53.1
Service workers and shop and market sales workers 17.0 17.1 17.1 17.0 16.8 4.1 57.2 61.3
Skilled agricultural and fishery workers 4.3 3.8 3.5 3.4 3.2 -8.6 85.2 76.6
Craft and related trades workers 12.3 11.4 10.9 10.5 10.2 -5.0 51.0 46.0
Plant and machine operators and assemblers 7.3 7.0 6.9 6.8 6.8 2.6 57.7 60.2
Elementary occupations 9.5 9.8 10.0 10.2 10.4 12.4 67.5 79.9
All occupations 100.0 100.0 100.0 100.0 100.0 6.3 60.6 66.9
47CHAPTER 3.
The implications for occupations
thousands 2016-30 thousands
Levels (000s) 2011 2016 2021 2026 2030 Net change Replacement demand Total requirement
Legislators, senior officials and managers 14 239 14 992 15 712 16 502 17 038 2 046 11 097 13 143
Professionals 39 335 41 947 43 690 45 647 46 849 4 902 25 834 30 736
Technicians and associate professionals 36 572 38 757 40 766 42 980 44 520 5 763 22 844 28 607
Clerks 24 755 24 281 24 114 23 975 23 592 -689 13 578 12 889
Service workers and shop and market sales workers 39 254 40 354 41 357 42 067 42 011 1 657 23 067 24 724
Skilled agricultural and fishery workers 9 840 8 855 8 552 8 326 8 090 -765 7 545 6 780
Craft and related trades workers 28 511 26 898 26 266 25 947 25 563 -1 335 13 711 12 376
Plant and machine operators and assemblers 16 830 16 584 16 732 16 945 17 007 423 9 566 9 989
Elementary occupations 21 900 23 144 24 250 25 394 26 020 2 876 15 626 18 501
All occupations 231 237 235 812 241 438 247 782 250 691 14 879 142 867 157 746
per cent 2016-30 per cent
Shares (per cent) 2011 2016 2021 2026 2030 Net change Replacement demand Total requirement
Legislators, senior officials and managers 6.2 6.4 6.5 6.7 6.8 13.6 74.0 87.7
Professionals 17.0 17.8 18.1 18.4 18.7 11.7 61.6 73.3
Technicians and associate professionals 15.8 16.4 16.9 17.3 17.8 14.9 58.9 73.8
Clerks 10.7 10.3 10.0 9.7 9.4 -2.8 55.9 53.1
Service workers and shop and market sales workers 17.0 17.1 17.1 17.0 16.8 4.1 57.2 61.3
Skilled agricultural and fishery workers 4.3 3.8 3.5 3.4 3.2 -8.6 85.2 76.6
Craft and related trades workers 12.3 11.4 10.9 10.5 10.2 -5.0 51.0 46.0
Plant and machine operators and assemblers 7.3 7.0 6.9 6.8 6.8 2.6 57.7 60.2
Elementary occupations 9.5 9.8 10.0 10.2 10.4 12.4 67.5 79.9
All occupations 100.0 100.0 100.0 100.0 100.0 6.3 60.6 66.9

48 Skills forecast: trends and challenges to 2030
% per annum 2016-30 % per annum
Growth 2011-16 2016-21 2021-26 2026-30 2016-30 Net change Replacement demand Total requirement
Legislators, senior officials and managers 1.0 0.9 1.0 0.8 0.9 0.9 4.0 4.6
Professionals 1.3 0.8 0.9 0.7 0.8 0.8 3.5 4.0
Technicians and associate professionals 1.2 1.0 1.1 0.9 1.0 1.0 3.4 4.0
Clerks -0.4 -0.1 -0.1 -0.4 -0.2 -0.2 3.2 3.1
Service workers and shop and market sales workers
0.6 0.5 0.3 0.0 0.3 0.3 3.3 3.5
Skilled agricultural and fishery workers -2.1 -0.7 -0.5 -0.7 -0.6 -0.6 4.5 4.1
Craft and related trades workers -1.2 -0.5 -0.2 -0.4 -0.4 -0.4 3.0 2.7
Plant and machine operators and assemblers
-0.3 0.2 0.3 0.1 0.2 0.2 3.3 3.4
Elementary occupations 1.1 0.9 0.9 0.6 0.8 0.8 3.8 4.3
All occupations 0.4 0.5 0.5 0.3 0.4 0.4 3.4 3.7
thousands
Change 2011-16 2016-21 2021-26 2026-30 2016-30
Legislators, senior officials and managers 753 720 790 536 2 046
Professionals 2 612 1 742 1 957 1 202 4 902
Technicians and associate professionals 2 185 2 009 2 214 1 540 5 763
Clerks -474 -167 -139 -383 -689
Service workers and shop and market sales workers
1 100 1 002 710 -56 1 657
Skilled agricultural and fishery workers -985 -303 -226 -235 -765
Craft and related trades workers -1 613 -632 -319 -384 -1 335
Plant and machine operators and assemblers
-246 148 213 62 423
Elementary occupations 1 244 1 106 1 144 626 2 876
All occupations 4 575 5 626 6 344 2 909 14 879
NB: Categories shown are one-digit ISCO-08.Source: Cedefop (2018 skills forecast).

49CHAPTER 3.
The implications for occupations
% per annum 2016-30 % per annum
Growth 2011-16 2016-21 2021-26 2026-30 2016-30 Net change Replacement demand Total requirement
Legislators, senior officials and managers 1.0 0.9 1.0 0.8 0.9 0.9 4.0 4.6
Professionals 1.3 0.8 0.9 0.7 0.8 0.8 3.5 4.0
Technicians and associate professionals 1.2 1.0 1.1 0.9 1.0 1.0 3.4 4.0
Clerks -0.4 -0.1 -0.1 -0.4 -0.2 -0.2 3.2 3.1
Service workers and shop and market sales workers
0.6 0.5 0.3 0.0 0.3 0.3 3.3 3.5
Skilled agricultural and fishery workers -2.1 -0.7 -0.5 -0.7 -0.6 -0.6 4.5 4.1
Craft and related trades workers -1.2 -0.5 -0.2 -0.4 -0.4 -0.4 3.0 2.7
Plant and machine operators and assemblers
-0.3 0.2 0.3 0.1 0.2 0.2 3.3 3.4
Elementary occupations 1.1 0.9 0.9 0.6 0.8 0.8 3.8 4.3
All occupations 0.4 0.5 0.5 0.3 0.4 0.4 3.4 3.7
thousands
Change 2011-16 2016-21 2021-26 2026-30 2016-30
Legislators, senior officials and managers 753 720 790 536 2 046
Professionals 2 612 1 742 1 957 1 202 4 902
Technicians and associate professionals 2 185 2 009 2 214 1 540 5 763
Clerks -474 -167 -139 -383 -689
Service workers and shop and market sales workers
1 100 1 002 710 -56 1 657
Skilled agricultural and fishery workers -985 -303 -226 -235 -765
Craft and related trades workers -1 613 -632 -319 -384 -1 335
Plant and machine operators and assemblers
-246 148 213 62 423
Elementary occupations 1 244 1 106 1 144 626 2 876
All occupations 4 575 5 626 6 344 2 909 14 879
NB: Categories shown are one-digit ISCO-08.Source: Cedefop (2018 skills forecast).

50 Skills forecast: trends and challenges to 2030
Source: Cedefop (2018 skills forecast).
2 000-2 000 -1 000 0 1 000 4 000 5 000 6 000
Figure 12. Projected change by broad occupation, 2016-30 (EU-28+3)
Legislators, senior officials and managers
3 000
Occu
patio
n
Change 2016-30 (000s)
Elementary occupations
Plant and machine operators and assemblers
Craft and related trades workers
Skilled agricultural and fishery workers
Service workers and shop and market sales workers
Clerks
Technicians and associate professionals
Professionals
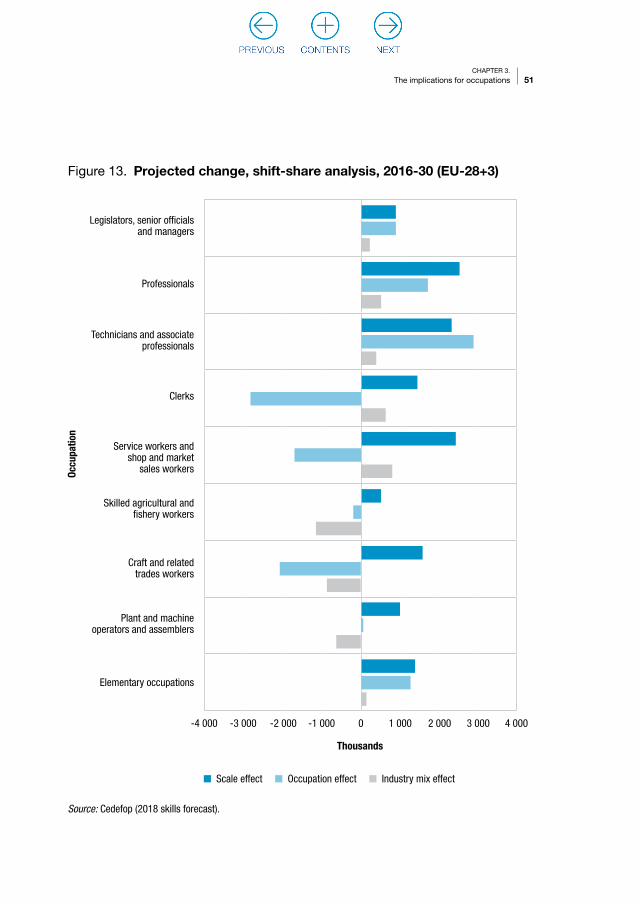
51CHAPTER 3.
The implications for occupations
Thousands
Source: Cedefop (2018 skills forecast).
Figure 13. Projected change, shift-share analysis, 2016-30 (EU-28+3)
Legislators, senior officials and managers
0-4 000 -3 000 -2 000 -1 000 2 000 3 000 4 0001 000
Occu
patio
n
Elementary occupations
Plant and machine operators and assemblers
Craft and related trades workers
Skilled agricultural and fishery workers
Service workers and shop and market
sales workers
Clerks
Technicians and associate professionals
Professionals
Scale effect Occupation effect Industry mix effect
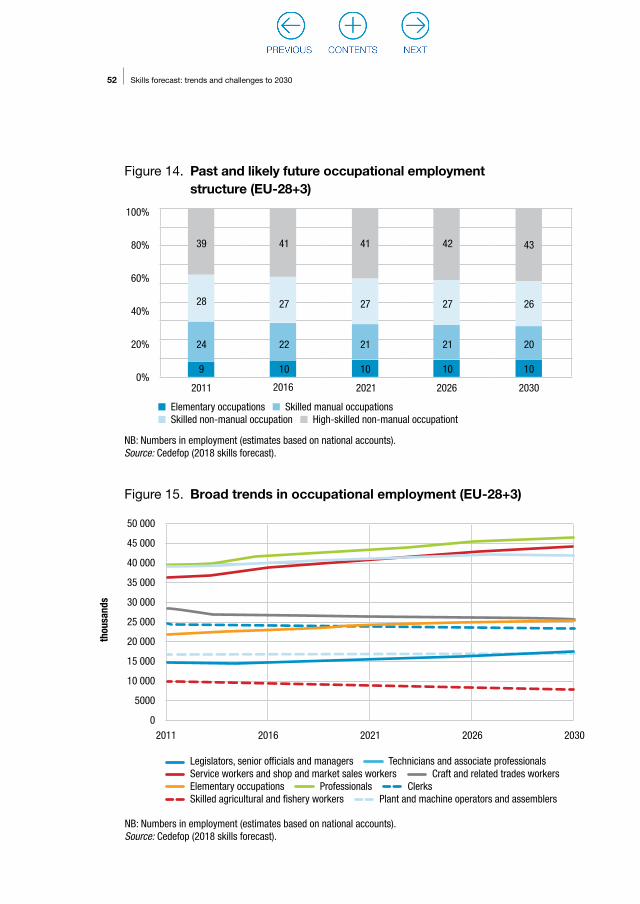
52 Skills forecast: trends and challenges to 2030
NB: Numbers in employment (estimates based on national accounts). Source: Cedefop (2018 skills forecast).
Figure 14. Past and likely future occupational employment structure (EU-28+3)
100%
80%
60%
40%
20%
0%
Elementary occupations Skilled manual occupations Skilled non-manual occupation High-skilled non-manual occupationt
2011
39
28
24
9
2016
41
27
22
10
2021
41
27
21
10
2026
42
27
21
10
2030
43
26
20
10
NB: Numbers in employment (estimates based on national accounts). Source: Cedefop (2018 skills forecast).
Legislators, senior officials and managers Technicians and associate professionals Service workers and shop and market sales workers Craft and related trades workers Elementary occupations Professionals Clerks Skilled agricultural and fishery workers Plant and machine operators and assemblers
50 000
45 000
40 000
35 000
30 000
25 000
20 000
15 000
10 000
5000
02011 2016 20262021 2030
thou
sand
s
Figure 15. Broad trends in occupational employment (EU-28+3)

53CHAPTER 3.
The implications for occupations
NB: Based on numbers in employment (estimates based on national accounts). Source: Cedefop (2018 skills forecast).
Figure 16. Changing occupational structure of employment (EU-28+3)
Legislators, senior officials and managers
Professionals
Technicians and associate professionals
Clerks
Service workers and shop and market sales workers
Skilled agricultural and fishery workers
Craft and related trades workers
Plant and machine operators and
assemblers
Elementary occupations
2030 2016
50 00045 00040 00035 00030 00025 00020 00015 00010 0005 000
0
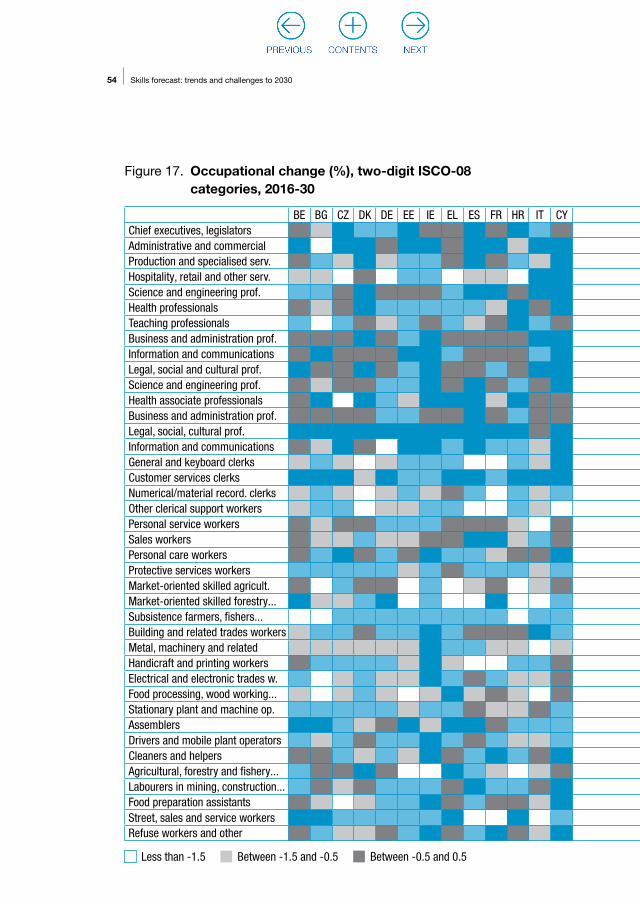
54 Skills forecast: trends and challenges to 2030
Less than -1.5 Between -1.5 and -0.5 Between -0.5 and 0.5
Figure 17. Occupational change (%), two-digit ISCO-08 categories, 2016-30
BE BG CZ DK DE EE IE EL ES FR HR IT CY LV LT LU HU MT NL AT PL PT RO SI SK FI SE UK IS NO CH MK TRChief executives, legislatorsAdministrative and commercialProduction and specialised serv.Hospitality, retail and other serv.Science and engineering prof.Health professionalsTeaching professionalsBusiness and administration prof.Information and communicationsLegal, social and cultural prof.Science and engineering prof.Health associate professionalsBusiness and administration prof.Legal, social, cultural prof.Information and communicationsGeneral and keyboard clerksCustomer services clerksNumerical/material record. clerks Other clerical support workersPersonal service workersSales workersPersonal care workersProtective services workersMarket-oriented skilled agricult.Market-oriented skilled forestry...Subsistence farmers, fishers...Building and related trades workersMetal, machinery and relatedHandicraft and printing workersElectrical and electronic trades w.Food processing, wood working...Stationary plant and machine op.AssemblersDrivers and mobile plant operatorsCleaners and helpersAgricultural, forestry and fishery...Labourers in mining, construction...Food preparation assistantsStreet, sales and service workersRefuse workers and other

55CHAPTER 3.
The implications for occupations
Between 0.5 and 1.5 Higher than 1.5 Source: Cedefop (2018 skills forecast).
BE BG CZ DK DE EE IE EL ES FR HR IT CY LV LT LU HU MT NL AT PL PT RO SI SK FI SE UK IS NO CH MK TRChief executives, legislatorsAdministrative and commercialProduction and specialised serv.Hospitality, retail and other serv.Science and engineering prof.Health professionalsTeaching professionalsBusiness and administration prof.Information and communicationsLegal, social and cultural prof.Science and engineering prof.Health associate professionalsBusiness and administration prof.Legal, social, cultural prof.Information and communicationsGeneral and keyboard clerksCustomer services clerksNumerical/material record. clerks Other clerical support workersPersonal service workersSales workersPersonal care workersProtective services workersMarket-oriented skilled agricult.Market-oriented skilled forestry...Subsistence farmers, fishers...Building and related trades workersMetal, machinery and relatedHandicraft and printing workersElectrical and electronic trades w.Food processing, wood working...Stationary plant and machine op.AssemblersDrivers and mobile plant operatorsCleaners and helpersAgricultural, forestry and fishery...Labourers in mining, construction...Food preparation assistantsStreet, sales and serviceRefuse workers and other

56 Skills forecast: trends and challenges to 2030
3.3. Replacement demand
In addition to focusing on trends in employment patterns by occupation and qualification (net changes in employment levels or so-called expansion demands), it is also important to take account of replacement needs. A significant part of the demand for skills in Europe is replacement demand (RD). In general terms, RD can be seen as job openings arising from a worker leaving a job, temporarily or permanently. The main cause of permanent separations is due to retirement, but other reasons for withdrawal from the labour force are emigration, sickness and, especially for women, family formation. However, RD also includes movements of workers from one occupation to another. These movements create a vacancy for the occupation left and demand for a worker to fill that vacancy. More details on the replacement demand methodology can be found in Cedefop (2012).
Average RD rates across all countries are about 3.7% each year. This varies from 2.6% (Hungary) to 5.0% (Iceland), as shown in Figure 18. Variation between countries can arise for a number of reasons: different retirement ages, a higher share of elderly workers that will soon reach pension age, or different outflow coefficients for younger workers.
RD rates by occupation are shown in Figure 19. As the RD rates by occupation may differ substantially between countries, they are given in a box-whisker plot to show this dispersion. Most EU country RD rates for each occupation lie within the dark shaded box (with the median as the white line). The black line on the left of the box indicates the minimum observed value of the RD rate of that occupation, while the black line on the right indicates the maximum observed value. Higher RD rates are generally related to the age structure in the occupational groups. Occupations with a higher share of older or senior workers, including senior officials and managers, have higher RD rates, while rates for occupations with a younger workforce are lower. Low RD rates can also be related to a structural decline in demand for certain occupations.
Figure 20 distinguishes RD rates by level of qualification, with a considerable variation between countries. Higher qualified workers generally experience greater replacement demand, with most demand coming from countries with an aging population (such as Germany). RD for low- and medium-educated workers also shows considerable variation across countries, being highest in countries where such workers are older (as in Italy, Romania and Spain).

57CHAPTER 3.
The implications for occupationsFi
gure
18.
Rep
lace
men
t d
eman
d r
ates
(% p
a): o
verv
iew
by
coun
try
5
3.75 2.
5
1.25 0
BEBG
CZDK
DEEE
IEEL
ESFR
HRIT
CYLV
LTLU
HUM
TNL
ATPL
PTRO
SIFI
SKSE
UKIS
MK
CHNO
Sour
ce: C
edef
op (2
018
skill
s fo
reca
st).
Replacement demand rates

58 Skills forecast: trends and challenges to 2030
Figure 19. Replacement demand rates (% pa) per ISCO one-digit level: overview by occupation
Legislators, senior officials and managers
Professionals
Craft and related trades workers
Technicians and associate professionals
Plant and machine operators and assemblers
Clerks
Elementary occupations
Service workers and shop and market sales workers
Skilled agricultural and fishery workers
0 1.75 3.50 5.25 7.00
Source: Cedefop (2018 skills forecast).Percentage yearly RD
Figure 20. Replacement demand rates (% pa) per ISCED one-digit level: overview by education level
Low
Medium
High
0 1.25 2.50 3.75 5.00
Source: Cedefop (2018 skills forecast).
Percentage yearly RD
59CHAPTER 3.
The implications for occupations
Replacement needs reinforce the projected positive changes in expansion demands, and also serve to offset any negative changes. Total job openings or total requirements are the sum of expansion and replacement demands.
The results of applying the rates summarised above are shown in Figure 21, which illustrates the total requirements or number of job openings at the one-digit level of occupation and at the more detailed two-digit level. They show that replacement needs are projected to be positive for all the nine main occupational groups distinguished (compare grey and blue bars). Even for occupations with significant decline in long-term employment, such as skilled agricultural and fishery workers, this results in some job openings between 2016 and 2030.
This affects both sectors and occupations, and the results emphasise that primary and manufacturing sectors will remain significant employers despite declining projected employment levels. These sectors are crucial components of the economy and meeting replacement needs will be essential if activity in these areas is to be sustained (12).
3.4. Concluding remarks
The occupational structure of employment is one of the main ways to measure changing skill demand. There remains a degree of uncertainty about occupational trends because of the short time series of available consistent data. This makes producing occupational employment projections at pan-European level especially difficult.
The two main factors influencing this are the changing sectoral structure of employment in the economy, and the impact of technological and other changes on the pattern of skill demand within sectors.
The occupational employment structure of the economy is projected to change slowly but inexorably in favour of skilled non-manual occupations, and against medium- and low-skill manual work. This will be primarily driven by occupational effects related to technological and other changes in the way work is organised. However, industry effects caused by the changes in the sectoral structure of employment in the economy will also remain significant.
(12) Detailed estimates of replacement demands by industry as well as occupation can be found on Cedefop’s website: http://www.cedefop.europa.eu/en/events-and-projects/projects/forecasting-skill-demand-and-supply/detailed-forecasting-data
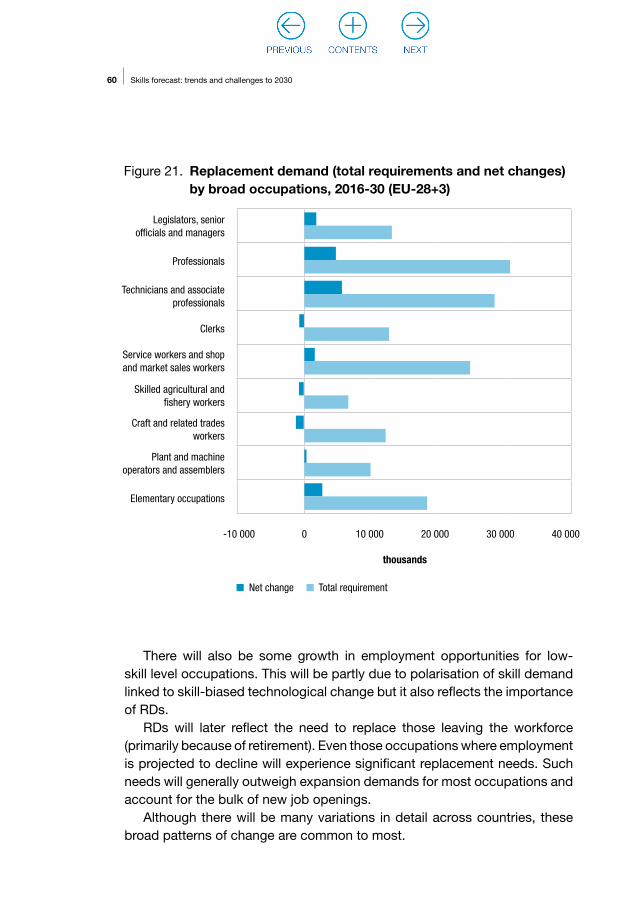
60 Skills forecast: trends and challenges to 2030
Legislators, senior officials and managers
Professionals
Craft and related trades workers
Technicians and associate professionals
Plant and machine operators and assemblers
Clerks
Elementary occupations
Service workers and shop and market sales workers
Skilled agricultural and fishery workers
-10 000 0 10 000 20 000 30 000 40 000
thousands
Figure 21. Replacement demand (total requirements and net changes) by broad occupations, 2016-30 (EU-28+3)
Net change Total requirement
There will also be some growth in employment opportunities for low-skill level occupations. This will be partly due to polarisation of skill demand linked to skill-biased technological change but it also reflects the importance of RDs.
RDs will later reflect the need to replace those leaving the workforce (primarily because of retirement). Even those occupations where employment is projected to decline will experience significant replacement needs. Such needs will generally outweigh expansion demands for most occupations and account for the bulk of new job openings.
Although there will be many variations in detail across countries, these broad patterns of change are common to most.
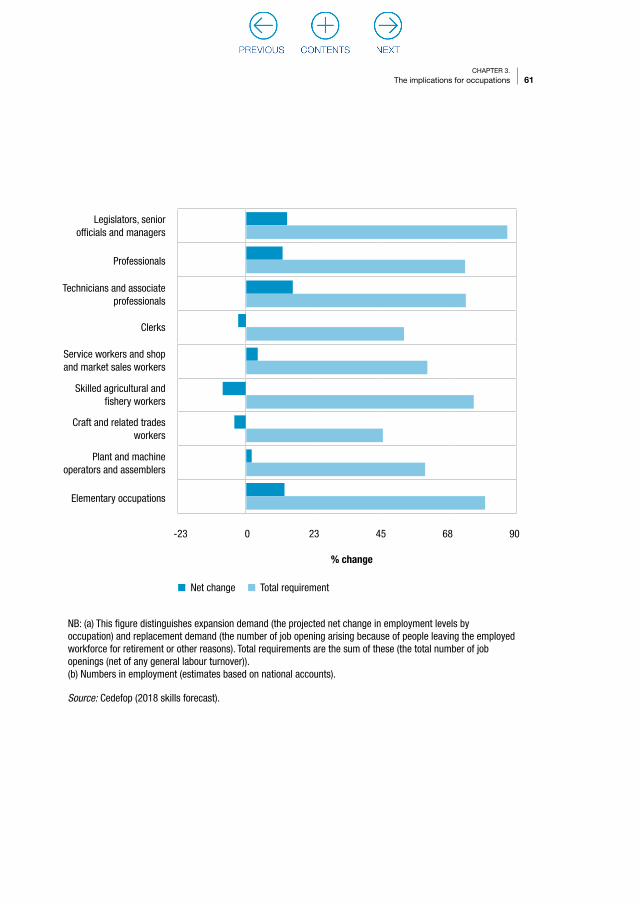
61CHAPTER 3.
The implications for occupations
Net change Total requirement
Legislators, senior officials and managers
Professionals
Craft and related trades workers
Technicians and associate professionals
Plant and machine operators and assemblers
Clerks
Elementary occupations
Service workers and shop and market sales workers
Skilled agricultural and fishery workers
-23 0 23 45 68 90
NB: (a) This figure distinguishes expansion demand (the projected net change in employment levels by occupation) and replacement demand (the number of job opening arising because of people leaving the employed workforce for retirement or other reasons). Total requirements are the sum of these (the total number of job openings (net of any general labour turnover)). (b) Numbers in employment (estimates based on national accounts).
Source: Cedefop (2018 skills forecast).
% change

CHAPTER 4.
Qualifications and skill mismatch
Key messages
The demand for high-skilled workers (qualified at ISCED 5-8) will continue to grow rapidly, driven by changes in sectoral employment structure and skill-biased tech-nological change.The supply of those qualified at ISCED 5-8 will probably rise even more rapidly and many occupations will see the average level of qualification of those employed in those jobs rise.The share and numbers of jobs for those with low or no qualifications will continue to fall.
4.1. Introduction
This chapter summarises the trends in the supply of and demand for future skills (as described by broad levels of qualification), and implications for skills imbalances.
4.2. Implications for qualifications
The changes in sectoral and occupational employment presented in Chapters 2 and 3 will have a strong influence on the demand for formal qualifications. But the number of people in employment holding different qualifications also depends on supply side developments. In most EU countries, government policy over the past few decades has encouraged investment in human capital, especially young people staying on in education beyond compulsory schooling to continue their studies at tertiary level. Skills are regarded as a key element in policies to maintain economic growth and productivity, as well as helping to address a range of other social and economic issues.

63CHAPTER 4.
Qualifications and skill mismatch
The projections focus first on developments on the supply side before turning to demand and the reconciliation of the two (imbalances and mismatches).
Developments in skill supply (as measured by the number holding formal qualifications) are driven by general demographic and labour market trends described in Chapter 2. Government policies have also encouraged many individuals to invest in further and higher education and training.
Modelling these developments at a pan-European level is difficult owing to problems in obtaining consistent and relevant data. The approach adopted here is based on analysis of stocks and flows using EU-LFS data. This analysis suggests that there will be significant further increases in the number of people participating in further and higher education beyond minimum school leaving age and going on to acquire formal qualifications at medium and higher level. For more details on the methodology please see Cedefop (2012).
Figures 22 and 23 and Tables 3 and 4 illustrate the main features of the results for the total population and the labour force between 2011 and 2030 for the EU-28+3.
The population aged 15+ holding high-level qualifications (i.e. ISCED 5 and 6, university degree, master, doctorate or equivalents) is projected to increase by around 43 million between 2016 and 2030. The numbers of those whose highest qualification is at medium level is also expected to increase but at a more modest rate (by around 11 million). In sharp contrast, the proportions and numbers of those with low-level or no qualifications are projected to continue their historical downward trend. Between 2016 and 2030 the population of Europe (EU-28+3) aged 15+ with low-level or no qualifications is projected to fall by about 37 million.
Substantial increases are projected for the overall numbers of those economically active and qualified at ISCED 5-8. Some increase is also expected for those whose highest qualification is at intermediate level. The former are now projected to increase by some 24 million between 2016 and 2030, while the numbers of those whose highest qualification is at intermediate level are projected to decrease by about 6 million. The number aged 15+ acquiring intermediate level qualifications will likely be much higher, but many of those will then go on to obtain even higher-level qualifications. The number of economically active 15+ workforce with no or low qualifications is projected to fall by about 14 million. About 25% of the labour force will be qualified to intermediate level (as their highest qualification) by 2030, a slight fall compared to their share of 27% in 2016.
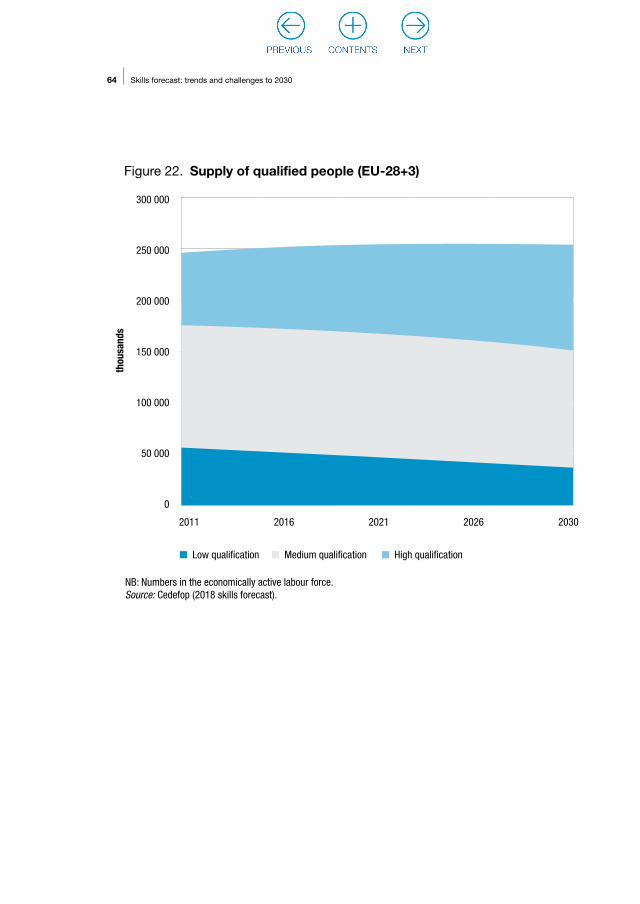
64 Skills forecast: trends and challenges to 2030
2011 2016 2021 2026 2030
Figure 22. Supply of qualified people (EU-28+3)
Low qualification Medium qualification High qualification
300 000
250 000
200 000
150 000
100 000
50 000
0
NB: Numbers in the economically active labour force.Source: Cedefop (2018 skills forecast).
thou
sand
s

65CHAPTER 4.
Qualifications and skill mismatch
All
High
Medium
Low
All
High
Medium
Low
NB: Numbers in the population aged 15+.Source: Cedefop (2018 skills forecast).
Figure 23. Past and likely future supply of qualifications (EU-28+3)
2011-16 2016-30
2011-16 2016-30
Population
Labour force
NB: Numbers in the economically active labour force aged 15+.Source: Cedefop (2018 skills forecast).
50 000
30 000
-50 000
-22 500
37 500
22 500
-37 500
-15 000
25 000
15 000
-25 000
-7 500
12 500
7 500
-12 500
-12 500
0
0
thousands
thousands

66 Skills forecast: trends and challenges to 2030
Population by qualification
Levels (000s) 2011 2016 2021 2026 2030
Low 147 664 134 034 119 627 106 976 96 577
Medium 192 534 200 104 206 194 209 765 211 268
High 94 660 108 328 123 373 138 646 151 168
Total 434 859 442 466 449 194 455 386 459 012
Shares (per cent) 2011 2016 2021 2026 2030
Low 34.0 30.3 26.6 23.5 21.0
Medium 44.3 45.2 45.9 46.1 46.0
High 21.8 24.5 27.5 30.4 32.9
Total 100.0 100.0 100.0 100.0 100.0
Growth (% per annum) 2011-16 2016-21 2021-26 2026-30 2016-30
Low -1.9 -2.2 -2.2 -2.5 -2.3
Medium 0.8 0.6 0.3 0.2 0.4
High 2.7 2.6 2.4 2.2 2.4
Total 0.3 0.3 0.3 0.2 0.3
Change (000s) 2011-16 2016-21 2021-26 2026-30 2016-30
Low -13 630 -14 407 -12 652 -10 399 -37 458
Medium 7 569 6 091 3 570 1 503 11 164
High 13 668 15 045 15 273 12 522 42 840
Total 7 607 6 728 6 192 3 626 16 546
Table 3. Supply trends, stocks: population (EU-28+3, aged 15+)
NB: Numbers in the population aged 15+.Source: Cedefop (2018 skills forecast).

67CHAPTER 4.
Qualifications and skill mismatch
Labour force by qualification
Levels (000s) 2011 2016 2021 2026 2030
Low 57 007 51 956 46 690 41 483 37 477
Medium 119 617 121 406 120 373 117 571 114 632
High 69 919 79 432 88 247 96 432 103 124
Total 246 543 252 793 255 310 255 486 255 232
Shares (per cent) 2011 2016 2021 2026 2030
Low 13.1 11.7 10.4 9.1 8.2
Medium 27.5 27.4 26.8 25.8 25.0
High 16.1 18.0 19.6 21.2 22.5
Total 56.7 57.1 56.8 56.1 55.6
Growth (% per annum) 2011-16 2016-21 2021-26 2026-30 2016-30
Low -1.8 -2.1 -2.3 -2.5 -2.3
Medium 0.3 -0.2 -0.5 -0.6 -0.4
High 2.6 2.1 1.8 1.7 1.9
Total 0.5 0.2 0.0 0.0 0.1
Change (000s) 2011-16 2016-21 2021-26 2026-30 2016-30
Low -5 051 -5 266 -5 206 -4 007 -14 479
Medium 1 789 -1 033 -2 803 -2 939 -6 774
High 9 513 8 816 8 184 6 692 23 692
Total 6 250 2 517 175 -253 2 439
Activity Rate 2011 2016 2021 2026 2030
Low 38.6 38.6 39.0 38.8 38.8
Medium 62.1 62.1 58.4 56.0 54.3
High 73.9 73.9 71.5 69.6 68.2
Total 56.7 56.7 56.8 56.1 55.6
Table 4. Supply trends: labour force (EU-28+3, aged 15+)
Note: Activity rate is the proportion of the population aged 15 and above that is in the labour force.NB: Numbers in the economically active labour force aged 15+.Source: Cedefop (2018 skills forecast).

68 Skills forecast: trends and challenges to 2030
Figure 24 shows the implications for labour market participation (or activity) rates. These vary significantly between qualification categories, with the better qualified much more likely to be economically active and in employment in the formal economy. Overall labour market participation for all categories is stable. This is result of the increase in the share of better qualified people in the population just offsetting a combination of the increasing average age of most populations (resulting in more retirements) and increasing educational participation rates (lower participation in the labour market) for many younger people.
There are significant differences by gender. Female activity rates are generally lower than those for males, but they are rising for many age groups, while those for males are declining. The hierarchy between the qualification categories is common to both genders (13).
Figure 25 shows how the absolute changes compare across countries, showing that large countries dominate the picture in terms of overall numbers. Germany, France, Italy, Poland and the UK all exhibit broadly similar patterns of change to those described for Europe as a whole.
(13) Full details are available on Cedefop’s website: http://www.cedefop.europa.eu/en/events-and-projects/projects/forecasting-skill-demand-and-supply/data-visualisations
NB: Based on numbers in the economically active labour force aged 15+. Source: Cedefop (2018 skills forecast).
Low Medium High workers All
80%
60%
40%
20%
0
2011 2016 20262021 2030
Figure 24. Labour market participation rates by qualification category
part
icip
atio
n ra
tes
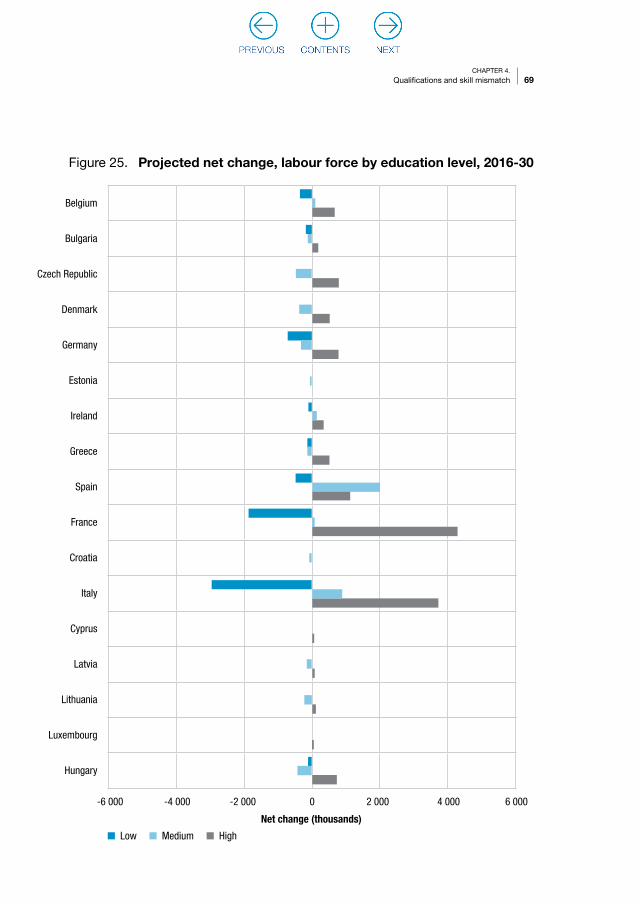
69CHAPTER 4.
Qualifications and skill mismatch
Belgium
Bulgaria
Czech Republic
Denmark
Germany
Estonia
Ireland
Greece
Spain
France
Croatia
Italy
Cyprus
Latvia
Lithuania
Luxembourg
Hungary
Figure 25. Projected net change, labour force by education level, 2016-30
Low Medium High
Net change (thousands)
6 000-6 000 -4 000 4 000-2 000 2 0000

70 Skills forecast: trends and challenges to 2030
Low Medium High
Net change (thousands)
6 000-6 000 -4 000 4 000-2 000 2 0000
Malta
Netherlands
Austria
Poland
Portugal
Romania
Slovenia
Slovakia
Finland
Sweden
United Kingdom
Iceland
Norway
Switzerland
NB: Numbers in the economically active labour force aged 15+.Source: Cedefop (2018 skills forecast).

71CHAPTER 4.
Qualifications and skill mismatch
Measuring and projecting the demand for formal qualifications is more complex than measuring supply. The problem is interpreting what part of the change in employment is due to demand as opposed to supply influences. Observed employment levels by qualification level are the result of a combination of both supply and demand factors.
The observed increases in employment may exaggerate the increase in demand for some higher qualification categories. Often this is happening not because the job strictly requires that level of qualification but simply because better qualified people apply for the job. People qualified at higher level may secure jobs in preference to less well-qualified people although the job does not strictly require higher level qualifications. This may give a misleading impression of demand pressures. This is often referred to as ‘qualifications inflation’.
Nevertheless, the general demand for skills (as measured by formal qualifications) is likely to continue to rise. Changes in industrial structure are combining with skill-biased technological change to increase the demand for those occupations that typically require intermediate or higher level educational qualifications. Qualification requirements within most occupations are also rising due to regulatory changes and other factors.
Employment levels for those with high-level qualifications have risen as a consequence of both demand and supply trends, while employment levels for those with low-level qualifications have declined.
Temporarily ignoring the supply side, in Europe as a whole (EU-28+3), the demand for people employed with qualifications at ISCED 5-8 is projected to rise modestly between 2016 and 2030. This is shown in Figure 26. This presents the projected changes in notional demand for formal qualifications, unconstrained by possible supply developments. The trends are based on a continuation of past patterns of employment shares in the three broad qualification categories within both occupations and sectors. These are referred to as the ‘unconstrained’ results.
The position for those with intermediate level qualifications is one of even less rapid increases. The demand for those with low (or no) qualifications is projected to fall.
In practice, the future patterns of employment observed will reflect both demand and supply factors and the labour market will adjust in various ways to accommodate those offering themselves for work. This is reflected in the projections of ‘constrained’ demand shown in Figures 27 and 28 and in Table 5.

72 Skills forecast: trends and challenges to 2030
The unconstrained results show the notional demand in the absence of supply constraints. The constrained estimates reflect the realities of the skills actually likely to be available. The differences between the constrained and unconstrained figures, as well as more general implications for imbalances and mismatches, are discussed in more detail in the section below.
2011 2016 2021 2026 2030
Figure 26. Demand by qualification: unconstrained, 2011-30 (EU-28+3)
Low qualification Medium qualification High qualification
NB: Unconstrained estimates. The estimates in this figure are the notional demand for formal qualifications, unconstrained by likely supply developments. For constrained estimates see the next figure.Source: Cedefop (2018 skills forecast).
300 000
225 000
200 000
150 000
100 000
50 000
0
thou
sand
s
73CHAPTER 4.
Qualifications and skill mismatch
The constrained results show an increase in the number of highly qualified people in employment between 2016 and 2030 of around 26 million. There is a small decline of about 2 million for those in employment whose highest qualification is at intermediate level and a decline of around 10 million for the employed with low-level or no formal qualifications.
The skill mix projected for 2030 for the unconstrained demand shares are 14%, 45% and 41% for low, medium, and high qualifications respectively, compared to 19%, 48% and 32% in 2016.
The broad patterns of change have been consistent throughout the various series of Cedefop projections. The workforce is becoming increasingly well qualified, but supply may outpace demand for higher levels of qualification.
The results depend on assumptions about the division of unemployment between the three qualification levels. Total unemployment projected in E3ME is divided while maintaining the hierarchy of unemployment rates over the projection period. As a result, those qualified at ISCED 5-8 are projected to account for an increasing share of total unemployment, but their rates of unemployment remain lower than those qualified at intermediate or low level. These results are summarised in Table 6.
4.3. Concluding remarks
This chapter on qualifications and skill mismatch brings together the projected changes in occupational employment structure, and their implications for skill demand, with the projections of the numbers expected to be available by broad levels of qualification. Overall labour supply over the projection period is driven by the general demographic trend of an ageing population, although with an increase in overall activity rates. The other principal element in the skill supply projections is the change in the mix of qualification levels (which is the main measure of skills available other than occupation). The proportion of those with only lower levels of qualification is projected to continue its historical downward trend, with a slight increase at intermediate level. By contrast, the policy in most EU countries has been to support education, leading to an increase in the proportion of the population and labour force attaining higher level qualifications, especially among the young population. Consequently, the qualification mix of the economically active labour force is projected to shift significantly towards those educated to the highest level (ISCED 5-8) and away from those with only low or no formal qualifications.

74 Skills forecast: trends and challenges to 2030
2011 2016 2021 2026 2030
Figure 27. Demand by qualification: constrained, 2011-30 (EU-28+3)
NB: Constrained estimates. The estimates in this figure are constrained to match the supply available and scaled to match E3ME employment figures (i.e. taking into account the so called labour market accounts residual (LMAR), which measures the difference between employment (workplace jobs) and labour supply net of unemployment (residence, people/ heads). They are therefore consistent with, and match, the employment estimates for sectors and occupations presented elsewhere in this report.Source: Cedefop (2018 skills forecast).
Low qualification Medium qualification High qualification
300 000
225 000
200 000
150 000
100 000
50 000
0
thou
sand
s
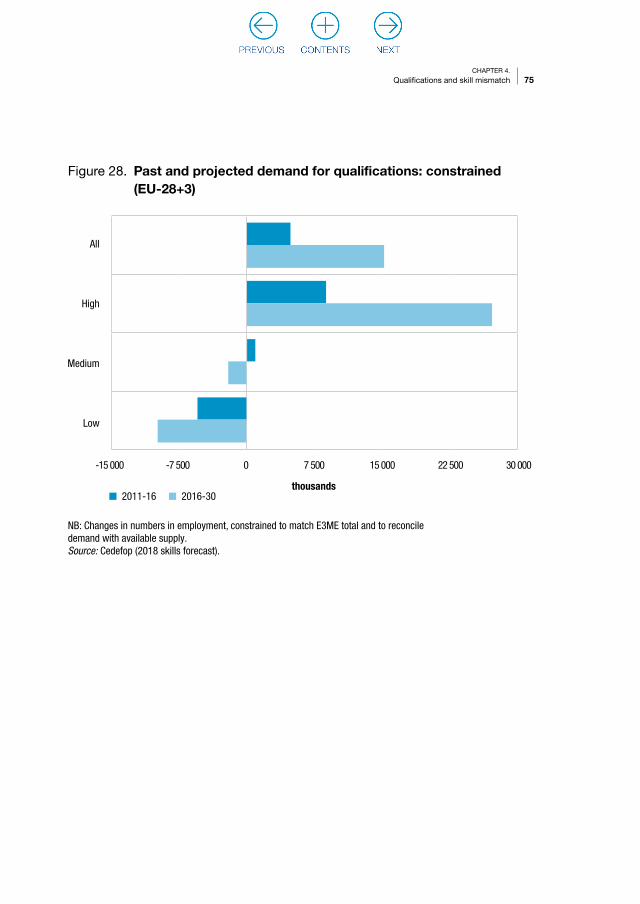
75CHAPTER 4.
Qualifications and skill mismatch
Figure 28. Past and projected demand for qualifications: constrained (EU-28+3)
All
High
Medium
Low
NB: Changes in numbers in employment, constrained to match E3ME total and to reconcile demand with available supply.Source: Cedefop (2018 skills forecast).
-15 000 -7 500 0 7 500 15 000 22 500 30 000
2011-16 2016-30thousands
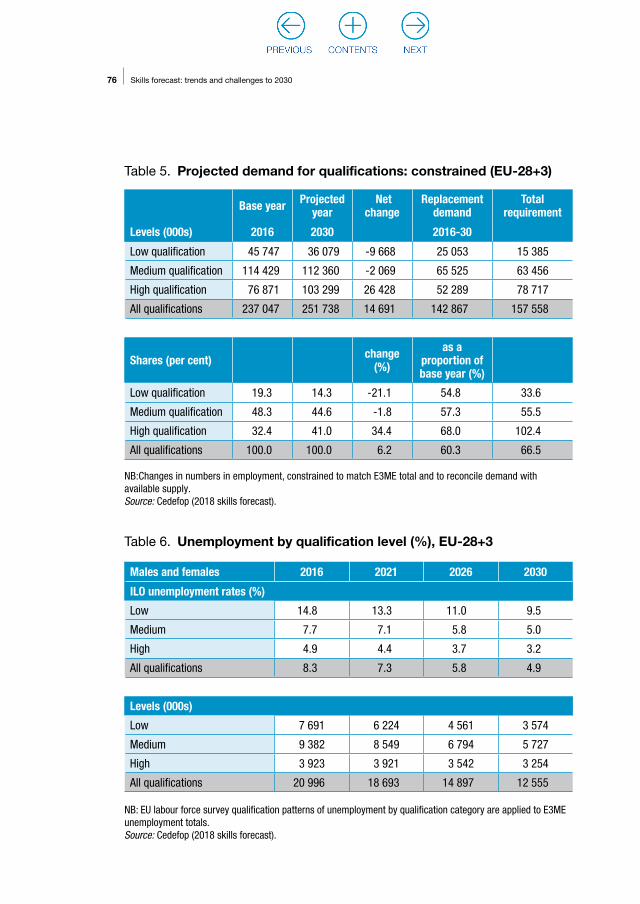
76 Skills forecast: trends and challenges to 2030
Table 5. Projected demand for qualifications: constrained (EU-28+3)
Table 6. Unemployment by qualification level (%), EU-28+3
Base year Projected year
Net change
Replacement demand
Total requirement
Levels (000s) 2016 2030 2016-30
Low qualification 45 747 36 079 -9 668 25 053 15 385
Medium qualification 114 429 112 360 -2 069 65 525 63 456
High qualification 76 871 103 299 26 428 52 289 78 717
All qualifications 237 047 251 738 14 691 142 867 157 558
Shares (per cent) change (%)
as a proportion of base year (%)
Low qualification 19.3 14.3 -21.1 54.8 33.6
Medium qualification 48.3 44.6 -1.8 57.3 55.5
High qualification 32.4 41.0 34.4 68.0 102.4
All qualifications 100.0 100.0 6.2 60.3 66.5
NB:Changes in numbers in employment, constrained to match E3ME total and to reconcile demand with available supply.Source: Cedefop (2018 skills forecast).
NB: EU labour force survey qualification patterns of unemployment by qualification category are applied to E3ME unemployment totals. Source: Cedefop (2018 skills forecast).
Males and females 2016 2021 2026 2030
ILO unemployment rates (%)
Low 14.8 13.3 11.0 9.5
Medium 7.7 7.1 5.8 5.0
High 4.9 4.4 3.7 3.2
All qualifications 8.3 7.3 5.8 4.9
Levels (000s)
Low 7 691 6 224 4 561 3 574
Medium 9 382 8 549 6 794 5 727
High 3 923 3 921 3 542 3 254
All qualifications 20 996 18 693 14 897 12 555

CHAPTER 5.
Examining the job task content
Key messages
The model projects a more polarised occupational structure in the EU, due primarily to strong growth at the bottom of the wage distribution. However, many Member States are projected to upgrade towards more high-paying jobs, including the Czech Republic, Denmark, Estonia, Croatia, Latvia, Malta, Hungary, Slovenia and Finland. The projections imply a fall in physical tasks and an increase in intellectual and social tasks, particularly business literacy, selling/persuading and serving/attending. They also project a large increase in the use of ICT skills with some increase in au-tonomy and a reduction in routine work.The tendency towards upgrading the wage structure and the shift towards more au-tonomy, fewer routine tasks, more ICT, less physical and more social and intellectual tasks, is most prominent in the Member States that joined the EU after 2014. This suggests an upward convergence of the employment structure in Europe.
5.1. Introduction
This chapter has been produced by Eurofound whose European jobs monitor approach has been applied to the baseline Cedefop scenario to assess the tasks to be performed in jobs to 2030.
5.2. European jobs monitor framework
The current high interest in the future of work reflects recent perceptions and future expectations of radical change. Structural change in the economy is primarily driven by inter-sector productivity differentials; the structure of demand continually influences the distribution of employment throughout the economy. It has been argued that, not least due to innovations in the application of ICT, the pace of productivity-enhancing technological

78 Skills forecast: trends and challenges to 2030
change has speeded up and is expected to accelerate further in the forthcoming decades.
It has generally been assumed that new technology replaces low-skilled labour but complements high-skilled labour, so that it would lead to an upgrading of the skills structure. However, such ‘skills-biased technological change’ has not always been observed in the United States and Europe. It has often been found that much employment growth occurred at both the top and bottom end of the occupational distribution, with a relative decline in the middle. This led to a more nuanced hypothesis about how technology impacts the occupational structure, with a focus on the tasks that are actually performed at work. In the context of technological change, the contention was that the relevant focus should be not primarily on the skills required for jobs but, rather, the extent to which the tasks performed in jobs could be described as routine and, thereby, be profitably replaced by the emerging technologies. This hypothesis commonly referred to as ‘routine biased technological change’ (Autor, 2013), has largely been operationalised with the assumption that routine tasks are primarily located in the middle of the wage distribution. This may appear a crude assumption but it has some empirical validity; there are not just routine manufacturing jobs, but also many simpler information processing ones, such as administrative and clerical work, located in the middle of the wage distribution (14).
Another main driver of recent and projected structural change is globalisation. Recent decades have seen significant changes in the global distribution of labour, and global competition and market opportunities are likely to continue to impact the structure of employment in Europe. Relative wages and productivity are the key determinant of which jobs will remain and grow in Europe and which will be lost to foreign competition. As manufacturing still dominates global trade it is the main sector impacted by globalisation.
Manufacturing jobs, predominately located in the middle of European wage distribution, face the twin threat of routinisation and globalisation. Consequently, much of the decline in the middle of the wage distribution is to be found in that sector. Globalisation and technology are not fully distinct
(14) It should be emphasised, however, that claims in much of the literature of pervasive polarisation in Europe are not found to be the case in various publications of Eurofound’s European jobs monitor: https://www.eurofound.europa.eu/observatories/emcc/european-jobs-monitor
For a discussion of the empirical validity of the routine biased technological change argument in the European case, see Fernández-Macías and Hurley, 2017.

79CHAPTER 5.
Examining the job task content
drivers of structural change, as seen when examining the reasons for the resilience of jobs at the bottom end of the wage distribution. Many of these jobs, such as those providing personal services in both the private (hotels and restaurants) and the public sector (various caring services), are not significantly vulnerable to trade as the provision and the use of these services is geographically fixed to a single location. The requirement for face-to-face interaction of provider and user is also one reason why these jobs are less routine and, so far, less susceptible to technological change.
The occupational wage structure is a useful metric for identifying the future impact of these two major drivers of structural change in the labour market. (Demographic change, which is arguably the other main driver, is explicitly modelled in the Cedefop occupational forecast). The focus on wages is also of obvious interest for distributional reasons. This chapter examines the projected forecasts in terms of their location in occupational wage distribution in the various Member States, using the framework developed over many years in Eurofound’s European jobs monitor.
Eurofound also developed a comprehensive framework to measure the types of task currently performed in the European labour market (Eurofound, 2016). This framework is not exclusively focused on routine but captures, for example, the social and intellectual content of tasks and the use of ICT; this is obviously useful for a more nuanced analysis of the changes in the structure of employment in Europe but it is also highly relevant for skills forecasting. The identification of what is done at work can be seen as a logical first step in identifying what skills are required for jobs now and into the future.
The next section details the European jobs monitor framework and how it has been operationalised in terms of the wage and tasks structure of jobs in Europe. Section 5.3 presents the results of using this methodology to describe the implications of projected structural change for the wage and task structure of employment in Europe up to 2030. The final section summarises the main results.

80 Skills forecast: trends and challenges to 2030
5.3. Framework for analysing structural change in Europe
The methods applied in this chapter are those developed in various publications from Eurofound’s European jobs monitor (15). The basic methodology, with a wide range of applications, can be found in Fernandez-Macias, Hurley and Storrie (2012). In this framework a job is defined as an occupation in a sector, as in the standard international classifications of occupation (ISCO-08) and sector (NACE Rev 2.0) at two-digit level. The number of jobs so defined varies from around 400, in the smaller Member States, to just over 2 000 in the larger ones. As this framework of jobs is empirically defined by the standard statistical classification, a further description of these jobs can be added using data from a variety of sources that follow these standard classifications of occupations and sectors. Most of the previous Eurofound research focused on the average wage corresponding to these jobs, which is a useful metric for capturing some of the characteristics and drivers of recent and future structural change in Europe. More recently, Eurofound (2016) developed a detailed measurement of what types of task are performed in these jobs.
The wage data are compiled by combining data from the EU labour force survey (16) and from Eurostat’s structure of earnings survey (SES) (17). The jobs are ranked from the highest to the lowest wage in each Member State; they are then allocated to quintiles based on the job-wage ranking for that Member State. Each quintile in each country represents 20% of employment at the starting period (Figure 29). The job-to-quintile assignments remain fixed over time, so the charts in the next section that map the growth of employment in a particular quintile refer to the growth of jobs assigned to that quintile at the start of each period of observation.
One issue of note is the stability of the wage ranking. While nominal differences in wages occur over time, the ranking of jobs is quite stable. Trends in wage inequality are typically driven by well paid jobs getting better paid compared to the less well paid ones but without much change in the
(15) Eurofound, European jobs monitor (EJM): https://www.eurofound.europa.eu/observatories/emcc/european-jobs-monitor
(16) Eurostat, European labour force survey (LFS): https://ec.europa.eu/eurostat/web/microdata/european-union-labour-force-survey
(17) Eurostat, Structure of earning survey (SES): https://ec.europa.eu/eurostat/web/microdata/structure-of-earnings-survey
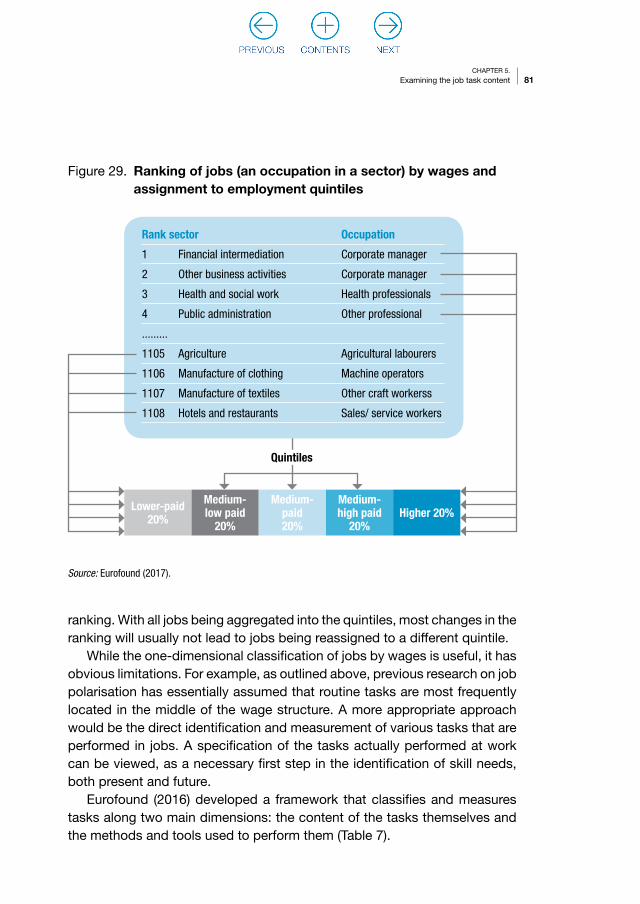
81CHAPTER 5.
Examining the job task content
Figure 29. Ranking of jobs (an occupation in a sector) by wages and assignment to employment quintiles
Rank sector Occupation
1 Financial intermediation Corporate manager
2 Other business activities Corporate manager
3 Health and social work Health professionals
4 Public administration Other professional
.........
1105 Agriculture Agricultural labourers
1106 Manufacture of clothing Machine operators
1107 Manufacture of textiles Other craft workerss
1108 Hotels and restaurants Sales/ service workers
Lower-paid 20%
Medium-low paid
20%
Medium-paid 20%
Medium-high paid
20%Higher 20%
Quintiles
Source: Eurofound (2017).
ranking. With all jobs being aggregated into the quintiles, most changes in the ranking will usually not lead to jobs being reassigned to a different quintile.
While the one-dimensional classification of jobs by wages is useful, it has obvious limitations. For example, as outlined above, previous research on job polarisation has essentially assumed that routine tasks are most frequently located in the middle of the wage structure. A more appropriate approach would be the direct identification and measurement of various tasks that are performed in jobs. A specification of the tasks actually performed at work can be viewed, as a necessary first step in the identification of skill needs, both present and future.
Eurofound (2016) developed a framework that classifies and measures tasks along two main dimensions: the content of the tasks themselves and the methods and tools used to perform them (Table 7).

82 Skills forecast: trends and challenges to 2030
Table 7. Classification of tasks according to their content and methods
A. In terms of the content
1. Physical tasks: aimed at the physical manipulation and transformation of material things:
a. Strength b. Dexterity
2. Intellectual tasks: aimed at the manipulation and transformation of information and the active resolution of complex problems:
a. Information processing: I. Literacy: i. Business ii. Technical iii. Humanities II. Numeracy: i. Accounting ii. Analytic b. Problem solving: I. Information gathering and evaluation
of complex information. II. Creativity and resolution.
3. Social tasks: whose primary aim is the interaction with other people:
a. Serving/attending b. Teaching/training/coaching c. Selling/influencing d. Managing/coordinating
B. In terms of the methods and tools of work
1. Methods: forms of work organisation used in performing the tasks:
a. Autonomy b. Teamwork c. Routine I. Repetitiveness II. Standardisation
2. Tools: type of technology used at work:
a. Machines (excluding ICT) b. Information and communication
technologies: I. Basic ICT II. Programming
Source: Eurofound (2016).
The content part of the task framework is mainly related to what is being produced and varies by economic sector. It identifies three main classifications of task content: physical, intellectual, and social. Each has various sub-indicators. The methods and tools of work are determined more by the technology and social organisation of production and may be more dependent on institutional and historical factors.

83CHAPTER 5.
Examining the job task content
Using data from various international sources – Eurofound´s European working conditions survey (EWCS) (18), the OECD survey of adult skills PIAAC (19), the American O*NET database (20) and the European labour force survey (21) – Eurofound constructed a database of scores for all the elements listed in Table 1 for all jobs (all two-digit occupation-by-sector combinations in Europe (Eurofound, 2016)). Such detailed data are not available for all Member States, or only of small sample sizes insufficient for reliable measurement of tasks at country level. For this reason the task indices are an aggregate measure based on data from 15 Member States (EU15). This was not the case with the wage data, which were country-specific. While country-specific data would be preferable, it is expected that many jobs cover similar tasks in all European countries.
5.4. Projected structural change, wage distribution and tasks
The fact that the Cedefop skills forecasting model projects future employment by occupation and sector allows for the integration of these projections into the jobs-based framework of the European jobs monitor. The first section in this chapter summarises some of the results of previous jobs monitor analysis, considering how recent structural change has impacted on the employment growth of the five job-wage quintiles in Europe; it then extends the analysis to future developments over the forecasting period up to 2030. The next section examines how the task indices develop over the forecasting period in light of the projected change in employment. It should be emphasised that both the wage and task assignment are fixed at the beginning of the forecasting period, so the reported changes are only attributable to the compositional changes in employment by occupation and sector.
Before examining the projections, it is useful first to show how employment growth has been distributed among the five wage quintiles in the recent past. The first panel in Figure 30 shows that the long boom period that preceded the recession of 2008 can be characterised as upgrading with polarisation,
(18) https://www.eurofound.europa.eu/surveys/european-working-conditions-surveys (19) PIAAC: http://www.oecd.org/skills/piaac/(20) Occupational information network (O*NET database): https://www.onetcenter.org/database.html(21) European labour force survey (LFS):
https://ec.europa.eu/eurostat/web/microdata/european-union-labour-force-survey

84 Skills forecast: trends and challenges to 2030
in that there was appreciable growth in the top two wage quintiles, more modest growth in the next two, but with substantial growth in the lowest quintile. While the second panel, covering the first few years of the recession (2008-10), appears different in terms of upgrading and polarisation, it tells a similar story to the preceding period. Most jobs are lost in the middle of the wage distribution with relatively minor job loss in the bottom and growth at the top. With the first tendency to recovery, between 2011 and 2013, the overall picture is less negative but the pattern of continued job loss in the middle, relatively modest job loss at the bottom and growth at the top, is similar to the preceding period. Finally, from 2013 onwards with net employment growth in all wage quintiles, the picture is similar to the period before the recession. However, compared to the pre-recession period, job growth in the top is appreciably slower relative to the bottom quintile.
Although these aggregate EU level patterns show some consistency over time, essentially owing to some combination of upgrading and polarisation, a much more heterogeneous picture is found among Member States. For example, in the Nordic countries upgrading generally predominates, while the Netherlands and France reveal a high degree of polarisation, and Hungary has experienced strong growth in the bottom quintile. From a policy perspective this heterogeneity is very important point, as it indicates that polarisation or upgrading are neither technologically nor otherwise exogenously determined and that various national specificities, not least policies and institutions, can influence the outcome of structural change on the labour market.
Figure 30. Employment change (% pa) by job-wage quintile, 1998-2016 (EU)
3
2
1
0
-1
-2
-3
% p
a
Source: EU-LFS, SES, as calculated in Eurofound (2017).
1998–2007 2008–10 2011–13 2013–16

85CHAPTER 5.
Examining the job task content
For the projected developments of the job-wage quintiles, Figure 31 shows the annual percentage change in the Member States over the forecasting period 2015-30. The aggregate EU chart, in the bottom right-hand corner, reveals a more strongly polarised picture than any of the historical charts, as presented in Figure 31. The top wage quintile, while still (just) showing the strongest growth, is now of a similar magnitude to the lowest. As the three middle quintiles show more weight at the higher of these, there is still, overall, some tendency to upgrading, but this is much less prominent than before, particularly compared with pre-2008.
As in previous periods, there is appreciable diversity in the projections among Member States but they fall into relatively distinct clusters. The Baltics show quite clear upgrading, as do several other Member States in central and eastern Europe, such as, the Czech Republic, Hungary and, most strongly, Croatia and Slovenia. The Nordic States continue to upgrade, although less so in Sweden. Polarisation is dominant in Germany, France and the Netherlands and, to a lesser extent in Austria and the UK. While Greece, and especially Spain, are projected to create much new employment, most of this is located in the lower wage quintiles.
Compared to the previous periods, the most striking difference is that growth in the bottom quintile is projected to be much stronger relative to the top one. France, the UK and Spain account for most of this growth, with each projected to increase employment in the bottom quintile by more than 500 000. Other Member States contributing significantly to overall EU growth at the bottom are Belgium, Germany and the Netherlands, each by over 100 000 jobs.
Figure 32 disaggregates projected job wage quintile growth by qualifications, occupations and economic sector at EU aggregate level. It shows net employment growth in services for all five wage quintiles. This is also the case in most Member States. There is a significant projected increase in industrial jobs in the top wage quintile, together with a decline in the middle. This is primarily attributable to a large increase in that quintile in German (followed by Polish) industry. However, the net projection of industrial employment in Germany is negative, with significant declines in the middle three wage quintiles. Other Member States contributing to the growth of industrial employment at the top and decline elsewhere are Czech Republic, Spain, Portugal and Sweden. Although Latvia, Slovenia, Slovakia and Finland are also to show growth at the top, they experience net job growth in the other wage quintiles. The high growth of services at the very

86 Skills forecast: trends and challenges to 2030
2
1
0
-1
-2
Empl
oym
ent a
nnua
l per
cent
cha
nge
(%)
2
1
0
-1
-2
2
1
0
-1
-2
Austria Belgium Bulgaria
2
1
0
-1
-2
2
1
0
-1
-2
2
1
0
-1
-2
2
1
0
-1
-2
2
1
0
-1
-2
2
1
0
-1
-2
2
1
0
-1
-2
2
1
0
-1
-2
2
1
0
-1
-2
2
1
0
-1
-2
2
1
0
-1
-2
2
1
0
-1
-2
Denmark Estonia Finland
Malta Netherlands Poland
Hungary Ireland Italy
Slovenia Spain Sweden
Figure 31. Employment change (% pa) by job-wage quintile, 2015-30
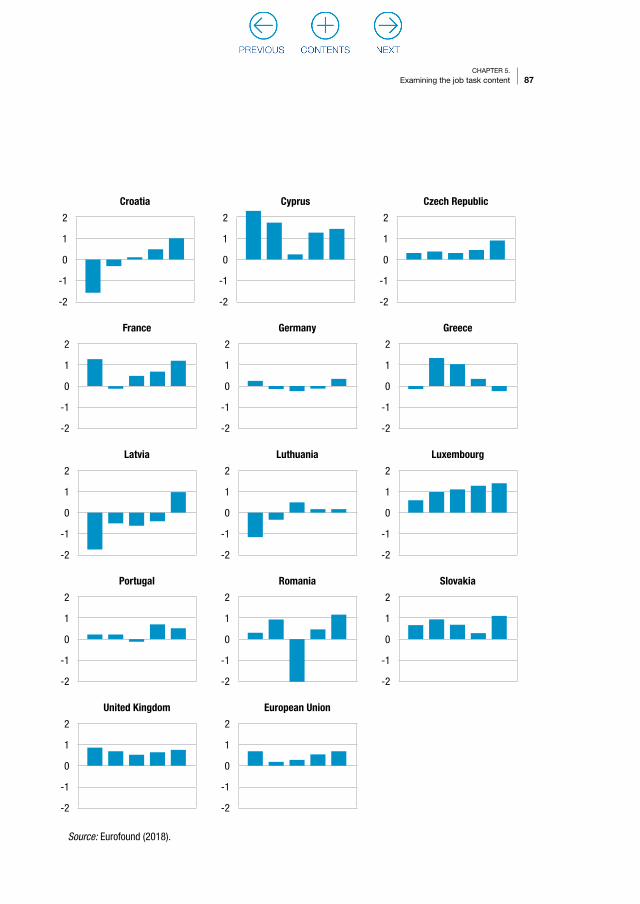
87CHAPTER 5.
Examining the job task content
2
1
0
-1
-2
2
1
0
-1
-2
2
1
0
-1
-2
Croatia Cyprus Czech Republic
2
1
0
-1
-2
2
1
0
-1
-2
2
1
0
-1
-2
France Germany Greece
2
1
0
-1
-2
2
1
0
-1
-2
2
1
0
-1
-2
Portugal Romania Slovakia
2
1
0
-1
-2
2
1
0
-1
-2
2
1
0
-1
-2
Latvia Luthuania Luxembourg
2
1
0
-1
-2
2
1
0
-1
-2
United Kingdom European Union
Source: Eurofound (2018).

88 Skills forecast: trends and challenges to 2030
top and bottom of the wage distribution confirms the role of this sector in the polarisation of net employment growth.
At EU aggregate level, net projected employment growth occurs mostly at the high-level of qualifications in all wage quintiles; the only exception is some growth in medium qualification level in the bottom quintile. Among Member States, only Romania shows employment growth for the lowest qualifications level, in the bottom two wage quintiles. The occupation data reflect the qualifications data. All net employment growth in the top three wage quintiles is among high-skilled white-collared employees. Net growth in the bottom wage quintile is almost entirely due to increases in low-skilled white- and blue-collared employees.
Figure 32. Employment change (% pa) by job-wage quintile, 2015-30: EU, by qualifications, occupation and economic sector
1.00
0.80
0.60
0.40
0.20
0
-0.20
-0.40
-0.60Low Medium High

89CHAPTER 5.
Examining the job task content
1.00
0.80
0.60
0.40
0.20
0
-0.20
-0.40
-0.60
1.00
0.80
0.60
0.40
0.20
0
-0.20
-0.40
-0.60
High-skilled white-collar Low-skilled white-collar High-skilled blue-collar Low-skilled blue-collar
Primary sector Industry Construction Services
Source: Eurofound (2018).

90 Skills forecast: trends and challenges to 2030
The headline result of this section is the forecast of of a more polarised labour market in the EU. This compares with the long boom before the recession of 2008, which was mainly characterised as upgrading, with higher growth at the top of the wage distribution. Tendencies towards a more polarised labour market appeared in the recession, with massive job loss in the middle, small declines at the bottom and growth at the top. But compared to the short period of recovery since 2013, the forecast for 2015 to 2030 clearly shows stronger polarisation. It is mainly Spain, France and the UK that account for the strong growth at the bottom.
The strong growth in the bottom quintile in the aggregate EU figure, attributable to a few large Member States, tends to conceal the fact that upgrading predominates in many Member States. Those with the strongest upgrading patterns are Slovenia, Czech Republic, Denmark, Estonia, Croatia, Latvia, Hungary, Malta and Finland. The most pronounced polarisation pattern is found in Germany, France and the Netherlands. Polarisation is also visible in Italy and Romania. Tendencies to increased downgrading in the occupational structure are found in Greece and Spain and, to a lesser extent, in Cyprus, Austria and the UK.
It is important to emphasise that the measurement of the various types of task, as outlined in Table 7, is taken at the start of forecasting period and remains constant up to 2030. Changes in tasks reported in this section are only due to compositional changes in the structure of employment by sector and occupation; it does not measure how tasks that are performed in specific jobs change over time. In a forecasting period of 15 years and when there is some expectation of significant technological change, this is an obvious limitation. However, data on the future change in the task content of jobs can never be available, so the compositional change is the best that can be done. Figure 33 shows the change in the measures of various tasks in jobs in across the EU between 2015 and 2030.
The figure shows that the projected structural change will lead to a decline in tasks requiring both physical strength and dexterity, as measured by data from the European working conditions survey. There is a long history of machines replacing the physical tasks performed by human labour. These tasks are primarily located in agricultural and industrial occupations, and the projected decline in physical tasks is particularly prominent in central and eastern Europe, but even Italy and the Netherlands show appreciable decline. The only other bars in Figure 5 that show a fall in the task indices refer to how tasks are performed; they are those that measure routine (both
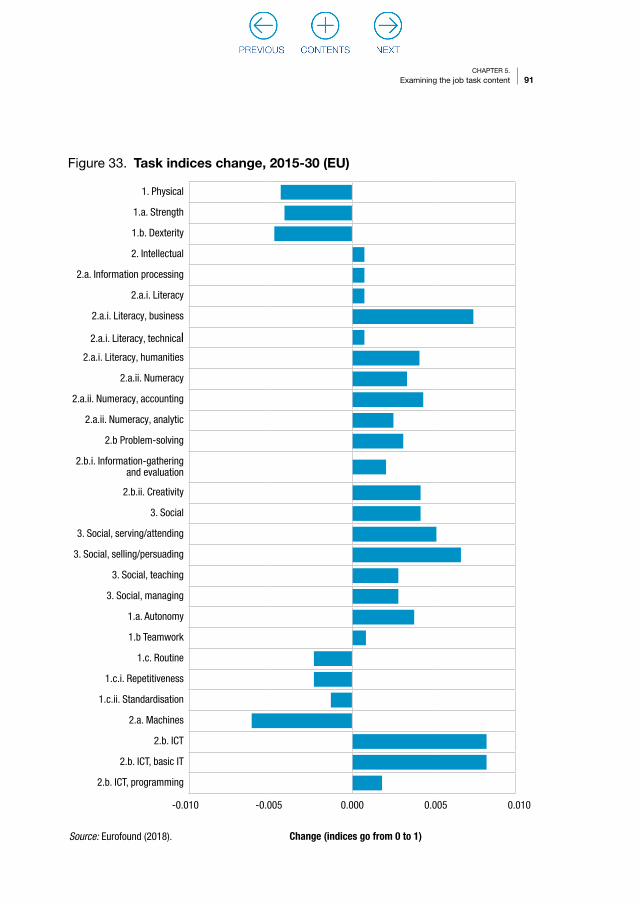
91CHAPTER 5.
Examining the job task content
Change (indices go from 0 to 1)
1. Physical
1.a. Strength
1.b. Dexterity
2. Intellectual
2.a. Information processing
2.a.i. Literacy
2.a.i. Literacy, business
2.a.i. Literacy, technical2.a.i. Literacy, humanities
2.a.ii. Numeracy
2.a.ii. Numeracy, accounting
2.a.ii. Numeracy, analytic
2.b Problem-solving
2.b.i. Information-gathering and evaluation
2.b.ii. Creativity
3. Social
3. Social, serving/attending
3. Social, selling/persuading
3. Social, teaching
3. Social, managing
1.a. Autonomy
1.b Teamwork
1.c. Routine
1.c.i. Repetitiveness
1.c.ii. Standardisation
2.a. Machines
2.b. ICT
2.b. ICT, basic IT
2.b. ICT, programming
Figure 33. Task indices change, 2015-30 (EU)
Source: Eurofound (2018).
-0.010 -0.005 0.000 0.005 0.010
92 Skills forecast: trends and challenges to 2030
repetitiveness and standardisation) as well as work with machines. This is not to say that tasks in the existing jobs may not become more routine: there is some evidence in Eurofound (2016), using various waves of the EWCS, that many jobs have become more routine and standardised. The projected decline in routine tasks is almost fully accounted for by developments in the middle wage quintile, which adds some credence to the assumption in the research literature that routine jobs are mainly to be found in the middle of the occupational structure. However, the largest decline in these indicators is in working with machines, which may appear puzzling. However, this excludes working with ICT-related machinery and may also reflect the shifting global division of labour, where work with less advanced machinery moves to lower wage countries. Eurofound found a strong correlation between the occurrence of physical tasks, working with machines and routine tasks (Eurofound, 2016).
The projected structural change will lead to an increase in the two other major classifications of what is done at work, intellectual and social tasks; each of the various subcategories of these will increase. The increase in intellectual and social tasks is strongest in eastern and central European countries. Such a clustering of Member States can also be seen in the decline in physical tasks. It is highly likely that the more rapid projected structural change in the more recent Member States is what is driving such a result. Both the social and intellectual task indicators grow most slowly (or declined slightly) in the lowest wage quintile. The increase in numerical tasks is particularly prominent in the top wage quintile. These figures are added in Annex 4.
In terms of the tasks performed, two task subcategories stand out for rapid growth projection. Business literacy (from the intellectual category) and selling/persuading (from the social category) are projected to be the two most rapidly increasing tasks in terms of what work is done. Business literacy is the processing of verbal business information, and is based on PIAAC data. It includes measurements for tasks such as reading and writing letters and financial statements. These tasks are projected to increase in every Member State, with projected growth prominent in central and eastern Europe as well as Italy. Selling/persuading is the second most rapidly growing task category. It would appear to be conceptually related to business literacy, in that it refers to commercial activity with a correlation between these two indices reported as 0.64 in Eurofound (2016).
93CHAPTER 5.
Examining the job task content
The third most rapidly increasing task, in terms of what is to be done at work, is serving/attending in the social category. It would have been useful to have a measurement for caring tasks as this could be considered a highly relevant category for possible future employment growth; it not only responds to future demand but also is not easily routinised or is susceptible to offshoring. It was not possible to measure the caring task specifically and it may be that the serving/attending task is picking up some caring.
Autonomy shows an appreciable increase and is the means of working that varies most between the wage quintiles, appearing much more in the high wage ones. It is projected to grow in all Member States, with stronger growth in eastern and central European countries. ICT is to grow strongest of all indicators, increasing in all Member States with the exception of Greece. It is a common trend across all five wage quintiles but with stronger growth in the top two.
5.5. Concluding remarks
The most striking result of the job-wage quintile results is the projection of a more polarised labour market in the EU. This is driven mainly by the growth of jobs at the bottom of the wage distribution, with Spain, France and the UK accounting for much of the EU total growth. However, there is considerable heterogeneity in the patterns of structural change by job-wage quintile, with many Member States projected to upgrade their occupational structure towards higher paying jobs. Among these are Czech Republic, Denmark, Estonia, Croatia, Latvia, Hungary, Malta, Slovenia and Finland. Projected polarisation is particularly strong in Germany, France and the Netherlands. Another striking result is that net change in industrial jobs is concentrated in the top three job wage quintiles, with no net change in the bottom two. Within the top three quintiles is a distinct pattern of upgrading, with significant employment growth at the top.
The implications of the projected structural change up to 2030 on tasks in European workplaces was analysed along two main dimensions: the content of the tasks, and the methods and tools with which tasks are performed. In terms of task content, there is a projected decline only in physical tasks, with an across-the-board increase in all the subcategories of intellectual and social tasks. Three types of task stand out in terms of their projected increase: business literacy, selling/persuading and serving/attending. The first two are
94 Skills forecast: trends and challenges to 2030
related both statistically and conceptually, as both have a highly commercial nature. It was suggested that the observed increase in serving/attending might also be related to caring tasks, which was not directly measured in the otherwise comprehensive task framework. The biggest overall change in any of the indices was the use of basic ICT skills (one of the means of performing tasks). There was also a projected increase in autonomy and a decline in routine. A highly significant decline in work with machines (non-ICT) is correlated both with physical and routine tasks.
There are some highly relevant differences between the group of Member States that have joined the European Union since 2014 and the others. The countries showing strong upgrading tendencies include many of the more recent Member States. These countries also generally show much stronger than average projected decline in physical tasks, and increases in social and intellectual tasks. It was emphasised several times in this chapter that what is being measured, in both the wage and task analysis, are compositional changes. These results indicate that the higher rate of projected structural change in these Member States is positive, with upward convergence in the employment structure in Europe.
CHAPTER 6.
(22) http://www.cedefop.europa.eu/en/events-and-projects/projects/forecasting-skill-demand-and-supply/data-visualisations
(23) New skills agenda for Europe: http://ec.europa.eu/social/main.jsp?catId=1223&langId=en
Discussion and future challenges
This publication introduced the results from the 2018 skills forecast up to 2030. Cedefop skills forecast is a unique database (22) projecting future trends in skills and jobs across Europe. The provision of timely labour market intelligence is crucial for Europe’s skills and labour market policies; the skills forecast plays an important role in implementing the EU Skills agenda (23) and the European pillar of social rights. Projections of employment are produced for all Member States, broken down by sector of economic activity and occupational group. Future labour force trends are produced by age, gender and highest level of qualification (ISCED 5-8).
Cedefop and Eurofound have collaborated on this publication, with the latter adopting the Cedefop baseline projections scenario to apply the Eurofound European jobs monitor approach to identifying changes in the occupational wage structure and the task content of jobs. This concluding section discusses the main results of the work and puts suggests questions calling for policy intervention.
Over the forecast period, the EU is expected to show relatively low growth rates, recovering from the legacy of the crisis but supported by global growth, particularly in China. Over the medium term, GDP will stabilise at lower levels, mainly because of the demographic trends. There are two main factors driving how GDP growth will be translated into sectoral employment. First, ageing of the population will lead to less consumer expenditure on goods and on leisure, and more on health-related services. At the same time, government expenditure is expected to increase to accommodate these needs. Second, the penetration of automation will lead to fewer jobs being created in manufacturing but new jobs in supporting sectors. However, the assumption is that workers will keep their jobs when robots are brought in. The above factors will lead to a changing GDP composition towards lower

96 Skills forecast: trends and challenges to 2030
consumption of goods and more government spending, which will impact employment patterns.
On the supply side, the skills forecast produces projections of participation rates by gender and age. In most cases, these are expected to grow though overall rates for both genders and all age groups will fall for most countries in the period up to 2030. This is mainly the outcome of a workforce that is ageing as the size of the older workers’ group is increasing and that of prime-aged workers decreasing. Over the forecast period, this tendency is not expected to cause a decline in the workforce as population is increasing but it may be a matter of time before Europe’s labour force will start declining.
This raises several questions. For example, are measures, such as the extension of working life, flexible forms of work, and support to female participation, which focus on specific groups of workers, enough to resolve the overall problem? Moreover, in such a situation we are faced with, will Europe be able to support high-value-added, knowledge-intensive growth? Will its workforce be adaptable to the changing world of work? From a policies perspective, will adult learning be sufficient to sustain upskilling and reskilling of the labour force in an age of accelerated technological change?
The skills forecast suggests that the orientation of employment towards the service sector will continue. Hotels and catering, health and social work are among the sectors where the most employment growth is expected. In contrast, manufacturing, public administration and agriculture are expected to decline. However, even though basic manufacturing is expected to decline in employment, some high value-added sectors will experience an increase, as with optical and electronic equipment and motor vehicles.
One question is what it will take for the EU to be ready to sustain the shift towards high value added sectors. Will, for example, employers manage to fill these vacancies? Evidence from the Cedefop skills and jobs survey (24) suggests that four out of 10 employers are already having problems filling their vacancies. This bottleneck could be intensified in high value-added sectors. A second question is probably rhetorical. Will automation mitigate job growth? We see that sectors that expected to grow are typically those where technology has relatively limited penetration: legal and accounting services, research and development, advertising and market research, administrative and support service activities. So the question is more how
(24) Cedefop skills and jobs survey: http://www.cedefop.europa.eu/en/events-and-projects/projects/european-skills-and-jobs-esj-survey

97CHAPTER 6.
Discussion and future challenges
employment and education policies respond to this challenge and safeguard employment in sectors where technology has the highest penetration?
At the same time, how can demographic challenges be turned into employment opportunities? If demographic trends are taken for granted then how can we use this to our advantage? Can creation of new services and jobs be directed towards new service sectors, since a key finding is the increasing employment in these sectors? These are typically sectors where non-standard employment forms of work concentrate, and most likely where platform work also occurs. The question here is how this should be addressed to ensure decent work for everyone?
Shifting to occupational employment, job polarisation is expected to grow further. Jobs in the higher and lower skills spectrum are expected to grow in size, while mid-level jobs are expected to be hollowed out. Overall, four out of five new jobs will be in high-skilled occupations. This trend is driven mostly by sectoral changes (for instance service workers) but also technological change that makes some occupations more relevant than others. For instance, many clerks, such as general and keyboard clerks or numerical and material recording clerks, will lose a significant share in employment because they will become less relevant. In contrast, there will be strongest demand for difficult-to-automate occupations, such as legal, social and cultural occupations. The phenomenon of job polarisation is not new but we are at a stage where technological advances seem to be affecting routinised occupations the most. So the question is whether we are heading towards a fully polarised labour market and what are the implications of this?
However, when demand is discussed, there is a also need to include demand occurring due to replacement of the existing workforce. Such demand mostly arises due to retirement or career change and nine out of 10 job openings will be created by replacement. The replacement needs will be highest for older workers, such as in agriculture, and also for those with low-level qualifications and occupations, such as service workers. Even though we expect a decline in overall employment for some occupations, the need to replace existing workers will create numerous job openings. However, there is the question of whether the need to replace workers will materialise, especially at the middle and low levels.
Concluding with labour market imbalances, the skills forecast estimates that by 2030, the needs of the economy for workforce with high level of qualifications will account for about 36.5% of total employment. However, since the supply of highly qualified workforce is outpacing demand, it is more
98 Skills forecast: trends and challenges to 2030
likely that the share of total employment with high level of qualifications will be 41%. From this it can be inferred that a non-trivial share of highly qualified employees will end up in jobs that do not match their level of education, meaning we are heading towards a highly skilled workforce, a significant part of which may not have the opportunity to use the skills accumulated. At the same time, there may be intensification of work at lower levels, rising skill needs and making mid-level occupations even more demanding. Eurofound’s work on the content of jobs reveals that we are heading towards less routinised/more autonomous jobs tasks where interpersonal skills will play a key role for the future. Evidence from the Cedefop skills and jobs survey suggests that a significant part of European workforce found their skills, at the time of hiring, inferior to those required to perform the job sufficiently. Therefore, it is important that education policies work together with social partners in ensuring that workers are equipped with the right skills. Finally there is the question of how the low-skilled, that may be pushed to accept lower wages and work in inferior jobs, can escape the vicious circle of low productivity and low wages.
This publication has presented its main findings with a focus at EU level. More information on the skills forecast, and access to the summary and detailed data on countries, sectors, and occupations, can be found at Cedefop (25) and the Skills Panorama (26). More on the European jobs monitor can be found at Eurofound (27).
(25) http://www.cedefop.europa.eu/en/events-and-projects/projects/forecasting-skill-demand-and-supply
(26) http://skillspanorama.cedefop.europa.eu/en (27) https://www.eurofound.europa.eu/el/observatories/emcc/european-jobs-monitor

Acronyms
CEEC central and eastern European countries
EJM European jobs monitor
ESA European system of national and regional accounts
ESJ European skills and jobs survey
EU European Union
EU-28+3 28 European Union Member States plus three associate countries (Norway, Switzerland, Iceland)
EU-LFS European Union labour force survey
EWCS European working conditions survey
E3ME macroeconomic model
ICEs individual country experts
ICT information and communication technology
ISCED international standard classification of education
ISCO international standard classification of occupations
LMI labour market information
LMII labour market information and intelligence
LFS labour force survey
MC measure of change indicator
NA national accounts
NACEstatistical classification of economic activities in the European Community (from nomenclature statistique des activités économiques dans la Communauté Européenne)
PIAAC programme for the international assessment of adult competencies
PISA programme for international student assessment
RD replacement demand
SES structure of earnings survey

Glossary of definitions used
expansion demand jobs to be created due to growth of sectors/occupations
replacement demand jobs to be opened due to the need to replace existing workers
total job opening expansion and replacement demand
working age population persons 15+
labour force persons 15+ that are employed or actively seeking work
highly skilled occupations ISCO 1-3
skilled non-manual occupations ISCO 4-5
skilled manual occupations ISCO 6-8
elementary occupations ISCO 9

References
ACEA (2017). The automobile industry pocket guide 2017/18. Brussels: European automobile manufacturers association (ACEA). https://www.acea.be/uploads/publications/ACEA_Pocket_Guide_2017-2018.pdf
Autor, D.H. (2013). The task approach to labour markets: an overview. Journal for labour market research, Vol. 46, No 3, pp.185-199.
Cedefop (2012). Skills supply and demand in Europe: methodological framework. Cedefop research paper; No 25. Luxembourg: Publications Office. http://www.cedefop.europa.eu/en/publications-and-resources/publications/5525
Eurofound (2016). What do Europeans do at work? A task-based analysis: European jobs monitor 2016. Luxembourg: Publications Office. https://www.eurofound.europa.eu/sites/default/files/ef_publication/field_ef_document/ef1617en.pdf
European Commission (2012). CARS 2020: action plan for a competitive and sustainable automotive industry in Europe: communication from the Commission to the European Parliament, the Council, the European Economic and Social Committee and the Committee of the Regions. COM(2012) 0636 final. https://eur-lex.europa.eu/legal-content/EN/TXT/?uri=CELEX:52012DC0636
European Commission (2014). CARS 2020: report on the state of play of the outcome of the work of the high level group. Ref. Ares(2014) 3342785-9.10.2014. http://ec.europa.eu/DocsRoom/documents/7143/attachments/1/translations
European Commission (2017a). The 2018 ageing report: underlying assumptions and projections methodologies. Luxembourg: Publications Office. DG ECFIN institutional paper; No 065. https://ec.europa.eu/info/publications/economy-finance/2018-ageing-report-underlying-assumptions-and-projection-methodologies_en
European Commission (2017b). Blueprint for sectoral cooperation on skills: responding to skills mismatches at sectoral level. Luxembourg: Publications Office. http://ec.europa.eu/social/main.jsp?catId=738&langId=en&pubId=7969
102 Skills forecast: trends and challenges to 2030
European Commission (2017c). GEAR 2030: high level group on the competitiveness and sustainable growth of the automotive industry in the European Union: final report. Ref. Ares(2017)5096353-18.10.2017.
Council of the European Union (2010). Council conclusions on ‘New skills for new jobs: the way forward’, Brussels, 7 June 2010. http://www.consilium.europa.eu/uedocs/cms_Data/docs/pressdata/en/lsa/114962.pdf
Fernández-Macías, E.; Hurley, J. (2017). Routine-biased technical change and job polarisation in Europe. Socio-economic review, Vol. 15, No 3, pp. 563-585. https://academic.oup.com/ser/article/15/3/563/2931120
Fernandez-Macias, E.; Hurley, J.; Storrie, D. (eds) (2012). Transformation of the employment structure in the EU and USA, 1995-2007. London: Palgrave Macmillan.
Saffo, P. (2007). Six rules for effective forecasting. Harvard business review, July-August 2007.
Webliography
Cedefop–Forecasting skill demand and supply http://www.cedefop.europa. eu/en/events-and-projects/projects/forecasting-skill-demand-and- supply
Cedefop – Skills and jobs survey http://www.cedefop.europa.eu/en/events- and-projects/projects/european-skills-and-jobs-esj-survey
Cedefop – Skills Panorama http://skillspanorama.cedefop.europa.eu/enEurofound - European jobs monitor (EJM) https://www.eurofound.europa.
eu/observatories/emcc/european-jobs-monitorEurofound – European working conditions survey (EWCS) https://www.
eurofound.europa.eu/surveys/european-working-conditions-surveysEuropean Commission – Annual macroeconomic database (Ameco)
https://ec.europa.eu/info/business-economy-euro/indicators-statistics/economic-databases/macro-economic-database-ameco_en
European Commission – New skills agenda for Europe http://ec.europa.eu/social/main.jsp?catId=1223&langId=en
European Commission – Science hub https://ec.europa.eu/jrc/en/news/eu-companies-rd-investment-grows-faster-global-and-us-trends
Eurostat – European labour force survey (LFS) https://ec.europa.eu/eurostat/web/microdata/european-union-labour-force-survey

103References
Eurostat – Population projection data 2015 http://ec.europa.eu/eurostat/web/population-demography-migration-projections/population-projections-data
O*NET database https://www.onetcenter.org/database.html
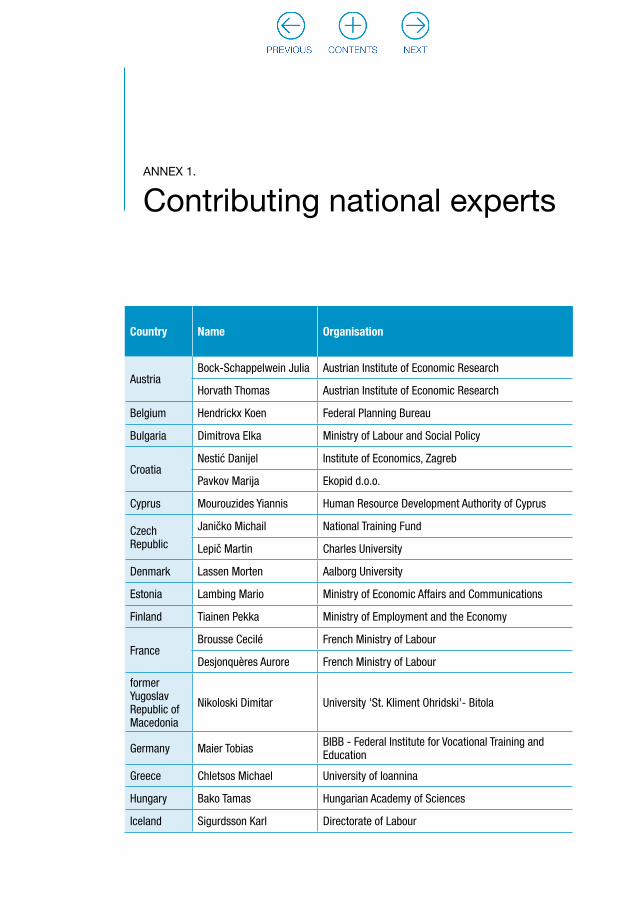
ANNEX 1.
Contributing national experts
Country Name Organisation
AustriaBock-Schappelwein Julia Austrian Institute of Economic Research
Horvath Thomas Austrian Institute of Economic Research
Belgium Hendrickx Koen Federal Planning Bureau
Bulgaria Dimitrova Elka Ministry of Labour and Social Policy
CroatiaNestić Danijel Institute of Economics, Zagreb
Pavkov Marija Ekopid d.o.o.
Cyprus Mourouzides Yiannis Human Resource Development Authority of Cyprus
Czech Republic
Janičko Michail National Training Fund
Lepič Martin Charles University
Denmark Lassen Morten Aalborg University
Estonia Lambing Mario Ministry of Economic Affairs and Communications
Finland Tiainen Pekka Ministry of Employment and the Economy
FranceBrousse Cecilé French Ministry of Labour
Desjonquères Aurore French Ministry of Labour
former Yugoslav Republic of Macedonia
Nikoloski Dimitar University 'St. Kliment Ohridski'- Bitola
Germany Maier Tobias BIBB - Federal Institute for Vocational Training and Education
Greece Chletsos Michael University of Ioannina
Hungary Bako Tamas Hungarian Academy of Sciences
Iceland Sigurdsson Karl Directorate of Labour

105ANNEX 1.
Contributing national experts
Country Name Organisation
Ireland
McNaboe Joan SOLAS – Irish Further Education and Training Authority
Shally Caroline SOLAS – Irish Further Education and Training Authority
McGrath John SOLAS – Irish Further Education and Training Authority
Italy Colombo Emilio Università Cattolica del Sacro Cuore, Milano
Latvia Ozols Normunds Ministry of Economics of Republic of Latvia
LithuaniaBeleckiene Giedre Freelance expert
Martinaitis Žilvinas Visionary Analytics
Luxembourg Clément Franz LISER - Luxembourg Institute of Socio-Economic Research
Malta Ellul Nicholas Ministry of Education & Employment
Netherlands Kuenn-Nelen Annemarie University of Maastricht - ROA
Norway Stølen Nils Martin Statistics Norway
PolandSienkiewicz Łukasz Institute for Labour Market Analyses
Gajdos Artur University of Lodz
Portugal Valente Ana Cláudia ANQEP - Agência Nacional para a Qualificação e o Ensino Profissional
Romania Ghinararu Catalin Corneliu National Labour Research Institute/INCSMPS
SlovakiaRadvansky Marek Slovak Academy of Sciences
Stefanik Miroslav Slovak Academy of Sciences
Slovenia Zupancic Magda Ministry of Labour, Family, Social Affairs and Equal Opportunities
SpainCaprile Elola-Olaso Maria NOTUS – applied social research
Amor Bravo Elias Manuel Fundacion Servicio Valenciano de Empleo
Sweden
Zetterberg-Grünewald Karin Statistics Sweden
Schmieder Russell Statistics Sweden
Switzerland Babel Jacques Swiss Federal Statistical Office
Turkey Ercan Hakan Middle East Technical University
United Kingdom Wilson Robert University of Warwick

ANNEX 2.
Additional Chapter 2 tables
Table A1. Employment growth rates by country (% pa)
Country 2010-15 2016-20 2021-25 2026-30
Belgium 0.6 0.8 0.7 0.5
Bulgaria -0.7 0.2 0.0 -0.1
Czech Republic 0.3 0.7 0.2 0.5
Denmark 0.5 0.5 1.0 0.6
Germany 0.7 0.2 0.0 -0.3
Estonia 2.7 0.1 0.0 -0.3
Ireland 1.6 1.1 1.4 1.4
Greece -2.7 0.5 0.8 0.1
Spain -1.0 1.1 1.2 0.6
France 0.2 0.8 0.7 0.6
Croatia -1.2 0.0 0.0 -0.1
Italy 0.0 0.2 0.7 0.5
Cyprus -1.3 1.3 2.1 1.0
Latvia 1.8 -0.7 -0.1 -0.4
Lithuania 1.5 0.4 0.0 -0.6
Luxembourg 2.8 1.4 1.0 0.9
Hungary 1.4 0.2 0.5 0.4
Malta 3.2 1.6 0.7 0.6
Netherlands 0.1 0.5 0.5 0.2
Austria 1.0 0.3 0.4 0.3
Poland 0.2 0.2 0.2 0.1
Portugal -0.4 0.1 0.5 0.3
Romania -0.9 0.0 0.2 0.2
Slovenia -0.5 1.0 0.4 0.2
Slovakia 0.9 1.2 0.7 0.2

107ANNEX 2.
Additional Chapter 2 tables
Country 2010-15 2016-20 2021-25 2026-30
Finland -0.1 0.4 0.3 0.6
Sweden 1.6 0.6 0.6 0.5
UK 1.2 0.7 0.7 0.9
Norway 1.4 1.1 0.8 0.7
Switzerland 2.1 0.3 0.4 0.1
Iceland 2.5 -0.7 0.9 1.3
EU-28+3 0.3 0.5 0.5 0.3
Source: Cedefop (2018 skills forecast).

108 Skills forecast: trends and challenges to 2030
Table A2. Baseline employment by detailed sector (% pa), EU-28+3
2010-15 2016-20 2021-25 2026-30
1 Agriculture, etc. + forestry -2.6 -1.1 -0.8 -0.9
2 Mining and quarrying -0.3 -1.5 -2.0 -1.4
3 Food, drink and tobacco 0.1 -0.8 -0.3 -0.3
4 Textiles, clothing & leather -2.6 0.2 -0.2 -1.0
5 Wood, paper, printing and publishing -2.0 -0.4 -0.4 0.1
6 Coke & refined petroleum -0.2 0.1 0.2 0.4
7 Other chemicals -0.9 0.1 0.4 0.6
8 Pharmaceuticals 1.0 -0.1 0.0 0.0
9 Rubber & plastic products and other non-metallic mineral products -0.9 1.2 1.0 0.9
10 Basic metals & metal products -0.7 -0.4 -0.2 -0.4
11 Computer, optical & electronic equipment 0.0 -0.7 0.6 0.0
12 Electrical equipment 1.2 -0.3 -0.9 -2.1
13 Other machinery & equipment 0.9 -1.1 -0.2 0.2
14 Motor vehicles 1.4 0.6 -0.1 0.2
15 Other transport equipment 0.3 -2.5 -1.5 -0.8
16 Manufacturing (rest) -0.1 -0.1 0.1 0.3
17 Electricity -1.1 0.9 0.6 0.5
18 Gas, steam & air conditioning -2.7 1.3 1.0 0.9
19 Water supply 0.7 -0.1 -0.4 0.1
20 Construction -1.7 -0.2 0.4 0.5
21 Wholesale and retail trade 0.0 1.0 0.7 0.4
22 Land transport 0.1 0.0 0.3 0.0
23 Water transport 0.4 0.1 0.1 0.3
24 Air transport 0.4 1.1 0.8 1.4
25 Warehousing and postal services 0.0 0.3 0.6 1.0
26 Accommodation and food service activities 1.9 1.0 0.8 0.3
27 Media 0.1 0.4 1.2 1.6
28 Telecommunications -1.0 -0.5 -0.5 -0.4
29 Computer programming, information services 3.6 -0.6 0.5 0.4
30 Financial and insurance activities 0.2 0.5 0.8 0.6

109ANNEX 2.
Additional Chapter 2 tables
2010-15 2016-20 2021-25 2026-30
31 Real estate activities 2.8 1.1 1.0 0.1
32 Legal, accounting & consulting services 1.8 3.1 2.2 2.1
33 Architectural & engineering 2.5 0.5 0.4 0.5
34 R&D 1.5 2.0 2.7 2.7
35 Advertising and market research; other professional (rest) 3.8 0.9 1.5 1.4
36 Administrative and support service activities 2.5 1.6 1.1 0.8
37 Public administration & defence -0.6 -0.3 -0.3 -0.3
38 Education 0.5 0.3 0.2 0.0
39 Health 1.5 0.8 0.7 0.2
40 Arts, entertainment and recreation 1.3 1.0 1.6 1.4
41 Other service activities 0.5 1.0 0.8 0.3
42 Unallocated + hydrogen 0.0 0.0 0.0 0.0
Source: Cedefop (2018 skills forecast).

110 Skills forecast: trends and challenges to 2030
Table A3. Summary country results, 2030 compared to 2016
Country Working age population, %
Average participation
rate, ppLabour force, % Labour force,
000s
Belgium 9.3 -1.8 5.5 278.6
Bulgaria -10.1 0.0 -10.2 -338.3
Czech Republic 1.8 -0.9 0.3 14.8
Denmark 10.7 0.3 11.2 333.2
Germany 2.0 -1.5 -0.5 -230.7
Estonia 0.1 -2.3 -3.5 -24.1
Ireland 15.3 -4.4 6.9 149.3
Greece -4.8 -4.5 -13 -617.9
Spain 3.1 -5.4 -6.5 -1 478.6
France 6.9 -0.4 6.1 1 813
Italy 1.7 -1.7 -2.0 -503.3
Cyprus 11.4 0.0 11.5 48.6
Latvia -12.4 -2.0 -15.4 -151.6
Lithuania -17.2 -2.3 -20.4 -297.0
Luxembourg 31.0 -2.4 25.7 73.2
Hungary -2.1 0.8 -0.6 -25.6
Malta 11.2 -3.8 3.9 8.2
Netherlands 8.9 0.2 9.2 826.3
Austria 10.7 -1.3 8.3 372.2
Poland -0.9 -1.3 -3.4 -582.7
Portugal -1.5 -2.9 -6.4 -332.8
Romania -8.1 -1.1 -9.9 -902
Slovenia 1.9 -5.2 -7.3 -73.9
Slovakia 1.8 -2.6 -2.7 -73.9
Finland 4.9 0.1 5.0 136.1
Sweden 13.5 -1.3 11.2 591.8
UK 10.3 -1.5 7.6 2 546
Norway 14.1 1.6 16.8 471.6
Switzerland 14.0 -1.7 11.1 540.2
Iceland 11.7 -1.2 9.9 19.2

111ANNEX 2.
Additional Chapter 2 tables
Country Working age population, %
Average participation
rate, ppLabour force, % Labour force,
000s
Croatia -3.1 -0.6 -4.1 -78.0
EU-28+3 3.7 -1.5 1.0 2 512.0
Source: Cedefop (2018 skills forecast).

112 Skills forecast: trends and challenges to 2030
Table A4. Summary results by labour group, 2030 compared to 2016
Population, %
Average participation rate, pp
Labour supply, %
Labour supply, 000s
1 Male 15-19 0.4 1.6 7.8 239.4
2 Male 20-24 -1.2 4.3 5.6 547.5
3 Male 25-29 -8.7 -0.2 -8.9 -1 290.7
4 Male 30-34 -7.5 1.0 -6.4 -1 020.5
5 Male 35-39 -6.2 0.8 -5.4 -902.2
6 Male 40-44 -6.8 1.7 -5.2 -890.4
7 Male 44-49 -9.4 2.3 -7.1 -1 238.1
8 Male 50-54 -6.1 2.3 -3.7 -622.0
9 Male 55-59 3.7 5.2 10.4 1 431.4
10 Male 60-64 16.5 6.8 32.4 2 480.3
11 Male 65+ 32.7 2.8 76.5 2 746.0
12 Female 15-19 0.6 1.9 10.5 275.3
13 Female 20-24 -1.1 1.8 2.0 162.9
14 Female 25-29 -9.6 3.8 -5.0 -630.0
15 Female 30-34 -9.7 3.2 -6.0 -800.0
16 Female 35-39 -8.5 3.7 -4.3 -623.8
17 Female 40-44 -7.9 4.2 -3.1 -470.6
18 Female 45-49 -9.4 4.6 -4.2 -652.5
19 Female 50-54 -6.7 4.1 -1.8 -262.7
20 Female 55-59 1.9 5.0 9.5 1 134.4
21 Female 60-64 12.6 5.0 29.0 1 673.2
22 Female 65+ 25.3 0.9 56.5 1 224.9
23 Total 15-19 0.5 1.7 9.0 514.7
24 Total 20-24 -1.2 3.1 3.9 710.4
25 Total 25-29 -9.1 1.8 -7.1 -1 920.7
26 Total 30-34 -8.6 2.2 -6.2 -1 820.5
27 Total 35-39 -7.3 2.3 -4.9 -1 526.0
28 Total 40-44 -7.4 3.0 -4.2 -1 361.0
29 Total 45-49 -9.4 3.5 -5.7 -1 890.6
30 Total 50-54 -6.4 3.2 -2.8 -884.6
31 Total 55-59 2.8 5.1 10.0 2 565.7
32 Total 60-64 14.5 6.0 30.9 4 153.5
33 Total 65+ 28.5 1.8 69.0 3 971.0
Source: Cedefop (2018 skills forecast).
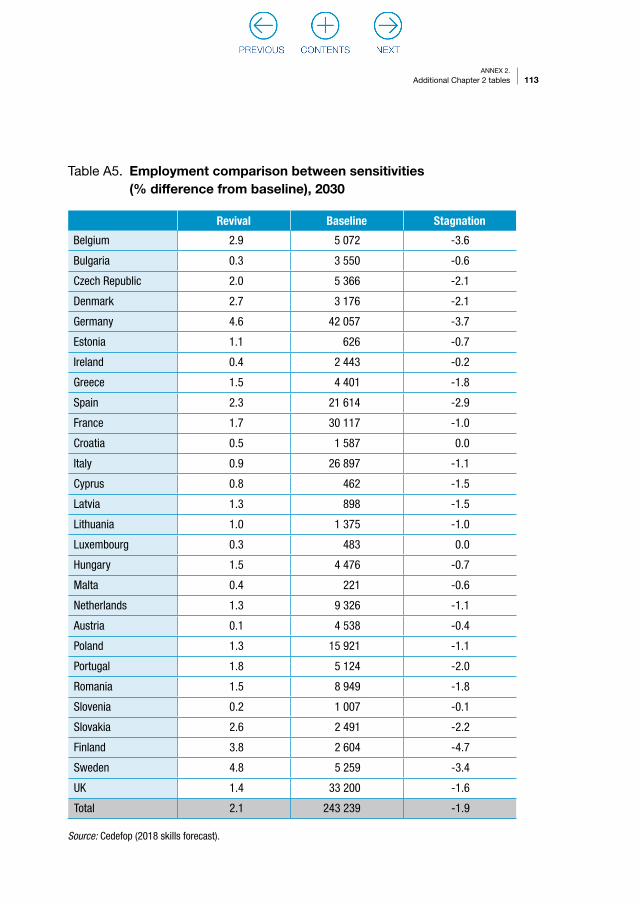
113ANNEX 2.
Additional Chapter 2 tables
Table A5. Employment comparison between sensitivities (% difference from baseline), 2030
Revival Baseline Stagnation
Belgium 2.9 5 072 -3.6
Bulgaria 0.3 3 550 -0.6
Czech Republic 2.0 5 366 -2.1
Denmark 2.7 3 176 -2.1
Germany 4.6 42 057 -3.7
Estonia 1.1 626 -0.7
Ireland 0.4 2 443 -0.2
Greece 1.5 4 401 -1.8
Spain 2.3 21 614 -2.9
France 1.7 30 117 -1.0
Croatia 0.5 1 587 0.0
Italy 0.9 26 897 -1.1
Cyprus 0.8 462 -1.5
Latvia 1.3 898 -1.5
Lithuania 1.0 1 375 -1.0
Luxembourg 0.3 483 0.0
Hungary 1.5 4 476 -0.7
Malta 0.4 221 -0.6
Netherlands 1.3 9 326 -1.1
Austria 0.1 4 538 -0.4
Poland 1.3 15 921 -1.1
Portugal 1.8 5 124 -2.0
Romania 1.5 8 949 -1.8
Slovenia 0.2 1 007 -0.1
Slovakia 2.6 2 491 -2.2
Finland 3.8 2 604 -4.7
Sweden 4.8 5 259 -3.4
UK 1.4 33 200 -1.6
Total 2.1 243 239 -1.9
Source: Cedefop (2018 skills forecast).

ANNEX 3.
Additional Chapter 3 figures
Table A6. Employment change by detailed occupation, 2011-30 (EU-28+3)
thousands 2016-30 thousands
Levels 2011 2016 2021 2026 2030 Net change Replacement demand Total requirement
11. Chief executives, senior officials and legislators 1 776 1 879 1 971 2 063 2 119 239 1 818 2 057
12. Administrative and commercial managers 3 701 3 901 4 133 4 374 4 547 646 2 546 3 192
13. Production and specialised services managers 4 735 4 956 5 128 5 389 5 599 643 3 602 4 245
14. Hospitality, retail and other services managers 4 028 4 256 4 481 4 676 4 774 518 3 131 3 649
21. Science and engineering professionals 6 184 6 703 7 063 7 514 7 848 1 145 3 986 5 131
22. Health professionals 5 862 6 099 6 299 6 491 6 549 450 4 367 4 817
23. Teaching professionals 10 430 10 516 10 476 10 434 10 276 -240 6 787 6 547
24. Business and administration professionals 7 864 8 702 9 354 9 997 10 478 1 776 4 953 6 729
25. Information and communications technology professionals 3 376 3 767 3 888 4 109 4 248 480 1 439 1 920
26. Legal, social and cultural professionals 5 620 6 161 6 611 7 103 7 451 1 290 4 302 5 592
31. Science and engineering associate professionals 8 206 8 301 8 399 8 555 8 657 356 4 773 5 129
32. Health associate professionals 5 890 6 356 6 610 6 870 6 995 639 3 529 4 168
33. Business and administration associate professionals 16 322 17 077 17 794 18 556 19 065 1 987 10 525 12 512
34. Legal, social, cultural and related associate professionals 4 271 5 045 5 999 6 979 7 737 2 692 3 317 6 009
35. Information and communications technicians 1 884 1 978 1 963 2 020 2 067 89 700 789
41. General and keyboard clerks 7 713 7 323 7 028 6 732 6 404 -918 4 128 3 209
42. Customer services clerks 5 467 6 045 6 663 7 350 7 842 1 796 3 679 5 475
43. Numerical and material recording clerks 8 407 7 964 7 680 7 344 6 972 -991 4 170 3 178

115ANNEX 3.
Additional Chapter 3 figures
thousands 2016-30 thousands
Levels 2011 2016 2021 2026 2030 Net change Replacement demand Total requirement
11. Chief executives, senior officials and legislators 1 776 1 879 1 971 2 063 2 119 239 1 818 2 057
12. Administrative and commercial managers 3 701 3 901 4 133 4 374 4 547 646 2 546 3 192
13. Production and specialised services managers 4 735 4 956 5 128 5 389 5 599 643 3 602 4 245
14. Hospitality, retail and other services managers 4 028 4 256 4 481 4 676 4 774 518 3 131 3 649
21. Science and engineering professionals 6 184 6 703 7 063 7 514 7 848 1 145 3 986 5 131
22. Health professionals 5 862 6 099 6 299 6 491 6 549 450 4 367 4 817
23. Teaching professionals 10 430 10 516 10 476 10 434 10 276 -240 6 787 6 547
24. Business and administration professionals 7 864 8 702 9 354 9 997 10 478 1 776 4 953 6 729
25. Information and communications technology professionals 3 376 3 767 3 888 4 109 4 248 480 1 439 1 920
26. Legal, social and cultural professionals 5 620 6 161 6 611 7 103 7 451 1 290 4 302 5 592
31. Science and engineering associate professionals 8 206 8 301 8 399 8 555 8 657 356 4 773 5 129
32. Health associate professionals 5 890 6 356 6 610 6 870 6 995 639 3 529 4 168
33. Business and administration associate professionals 16 322 17 077 17 794 18 556 19 065 1 987 10 525 12 512
34. Legal, social, cultural and related associate professionals 4 271 5 045 5 999 6 979 7 737 2 692 3 317 6 009
35. Information and communications technicians 1 884 1 978 1 963 2 020 2 067 89 700 789
41. General and keyboard clerks 7 713 7 323 7 028 6 732 6 404 -918 4 128 3 209
42. Customer services clerks 5 467 6 045 6 663 7 350 7 842 1 796 3 679 5 475
43. Numerical and material recording clerks 8 407 7 964 7 680 7 344 6 972 -991 4 170 3 178

116 Skills forecast: trends and challenges to 2030
thousands 2016-30 thousands
Levels 2011 2016 2021 2026 2030 Net change Replacement demand Total requirement
44. Other clerical support workers 3 168 2 949 2 743 2 549 2 373 -576 1 601 1 026
51. Personal service workers 11 465 11 951 12 229 12 409 12 308 357 7 027 7 384
52. Sales workers 16 158 16 327 16 798 17 116 17 187 860 8 814 9 674
53. Personal care workers 7 821 8 222 8 464 8 677 8 692 470 5 261 5 732
54. Protective services workers 3 810 3 855 3 866 3 865 3 824 -30 1 965 1 934
61. Market-oriented skilled agricultural workers 8 788 7 942 7 674 7 473 7 264 -678 6 804 6 126
62. Market-oriented skilled forestry, fishery and hunting workers 427 406 400 402 404 -1 262 260
63. Subsistence farmers, fishers, hunters and gatherers 625 507 478 451 422 -85 479 394
71. Building and related trades workers, excluding electricians 9 427 9 098 9 219 9 536 9 756 658 4 690 5 349
72. Metal, machinery and related trades workers 9 180 8 616 8 218 7 867 7 531 -1 084 4 431 3 347
73. Handicraft and printing workers 1 418 1 293 1 259 1 233 1 216 -77 758 680
74. Electrical and electronic trades workers 3 822 3 600 3 514 3 448 3 367 -233 1 795 1 563
75. Food processing, wood working, garment and other craft and related trades 4 663 4 292 4 056 3 862 3 692 -599 2 037 1 438
81. Stationary plant and machine operators 5 298 5 150 5 148 5 148 5 127 -23 2 484 2 461
82. Assemblers 1 622 1 700 1 852 2 030 2 158 457 802 1 259
83. Drivers and mobile plant operators 9 909 9 734 9 732 9 768 9 723 -11 6 279 6 268
91. Cleaners and helpers 9 375 9 951 10 470 10 900 11 013 1 062 7 757 8 819
92. Agricultural, forestry and fishery labourers 1 855 1 912 1 995 2 110 2 186 274 1 397 1 671
93. Labourers in mining, construction, manufacturing and transport 6 187 6 577 7 049 7 604 8 037 1 461 3 413 4 874
94. Food preparation assistants 1 794 1 891 1 912 1 919 1 895 3 1 117 1 120
95. Street and related sales and service workers 212 206 201 193 186 -20 114 94
96. Refuse workers and other elementary workers 2 477 2 607 2 623 2 669 2 703 96 1 828 1 924
All occupations 231 237 235 812 241 438 247 782 250 691 14 879 142 867 157 746
NB: Categories shown are two-digit ISCO-08.Source: Cedefop (2018 skills forecast).
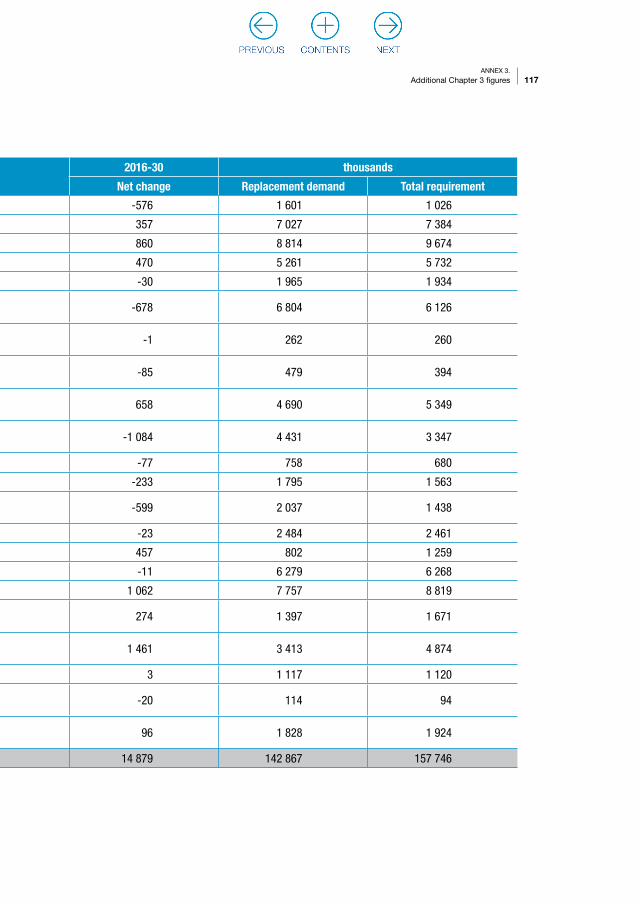
117ANNEX 3.
Additional Chapter 3 figures
thousands 2016-30 thousands
Levels 2011 2016 2021 2026 2030 Net change Replacement demand Total requirement
44. Other clerical support workers 3 168 2 949 2 743 2 549 2 373 -576 1 601 1 026
51. Personal service workers 11 465 11 951 12 229 12 409 12 308 357 7 027 7 384
52. Sales workers 16 158 16 327 16 798 17 116 17 187 860 8 814 9 674
53. Personal care workers 7 821 8 222 8 464 8 677 8 692 470 5 261 5 732
54. Protective services workers 3 810 3 855 3 866 3 865 3 824 -30 1 965 1 934
61. Market-oriented skilled agricultural workers 8 788 7 942 7 674 7 473 7 264 -678 6 804 6 126
62. Market-oriented skilled forestry, fishery and hunting workers 427 406 400 402 404 -1 262 260
63. Subsistence farmers, fishers, hunters and gatherers 625 507 478 451 422 -85 479 394
71. Building and related trades workers, excluding electricians 9 427 9 098 9 219 9 536 9 756 658 4 690 5 349
72. Metal, machinery and related trades workers 9 180 8 616 8 218 7 867 7 531 -1 084 4 431 3 347
73. Handicraft and printing workers 1 418 1 293 1 259 1 233 1 216 -77 758 680
74. Electrical and electronic trades workers 3 822 3 600 3 514 3 448 3 367 -233 1 795 1 563
75. Food processing, wood working, garment and other craft and related trades 4 663 4 292 4 056 3 862 3 692 -599 2 037 1 438
81. Stationary plant and machine operators 5 298 5 150 5 148 5 148 5 127 -23 2 484 2 461
82. Assemblers 1 622 1 700 1 852 2 030 2 158 457 802 1 259
83. Drivers and mobile plant operators 9 909 9 734 9 732 9 768 9 723 -11 6 279 6 268
91. Cleaners and helpers 9 375 9 951 10 470 10 900 11 013 1 062 7 757 8 819
92. Agricultural, forestry and fishery labourers 1 855 1 912 1 995 2 110 2 186 274 1 397 1 671
93. Labourers in mining, construction, manufacturing and transport 6 187 6 577 7 049 7 604 8 037 1 461 3 413 4 874
94. Food preparation assistants 1 794 1 891 1 912 1 919 1 895 3 1 117 1 120
95. Street and related sales and service workers 212 206 201 193 186 -20 114 94
96. Refuse workers and other elementary workers 2 477 2 607 2 623 2 669 2 703 96 1 828 1 924
All occupations 231 237 235 812 241 438 247 782 250 691 14 879 142 867 157 746
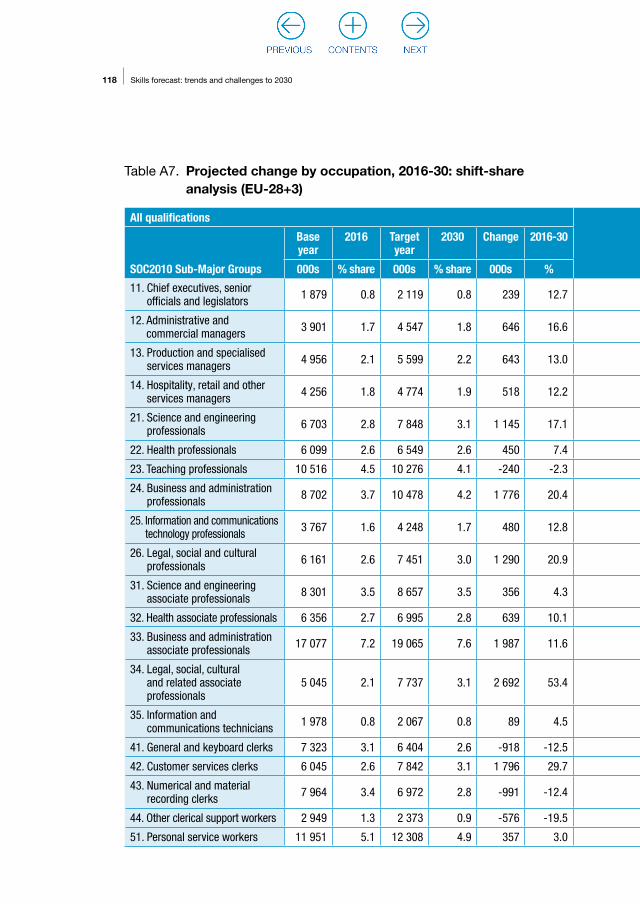
118 Skills forecast: trends and challenges to 2030
Table A7. Projected change by occupation, 2016-30: shift-share analysis (EU-28+3)
All qualifications Components of change
Base year
2016 Target year
2030 Change 2016-30 Scale effect Occupation effect
Industry mix effect
SOC2010 Sub-Major Groups 000s % share 000s % share 000s % 000s % 000s % 000s %
11. Chief executives, senior officials and legislators 1 879 0.8 2 119 0.8 239 12.7 119 6.3 115 6.1 6 0.3
12. Administrative and commercial managers 3 901 1.7 4 547 1.8 646 16.6 246 6.3 286 7.3 114 2.9
13. Production and specialised services managers 4 956 2.1 5 599 2.2 643 13.0 313 6.3 409 8.2 -78 -1.6
14. Hospitality, retail and other services managers 4 256 1.8 4 774 1.9 518 12.2 269 6.3 83 1.9 167 3.9
21. Science and engineering professionals 6 703 2.8 7 848 3.1 1 145 17.1 423 6.3 775 11.6 -53 -0.8
22. Health professionals 6 099 2.6 6 549 2.6 450 7.4 385 6.3 -51 -0.8 116 1.9
23. Teaching professionals 10 516 4.5 10 276 4.1 -240 -2.3 663 6.3 -586 -5.6 -318 -3.0
24. Business and administration professionals 8 702 3.7 10 478 4.2 1 776 20.4 549 6.3 847 9.7 380 4.4
25. Information and communications technology professionals 3 767 1.6 4 248 1.7 480 12.8 238 6.3 263 7.0 -20 -0.5
26. Legal, social and cultural professionals 6 161 2.6 7 451 3.0 1 290 20.9 389 6.3 471 7.6 430 7.0
31. Science and engineering associate professionals 8 301 3.5 8 657 3.5 356 4.3 524 6.3 52 0.6 -220 -2.6
32. Health associate professionals 6 356 2.7 6 995 2.8 639 10.1 401 6.3 124 2.0 114 1.8
33. Business and administration associate professionals 17 077 7.2 19 065 7.6 1 987 11.6 1 077 6.3 519 3.0 390 2.3
34. Legal, social, cultural and related associate professionals
5 045 2.1 7 737 3.1 2 692 53.4 318 6.3 2 231 44.2 143 2.8
35. Information and communications technicians 1 978 0.8 2 067 0.8 89 4.5 125 6.3 -26 -1.3 -10 -0.5
41. General and keyboard clerks 7 323 3.1 6 404 2.6 -918 -12.5 462 6.3 -1 472 -20.1 91 1.2
42. Customer services clerks 6 045 2.6 7 842 3.1 1 796 29.7 381 6.3 1 136 18.8 279 4.6
43. Numerical and material recording clerks 7 964 3.4 6 972 2.8 -991 -12.4 502 6.3 -1 705 -21.4 211 2.7
44. Other clerical support workers 2 949 1.3 2 373 0.9 -576 -19.5 186 6.3 -839 -28.4 77 2.6
51. Personal service workers 11 951 5.1 12 308 4.9 357 3.0 754 6.3 -759 -6.4 363 3.0

119ANNEX 3.
Additional Chapter 3 figures
All qualifications Components of change
Base year
2016 Target year
2030 Change 2016-30 Scale effect Occupation effect
Industry mix effect
SOC2010 Sub-Major Groups 000s % share 000s % share 000s % 000s % 000s % 000s %
11. Chief executives, senior officials and legislators 1 879 0.8 2 119 0.8 239 12.7 119 6.3 115 6.1 6 0.3
12. Administrative and commercial managers 3 901 1.7 4 547 1.8 646 16.6 246 6.3 286 7.3 114 2.9
13. Production and specialised services managers 4 956 2.1 5 599 2.2 643 13.0 313 6.3 409 8.2 -78 -1.6
14. Hospitality, retail and other services managers 4 256 1.8 4 774 1.9 518 12.2 269 6.3 83 1.9 167 3.9
21. Science and engineering professionals 6 703 2.8 7 848 3.1 1 145 17.1 423 6.3 775 11.6 -53 -0.8
22. Health professionals 6 099 2.6 6 549 2.6 450 7.4 385 6.3 -51 -0.8 116 1.9
23. Teaching professionals 10 516 4.5 10 276 4.1 -240 -2.3 663 6.3 -586 -5.6 -318 -3.0
24. Business and administration professionals 8 702 3.7 10 478 4.2 1 776 20.4 549 6.3 847 9.7 380 4.4
25. Information and communications technology professionals 3 767 1.6 4 248 1.7 480 12.8 238 6.3 263 7.0 -20 -0.5
26. Legal, social and cultural professionals 6 161 2.6 7 451 3.0 1 290 20.9 389 6.3 471 7.6 430 7.0
31. Science and engineering associate professionals 8 301 3.5 8 657 3.5 356 4.3 524 6.3 52 0.6 -220 -2.6
32. Health associate professionals 6 356 2.7 6 995 2.8 639 10.1 401 6.3 124 2.0 114 1.8
33. Business and administration associate professionals 17 077 7.2 19 065 7.6 1 987 11.6 1 077 6.3 519 3.0 390 2.3
34. Legal, social, cultural and related associate professionals
5 045 2.1 7 737 3.1 2 692 53.4 318 6.3 2 231 44.2 143 2.8
35. Information and communications technicians 1 978 0.8 2 067 0.8 89 4.5 125 6.3 -26 -1.3 -10 -0.5
41. General and keyboard clerks 7 323 3.1 6 404 2.6 -918 -12.5 462 6.3 -1 472 -20.1 91 1.2
42. Customer services clerks 6 045 2.6 7 842 3.1 1 796 29.7 381 6.3 1 136 18.8 279 4.6
43. Numerical and material recording clerks 7 964 3.4 6 972 2.8 -991 -12.4 502 6.3 -1 705 -21.4 211 2.7
44. Other clerical support workers 2 949 1.3 2 373 0.9 -576 -19.5 186 6.3 -839 -28.4 77 2.6
51. Personal service workers 11 951 5.1 12 308 4.9 357 3.0 754 6.3 -759 -6.4 363 3.0

120 Skills forecast: trends and challenges to 2030
All qualifications Components of change
Base year
2016 Target year
2030 Change 2016-30 Scale effect Occupation effect
Industry mix effect
SOC2010 Sub-Major Groups 000s % share 000s % share 000s % 000s % 000s % 000s %
52. Sales workers 16 327 6.9 17 187 6.9 860 5.3 1 030 6.3 -603 -3.7 433 2.7
53. Personal care workers 8 222 3.5 8 692 3.5 470 5.7 519 6.3 -140 -1.7 91 1.1
54. Protective services workers 3 855 1.6 3 824 1.5 -30 -0.8 243 6.3 -254 -6.6 -20 -0.5
61. Market-oriented skilled agricultural workers 7 942 3.4 7 264 2.9 -678 -8.5 501 6.3 -152 -1.9 -1 028 -12.9
62. Market-oriented skilled forestry, fishery and hunting workers 406 0.2 404 0.2 -1 -0.3 26 6.3 18 4.4 -45 -11.0
63. Subsistence farmers, fishers, hunters and gatherers 507 0.2 422 0.2 -85 -16.7 32 6.3 -26 -5.1 -91 -18.0
71. Building and related trades workers, excluding electricians 9 098 3.9 9 756 3.9 658 7.2 574 6.3 258 2.8 -173 -1.9
72. Metal, machinery and related trades workers 8 616 3.7 7 531 3.0 -1 084 -12.6 544 6.3 -1 276 -14.8 -352 -4.1
73. Handicraft and printing workers 1 293 0.5 1 216 0.5 -77 -6.0 82 6.3 -124 -9.6 -35 -2.7
74. Electrical and electronic trades workers 3 600 1.5 3 367 1.3 -233 -6.5 227 6.3 -361 -10.0 -98 -2.7
75. Food processing, wood working, garment and other craft and related trades
4 292 1.8 3 692 1.5 -599 -14.0 271 6.3 -644 -15.0 -226 -5.3
81. Stationary plant and machine operators 5 150 2.2 5 127 2.0 -23 -0.5 325 6.3 -79 -1.5 -269 -5.2
82. Assemblers 1 700 0.7 2 158 0.9 457 26.9 107 6.3 462 27.2 -112 -6.6
83. Drivers and mobile plant operators 9 734 4.1 9 723 3.9 -11 -0.1 614 6.3 -373 -3.8 -252 -2.6
91. Cleaners and helpers 9 951 4.2 11 013 4.4 1 062 10.7 628 6.3 56 0.6 378 3.8
92. Agricultural, forestry and fishery labourers 1 912 0.8 2 186 0.9 274 14.3 121 6.3 410 21.5 -257 -13.5
93. Labourers in mining, construction, manufacturing and transport
6 577 2.8 8 037 3.2 1 461 22.2 415 6.3 1 118 17.0 -72 -1.1
94. Food preparation assistants 1 891 0.8 1 895 0.8 3 0.2 119 6.3 -155 -8.2 39 2.1
95. Street and related sales and service workers 206 0.1 186 0.1 -20 -9.8 13 6.3 -40 -19.2 7 3.2
96. Refuse workers and other elementary workers 2 607 1.1 2 703 1.1 96 3.7 164 6.3 -80 -3.1 12 0.4
All occupations 235 812 100 250 691 100 14 879 6.3
Source: Cedefop (2018 skills forecast).

121ANNEX 3.
Additional Chapter 3 figures
All qualifications Components of change
Base year
2016 Target year
2030 Change 2016-30 Scale effect Occupation effect
Industry mix effect
SOC2010 Sub-Major Groups 000s % share 000s % share 000s % 000s % 000s % 000s %
52. Sales workers 16 327 6.9 17 187 6.9 860 5.3 1 030 6.3 -603 -3.7 433 2.7
53. Personal care workers 8 222 3.5 8 692 3.5 470 5.7 519 6.3 -140 -1.7 91 1.1
54. Protective services workers 3 855 1.6 3 824 1.5 -30 -0.8 243 6.3 -254 -6.6 -20 -0.5
61. Market-oriented skilled agricultural workers 7 942 3.4 7 264 2.9 -678 -8.5 501 6.3 -152 -1.9 -1 028 -12.9
62. Market-oriented skilled forestry, fishery and hunting workers 406 0.2 404 0.2 -1 -0.3 26 6.3 18 4.4 -45 -11.0
63. Subsistence farmers, fishers, hunters and gatherers 507 0.2 422 0.2 -85 -16.7 32 6.3 -26 -5.1 -91 -18.0
71. Building and related trades workers, excluding electricians 9 098 3.9 9 756 3.9 658 7.2 574 6.3 258 2.8 -173 -1.9
72. Metal, machinery and related trades workers 8 616 3.7 7 531 3.0 -1 084 -12.6 544 6.3 -1 276 -14.8 -352 -4.1
73. Handicraft and printing workers 1 293 0.5 1 216 0.5 -77 -6.0 82 6.3 -124 -9.6 -35 -2.7
74. Electrical and electronic trades workers 3 600 1.5 3 367 1.3 -233 -6.5 227 6.3 -361 -10.0 -98 -2.7
75. Food processing, wood working, garment and other craft and related trades
4 292 1.8 3 692 1.5 -599 -14.0 271 6.3 -644 -15.0 -226 -5.3
81. Stationary plant and machine operators 5 150 2.2 5 127 2.0 -23 -0.5 325 6.3 -79 -1.5 -269 -5.2
82. Assemblers 1 700 0.7 2 158 0.9 457 26.9 107 6.3 462 27.2 -112 -6.6
83. Drivers and mobile plant operators 9 734 4.1 9 723 3.9 -11 -0.1 614 6.3 -373 -3.8 -252 -2.6
91. Cleaners and helpers 9 951 4.2 11 013 4.4 1 062 10.7 628 6.3 56 0.6 378 3.8
92. Agricultural, forestry and fishery labourers 1 912 0.8 2 186 0.9 274 14.3 121 6.3 410 21.5 -257 -13.5
93. Labourers in mining, construction, manufacturing and transport
6 577 2.8 8 037 3.2 1 461 22.2 415 6.3 1 118 17.0 -72 -1.1
94. Food preparation assistants 1 891 0.8 1 895 0.8 3 0.2 119 6.3 -155 -8.2 39 2.1
95. Street and related sales and service workers 206 0.1 186 0.1 -20 -9.8 13 6.3 -40 -19.2 7 3.2
96. Refuse workers and other elementary workers 2 607 1.1 2 703 1.1 96 3.7 164 6.3 -80 -3.1 12 0.4
All occupations 235 812 100 250 691 100 14 879 6.3

122 Skills forecast: trends and challenges to 2030
11. Chief executives, senior officials and legislators
12. Administrative and commercial managers
13. Production and specialised services managers
14. Hospitality, retail and other services managers
21. Science and engineering professionals
22. Health professionals
23. Teaching professionals
24. Business and administration professionals
25. Information and communications technology professionals
26. Legal, social and cultural professionals
31. Science and engineering associate professionals
32. Health associate professionals
33. Business and administration associate professionals
34. Legal, social, cultural and related associate professionals
35. Information and communications technicians
41. General and keyboard clerks
42. Customer services clerks
43. Numerical and material recording clerks
44. Other clerical support workers
51. Personal service workers
Change 2016-30 (000s)
-1 500 -750 0 750 1 500 2 250 3 000
Figure A1. Projected change by two-digit occupations, 2016-30 (EU-28+3)
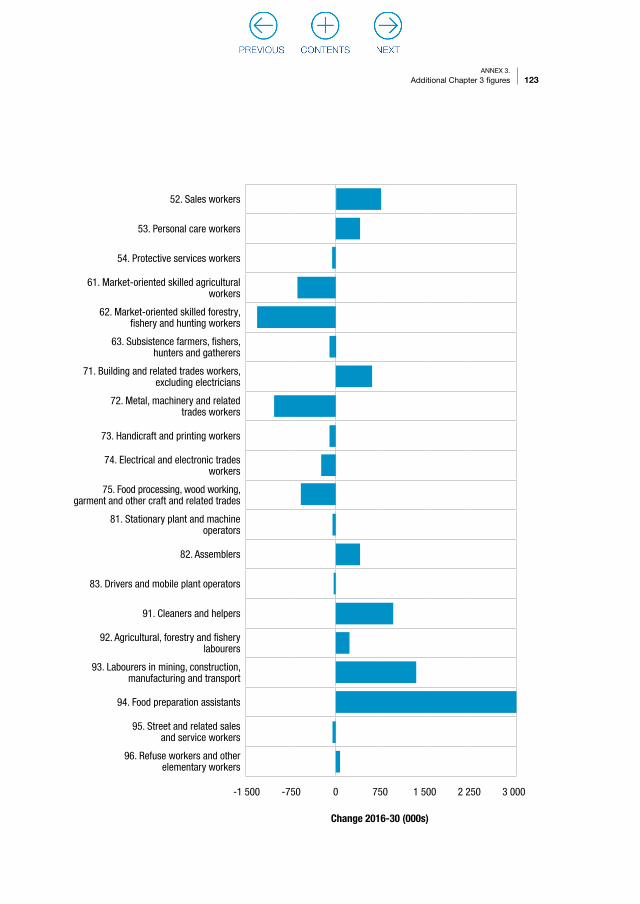
123ANNEX 3.
Additional Chapter 3 figures
52. Sales workers
53. Personal care workers
54. Protective services workers
61. Market-oriented skilled agricultural workers
62. Market-oriented skilled forestry, fishery and hunting workers
63. Subsistence farmers, fishers, hunters and gatherers
71. Building and related trades workers, excluding electricians
72. Metal, machinery and related trades workers
73. Handicraft and printing workers
74. Electrical and electronic trades workers
75. Food processing, wood working, garment and other craft and related trades
81. Stationary plant and machine operators
82. Assemblers
83. Drivers and mobile plant operators
91. Cleaners and helpers
92. Agricultural, forestry and fishery labourers
93. Labourers in mining, construction, manufacturing and transport
94. Food preparation assistants
95. Street and related sales and service workers
96. Refuse workers and other elementary workers
Change 2016-30 (000s)
-1 500 -750 0 750 1 500 2 250 3 000

124 Skills forecast: trends and challenges to 2030
11. Chief executives, senior officials and legislators
12. Administrative and commercial managers
13. Production and specialised services managers
14. Hospitality, retail and other services managers
21. Science and engineering professionals
22. Health professionals
23. Teaching professionals
24. Business and administration professionals
25. Information and communications technology professionals
26. Legal, social and cultural professionals
31. Science and engineering associate professionals
32. Health associate professionals
33. Business and administration associate professionals
34. Legal, social, cultural and related associate professionals
35. Information and communications technicians
41. General and keyboard clerks
42. Customer services clerks
43. Numerical and material recording clerks
44. Other clerical support workers
51. Personal service workers
Change 2016-30 (percentage)
-30 -15 0 15 30 45 60

125ANNEX 3.
Additional Chapter 3 figures
52. Sales workers
53. Personal care workers
54. Protective services workers
61. Market-oriented skilled agricultural workers
62. Market-oriented skilled forestry, fishery and hunting workers
63. Subsistence farmers, fishers, hunters and gatherers
71. Building and related trades workers, excluding electricians
72. Metal, machinery and related trades workers
73. Handicraft and printing workers
74. Electrical and electronic trades workers
75. Food processing, wood working, garment and other craft and related trades
81. Stationary plant and machine operators
82. Assemblers
83. Drivers and mobile plant operators
91. Cleaners and helpers
92. Agricultural, forestry and fishery labourers
93. Labourers in mining, construction, manufacturing and transport
94. Food preparation assistants
95. Street and related sales and service workers
96. Refuse workers and other elementary workers
Change 2016-30 (percentage)
Source: Cedefop (2018 skills forecast).
-30 -15 0 15 30 45 60

126 Skills forecast: trends and challenges to 2030
11. Chief executives, senior officials and legislators
12. Administrative and commercial managers
13. Production and specialised services managers
14. Hospitality, retail and other services managers
21. Science and engineering professionals
22. Health professionals
23. Teaching professionals
24. Business and administration professionals
25. Information and communications technology professionals
26. Legal, social and cultural professionals
31. Science and engineering associate professionals
32. Health associate professionals
33. Business and administration associate professionals
34. Legal, social, cultural and related associate professionals
35. Information and communications technicians
41. General and keyboard clerks
42. Customer services clerks
43. Numerical and material recording clerks
44. Other clerical support workers
51. Personal service workers
Figure A2. Projected change, shift-share analysis, two-digit occupations, 2016-30 (EU-28+3)
Thousands
-2 250 -1 500 -750 0 750 1 500 2 250 3 000
Scale effect Occupation effect Industry mix effect
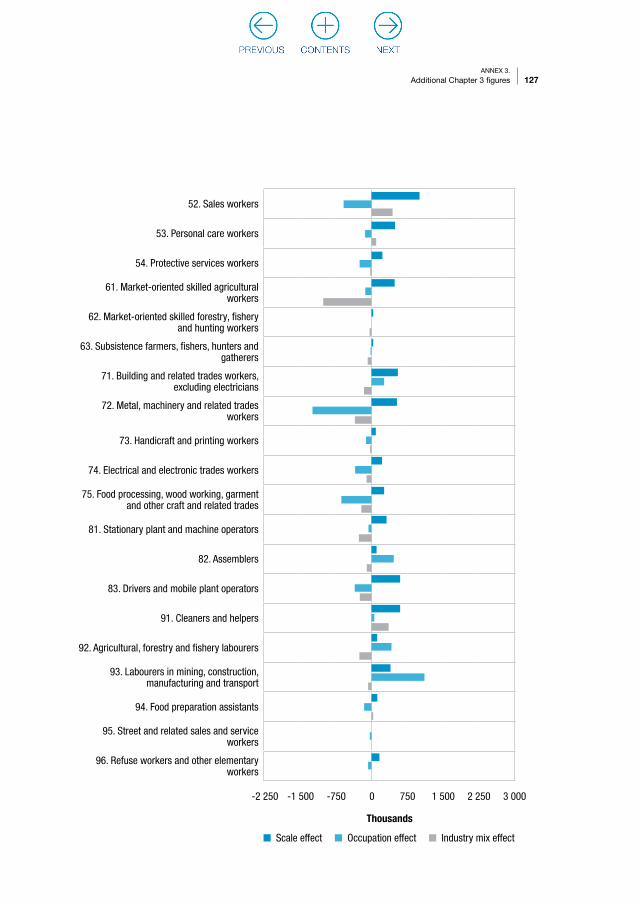
127ANNEX 3.
Additional Chapter 3 figures
52. Sales workers
53. Personal care workers
54. Protective services workers
61. Market-oriented skilled agricultural workers
62. Market-oriented skilled forestry, fishery and hunting workers
63. Subsistence farmers, fishers, hunters and gatherers
71. Building and related trades workers, excluding electricians
72. Metal, machinery and related trades workers
73. Handicraft and printing workers
74. Electrical and electronic trades workers
75. Food processing, wood working, garment and other craft and related trades
81. Stationary plant and machine operators
82. Assemblers
83. Drivers and mobile plant operators
91. Cleaners and helpers
92. Agricultural, forestry and fishery labourers
93. Labourers in mining, construction, manufacturing and transport
94. Food preparation assistants
95. Street and related sales and service workers
96. Refuse workers and other elementary workers
11. Chief executives, senior officials and legislators
12. Administrative and commercial managers
13. Production and specialised services managers
14. Hospitality, retail and other services managers
21. Science and engineering professionals
22. Health professionals
23. Teaching professionals
24. Business and administration professionals
25. Information and communications technology professionals
26. Legal, social and cultural professionals
31. Science and engineering associate professionals
32. Health associate professionals
33. Business and administration associate professionals
34. Legal, social, cultural and related associate professionals
35. Information and communications technicians
41. General and keyboard clerks
42. Customer services clerks
43. Numerical and material recording clerks
44. Other clerical support workers
51. Personal service workers
Thousands
-2 250 -1 500 -750 0 750 1 500 2 250 3 000
Scale effect Occupation effect Industry mix effect
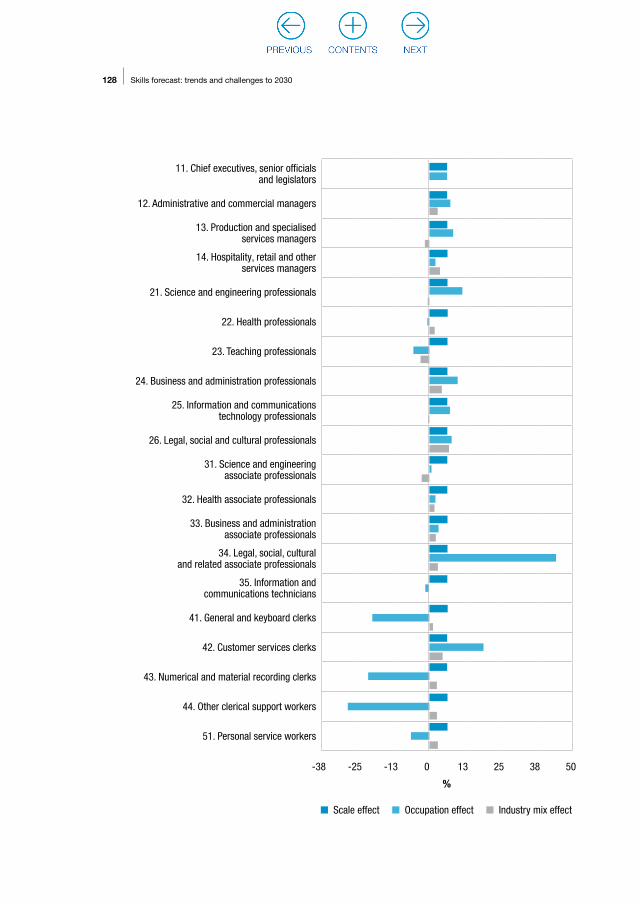
128 Skills forecast: trends and challenges to 2030
%
-38 -25 -13 0 13 25 38 50
11. Chief executives, senior officials and legislators
12. Administrative and commercial managers
13. Production and specialised services managers
14. Hospitality, retail and other services managers
21. Science and engineering professionals
22. Health professionals
23. Teaching professionals
24. Business and administration professionals
25. Information and communications technology professionals
26. Legal, social and cultural professionals
31. Science and engineering associate professionals
32. Health associate professionals
33. Business and administration associate professionals
34. Legal, social, cultural and related associate professionals
35. Information and communications technicians
41. General and keyboard clerks
42. Customer services clerks
43. Numerical and material recording clerks
44. Other clerical support workers
51. Personal service workers
Scale effect Occupation effect Industry mix effect

129ANNEX 3.
Additional Chapter 3 figures
Source: Cedefop (2018 skills forecast).
%
-38 -25 -13 0 13 25 38 50
52. Sales workers
53. Personal care workers
54. Protective services workers
61. Market-oriented skilled agricultural workers
62. Market-oriented skilled forestry, fishery and hunting workers
63. Subsistence farmers, fishers, hunters and gatherers
71. Building and related trades workers, excluding electricians
72. Metal, machinery and related trades workers
73. Handicraft and printing workers
74. Electrical and electronic trades workers
75. Food processing, wood working, garment and other craft and related trades
81. Stationary plant and machine operators
82. Assemblers
83. Drivers and mobile plant operators
91. Cleaners and helpers
92. Agricultural, forestry and fishery labourers
93. Labourers in mining, construction, manufacturing and transport
94. Food preparation assistants
95. Street and related sales and service workers
96. Refuse workers and other elementary workers
Scale effect Occupation effect Industry mix effect
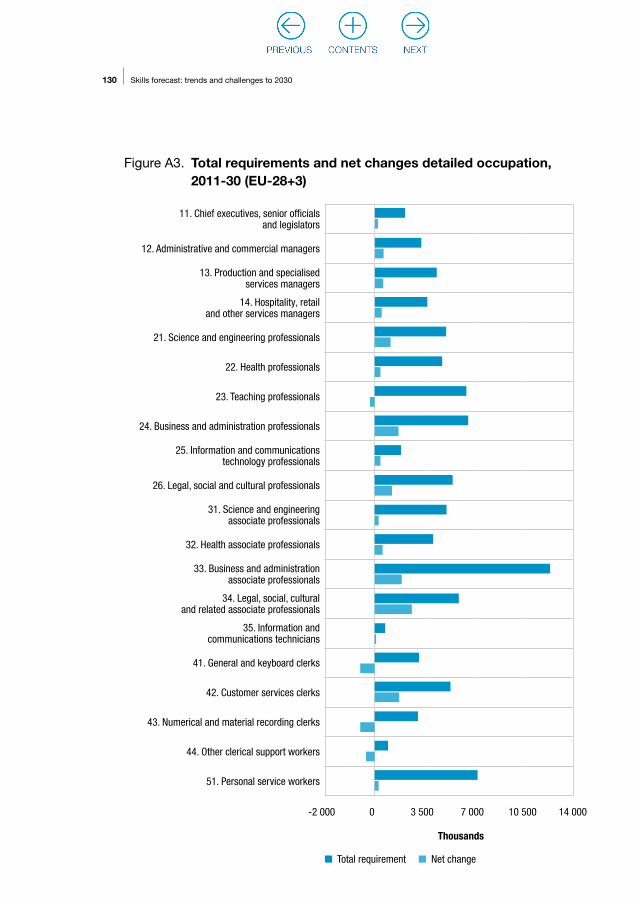
130 Skills forecast: trends and challenges to 2030
11. Chief executives, senior officials and legislators
12. Administrative and commercial managers
13. Production and specialised services managers
14. Hospitality, retail and other services managers
21. Science and engineering professionals
22. Health professionals
23. Teaching professionals
24. Business and administration professionals
25. Information and communications technology professionals
26. Legal, social and cultural professionals
31. Science and engineering associate professionals
32. Health associate professionals
33. Business and administration associate professionals
34. Legal, social, cultural and related associate professionals
35. Information and communications technicians
41. General and keyboard clerks
42. Customer services clerks
43. Numerical and material recording clerks
44. Other clerical support workers
51. Personal service workers
Thousands
-2 000 0 3 500 7 000 10 500 14 000
Figure A3. Total requirements and net changes detailed occupation, 2011-30 (EU-28+3)
Total requirement Net change

131ANNEX 3.
Additional Chapter 3 figures
Thousands
-2 000 0 3 500 7 000 10 500 14 000
Total requirement Net change
52. Sales workers
53. Personal care workers
54. Protective services workers
61. Market-oriented skilled agricultural workers
62. Market-oriented skilled forestry, fishery and hunting workers
63. Subsistence farmers, fishers, hunters and gatherers
71. Building and related trades workers, excluding electricians
72. Metal, machinery and related trades workers
73. Handicraft and printing workers
74. Electrical and electronic trades workers
75. Food processing, wood working, garment and other craft and related trades
81. Stationary plant and machine operators
82. Assemblers
83. Drivers and mobile plant operators
91. Cleaners and helpers
92. Agricultural, forestry and fishery labourers
93. Labourers in mining, construction, manufacturing and transport
94. Food preparation assistants
95. Street and related sales and service workers
96. Refuse workers and other elementary workers

132 Skills forecast: trends and challenges to 2030
11. Chief executives, senior officials and legislators
12. Administrative and commercial managers
13. Production and specialised services managers
14. Hospitality, retail and other services managers
21. Science and engineering professionals
22. Health professionals
23. Teaching professionals
24. Business and administration professionals
25. Information and communications technology professionals
26. Legal, social and cultural professionals
31. Science and engineering associate professionals
32. Health associate professionals
33. Business and administration associate professionals
34. Legal, social, cultural and related associate professionals
35. Information and communications technicians
41. General and keyboard clerks
42. Customer services clerks
43. Numerical and material recording clerks
44. Other clerical support workers
51. Personal service workers
% change
-30 0 30 60 90 120
Total requirement Net change

133ANNEX 3.
Additional Chapter 3 figures
52. Sales workers
53. Personal care workers
54. Protective services workers
61. Market-oriented skilled agricultural workers
62. Market-oriented skilled forestry, fishery and hunting workers
63. Subsistence farmers, fishers, hunters and gatherers
71. Building and related trades workers, excluding electricians
72. Metal, machinery and related trades workers
73. Handicraft and printing workers
74. Electrical and electronic trades workers
75. Food processing, wood working, garment and other craft and related trades
81. Stationary plant and machine operators
82. Assemblers
83. Drivers and mobile plant operators
91. Cleaners and helpers
92. Agricultural, forestry and fishery labourers
93. Labourers in mining, construction, manufacturing and transport
94. Food preparation assistants
95. Street and related sales and service workers
96. Refuse workers and other elementary workers
% change
-30 0 30 60 90 120
Source: Cedefop (2018 skills forecast).
Total requirement Net change
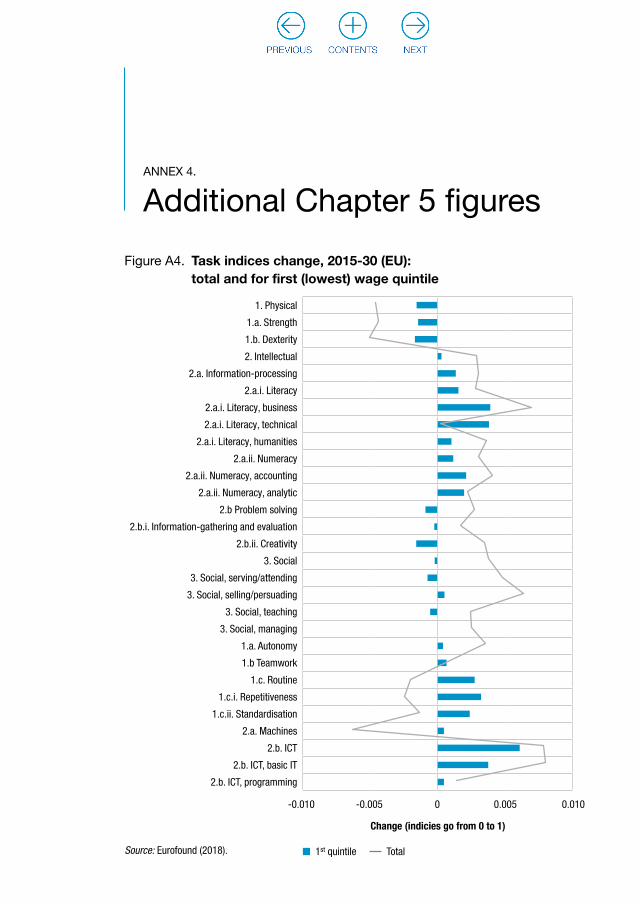
ANNEX 4.
Additional Chapter 5 figures
Figure A4. Task indices change, 2015-30 (EU): total and for first (lowest) wage quintile
Change (indicies go from 0 to 1)
Source: Eurofound (2018). 1st quintile Total
-0.010 -0.005 0 0.005 0.010
1. Physical
1.a. Strength
1.b. Dexterity
2. Intellectual
2.a. Information-processing
2.a.i. Literacy
2.a.i. Literacy, business
2.a.i. Literacy, technical
2.a.i. Literacy, humanities
2.a.ii. Numeracy
2.a.ii. Numeracy, accounting
2.a.ii. Numeracy, analytic
2.b Problem solving
2.b.i. Information-gathering and evaluation
2.b.ii. Creativity
3. Social
3. Social, serving/attending
3. Social, selling/persuading
3. Social, teaching
3. Social, managing
1.a. Autonomy
1.b Teamwork
1.c. Routine
1.c.i. Repetitiveness
1.c.ii. Standardisation
2.a. Machines
2.b. ICT
2.b. ICT, basic IT
2.b. ICT, programming

135ANNEX 4.
Additional Chapter 5 figures
Figure A5. Task indices change, 2015-30 (EU): total and for third (middle) wage quintile
Change (indicies go from 0 to 1)
-0.010 -0.005 0 0.005 0.010
Source: Eurofound (2018).
3rd quintile Total
1. Physical
1.a. Strength
1.b. Dexterity
2. Intellectual
2.a. Information-processing
2.a.i. Literacy
2.a.i. Literacy, business
2.a.i. Literacy, technical
2.a.i. Literacy, humanities
2.a.ii. Numeracy
2.a.ii. Numeracy, accounting
2.a.ii. Numeracy, analytic
2.b Problem solving
2.b.i. Information-gathering and evaluation
2.b.ii. Creativity
3. Social
3. Social, serving/attending
3. Social, selling/persuading
3. Social, teaching
3. Social, managing
1.a. Autonomy
1.b Teamwork
1.c. Routine
1.c.i. Repetitiveness
1.c.ii. Standardisation
2.a. Machines
2.b. ICT
2.b. ICT, basic IT
2.b. ICT, programming
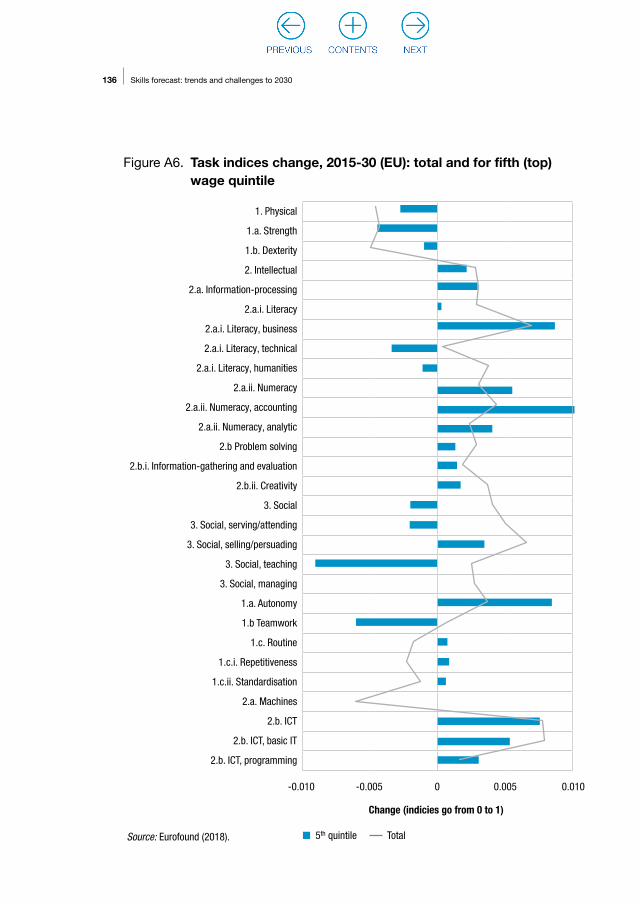
136 Skills forecast: trends and challenges to 2030
Figure A6. Task indices change, 2015-30 (EU): total and for fifth (top) wage quintile
Change (indicies go from 0 to 1)
-0.010 -0.005 0 0.005 0.010
Source: Eurofound (2018). 5th quintile Total
1. Physical
1.a. Strength
1.b. Dexterity
2. Intellectual
2.a. Information-processing
2.a.i. Literacy
2.a.i. Literacy, business
2.a.i. Literacy, technical
2.a.i. Literacy, humanities
2.a.ii. Numeracy
2.a.ii. Numeracy, accounting
2.a.ii. Numeracy, analytic
2.b Problem solving
2.b.i. Information-gathering and evaluation
2.b.ii. Creativity
3. Social
3. Social, serving/attending
3. Social, selling/persuading
3. Social, teaching
3. Social, managing
1.a. Autonomy
1.b Teamwork
1.c. Routine
1.c.i. Repetitiveness
1.c.ii. Standardisation
2.a. Machines
2.b. ICT
2.b. ICT, basic IT
2.b. ICT, programming


Europe 123, 570 01 Thessaloniki (Pylea), GREECEPO Box 22427, 551 02 Thessaloniki, GREECETel. +30 2310490111, Fax +30 2310490020, Email: [email protected]
visit our portal www.cedefop.europa.eu
The European labour market is challenged by changes in the demographic composition of the labour force and by increasing work complexities and processes. Skills forecasting makes a useful contribution to decisions by policy-makers, experts and individuals. In this publication, Cedefop presents the latest results of skill supply and demand forecasts. Alongside the updated projections, collaboration between Cedefop and Eurofound has allowed examination of the tasks and skills content of the current and projected employment structure of Europe. This analysis confi rms an increasingly more polarised occupational structure, a trend also highlighted by the main projections.
ENEN
3077 EN – TI-RF-18-002-EN-N – doi: 10.2801/4492


