32
STATISTICS BRIEF September 2014 Skills mismatch in Europe STATISTICS Department of Statistics

StatiSticS Brief September 2014
Skills mismatch in Europe
Department of Statisticsinternational Labour Office4, route des MorillonscH-1211 Geneva 22Switzerland
tel.: (+41 22) 799 8631fax: (+41 22) 799 6957email: [email protected]: www.ilo.org/statistics
www.ilo.org/ilostat
StatiSticSDepartment of Statistics

International Labour Organization
Skills mismatch in Europe
Statistics Brief
Geneva, 2014
Copyright © International Labour Organization 2014
First published 2014
Publications of the International Labour Office enjoy copyright under Protocol 2 of the Universal
Copyright Convention. Nevertheless, short excerpts from them may be reproduced without authorization,
on condition that the source is indicated. For rights of reproduction or translation, application should be
made to ILO Publications (Rights and Permissions), International Labour Office, CH-1211 Geneva 22,
Switzerland, or by email: [email protected]. The International Labour Office welcomes such applications.
Libraries, institutions and other users registered with reproduction rights organizations may make copies
in accordance with the licences issued to them for this purpose. Visit www.ifrro.org to find the
reproduction rights organization in your country.
ILO Cataloguing in Publication Data Skills mismatch in Europe : statistics brief / International Labour Office, Department of Statistics. - Geneva: ILO, 2014 ISBN: 9789221290438 (print);9789221290445 (web pdf) International Labour Office; Dept.of Statistics skill / data collecting / statistical method / measurement / skilled worker / occupation / age group / sex / Europe 13.02.2
The designations employed in ILO publications, which are in conformity with United Nations practice, and
the presentation of material therein do not imply the expression of any opinion whatsoever on the part of
the International Labour Office concerning the legal status of any country, area or territory or of its
authorities, or concerning the delimitation of its frontiers.
The responsibility for opinions expressed in signed articles, studies and other contributions rests solely
with their authors, and publication does not constitute an endorsement by the International Labour Office
of the opinions expressed in them.
Reference to names of firms and commercial products and processes does not imply their endorsement by
the International Labour Office, and any failure to mention a particular firm, commercial product or
process is not a sign of disapproval.
ILO publications and electronic products can be obtained through major booksellers or ILO local offices in
many countries, or direct from ILO Publications, International Labour Office, CH-1211 Geneva 22,
Switzerland. Catalogues or lists of new publications are available free of charge from the above address, or
by email: [email protected]
Visit our web site: www.ilo.org/publns
Printed in Switzerland
3
Preface In 2008, the 18th International Conference of Labour Statisticians (ICLS) discussed the use of skills mismatch as a potential indicator or component of the measurement of labour underutilization, and this component was also explicitly taken into account in the Resolution concerning statistics of work, employment and labour underutilization adopted by the 19th ICLS in 2013. In the Resolution concerning the development of measures of labour underutilization the 18th ICLS also recommended that the ILO work on the development of a methodology for the measurement of skills mismatch. Although various approaches are currently used by researchers, an agreed methodology is lacking. This brief is part of the efforts that the ILO Department of Statistics is undertaking to contribute to the statistical understanding and quantification of skills mismatch. The brief provides an overview of approaches to measure skills mismatch, and illustrates two approaches using data from the European Social Survey (ESS). Despite some of the limitations for this purpose of current international classifications and of the ESS as a data source, the paper shows that it is possible to produce useful indicators and illustrate major trends. The paper builds on earlier work undertaken by the ILO on this topic, including the work reported in the Key Indicators of the Labour Market, 8th edition (2013). I would like to express my appreciation for the European Social Survey project which provided the statistics used in the current document. Theo Sparreboom and Alexander Tarvid prepared the draft paper, which benefited from comments provided by David Hunter and Mustafa Hakki Ozel. Rafael Diez de Medina, Director ILO Department of Statistics

4
Abstract This Statistics Brief analyzes the incidence of overeducation and undereducation (skills mismatch) in a sample of European economies. Mismatch patterns are shown to depend strongly on the measure of mismatch that is adopted, but overeducation is increasing and undereducation is decreasing on at least one measure in at least half of the countries for which such trends can be assessed. Differences in skills mismatch risk between age groups and sexes are discussed, and country-specific trends are identified.

5
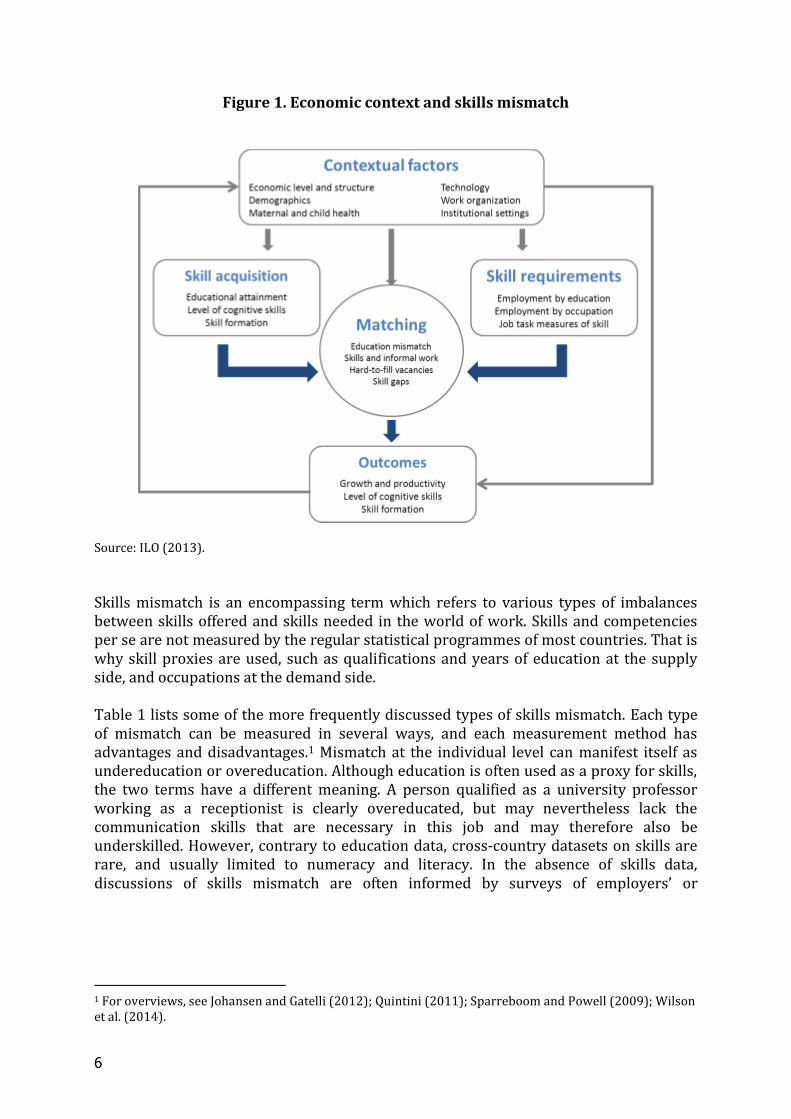
1. Introduction Skills mismatch has received renewed attention in advanced economies following the global economic crisis in 2008-2009. The crisis caused a massive increase in unemployment in the developed world, and patterns of job destruction and job creation interacted with or accelerated longer term structural trends. At the supply side, such trends include increasing levels of educational attainment of workers, while major factors at the demand side include technological change, globalization and trade. Many analysts have argued that skills mismatch has been reinforced by the economic crisis, and identified skills mismatch as a major constraint hampering economic recovery in Europe (ECB, 2012). If growth of educated supply outstrips demand, this may be reflected in a surplus of skilled workers in terms of unemployment, but also in workers who are overeducated for the jobs they perform. Concerns about this type of skills mismatch go back to at least the 1970s, when increases in the supply of graduates in the United States seemed to outstrip demand. The literature on such skills mismatch has expanded ever since, not least due to the skills intensive nature of much economic and technological change (Cedefop, 2010). Labour market actors, including governments, companies and workers, need to ensure that occupational requirements are matched through adequate education and training. The extent to which this process is successful is a major factor shaping labour market outcomes, economic growth, productivity and competitiveness (see figure 1 for a graphical representation). If workers are overeducated for the jobs they perform, for example, this means that firms are not fully utilising the productive capacity of their workers, while undereducation means that firms are not operating at their productive frontier by employing less productive workers than they should. Inefficiencies can arise both in the labour market (the demand for and supply of workers/skills) and in the interaction between the labour market and the education and training system. In either case, the resulting skill mismatch will impose costs on individuals, enterprises and society at large. Labour markets around the world continuously demonstrate various types of ‘mismatch’, including mismatch between the number of job seekers and employment opportunities, which is reflected in unemployment. In contrast to unemployment, however, which is generally measured according to international standards, a uniform typology or measurement framework regarding skills mismatch and related issues, such as skills shortages, is lacking (ILO, 2014a and 2014b).
6
Figure 1. Economic context and skills mismatch
Source: ILO (2013).
Skills mismatch is an encompassing term which refers to various types of imbalances between skills offered and skills needed in the world of work. Skills and competencies per se are not measured by the regular statistical programmes of most countries. That is why skill proxies are used, such as qualifications and years of education at the supply side, and occupations at the demand side. Table 1 lists some of the more frequently discussed types of skills mismatch. Each type of mismatch can be measured in several ways, and each measurement method has advantages and disadvantages.1 Mismatch at the individual level can manifest itself as undereducation or overeducation. Although education is often used as a proxy for skills, the two terms have a different meaning. A person qualified as a university professor working as a receptionist is clearly overeducated, but may nevertheless lack the communication skills that are necessary in this job and may therefore also be underskilled. However, contrary to education data, cross-country datasets on skills are rare, and usually limited to numeracy and literacy. In the absence of skills data, discussions of skills mismatch are often informed by surveys of employers’ or
1 For overviews, see Johansen and Gatelli (2012); Quintini (2011); Sparreboom and Powell (2009); Wilson et al. (2014).
7
employees’ perceptions regarding skills mismatch, without necessarily clearly defining ‘skills’.2 Table 1. Frequently discussed types of skills mismatch
Skill shortage (surplus)
Demand (supply) for a particular type of skill exceeds the supply (demand) of people with that skill
Skill gap Type or level of skills is different from that required to adequately perform the job
Vertical mismatch The level of education or qualification is less or more than required Horizontal mismatch The type/field of education or skills is inappropriate for the job Overeducation (undereducation)
Workers have more (less) years of education than the job requires
Overqualification (underqualification)
Workers hold a higher (lower) qualification than the job requires
Skills obsolescence Skills previously used in a job are no longer required and/or skills have deteriorated over time
Source: ILO (2013).
In this context, this brief examines overeducation and undereducation in Europe. Section 2 reviews the empirical literature on this type of skills mismatch, and then focuses on two measures of mismatch between job requirements and qualifications. The analysis highlights patterns of skills mismatch in Europe, identifies country-specific trends as well as differences in skills mismatch risk between age groups and sexes. Section 3 summarizes the main findings and provides some conclusions.
2 In Europe, efforts are undertaken to link the world of work and the world of education and training through the development of the classification of European Skills, Competences, Qualifications and Occupations (ESCO); see https://ec.europa.eu/esco/home.
8
2. Skills mismatch by occupation: Incidence, consequences and measurement
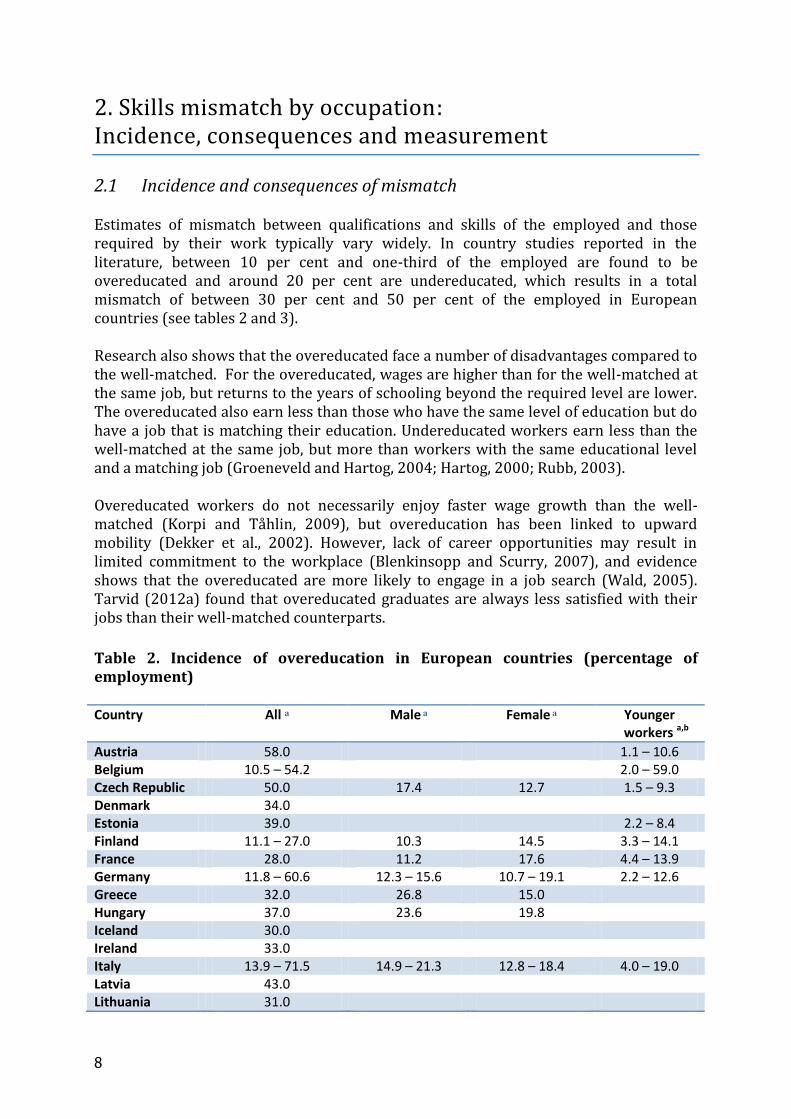
2.1 Incidence and consequences of mismatch Estimates of mismatch between qualifications and skills of the employed and those required by their work typically vary widely. In country studies reported in the literature, between 10 per cent and one-third of the employed are found to be overeducated and around 20 per cent are undereducated, which results in a total mismatch of between 30 per cent and 50 per cent of the employed in European countries (see tables 2 and 3). Research also shows that the overeducated face a number of disadvantages compared to the well-matched. For the overeducated, wages are higher than for the well-matched at the same job, but returns to the years of schooling beyond the required level are lower. The overeducated also earn less than those who have the same level of education but do have a job that is matching their education. Undereducated workers earn less than the well-matched at the same job, but more than workers with the same educational level and a matching job (Groeneveld and Hartog, 2004; Hartog, 2000; Rubb, 2003). Overeducated workers do not necessarily enjoy faster wage growth than the well-matched (Korpi and Tåhlin, 2009), but overeducation has been linked to upward mobility (Dekker et al., 2002). However, lack of career opportunities may result in limited commitment to the workplace (Blenkinsopp and Scurry, 2007), and evidence shows that the overeducated are more likely to engage in a job search (Wald, 2005). Tarvid (2012a) found that overeducated graduates are always less satisfied with their jobs than their well-matched counterparts.
Table 2. Incidence of overeducation in European countries (percentage of employment) Country All a Male a Female a Younger
workers a,b
Austria 58.0 1.1 – 10.6 Belgium 10.5 – 54.2 2.0 – 59.0 Czech Republic 50.0 17.4 12.7 1.5 – 9.3 Denmark 34.0 Estonia 39.0 2.2 – 8.4 Finland 11.1 – 27.0 10.3 14.5 3.3 – 14.1 France 28.0 11.2 17.6 4.4 – 13.9 Germany 11.8 – 60.6 12.3 – 15.6 10.7 – 19.1 2.2 – 12.6 Greece 32.0 26.8 15.0 Hungary 37.0 23.6 19.8 Iceland 30.0 Ireland 33.0 Italy 13.9 – 71.5 14.9 – 21.3 12.8 – 18.4 4.0 – 19.0 Latvia 43.0 Lithuania 31.0

9
Luxembourg 27.0 Netherlands 11.2 – 39.0 8.7 – 11.5 12.2 – 13.6 2.9 – 41.7 Norway 16.6 – 34.0 2.5 – 20.4 Poland 13.9 – 29.0 Portugal 12.6 – 33.0 16.1 14.8 3.4 – 6.5 Romania 25.0 Slovakia 49.0 Slovenia 36.0 Spain 13.8 – 37.2 23.2 24.0 6.5 – 24.8 Sweden 27.0 Switzerland 13.4-14.9 13.3 – 15.0 13.5 – 14.7 UK 13.0 – 36.8 19.1 – 25.0 20.5 – 27.0 13.7 – 53.0
Sources: Baert et al. (2013); Barone and Ortiz (2010); Bauer (2002); Blázquez and Budría (2012); Brynin and Longhi (2009); Büchel and Battu (2003); Büchel and Van Ham (2003); Budría (2011); Cainarca and Sgobbi (2012); Chevalier (2003); Croce and Ghignoni (2012); Cutillo and Di Pietro (2006); Dekker et al. (2002); Frei and Sousa-Poza (2012); Ghignoni and Verashchagina (2013); Groot and Van den Brink (2000); Hartog (2000); Jauhiainen (2011); Jensen et al. (2010); Karakaya et al. (2007); Kiersztyn (2013); Mavromaras et al. (2010); McGuinness and Bennett (2007); Murillo et al. (2012); Ortiz and Kucel (2008); Ramos and Sanromá (2013); Sánchez-Sánchez and McGuiness (2011); Støren and Wiers-Jenssen (2010); Sutherland (2012); Verhaest and Omey (2010; 2012); Wirz and Atukeren (2005). Notes: a The incidence of overeducation for all, male, female and younger workers for the same country may be based on different sources. b Defined as aged below 31.
Table 3. Incidence of undereducation in European countries (percentage of employment) Country All a Male a Female a Younger
workers a,b
Austria 8.4 – 30.6 Belgium 25.8 – 32.4 5.4 – 25.5 Czech Republic 17.8 25.6 11.1 – 17.8 Estonia 18.4 – 33.1 Finland 39.4 37.9 10.9 – 26.3 France 44.9 41.4 14.4 – 15.4 Germany 12.1 10.4 – 18.8 15.6 – 21.5 6.3 – 25.9 Greece 21.8 25.6 Hungary 19.9 24.9 Italy 17.1 17.7 – 24.7 16.3 – 32.8 11.7 – 22.5 Netherlands 12.0 3.8 – 16.7 2.1 – 14.3 5.3 – 25.2 Norway 11.6 – 29.1 Portugal 17.0 – 38.0 16.6 18.9 22.6 – 50.8 Spain 11.0 – 25.6 33.3 27.8 7.1 – 23.8 Switzerland 1.9 2.0 1.8 UK 17.0 40.6 43.7 5.5 – 26.1 Sources: Bauer (2002); Cainarca and Sgobbi (2012); Frei and Sousa-Poza (2012); Ghignoni and Verashchagina (2013); Groot and Van den Brink (2000); Hartog (2000); Karakaya et al. (2007); Murillo et al. (2012); Sánchez-Sánchez and McGuiness (2011); Verhaest and Omey (2012). Notes: a The incidence of undereducation for all, male, female and younger workers for the same country may be based on different sources. b Defined as aged below 31.
10
2.2 Measurement methods The concept of overeducation (undereducation) means having more (less) education than required by the job. The measurement of this concept has proven to be quite controversial. In particular, four different approaches exist in the literature, which are described in table 4. Each of them has its own advantages and disadvantages, and there is no agreement on a single ‘correct’ measure. In this brief, two of these approaches are used: a normative measure based on the International Standard Classification of Occupations (ISCO-88) alongside a statistical measure (which, in a different way, also uses ISCO). The normative measure starts from the division of major occupational groups (first-digit ISCO levels) into three groups and assigns a level of education to each group in accordance with the International Standard Classification of Education (ISCED-97). In particular, the first three major groups are assigned ISCED levels 5 and 6; major groups 4 to 8 are assigned ISCED-levels 3 and 4; and major group 9 ISCED levels 1 and 2 (see also ILO, 1990 and ILO, 2012). Workers in a particular group who have the assigned level of education are considered well-matched. Those who have a higher (lower) level of education are considered overeducated (undereducated). For instance, a university graduate working as a clerk is overeducated, while a secondary school graduate working as an engineer is undereducated. An advantage of the normative measure is that workers in a given occupation and with a given level of education are consistently categorized over time as undereducated, overeducated or well-matched. A possible disadvantage of this measure is that it does not take the actual distribution of educational attainment into account. In high-attainment countries, workers in all jobs are better educated and all other things equal the proportion of overeducated is therefore likely to be higher as well. Another disadvantage of this approach concerns the broad range of occupations in major groups 4 to 8. These 5 groups include occupations that require completion of extensive vocational education and training, but also those that require a short period of training plus basic literacy and numeracy (ILO, 2014b). The statistical measure is constructed based on the years of full-time education of workers and their occupation code. For each 2-digit ISCO group in each country and year, the mean number of years of education of workers as well as its standard deviation is measured. Then the over- (under-) educated are respondents who have education years above (below) the mean level by one standard deviation. In other words, it is assumed that the calculated mean numbers of years for groups of occupations reflects job requirements. An advantage of this method is that there is less heterogeneity within groups of jobs compared with the three groups of the normative measure. Furthermore, if the mean number of years of education of workers in a certain group of occupations rises over time (in comparison with other groups), this may indeed reflect changes in the requirements of these jobs. In addition, the statistical measure is less sensitive to the average level of educational attainment in a country, as increases in educational attainment will result in higher mean levels of education for all workers. But this is also a disadvantage in the sense that mean levels of education may or may not be driven by job requirements. For example, in countries with very low levels of educational attainment, the mean level of education is a poor indicator of job requirements, and the statistical method may be inappropriate (Sparreboom and Nübler, 2013).

11
Table 4. Measurement of overeducation Name Idea Advantages Disadvantages Examples of
Studies
Normative Use a pre-determined mapping between the job and the required education level a
Relatively easily measurable
Objective
Assumes constant mappings over all jobs of a given occupation
A thorough mapping is costly to create and update
Chevalier (2003) Sutherland (2012) Tarvid (2012b)
Statistical The overeducated are those with education level higher by some ad-hoc value than the mean or mode of the sample within a given occupation b
Relatively easily measurable
Objective No updating
needed: always corresponds to the sample
Assumes constant mappings over all jobs of a given occupation
Sensitive to cohort effects
Results depend on the level of aggregation of occupations
Fernández and Ortega (2008) Jauhiainen (2011) Ortiz and Kucel (2008)
Self-assessment
The respondents are asked about their perceptions of the extent their education or skills are used in their job c
Always up-to-date
Corresponds with requirements in the individual firm
Subjective bias: respondents may overstate job requirements, inflate their status, or reproduce actual hiring standards
Di Pietro (2002) Frenette (2004) Støren and Wiers-Jenssen (2010) Wirz and Atukeren (2005)
Income-ratio Overeducation is a continuous variable measured by comparing actual and potential income d
Reflects that one of the goals of investment in education is maximising income
An indirect measure, can be influenced by many other factors
Jensen et al. (2010) Guironnet and Peypoch (2007)
Source: ILO elaboration; Hartog (2000); Quintini (2011). Notes: a In the United States, the Dictionary of Occupational Titles is often used; alternatively, ISCO-based measures are employed. b Usually, the ad-hoc value is one standard deviation, but studies also use 80th percentile of the distribution as a cut-off value. c These measures are based not only on a single question about perceived overeducation or skill underutilisation, but also on indices comprised of several such questions (see, e.g., Barone and Ortiz, 2010). d This approach connects overeducation to another labour market failure - underpayment.
12
The data used in this paper to illustrate these two approaches are from the European Social Survey (ESS), rounds 1 through 6 (Norwegian Social Science Data Services, 2002; 2004; 2006; 2008; 2010 and 2012). The ESS is a biennial survey covering over 30 countries, but country coverage differs by round: out of 35 countries for which data are available, only 15 appear in all five rounds.3,4
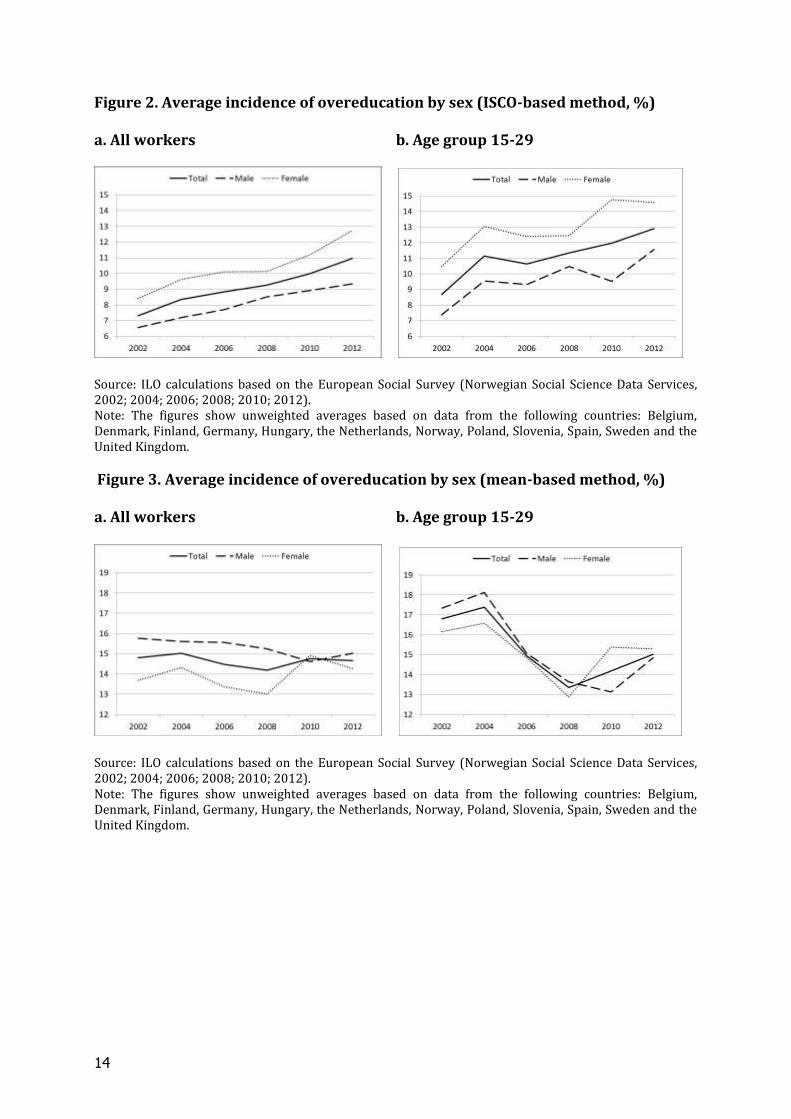
2.3 Incidence and dynamics of mismatch by occupation Countries differ markedly in mismatch patterns (see annex tables A1-A8). The incidence of overeducation according to the normative measure ranged from 10 to 20 per cent of all workers in 2012 in most of the 24 countries for which data are available in this year. In four countries the incidence was less than six per cent (Netherlands, Poland, Portugal and Switzerland), while in two countries this incidence exceeded 20 per cent (Cyprus and Russia). The incidence of undereducation according to the normative measure is higher, ranging from 15 to 25 per cent in most countries in 2012. In nine countries the incidence of undereducation exceeded 25 per cent and in one (Portugal) more than half of workers are undereducated. Total mismatch according to the normative measure (25 to 45 per cent) thus appears broadly in line with the findings from the literature that were discussed before (30 to 50 per cent). The range in overeducation and undereducation according to the statistical measure is smaller. The lowest incidence of overeducation according to this measure was 10.5 per cent in Kosovo, and the highest incidence was 20.1 per cent in Slovakia. Undereducation according to the statistical measure ranged from 8 per cent in Slovakia to 15.6 per cent in the Netherlands. Considering stable country-specific trends in skills mismatch, we find that in close to half of the countries with sufficient data to assess trends overeducation increased on at least one measure across all workers (13 out of 25 countries; table 5). Overeducation increased on both measures in Cyprus and Sweden. Only four countries experienced a downward trend in overeducation (Ireland, Israel, Poland and Slovenia). Undereducation decreased on at least one measure in 14 out of 25 countries, and decreased on both measures in Bulgaria, Israel, Poland and Slovakia. Undereducation increased on at least one measure in five countries. In a sample of countries with sufficient data to assess cross-national trends, we find that the average incidence of overeducation is increasing from 2002 to 2012 according to the normative measure (figures 2a and 2b). According to this measure the increase in overeducation was 3.6 percentage points during the whole period. Overeducation according to the mean-based method is more stable over time, at least across all workers (figures 3a and 3b). However, the breakdown by sex shows a tendency of overeducation according to the mean-based method to rise for women and to decline for men. In addition, according to both measures overeducation for women increased
3 ISCO sub-major groups with less than five observations in a particular country and round of the survey have been excluded from the analysis. 4 Rounds 1 to 5 of the European Social Survey were coded according to ISCO-88. An updated classification was adopted in December 2007 and is known as ISCO-08 (ILO, 2012). Data from Round 6 of the European Social Survey were coded according to ISCO-08, which may hamper the consistent use of these data over time in the contex of skills mismatch.

13
strongly at the height of the global economic crisis (2008-2010), pointing at the need for female workers to take lower level jobs at times of intense job competition (Cedefop, 2010; ILO, 2013). Table 5. Country-level trends in mismatch incidence, by age group Overeducation Undereducation 15-29 30+ 15+ 15-29 30+ 15+ ↑ ↓ ↑ ↓ ↑ ↓ ↑ ↓ ↑ ↓ ↑ ↓
Austria a
N N IN
Belgium N N N N N
Bulgaria I N I I IN IN
Cyprus IN IN IN I I
Czech Republic IN I IN
Denmark IN N N N
Estonia I I I
Finland I I I IN I I
France b
N N IN IN
Germany N I I
Hungary N
Ireland N I I I
Israel I IN IN I IN IN
Netherlands I I N I N I N I
Norway I IN
Poland I I IN IN
Portugal I N N IN N N
Russia
Slovakia N I N N N IN IN
Slovenia I I I I N I
Spain N N
Sweden N I IN I I
Switzerland N N N N
UK I I I
Ukraine c
N N I N
Source: ILO calculations based on the European Social Survey (Norwegian Social Science Data Services, 2002; 2004; 2006; 2008; 2010; 2012). Note: ‘I’ shows the existence of a trend in mismatch measured using the ISCO criterion, and ‘N’ using the mean criterion; unless noted below, trends based on the last three rounds are shown. a Data available only in Rounds 1-4. b Data available only in Rounds 1-5. c Data available only in Rounds 2-5.
14
Figure 2. Average incidence of overeducation by sex (ISCO-based method, %)
a. All workers b. Age group 15-29
Source: ILO calculations based on the European Social Survey (Norwegian Social Science Data Services, 2002; 2004; 2006; 2008; 2010; 2012). Note: The figures show unweighted averages based on data from the following countries: Belgium, Denmark, Finland, Germany, Hungary, the Netherlands, Norway, Poland, Slovenia, Spain, Sweden and the United Kingdom.
Figure 3. Average incidence of overeducation by sex (mean-based method, %)
a. All workers b. Age group 15-29
Source: ILO calculations based on the European Social Survey (Norwegian Social Science Data Services, 2002; 2004; 2006; 2008; 2010; 2012). Note: The figures show unweighted averages based on data from the following countries: Belgium, Denmark, Finland, Germany, Hungary, the Netherlands, Norway, Poland, Slovenia, Spain, Sweden and the United Kingdom.
15
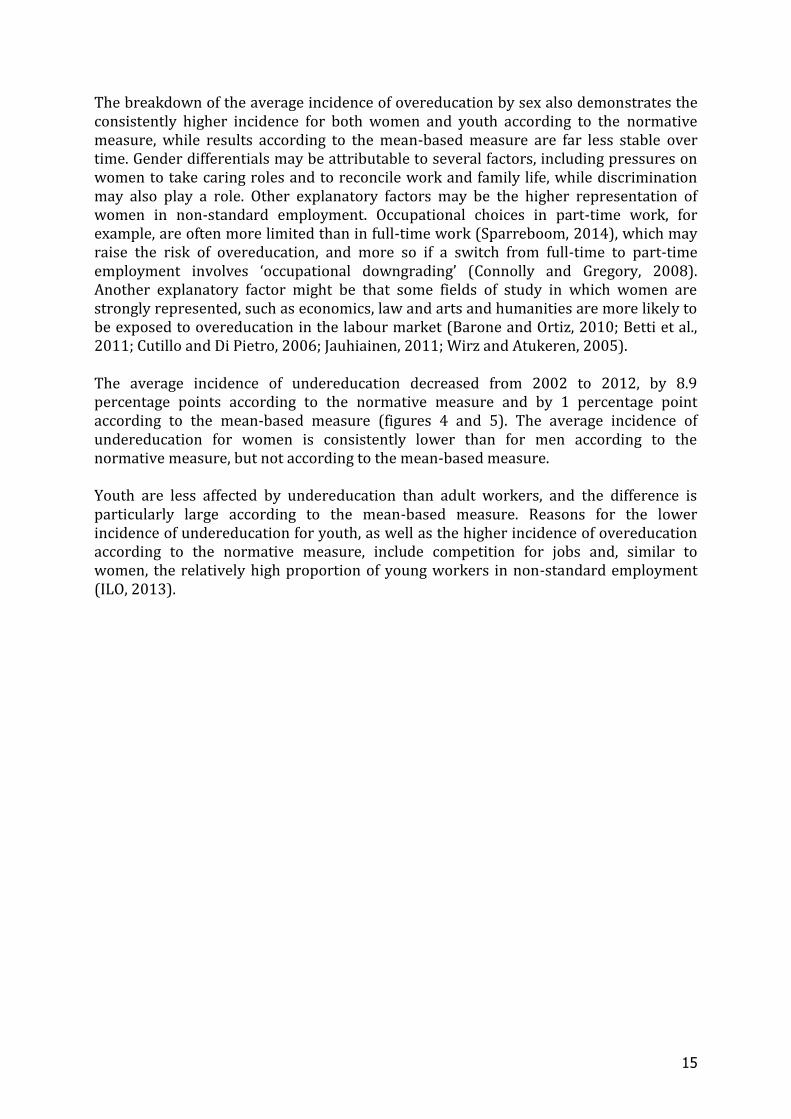
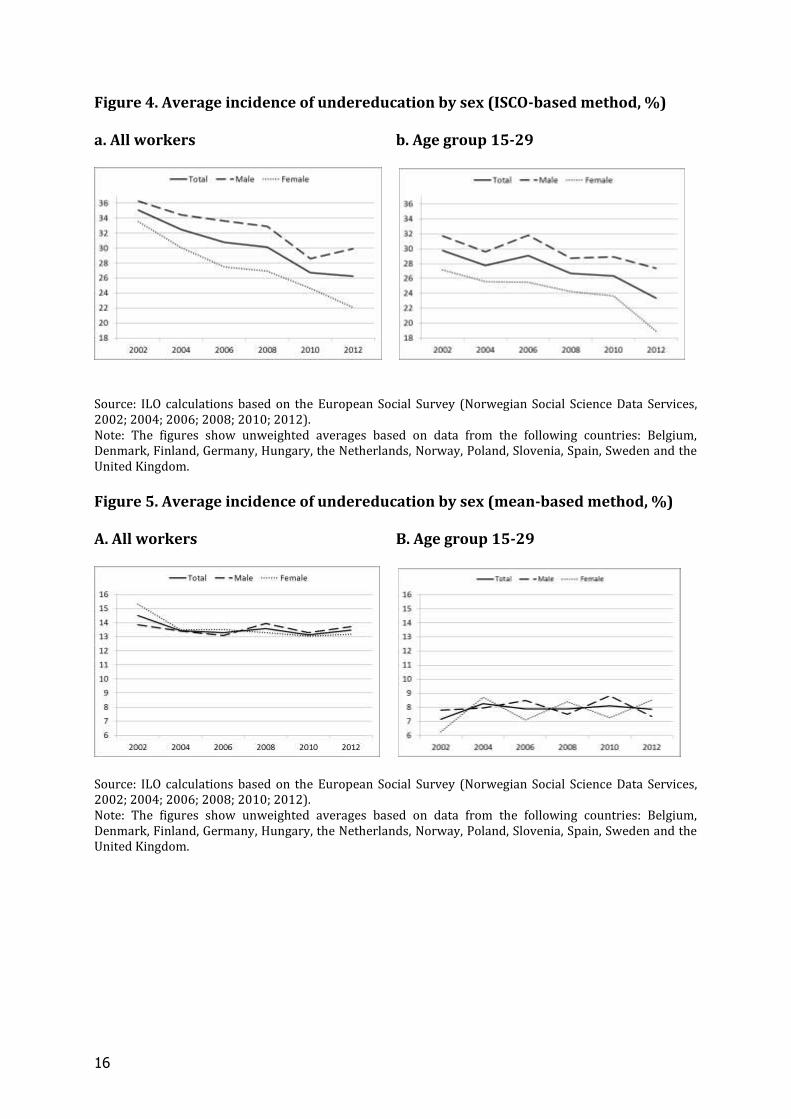
The breakdown of the average incidence of overeducation by sex also demonstrates the consistently higher incidence for both women and youth according to the normative measure, while results according to the mean-based measure are far less stable over time. Gender differentials may be attributable to several factors, including pressures on women to take caring roles and to reconcile work and family life, while discrimination may also play a role. Other explanatory factors may be the higher representation of women in non-standard employment. Occupational choices in part-time work, for example, are often more limited than in full-time work (Sparreboom, 2014), which may raise the risk of overeducation, and more so if a switch from full-time to part-time employment involves ‘occupational downgrading’ (Connolly and Gregory, 2008). Another explanatory factor might be that some fields of study in which women are strongly represented, such as economics, law and arts and humanities are more likely to be exposed to overeducation in the labour market (Barone and Ortiz, 2010; Betti et al., 2011; Cutillo and Di Pietro, 2006; Jauhiainen, 2011; Wirz and Atukeren, 2005). The average incidence of undereducation decreased from 2002 to 2012, by 8.9 percentage points according to the normative measure and by 1 percentage point according to the mean-based measure (figures 4 and 5). The average incidence of undereducation for women is consistently lower than for men according to the normative measure, but not according to the mean-based measure. Youth are less affected by undereducation than adult workers, and the difference is particularly large according to the mean-based measure. Reasons for the lower incidence of undereducation for youth, as well as the higher incidence of overeducation according to the normative measure, include competition for jobs and, similar to women, the relatively high proportion of young workers in non-standard employment (ILO, 2013).
16
Figure 4. Average incidence of undereducation by sex (ISCO-based method, %)
a. All workers b. Age group 15-29
Source: ILO calculations based on the European Social Survey (Norwegian Social Science Data Services, 2002; 2004; 2006; 2008; 2010; 2012). Note: The figures show unweighted averages based on data from the following countries: Belgium, Denmark, Finland, Germany, Hungary, the Netherlands, Norway, Poland, Slovenia, Spain, Sweden and the United Kingdom.
Figure 5. Average incidence of undereducation by sex (mean-based method, %)
A. All workers B. Age group 15-29
Source: ILO calculations based on the European Social Survey (Norwegian Social Science Data Services, 2002; 2004; 2006; 2008; 2010; 2012). Note: The figures show unweighted averages based on data from the following countries: Belgium, Denmark, Finland, Germany, Hungary, the Netherlands, Norway, Poland, Slovenia, Spain, Sweden and the United Kingdom.

17
3. Conclusions Skills mismatch has been linked to incomplete and asymmetric information, transaction costs and unresponsive education and training systems. Efficient job placement services and training opportunities beyond initial schooling should therefore be priorities for policymakers, and more so if job openings are scarce. The same is true for social dialogue to strengthen linkages between education and training systems and the world of work. Such dialogue should be informed by solid labour market information, but particularly in the area of skills mismatch data are patchy (Cedefop, 2010) and an agreed measurement framework is lacking. In this brief an attempt was made to identify broad trends in a particular type of skills mismatch – overeducation and undereducation – in European countries. It was shown that skills mismatch patterns depend strongly on the measure of mismatch that is adopted, but also that overeducation is increasing and undereducation is decreasing on at least one measure in at least half of the countries for which such trends can be assessed. On average, the level of skills mismatch is considerable in Europe according to both the normative and the statistical measure that were adopted in this brief, and shows large variations by age group and sex. According to the normative measure, the incidence of overeducation is consistently higher for women and youth. The analysis at an aggregate level leaves many questions unanswered. For example, it would be informative to establish which occupational groups are most affected by skills mismatch (as captured by various measures), which groups drive national trends, and how these trends relate to structural changes in labour markets such as the declining share of jobs in the middle of the occupational/skill range (‘job polarization’) in many countries. More detailed empirical investigations, as well as replication of the results using other data sources, would help to assess whether mismatch is likely to be temporal or structural, and which policy interventions are needed.
18
References Baert, S.; Cockx, B.; Verhaest, D. 2013. ‘Overeducation at the start of the career: Stepping stone or trap?’, Labour Economics, Vol. 25, pp. 123-140. Barone, C.; Ortiz, L. 2010. ‘Overeducation among European university graduates: A comparative analysis of its incidence and the importance of higher education differentiation’, Higher Education, Vol. 61, No. 3, pp. 325–337. Bauer, T.K. 2002. ‘Educational mismatch and wages: A panel analysis’, Economics of Education Review, Vol. 21, No. 3, pp. 221–229. Betti, G.; D’Agostino, A.; Neri, L. 2011. ‘Educational mismatch of graduates: A multidimensional and fuzzy indicator’, Social Indicators Research, Vol. 103, No. 3, pp. 465–480. Blázquez, M.; Budría, S. 2012. ‘Overeducation dynamics and personality’, Education Economics, Vol. 20, No. 3, pp. 260-283. Blenkinsopp, J.; Scurry, T. 2007.’‘Hey GRINGO!’: The HR challenge of graduates in non-graduate occupations’, Personnel Review, Vol. 36, No. 4, pp. 623–637. Brynin, M.; Longhi, S. 2009. ‘Overqualification: Major or minor mismatch?’, Economics of Education Review, Vol. 28, No. 1, pp. 114–121. Büchel, F.; Battu, H. 2003. ‘The theory of differential overqualification: Does it work?’, Scottish Journal of Political Economy, Vol. 50, No. 1, pp. 1–16. Büchel, F.; Van Ham, M. 2003. ‘Overeducation, regional labor markets, and spatial flexibility’, Journal of Urban Economics, Vol. 53, No. 3, pp. 482–493. Budría, S. 2011. ‘Are educational mismatches responsible for the ‘inequality increasing effect’ of education?’, Social Indicators Research, Vol. 102, No. 3, pp. 409–437. Cainarca, G.; Sgobbi, F. 2012. ‘The return to education and skills in Italy’, International Journal of Manpower, Vol. 33, No. 2, pp. 187–205. Cedefop. 2010. ‘Skill mismatch in Europe’, Briefing Note (Thessaloniki). Available at: http://www.cedefop.europa.eu/EN/Files/9023_en.pdf [accessed 28 January 2014]. Chevalier, A. 2003. ‘Measuring over-education’, Economica, Vol. 70, No. 279, pp. 509–531. Connolly, S.; Gregory, M. 2009. ‘The part-time pay penalty: earnings trajectories of British Women’, Oxford Economic Papers, Vol. 61, Supplement 1, i76-i97.
19
Croce, G.; Ghignoni, E. 2012. ‘Demand and Supply of Skilled Labour and Overeducation in Europe: A Country-level Analysis’, Comparative Economic Studies, Vol. 54, No. 2, pp. 413-439. Cutillo, A.; Di Pietro, G. 2006. ‘The effects of overeducation on wages in Italy: A bivariate selectivity approach’, International Journal of Manpower, Vol. 27, No. 2, pp. 143–168. Dekker, R.; De Grip, A.; Heijke, H. 2002. ‘The effects of training and overeducation on career mobility in a segmented labour market’, International Journal of Manpower, Vol. 23, No. 2, pp. 106–125. Di Pietro, G. 2002. ‘Technological change, labor markets, and ‘low-skill, low-technology traps’’, Technological Forecasting and Social Change, Vol. 69, No. 9, pp. 885-895. ECB. 2012. Euro area labour markets and the crisis. Structural issues report, European Central Bank (Frankfurt am Main). Fernández, C.; Ortega, C. 2008. ‘Labor market assimilation of immigrants in Spain: employment at the expense of bad job-matches?’, Spanish Economic Review, Vol. 10, No. 2, pp. 83-107. Frei, C.; Sousa-Poza, A. 2012. ‘Overqualification: permanent or transitory?’, Applied Economics, Vol. 44, No. 14, pp. 1834-1847. Frenette, M. 2004. ‘The overqualified Canadian graduate: The role of the academic program in the incidence, persistence, and economic returns to overqualification’, Economics of Education Review, Vol. 23, No. 1, pp. 29–45. Ghignoni, E.; Verashchagina, A. 2013. ‘Educational qualifications mismatch in Europe. Is it demand or supply driven?’, Journal of Comparative Economics (forthcoming). Groeneveld, S.; Hartog, J. 2004. ‘Overeducation, wages and promotions within the firm’, Labour Economics, Vol. 11, No. 6, pp. 701–714. Groot, W.; Van den Brink, H.M. 2000. ‘Skill mismatches in the Dutch labor market’, International Journal of Manpower, Vol. 21, No. 8, pp. 584–595. Guironnet, J.-P.; Peypoch, N. 2007. ‘Human capital allocation and overeducation: A measure of French productivity (1987, 1999)’, Economic Modelling, Vol. 24, No. 3, pp. 398–410. Hartog, J. 2000. ‘Over-education and earnings: Where are we, where should we go?’, Economics of Education Review, Vol. 19, No. 2, pp. 131–147. ILO. 1990. ISCO-88. International Standard Classification of Occupations, International Labour Office (Geneva).
20
ILO. 2012. ISCO-08. Volume 1. International Standard Classification of Occupations. Structure, group definitions and correspondence tables, International Labour Office (Geneva). ILO. 2013. Global Employment Trends for Youth 2013. A generation at risk, International Labour Office (Geneva). ILO. 2014a. Report III. Report of the Conference, 19th International Conference of Labour Statisticians, Geneva, 2-11 October 2013. ILO. 2014b. Room Document 1. The case to update or revise the International Classification of Occupations, 2008 (ISCO-08), 19th International Conference of Labour Statisticians, Geneva, 2-11 October 2013. Jauhiainen, S. 2011. ‘Overeducation in the Finnish regional labour markets’, Papers in Regional Science, Vol. 90, No. 3, pp. 573–588. Jensen, U.; Gartner, H.; Rässler, S. 2010. ‘Estimating German overqualification with stochastic earnings frontiers’, AStA Advances in Statistical Analysis, Vol. 94, No. 1, pp. 33–51. Johansen, J.; Gatelli, D. 2012. Measuring mismatch in ETF partner countries: A methodological note, European Training Foundation (Turin). Karakaya, G.; Plasman, R.; Rycx, F. 2007. ‘Overeducation on the Belgian labour market: Evaluation and analysis of the explanatory factors through two types of approaches’, Compare: A Journal of Comparative and International Education, Vol. 37, No. 4, pp. 513–532. Kiersztyn, A. 2013. ‘Stuck in a mismatch? The persistence of overeducation during twenty years of the post-communist transition in Poland’, Economics of Education Review, Vol. 32, pp. 78-91. Korpi, T.; Tåhlin, M. 2009. ‘Educational mismatch, wages, and wage growth: Overeducation in Sweden, 1974–2000’, Labour Economics, Vol. 16, No. 2, pp. 183–193. Mavromaras, K.; McGuinness, S.; O'Leary, N.; Sloane, P.; Fok, Y. K. 2010. ‘The Problem of Overskilling in Australia and Britain’, The Manchester School, Vol. 78, No. 3, pp. 219-241. McGuinness, S.; Bennett, J. 2007. ‘Overeducation in the graduate labour market: A quantile regression approach’, Economics of Education Review, Vol. 26, No. 5, pp. 521–531. Murillo, I.P.; Rahona-López, M.; Del Mar Salinas-Jiménez, M. 2012. ‘Effects of educational mismatch on private returns to education: An analysis of the Spanish case (1995–2006)’, Journal of Policy Modeling, Vol. 34, No. 5, pp. 646–659. Norwegian Social Science Data Services. 2002. European Social Survey Round 1 Data. Data File Edition 6.3.
21
Norwegian Social Science Data Services. 2004. European Social Survey Round 2 Data. Data File Edition 3.3. Norwegian Social Science Data Services. 2006. European Social Survey Round 3 Data. Data File Edition 3.4. Norwegian Social Science Data Services. 2008. European Social Survey Round 4 Data. Data File Edition 4.1. Norwegian Social Science Data Services. 2010. European Social Survey Round 5 Data. Data File Edition 3.0. Norwegian Social Science Data Services. 2012. European Social Survey Round 6 Data. Data File Edition 1.1. Ortiz, L.; Kucel, A. 2008. ‘Do fields of study matter for over-education?: The cases of Spain and Germany’, International Journal of Comparative Sociology, Vol. 49, Nos. 4–5, pp. 305–327. Quintini, G. 2011. ‘Over-Qualified or Under-Skilled: A Review of Existing Literature’, OECD Social, Employment and Migration Working Papers, No. 121(Paris). Ramos, R.; Sanromá, E. 2013. ‘Overeducation and Local Labour Markets in Spain’, Tijdschrift voor economische en sociale geografie, Vol. 104, No. 3, pp. 278-291. Rubb, S. 2003. ‘Overeducation in the labor market: A comment and re-analysis of a meta-analysis’, Economics of Education Review, Vol. 22, No. 6, pp. 621–629. Sánchez-Sánchez, N.; McGuiness, S. 2011. ‘Decomposing the Impacts of Overeducation and Overskilling on Earnings and Job Satisfaction: An Analysis Using REFLEX data’, Working Paper, No. 393, The Economic and Social Research Institute. Sparreboom, T. 2014. ‘Gender equality, part-time work and segregation’, International Labour Review, Vol. 153, No. 2 (forthcoming). Sparreboom, T.; Nübler, I. 2013. ‘Productive transformation, employment and education in Tanzania’, paper presented at the 2013 UNU-WIDER Development Conference on Learning to Compete: Industrial Development and Policy in Africa, 24-25 June, Helsinki. Sparreboom, T.; Powell, M. 2009. ‘Labour Market Information and Analysis for Skills Development’, ILO Employment Working Paper, No. 27, 2009 (Geneva). Støren, L.A.; Wiers-Jenssen, J. 2010. ‘Foreign diploma versus immigrant background: Determinants of labour market success or failure?’, Journal of Studies in International Education, Vol. 14, No. 1, pp. 29–49. Sutherland, J. 2012. ‘Qualifications mismatch and skills mismatch’, in Education + Training, Vol. 54, No. 7, pp. 619–632.
22
Tarvid, A. 2012a. ‘Job satisfaction determinants of tertiary-educated employees in European countries’, ATINER’s Conference Paper Series, No. ECO2012-0257, Athens Institute for Education and Research (Athens). Tarvid, A. 2012b. ‘Effects of the Field of Higher Education on the Prevalence of Over-education in European Countries’, in Kesner, J. E. (ed.), Education: Evaluation, Reform and Policy (pp. 167-184), Athens Institute for Education and Research (Athens). Verhaest, D.; Omey, E. 2010. ‘The determinants of overeducation: Different measures, different outcomes?’, International Journal of Manpower, Vol. 31, No. 6, pp. 608–625. Verhaest, D.; Omey, E. 2012. ‘Overeducation, Undereducation and Earnings: Further Evidence on the Importance of Ability and Measurement Error Bias’, Journal of Labor Research, Vol. 33, No. 1, pp. 76-90. Wald, S. 2005. ‘The impact of overqualification on job search’, International Journal of Manpower, Vol. 26, No. 2, pp. 140–156. Wilson, R.A.; Tarjáni, H.; Rihova, H. 2014. A Practical Guide on Anticipation and Matching of Skills at Sector Level, Cedefop, European Training Foundation, Warwick Institute for Employment Research and International Labour Office, forthcoming. Wirz, A.; Atukeren, E. 2005. ‘An analysis of perceived overqualification in the Swiss labor market’, Economics Bulletin, Vol. 9, No. 2, pp. 1–10.
23
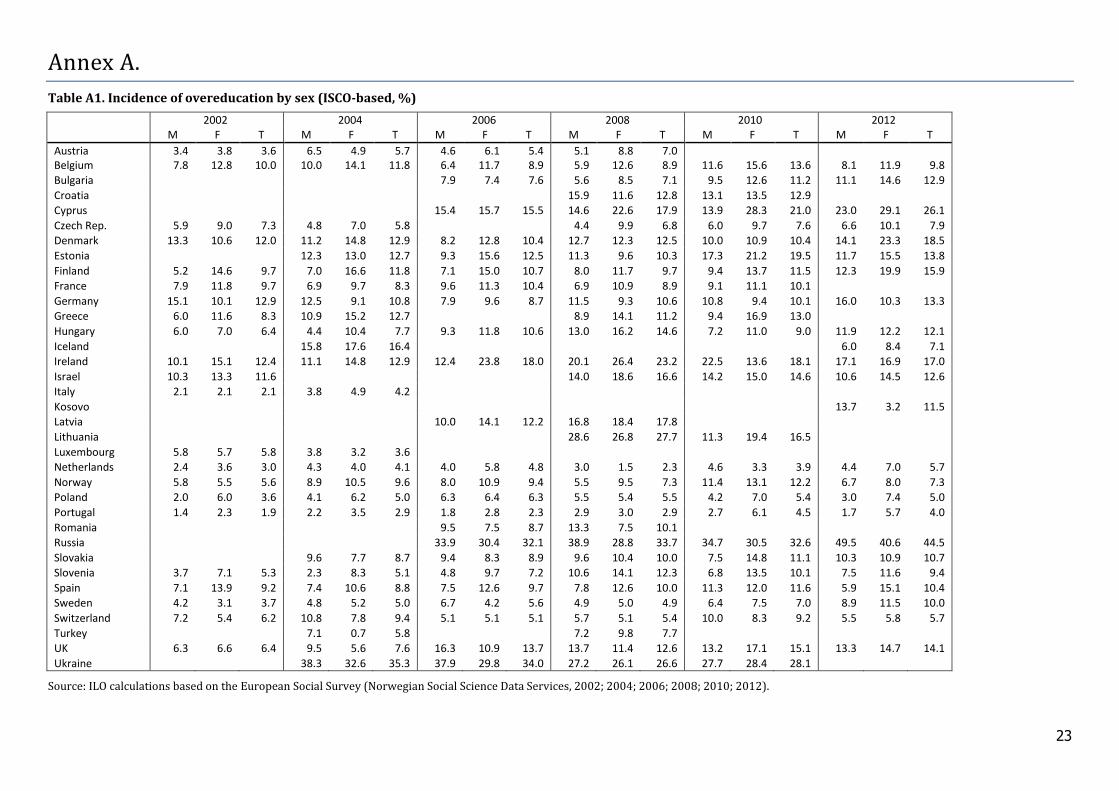
Annex A.
Table A1. Incidence of overeducation by sex (ISCO-based, %)
2002 2004 2006 2008 2010 2012 M F T M F T M F T M F T M F T M F T
Austria 3.4 3.8 3.6 6.5 4.9 5.7 4.6 6.1 5.4 5.1 8.8 7.0
Belgium 7.8 12.8 10.0 10.0 14.1 11.8 6.4 11.7 8.9 5.9 12.6 8.9 11.6 15.6 13.6 8.1 11.9 9.8
Bulgaria
7.9 7.4 7.6 5.6 8.5 7.1 9.5 12.6 11.2 11.1 14.6 12.9
Croatia
15.9 11.6 12.8 13.1 13.5 12.9
Cyprus
15.4 15.7 15.5 14.6 22.6 17.9 13.9 28.3 21.0 23.0 29.1 26.1
Czech Rep. 5.9 9.0 7.3 4.8 7.0 5.8
4.4 9.9 6.8 6.0 9.7 7.6 6.6 10.1 7.9
Denmark 13.3 10.6 12.0 11.2 14.8 12.9 8.2 12.8 10.4 12.7 12.3 12.5 10.0 10.9 10.4 14.1 23.3 18.5
Estonia
12.3 13.0 12.7 9.3 15.6 12.5 11.3 9.6 10.3 17.3 21.2 19.5 11.7 15.5 13.8
Finland 5.2 14.6 9.7 7.0 16.6 11.8 7.1 15.0 10.7 8.0 11.7 9.7 9.4 13.7 11.5 12.3 19.9 15.9
France 7.9 11.8 9.7 6.9 9.7 8.3 9.6 11.3 10.4 6.9 10.9 8.9 9.1 11.1 10.1
Germany 15.1 10.1 12.9 12.5 9.1 10.8 7.9 9.6 8.7 11.5 9.3 10.6 10.8 9.4 10.1 16.0 10.3 13.3
Greece 6.0 11.6 8.3 10.9 15.2 12.7
8.9 14.1 11.2 9.4 16.9 13.0
Hungary 6.0 7.0 6.4 4.4 10.4 7.7 9.3 11.8 10.6 13.0 16.2 14.6 7.2 11.0 9.0 11.9 12.2 12.1
Iceland
15.8 17.6 16.4
6.0 8.4 7.1
Ireland 10.1 15.1 12.4 11.1 14.8 12.9 12.4 23.8 18.0 20.1 26.4 23.2 22.5 13.6 18.1 17.1 16.9 17.0
Israel 10.3 13.3 11.6
14.0 18.6 16.6 14.2 15.0 14.6 10.6 14.5 12.6
Italy 2.1 2.1 2.1 3.8 4.9 4.2
Kosovo
13.7 3.2 11.5
Latvia
10.0 14.1 12.2 16.8 18.4 17.8
Lithuania
28.6 26.8 27.7 11.3 19.4 16.5
Luxembourg 5.8 5.7 5.8 3.8 3.2 3.6
Netherlands 2.4 3.6 3.0 4.3 4.0 4.1 4.0 5.8 4.8 3.0 1.5 2.3 4.6 3.3 3.9 4.4 7.0 5.7
Norway 5.8 5.5 5.6 8.9 10.5 9.6 8.0 10.9 9.4 5.5 9.5 7.3 11.4 13.1 12.2 6.7 8.0 7.3
Poland 2.0 6.0 3.6 4.1 6.2 5.0 6.3 6.4 6.3 5.5 5.4 5.5 4.2 7.0 5.4 3.0 7.4 5.0
Portugal 1.4 2.3 1.9 2.2 3.5 2.9 1.8 2.8 2.3 2.9 3.0 2.9 2.7 6.1 4.5 1.7 5.7 4.0
Romania
9.5 7.5 8.7 13.3 7.5 10.1
Russia
33.9 30.4 32.1 38.9 28.8 33.7 34.7 30.5 32.6 49.5 40.6 44.5
Slovakia
9.6 7.7 8.7 9.4 8.3 8.9 9.6 10.4 10.0 7.5 14.8 11.1 10.3 10.9 10.7
Slovenia 3.7 7.1 5.3 2.3 8.3 5.1 4.8 9.7 7.2 10.6 14.1 12.3 6.8 13.5 10.1 7.5 11.6 9.4
Spain 7.1 13.9 9.2 7.4 10.6 8.8 7.5 12.6 9.7 7.8 12.6 10.0 11.3 12.0 11.6 5.9 15.1 10.4
Sweden 4.2 3.1 3.7 4.8 5.2 5.0 6.7 4.2 5.6 4.9 5.0 4.9 6.4 7.5 7.0 8.9 11.5 10.0
Switzerland 7.2 5.4 6.2 10.8 7.8 9.4 5.1 5.1 5.1 5.7 5.1 5.4 10.0 8.3 9.2 5.5 5.8 5.7
Turkey
7.1 0.7 5.8
7.2 9.8 7.7
UK 6.3 6.6 6.4 9.5 5.6 7.6 16.3 10.9 13.7 13.7 11.4 12.6 13.2 17.1 15.1 13.3 14.7 14.1
Ukraine 38.3 32.6 35.3 37.9 29.8 34.0 27.2 26.1 26.6 27.7 28.4 28.1
Source: ILO calculations based on the European Social Survey (Norwegian Social Science Data Services, 2002; 2004; 2006; 2008; 2010; 2012).
24
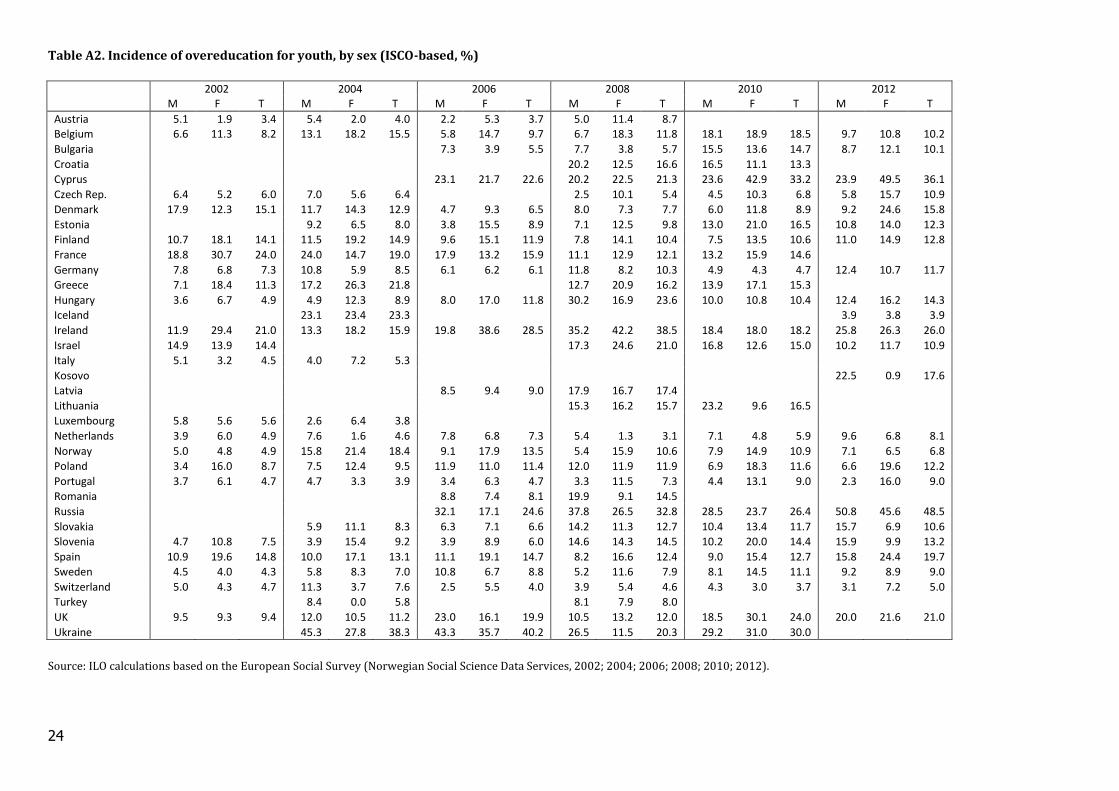
Table A2. Incidence of overeducation for youth, by sex (ISCO-based, %)
2002 2004 2006 2008 2010 2012 M F T M F T M F T M F T M F T M F T
Austria 5.1 1.9 3.4 5.4 2.0 4.0 2.2 5.3 3.7 5.0 11.4 8.7
Belgium 6.6 11.3 8.2 13.1 18.2 15.5 5.8 14.7 9.7 6.7 18.3 11.8 18.1 18.9 18.5 9.7 10.8 10.2
Bulgaria
7.3 3.9 5.5 7.7 3.8 5.7 15.5 13.6 14.7 8.7 12.1 10.1
Croatia
20.2 12.5 16.6 16.5 11.1 13.3
Cyprus
23.1 21.7 22.6 20.2 22.5 21.3 23.6 42.9 33.2 23.9 49.5 36.1
Czech Rep. 6.4 5.2 6.0 7.0 5.6 6.4
2.5 10.1 5.4 4.5 10.3 6.8 5.8 15.7 10.9
Denmark 17.9 12.3 15.1 11.7 14.3 12.9 4.7 9.3 6.5 8.0 7.3 7.7 6.0 11.8 8.9 9.2 24.6 15.8
Estonia
9.2 6.5 8.0 3.8 15.5 8.9 7.1 12.5 9.8 13.0 21.0 16.5 10.8 14.0 12.3
Finland 10.7 18.1 14.1 11.5 19.2 14.9 9.6 15.1 11.9 7.8 14.1 10.4 7.5 13.5 10.6 11.0 14.9 12.8
France 18.8 30.7 24.0 24.0 14.7 19.0 17.9 13.2 15.9 11.1 12.9 12.1 13.2 15.9 14.6
Germany 7.8 6.8 7.3 10.8 5.9 8.5 6.1 6.2 6.1 11.8 8.2 10.3 4.9 4.3 4.7 12.4 10.7 11.7
Greece 7.1 18.4 11.3 17.2 26.3 21.8
12.7 20.9 16.2 13.9 17.1 15.3
Hungary 3.6 6.7 4.9 4.9 12.3 8.9 8.0 17.0 11.8 30.2 16.9 23.6 10.0 10.8 10.4 12.4 16.2 14.3
Iceland
23.1 23.4 23.3
3.9 3.8 3.9
Ireland 11.9 29.4 21.0 13.3 18.2 15.9 19.8 38.6 28.5 35.2 42.2 38.5 18.4 18.0 18.2 25.8 26.3 26.0
Israel 14.9 13.9 14.4
17.3 24.6 21.0 16.8 12.6 15.0 10.2 11.7 10.9
Italy 5.1 3.2 4.5 4.0 7.2 5.3
Kosovo
22.5 0.9 17.6
Latvia
8.5 9.4 9.0 17.9 16.7 17.4
Lithuania
15.3 16.2 15.7 23.2 9.6 16.5
Luxembourg 5.8 5.6 5.6 2.6 6.4 3.8
Netherlands 3.9 6.0 4.9 7.6 1.6 4.6 7.8 6.8 7.3 5.4 1.3 3.1 7.1 4.8 5.9 9.6 6.8 8.1
Norway 5.0 4.8 4.9 15.8 21.4 18.4 9.1 17.9 13.5 5.4 15.9 10.6 7.9 14.9 10.9 7.1 6.5 6.8
Poland 3.4 16.0 8.7 7.5 12.4 9.5 11.9 11.0 11.4 12.0 11.9 11.9 6.9 18.3 11.6 6.6 19.6 12.2
Portugal 3.7 6.1 4.7 4.7 3.3 3.9 3.4 6.3 4.7 3.3 11.5 7.3 4.4 13.1 9.0 2.3 16.0 9.0
Romania
8.8 7.4 8.1 19.9 9.1 14.5
Russia
32.1 17.1 24.6 37.8 26.5 32.8 28.5 23.7 26.4 50.8 45.6 48.5
Slovakia
5.9 11.1 8.3 6.3 7.1 6.6 14.2 11.3 12.7 10.4 13.4 11.7 15.7 6.9 10.6
Slovenia 4.7 10.8 7.5 3.9 15.4 9.2 3.9 8.9 6.0 14.6 14.3 14.5 10.2 20.0 14.4 15.9 9.9 13.2
Spain 10.9 19.6 14.8 10.0 17.1 13.1 11.1 19.1 14.7 8.2 16.6 12.4 9.0 15.4 12.7 15.8 24.4 19.7
Sweden 4.5 4.0 4.3 5.8 8.3 7.0 10.8 6.7 8.8 5.2 11.6 7.9 8.1 14.5 11.1 9.2 8.9 9.0
Switzerland 5.0 4.3 4.7 11.3 3.7 7.6 2.5 5.5 4.0 3.9 5.4 4.6 4.3 3.0 3.7 3.1 7.2 5.0
Turkey
8.4 0.0 5.8
8.1 7.9 8.0
UK 9.5 9.3 9.4 12.0 10.5 11.2 23.0 16.1 19.9 10.5 13.2 12.0 18.5 30.1 24.0 20.0 21.6 21.0
Ukraine 45.3 27.8 38.3 43.3 35.7 40.2 26.5 11.5 20.3 29.2 31.0 30.0
Source: ILO calculations based on the European Social Survey (Norwegian Social Science Data Services, 2002; 2004; 2006; 2008; 2010; 2012).
25
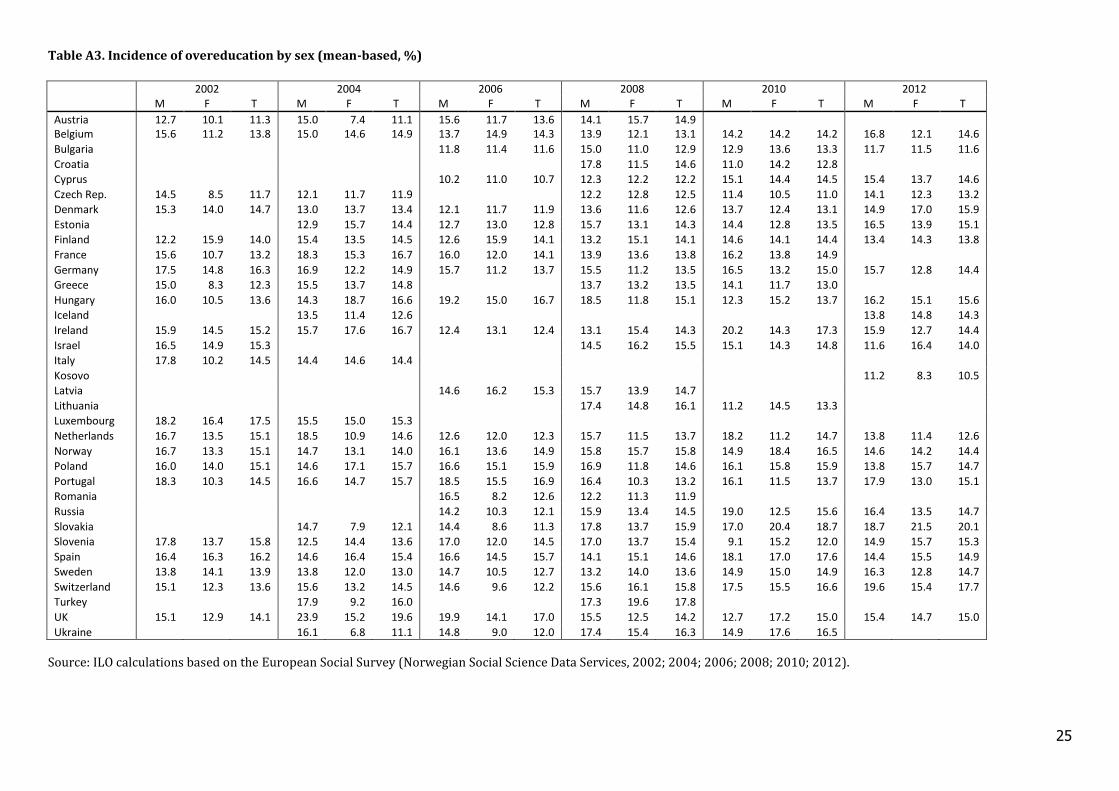
Table A3. Incidence of overeducation by sex (mean-based, %)
2002 2004 2006 2008 2010 2012 M F T M F T M F T M F T M F T M F T
Austria 12.7 10.1 11.3 15.0 7.4 11.1 15.6 11.7 13.6 14.1 15.7 14.9
Belgium 15.6 11.2 13.8 15.0 14.6 14.9 13.7 14.9 14.3 13.9 12.1 13.1 14.2 14.2 14.2 16.8 12.1 14.6
Bulgaria
11.8 11.4 11.6 15.0 11.0 12.9 12.9 13.6 13.3 11.7 11.5 11.6
Croatia
17.8 11.5 14.6 11.0 14.2 12.8
Cyprus
10.2 11.0 10.7 12.3 12.2 12.2 15.1 14.4 14.5 15.4 13.7 14.6
Czech Rep. 14.5 8.5 11.7 12.1 11.7 11.9
12.2 12.8 12.5 11.4 10.5 11.0 14.1 12.3 13.2
Denmark 15.3 14.0 14.7 13.0 13.7 13.4 12.1 11.7 11.9 13.6 11.6 12.6 13.7 12.4 13.1 14.9 17.0 15.9
Estonia
12.9 15.7 14.4 12.7 13.0 12.8 15.7 13.1 14.3 14.4 12.8 13.5 16.5 13.9 15.1
Finland 12.2 15.9 14.0 15.4 13.5 14.5 12.6 15.9 14.1 13.2 15.1 14.1 14.6 14.1 14.4 13.4 14.3 13.8
France 15.6 10.7 13.2 18.3 15.3 16.7 16.0 12.0 14.1 13.9 13.6 13.8 16.2 13.8 14.9
Germany 17.5 14.8 16.3 16.9 12.2 14.9 15.7 11.2 13.7 15.5 11.2 13.5 16.5 13.2 15.0 15.7 12.8 14.4
Greece 15.0 8.3 12.3 15.5 13.7 14.8
13.7 13.2 13.5 14.1 11.7 13.0
Hungary 16.0 10.5 13.6 14.3 18.7 16.6 19.2 15.0 16.7 18.5 11.8 15.1 12.3 15.2 13.7 16.2 15.1 15.6
Iceland
13.5 11.4 12.6
13.8 14.8 14.3
Ireland 15.9 14.5 15.2 15.7 17.6 16.7 12.4 13.1 12.4 13.1 15.4 14.3 20.2 14.3 17.3 15.9 12.7 14.4
Israel 16.5 14.9 15.3
14.5 16.2 15.5 15.1 14.3 14.8 11.6 16.4 14.0
Italy 17.8 10.2 14.5 14.4 14.6 14.4
Kosovo
11.2 8.3 10.5
Latvia
14.6 16.2 15.3 15.7 13.9 14.7
Lithuania
17.4 14.8 16.1 11.2 14.5 13.3
Luxembourg 18.2 16.4 17.5 15.5 15.0 15.3
Netherlands 16.7 13.5 15.1 18.5 10.9 14.6 12.6 12.0 12.3 15.7 11.5 13.7 18.2 11.2 14.7 13.8 11.4 12.6
Norway 16.7 13.3 15.1 14.7 13.1 14.0 16.1 13.6 14.9 15.8 15.7 15.8 14.9 18.4 16.5 14.6 14.2 14.4
Poland 16.0 14.0 15.1 14.6 17.1 15.7 16.6 15.1 15.9 16.9 11.8 14.6 16.1 15.8 15.9 13.8 15.7 14.7
Portugal 18.3 10.3 14.5 16.6 14.7 15.7 18.5 15.5 16.9 16.4 10.3 13.2 16.1 11.5 13.7 17.9 13.0 15.1
Romania
16.5 8.2 12.6 12.2 11.3 11.9
Russia
14.2 10.3 12.1 15.9 13.4 14.5 19.0 12.5 15.6 16.4 13.5 14.7
Slovakia
14.7 7.9 12.1 14.4 8.6 11.3 17.8 13.7 15.9 17.0 20.4 18.7 18.7 21.5 20.1
Slovenia 17.8 13.7 15.8 12.5 14.4 13.6 17.0 12.0 14.5 17.0 13.7 15.4 9.1 15.2 12.0 14.9 15.7 15.3
Spain 16.4 16.3 16.2 14.6 16.4 15.4 16.6 14.5 15.7 14.1 15.1 14.6 18.1 17.0 17.6 14.4 15.5 14.9
Sweden 13.8 14.1 13.9 13.8 12.0 13.0 14.7 10.5 12.7 13.2 14.0 13.6 14.9 15.0 14.9 16.3 12.8 14.7
Switzerland 15.1 12.3 13.6 15.6 13.2 14.5 14.6 9.6 12.2 15.6 16.1 15.8 17.5 15.5 16.6 19.6 15.4 17.7
Turkey
17.9 9.2 16.0
17.3 19.6 17.8
UK 15.1 12.9 14.1 23.9 15.2 19.6 19.9 14.1 17.0 15.5 12.5 14.2 12.7 17.2 15.0 15.4 14.7 15.0
Ukraine 16.1 6.8 11.1 14.8 9.0 12.0 17.4 15.4 16.3 14.9 17.6 16.5
Source: ILO calculations based on the European Social Survey (Norwegian Social Science Data Services, 2002; 2004; 2006; 2008; 2010; 2012).
26
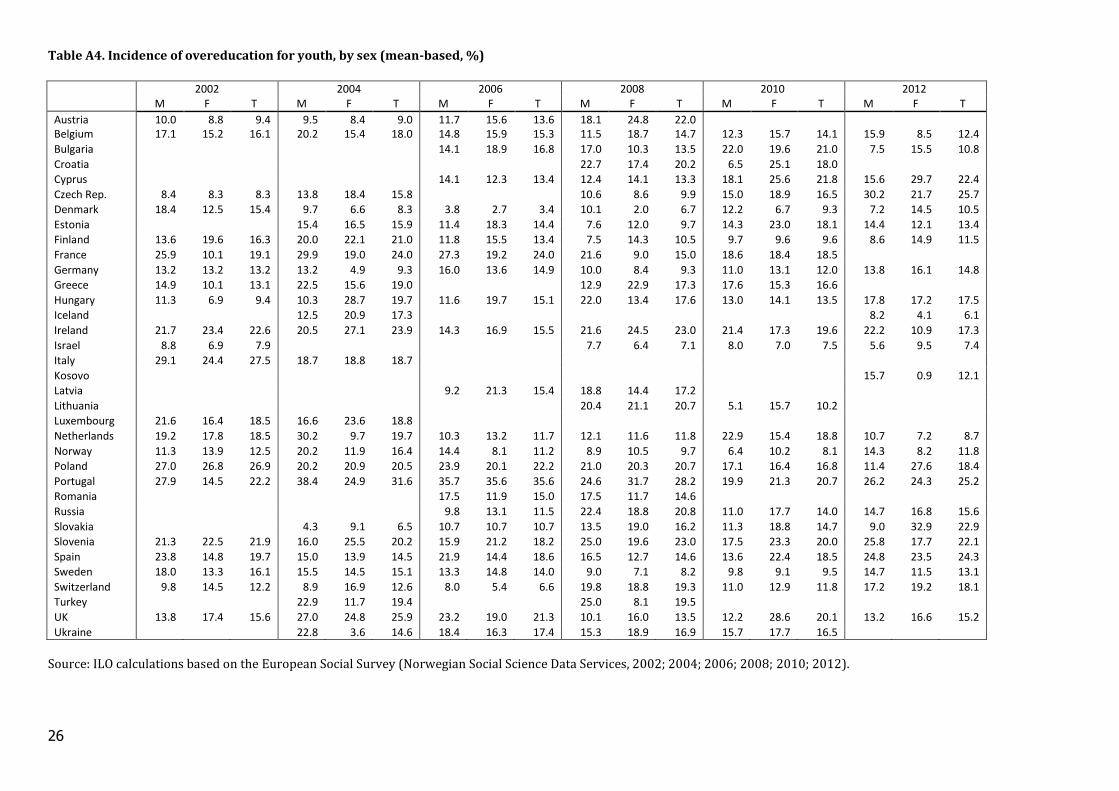
Table A4. Incidence of overeducation for youth, by sex (mean-based, %)
2002 2004 2006 2008 2010 2012
M F T M F T M F T M F T M F T M F T
Austria 10.0 8.8 9.4 9.5 8.4 9.0 11.7 15.6 13.6 18.1 24.8 22.0
Belgium 17.1 15.2 16.1 20.2 15.4 18.0 14.8 15.9 15.3 11.5 18.7 14.7 12.3 15.7 14.1 15.9 8.5 12.4
Bulgaria
14.1 18.9 16.8 17.0 10.3 13.5 22.0 19.6 21.0 7.5 15.5 10.8
Croatia
22.7 17.4 20.2 6.5 25.1 18.0
Cyprus
14.1 12.3 13.4 12.4 14.1 13.3 18.1 25.6 21.8 15.6 29.7 22.4
Czech Rep. 8.4 8.3 8.3 13.8 18.4 15.8
10.6 8.6 9.9 15.0 18.9 16.5 30.2 21.7 25.7
Denmark 18.4 12.5 15.4 9.7 6.6 8.3 3.8 2.7 3.4 10.1 2.0 6.7 12.2 6.7 9.3 7.2 14.5 10.5
Estonia
15.4 16.5 15.9 11.4 18.3 14.4 7.6 12.0 9.7 14.3 23.0 18.1 14.4 12.1 13.4
Finland 13.6 19.6 16.3 20.0 22.1 21.0 11.8 15.5 13.4 7.5 14.3 10.5 9.7 9.6 9.6 8.6 14.9 11.5
France 25.9 10.1 19.1 29.9 19.0 24.0 27.3 19.2 24.0 21.6 9.0 15.0 18.6 18.4 18.5
Germany 13.2 13.2 13.2 13.2 4.9 9.3 16.0 13.6 14.9 10.0 8.4 9.3 11.0 13.1 12.0 13.8 16.1 14.8
Greece 14.9 10.1 13.1 22.5 15.6 19.0
12.9 22.9 17.3 17.6 15.3 16.6
Hungary 11.3 6.9 9.4 10.3 28.7 19.7 11.6 19.7 15.1 22.0 13.4 17.6 13.0 14.1 13.5 17.8 17.2 17.5
Iceland
12.5 20.9 17.3
8.2 4.1 6.1
Ireland 21.7 23.4 22.6 20.5 27.1 23.9 14.3 16.9 15.5 21.6 24.5 23.0 21.4 17.3 19.6 22.2 10.9 17.3
Israel 8.8 6.9 7.9
7.7 6.4 7.1 8.0 7.0 7.5 5.6 9.5 7.4
Italy 29.1 24.4 27.5 18.7 18.8 18.7
Kosovo
15.7 0.9 12.1
Latvia
9.2 21.3 15.4 18.8 14.4 17.2
Lithuania
20.4 21.1 20.7 5.1 15.7 10.2
Luxembourg 21.6 16.4 18.5 16.6 23.6 18.8
Netherlands 19.2 17.8 18.5 30.2 9.7 19.7 10.3 13.2 11.7 12.1 11.6 11.8 22.9 15.4 18.8 10.7 7.2 8.7
Norway 11.3 13.9 12.5 20.2 11.9 16.4 14.4 8.1 11.2 8.9 10.5 9.7 6.4 10.2 8.1 14.3 8.2 11.8
Poland 27.0 26.8 26.9 20.2 20.9 20.5 23.9 20.1 22.2 21.0 20.3 20.7 17.1 16.4 16.8 11.4 27.6 18.4
Portugal 27.9 14.5 22.2 38.4 24.9 31.6 35.7 35.6 35.6 24.6 31.7 28.2 19.9 21.3 20.7 26.2 24.3 25.2
Romania
17.5 11.9 15.0 17.5 11.7 14.6
Russia
9.8 13.1 11.5 22.4 18.8 20.8 11.0 17.7 14.0 14.7 16.8 15.6
Slovakia
4.3 9.1 6.5 10.7 10.7 10.7 13.5 19.0 16.2 11.3 18.8 14.7 9.0 32.9 22.9
Slovenia 21.3 22.5 21.9 16.0 25.5 20.2 15.9 21.2 18.2 25.0 19.6 23.0 17.5 23.3 20.0 25.8 17.7 22.1
Spain 23.8 14.8 19.7 15.0 13.9 14.5 21.9 14.4 18.6 16.5 12.7 14.6 13.6 22.4 18.5 24.8 23.5 24.3
Sweden 18.0 13.3 16.1 15.5 14.5 15.1 13.3 14.8 14.0 9.0 7.1 8.2 9.8 9.1 9.5 14.7 11.5 13.1
Switzerland 9.8 14.5 12.2 8.9 16.9 12.6 8.0 5.4 6.6 19.8 18.8 19.3 11.0 12.9 11.8 17.2 19.2 18.1
Turkey
22.9 11.7 19.4
25.0 8.1 19.5
UK 13.8 17.4 15.6 27.0 24.8 25.9 23.2 19.0 21.3 10.1 16.0 13.5 12.2 28.6 20.1 13.2 16.6 15.2
Ukraine 22.8 3.6 14.6 18.4 16.3 17.4 15.3 18.9 16.9 15.7 17.7 16.5
Source: ILO calculations based on the European Social Survey (Norwegian Social Science Data Services, 2002; 2004; 2006; 2008; 2010; 2012).
27
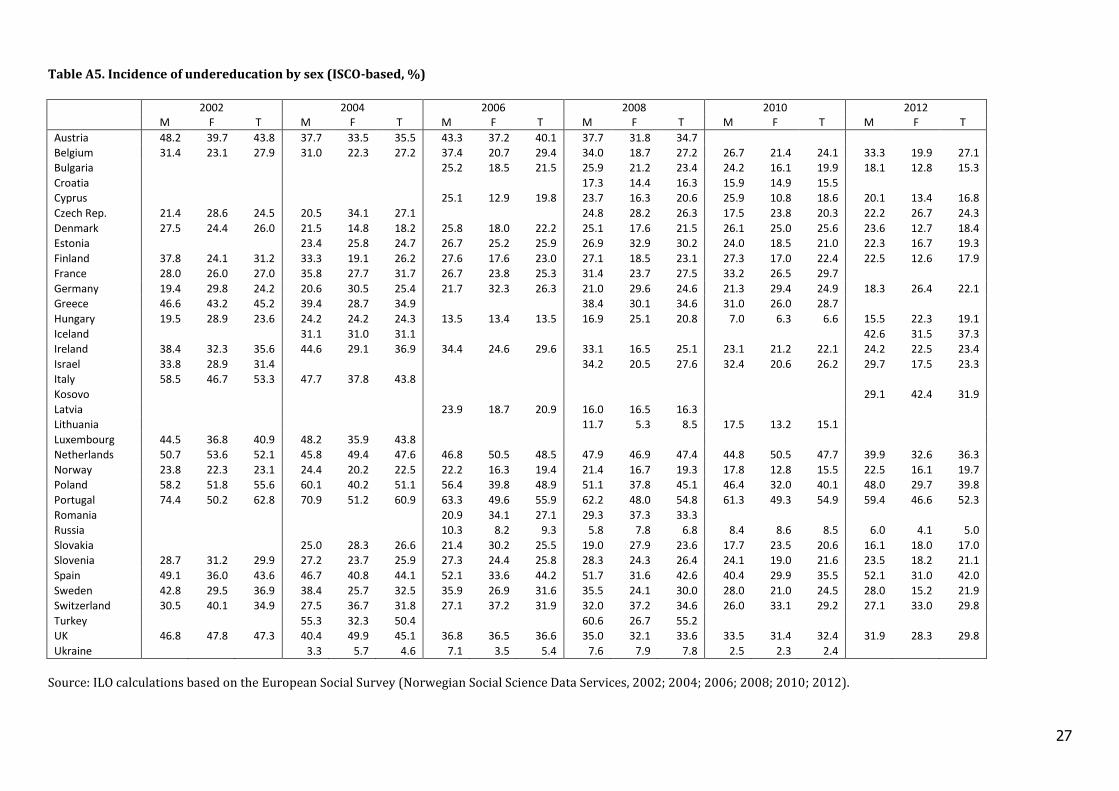
Table A5. Incidence of undereducation by sex (ISCO-based, %)
2002 2004 2006 2008 2010 2012
M F T M F T M F T M F T M F T M F T
Austria 48.2 39.7 43.8 37.7 33.5 35.5 43.3 37.2 40.1 37.7 31.8 34.7
Belgium 31.4 23.1 27.9 31.0 22.3 27.2 37.4 20.7 29.4 34.0 18.7 27.2 26.7 21.4 24.1 33.3 19.9 27.1
Bulgaria
25.2 18.5 21.5 25.9 21.2 23.4 24.2 16.1 19.9 18.1 12.8 15.3
Croatia
17.3 14.4 16.3 15.9 14.9 15.5
Cyprus
25.1 12.9 19.8 23.7 16.3 20.6 25.9 10.8 18.6 20.1 13.4 16.8
Czech Rep. 21.4 28.6 24.5 20.5 34.1 27.1
24.8 28.2 26.3 17.5 23.8 20.3 22.2 26.7 24.3
Denmark 27.5 24.4 26.0 21.5 14.8 18.2 25.8 18.0 22.2 25.1 17.6 21.5 26.1 25.0 25.6 23.6 12.7 18.4
Estonia
23.4 25.8 24.7 26.7 25.2 25.9 26.9 32.9 30.2 24.0 18.5 21.0 22.3 16.7 19.3
Finland 37.8 24.1 31.2 33.3 19.1 26.2 27.6 17.6 23.0 27.1 18.5 23.1 27.3 17.0 22.4 22.5 12.6 17.9
France 28.0 26.0 27.0 35.8 27.7 31.7 26.7 23.8 25.3 31.4 23.7 27.5 33.2 26.5 29.7
Germany 19.4 29.8 24.2 20.6 30.5 25.4 21.7 32.3 26.3 21.0 29.6 24.6 21.3 29.4 24.9 18.3 26.4 22.1
Greece 46.6 43.2 45.2 39.4 28.7 34.9
38.4 30.1 34.6 31.0 26.0 28.7
Hungary 19.5 28.9 23.6 24.2 24.2 24.3 13.5 13.4 13.5 16.9 25.1 20.8 7.0 6.3 6.6 15.5 22.3 19.1
Iceland
31.1 31.0 31.1
42.6 31.5 37.3
Ireland 38.4 32.3 35.6 44.6 29.1 36.9 34.4 24.6 29.6 33.1 16.5 25.1 23.1 21.2 22.1 24.2 22.5 23.4
Israel 33.8 28.9 31.4
34.2 20.5 27.6 32.4 20.6 26.2 29.7 17.5 23.3
Italy 58.5 46.7 53.3 47.7 37.8 43.8
Kosovo
29.1 42.4 31.9
Latvia
23.9 18.7 20.9 16.0 16.5 16.3
Lithuania
11.7 5.3 8.5 17.5 13.2 15.1
Luxembourg 44.5 36.8 40.9 48.2 35.9 43.8
Netherlands 50.7 53.6 52.1 45.8 49.4 47.6 46.8 50.5 48.5 47.9 46.9 47.4 44.8 50.5 47.7 39.9 32.6 36.3
Norway 23.8 22.3 23.1 24.4 20.2 22.5 22.2 16.3 19.4 21.4 16.7 19.3 17.8 12.8 15.5 22.5 16.1 19.7
Poland 58.2 51.8 55.6 60.1 40.2 51.1 56.4 39.8 48.9 51.1 37.8 45.1 46.4 32.0 40.1 48.0 29.7 39.8
Portugal 74.4 50.2 62.8 70.9 51.2 60.9 63.3 49.6 55.9 62.2 48.0 54.8 61.3 49.3 54.9 59.4 46.6 52.3
Romania
20.9 34.1 27.1 29.3 37.3 33.3
Russia
10.3 8.2 9.3 5.8 7.8 6.8 8.4 8.6 8.5 6.0 4.1 5.0
Slovakia
25.0 28.3 26.6 21.4 30.2 25.5 19.0 27.9 23.6 17.7 23.5 20.6 16.1 18.0 17.0
Slovenia 28.7 31.2 29.9 27.2 23.7 25.9 27.3 24.4 25.8 28.3 24.3 26.4 24.1 19.0 21.6 23.5 18.2 21.1
Spain 49.1 36.0 43.6 46.7 40.8 44.1 52.1 33.6 44.2 51.7 31.6 42.6 40.4 29.9 35.5 52.1 31.0 42.0
Sweden 42.8 29.5 36.9 38.4 25.7 32.5 35.9 26.9 31.6 35.5 24.1 30.0 28.0 21.0 24.5 28.0 15.2 21.9
Switzerland 30.5 40.1 34.9 27.5 36.7 31.8 27.1 37.2 31.9 32.0 37.2 34.6 26.0 33.1 29.2 27.1 33.0 29.8
Turkey
55.3 32.3 50.4
60.6 26.7 55.2
UK 46.8 47.8 47.3 40.4 49.9 45.1 36.8 36.5 36.6 35.0 32.1 33.6 33.5 31.4 32.4 31.9 28.3 29.8
Ukraine
3.3 5.7 4.6 7.1 3.5 5.4 7.6 7.9 7.8 2.5 2.3 2.4
Source: ILO calculations based on the European Social Survey (Norwegian Social Science Data Services, 2002; 2004; 2006; 2008; 2010; 2012).
28
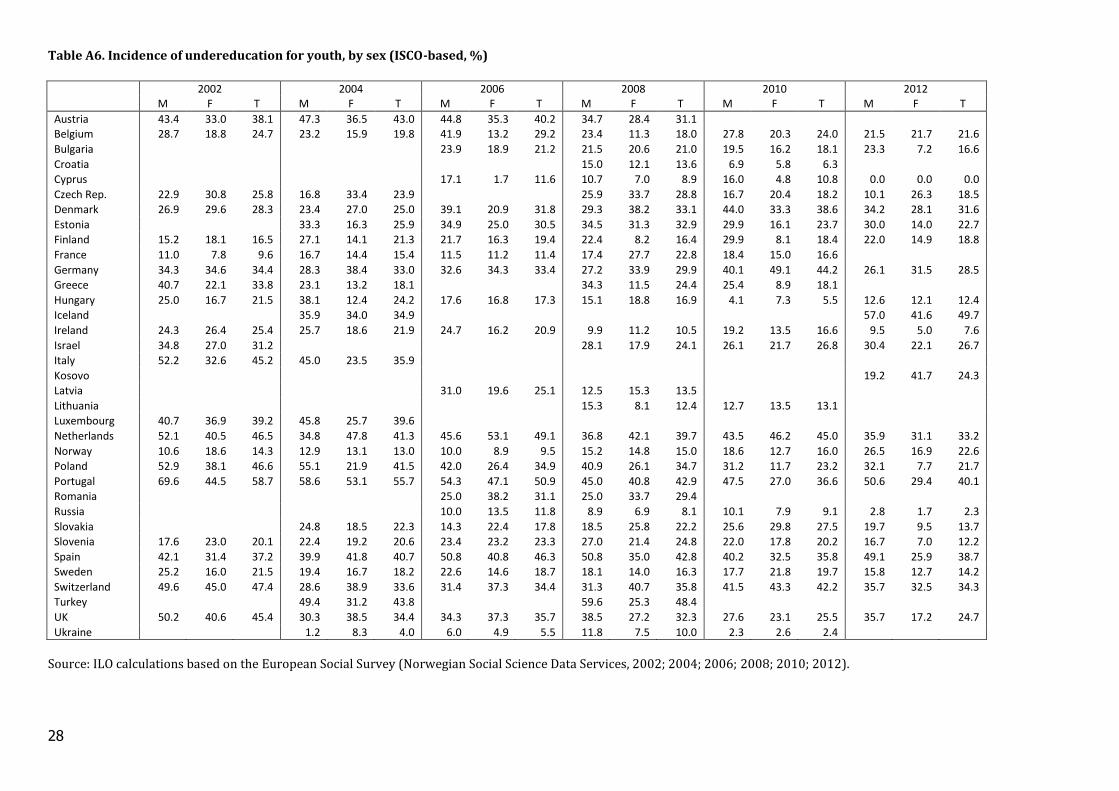
Table A6. Incidence of undereducation for youth, by sex (ISCO-based, %)
2002 2004 2006 2008 2010 2012
M F T M F T M F T M F T M F T M F T
Austria 43.4 33.0 38.1 47.3 36.5 43.0 44.8 35.3 40.2 34.7 28.4 31.1 Belgium 28.7 18.8 24.7 23.2 15.9 19.8 41.9 13.2 29.2 23.4 11.3 18.0 27.8 20.3 24.0 21.5 21.7 21.6
Bulgaria
23.9 18.9 21.2 21.5 20.6 21.0 19.5 16.2 18.1 23.3 7.2 16.6
Croatia
15.0 12.1 13.6 6.9 5.8 6.3 Cyprus
17.1 1.7 11.6 10.7 7.0 8.9 16.0 4.8 10.8 0.0 0.0 0.0
Czech Rep. 22.9 30.8 25.8 16.8 33.4 23.9
25.9 33.7 28.8 16.7 20.4 18.2 10.1 26.3 18.5
Denmark 26.9 29.6 28.3 23.4 27.0 25.0 39.1 20.9 31.8 29.3 38.2 33.1 44.0 33.3 38.6 34.2 28.1 31.6
Estonia
33.3 16.3 25.9 34.9 25.0 30.5 34.5 31.3 32.9 29.9 16.1 23.7 30.0 14.0 22.7
Finland 15.2 18.1 16.5 27.1 14.1 21.3 21.7 16.3 19.4 22.4 8.2 16.4 29.9 8.1 18.4 22.0 14.9 18.8
France 11.0 7.8 9.6 16.7 14.4 15.4 11.5 11.2 11.4 17.4 27.7 22.8 18.4 15.0 16.6 Germany 34.3 34.6 34.4 28.3 38.4 33.0 32.6 34.3 33.4 27.2 33.9 29.9 40.1 49.1 44.2 26.1 31.5 28.5
Greece 40.7 22.1 33.8 23.1 13.2 18.1
34.3 11.5 24.4 25.4 8.9 18.1 Hungary 25.0 16.7 21.5 38.1 12.4 24.2 17.6 16.8 17.3 15.1 18.8 16.9 4.1 7.3 5.5 12.6 12.1 12.4
Iceland
35.9 34.0 34.9
57.0 41.6 49.7
Ireland 24.3 26.4 25.4 25.7 18.6 21.9 24.7 16.2 20.9 9.9 11.2 10.5 19.2 13.5 16.6 9.5 5.0 7.6
Israel 34.8 27.0 31.2
28.1 17.9 24.1 26.1 21.7 26.8 30.4 22.1 26.7
Italy 52.2 32.6 45.2 45.0 23.5 35.9 Kosovo
19.2 41.7 24.3
Latvia
31.0 19.6 25.1 12.5 15.3 13.5 Lithuania
15.3 8.1 12.4 12.7 13.5 13.1
Luxembourg 40.7 36.9 39.2 45.8 25.7 39.6 Netherlands 52.1 40.5 46.5 34.8 47.8 41.3 45.6 53.1 49.1 36.8 42.1 39.7 43.5 46.2 45.0 35.9 31.1 33.2
Norway 10.6 18.6 14.3 12.9 13.1 13.0 10.0 8.9 9.5 15.2 14.8 15.0 18.6 12.7 16.0 26.5 16.9 22.6
Poland 52.9 38.1 46.6 55.1 21.9 41.5 42.0 26.4 34.9 40.9 26.1 34.7 31.2 11.7 23.2 32.1 7.7 21.7
Portugal 69.6 44.5 58.7 58.6 53.1 55.7 54.3 47.1 50.9 45.0 40.8 42.9 47.5 27.0 36.6 50.6 29.4 40.1
Romania
25.0 38.2 31.1 25.0 33.7 29.4 Russia
10.0 13.5 11.8 8.9 6.9 8.1 10.1 7.9 9.1 2.8 1.7 2.3
Slovakia
24.8 18.5 22.3 14.3 22.4 17.8 18.5 25.8 22.2 25.6 29.8 27.5 19.7 9.5 13.7
Slovenia 17.6 23.0 20.1 22.4 19.2 20.6 23.4 23.2 23.3 27.0 21.4 24.8 22.0 17.8 20.2 16.7 7.0 12.2
Spain 42.1 31.4 37.2 39.9 41.8 40.7 50.8 40.8 46.3 50.8 35.0 42.8 40.2 32.5 35.8 49.1 25.9 38.7
Sweden 25.2 16.0 21.5 19.4 16.7 18.2 22.6 14.6 18.7 18.1 14.0 16.3 17.7 21.8 19.7 15.8 12.7 14.2
Switzerland 49.6 45.0 47.4 28.6 38.9 33.6 31.4 37.3 34.4 31.3 40.7 35.8 41.5 43.3 42.2 35.7 32.5 34.3
Turkey
49.4 31.2 43.8
59.6 25.3 48.4 UK 50.2 40.6 45.4 30.3 38.5 34.4 34.3 37.3 35.7 38.5 27.2 32.3 27.6 23.1 25.5 35.7 17.2 24.7
Ukraine
1.2 8.3 4.0 6.0 4.9 5.5 11.8 7.5 10.0 2.3 2.6 2.4
Source: ILO calculations based on the European Social Survey (Norwegian Social Science Data Services, 2002; 2004; 2006; 2008; 2010; 2012).
29
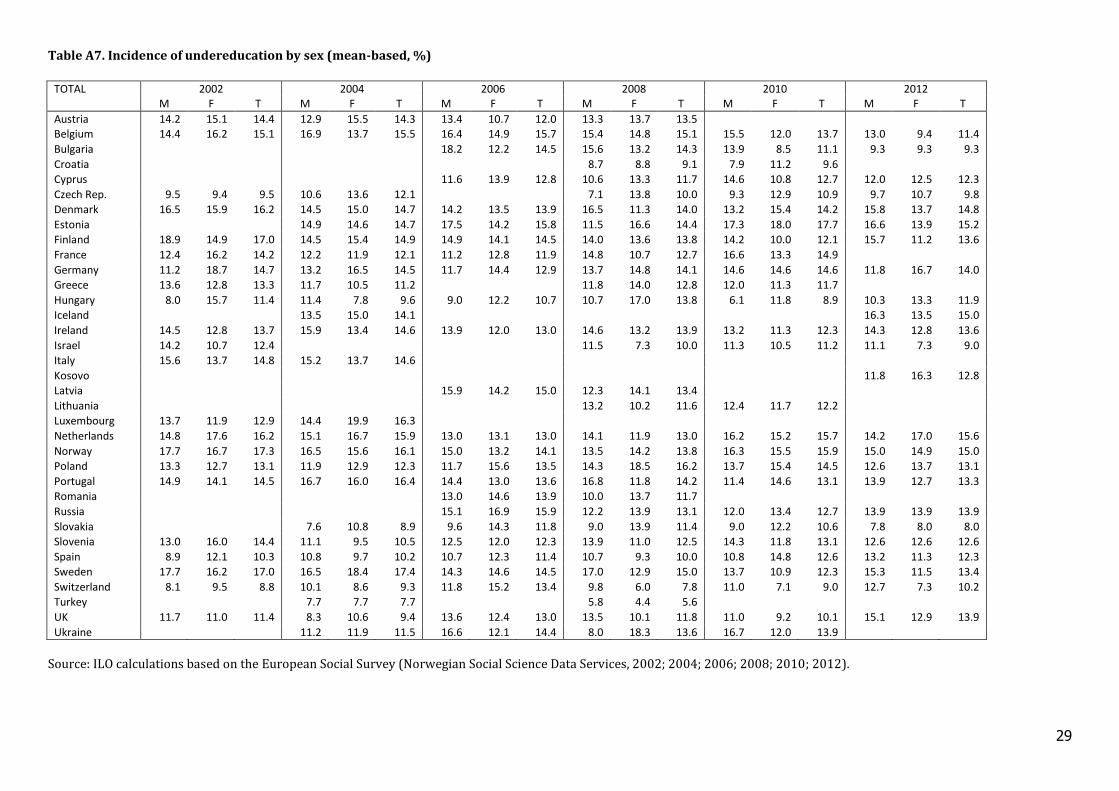
Table A7. Incidence of undereducation by sex (mean-based, %)
TOTAL 2002 2004 2006 2008 2010 2012
M F T M F T M F T M F T M F T M F T
Austria 14.2 15.1 14.4 12.9 15.5 14.3 13.4 10.7 12.0 13.3 13.7 13.5
Belgium 14.4 16.2 15.1 16.9 13.7 15.5 16.4 14.9 15.7 15.4 14.8 15.1 15.5 12.0 13.7 13.0 9.4 11.4
Bulgaria
18.2 12.2 14.5 15.6 13.2 14.3 13.9 8.5 11.1 9.3 9.3 9.3
Croatia
8.7 8.8 9.1 7.9 11.2 9.6
Cyprus
11.6 13.9 12.8 10.6 13.3 11.7 14.6 10.8 12.7 12.0 12.5 12.3
Czech Rep. 9.5 9.4 9.5 10.6 13.6 12.1
7.1 13.8 10.0 9.3 12.9 10.9 9.7 10.7 9.8
Denmark 16.5 15.9 16.2 14.5 15.0 14.7 14.2 13.5 13.9 16.5 11.3 14.0 13.2 15.4 14.2 15.8 13.7 14.8
Estonia
14.9 14.6 14.7 17.5 14.2 15.8 11.5 16.6 14.4 17.3 18.0 17.7 16.6 13.9 15.2
Finland 18.9 14.9 17.0 14.5 15.4 14.9 14.9 14.1 14.5 14.0 13.6 13.8 14.2 10.0 12.1 15.7 11.2 13.6
France 12.4 16.2 14.2 12.2 11.9 12.1 11.2 12.8 11.9 14.8 10.7 12.7 16.6 13.3 14.9
Germany 11.2 18.7 14.7 13.2 16.5 14.5 11.7 14.4 12.9 13.7 14.8 14.1 14.6 14.6 14.6 11.8 16.7 14.0
Greece 13.6 12.8 13.3 11.7 10.5 11.2
11.8 14.0 12.8 12.0 11.3 11.7
Hungary 8.0 15.7 11.4 11.4 7.8 9.6 9.0 12.2 10.7 10.7 17.0 13.8 6.1 11.8 8.9 10.3 13.3 11.9
Iceland
13.5 15.0 14.1
16.3 13.5 15.0
Ireland 14.5 12.8 13.7 15.9 13.4 14.6 13.9 12.0 13.0 14.6 13.2 13.9 13.2 11.3 12.3 14.3 12.8 13.6
Israel 14.2 10.7 12.4
11.5 7.3 10.0 11.3 10.5 11.2 11.1 7.3 9.0
Italy 15.6 13.7 14.8 15.2 13.7 14.6
Kosovo
11.8 16.3 12.8
Latvia
15.9 14.2 15.0 12.3 14.1 13.4
Lithuania
13.2 10.2 11.6 12.4 11.7 12.2
Luxembourg 13.7 11.9 12.9 14.4 19.9 16.3
Netherlands 14.8 17.6 16.2 15.1 16.7 15.9 13.0 13.1 13.0 14.1 11.9 13.0 16.2 15.2 15.7 14.2 17.0 15.6
Norway 17.7 16.7 17.3 16.5 15.6 16.1 15.0 13.2 14.1 13.5 14.2 13.8 16.3 15.5 15.9 15.0 14.9 15.0
Poland 13.3 12.7 13.1 11.9 12.9 12.3 11.7 15.6 13.5 14.3 18.5 16.2 13.7 15.4 14.5 12.6 13.7 13.1
Portugal 14.9 14.1 14.5 16.7 16.0 16.4 14.4 13.0 13.6 16.8 11.8 14.2 11.4 14.6 13.1 13.9 12.7 13.3
Romania
13.0 14.6 13.9 10.0 13.7 11.7
Russia
15.1 16.9 15.9 12.2 13.9 13.1 12.0 13.4 12.7 13.9 13.9 13.9
Slovakia
7.6 10.8 8.9 9.6 14.3 11.8 9.0 13.9 11.4 9.0 12.2 10.6 7.8 8.0 8.0
Slovenia 13.0 16.0 14.4 11.1 9.5 10.5 12.5 12.0 12.3 13.9 11.0 12.5 14.3 11.8 13.1 12.6 12.6 12.6
Spain 8.9 12.1 10.3 10.8 9.7 10.2 10.7 12.3 11.4 10.7 9.3 10.0 10.8 14.8 12.6 13.2 11.3 12.3
Sweden 17.7 16.2 17.0 16.5 18.4 17.4 14.3 14.6 14.5 17.0 12.9 15.0 13.7 10.9 12.3 15.3 11.5 13.4
Switzerland 8.1 9.5 8.8 10.1 8.6 9.3 11.8 15.2 13.4 9.8 6.0 7.8 11.0 7.1 9.0 12.7 7.3 10.2
Turkey
7.7 7.7 7.7
5.8 4.4 5.6
UK 11.7 11.0 11.4 8.3 10.6 9.4 13.6 12.4 13.0 13.5 10.1 11.8 11.0 9.2 10.1 15.1 12.9 13.9
Ukraine
11.2 11.9 11.5 16.6 12.1 14.4 8.0 18.3 13.6 16.7 12.0 13.9
Source: ILO calculations based on the European Social Survey (Norwegian Social Science Data Services, 2002; 2004; 2006; 2008; 2010; 2012).
30
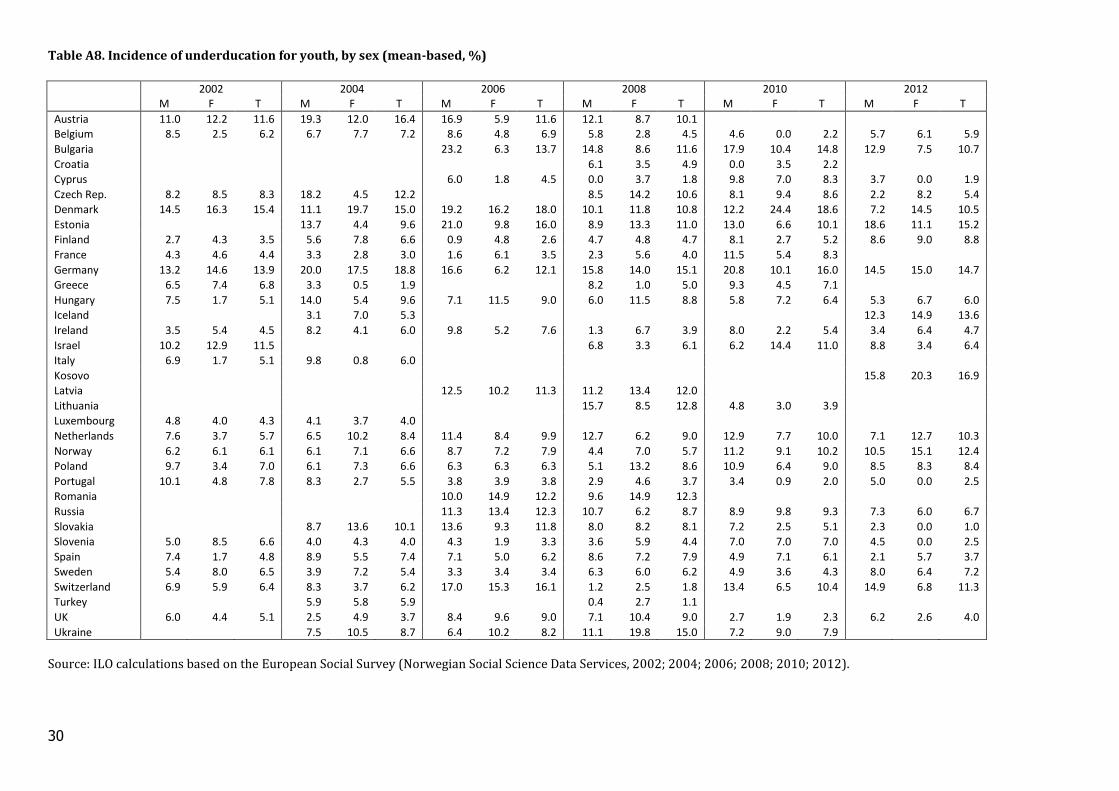
Table A8. Incidence of underducation for youth, by sex (mean-based, %)
2002 2004 2006 2008 2010 2012
M F T M F T M F T M F T M F T M F T
Austria 11.0 12.2 11.6 19.3 12.0 16.4 16.9 5.9 11.6 12.1 8.7 10.1 Belgium 8.5 2.5 6.2 6.7 7.7 7.2 8.6 4.8 6.9 5.8 2.8 4.5 4.6 0.0 2.2 5.7 6.1 5.9
Bulgaria
23.2 6.3 13.7 14.8 8.6 11.6 17.9 10.4 14.8 12.9 7.5 10.7
Croatia
6.1 3.5 4.9 0.0 3.5 2.2 Cyprus
6.0 1.8 4.5 0.0 3.7 1.8 9.8 7.0 8.3 3.7 0.0 1.9
Czech Rep. 8.2 8.5 8.3 18.2 4.5 12.2
8.5 14.2 10.6 8.1 9.4 8.6 2.2 8.2 5.4
Denmark 14.5 16.3 15.4 11.1 19.7 15.0 19.2 16.2 18.0 10.1 11.8 10.8 12.2 24.4 18.6 7.2 14.5 10.5
Estonia
13.7 4.4 9.6 21.0 9.8 16.0 8.9 13.3 11.0 13.0 6.6 10.1 18.6 11.1 15.2
Finland 2.7 4.3 3.5 5.6 7.8 6.6 0.9 4.8 2.6 4.7 4.8 4.7 8.1 2.7 5.2 8.6 9.0 8.8
France 4.3 4.6 4.4 3.3 2.8 3.0 1.6 6.1 3.5 2.3 5.6 4.0 11.5 5.4 8.3 Germany 13.2 14.6 13.9 20.0 17.5 18.8 16.6 6.2 12.1 15.8 14.0 15.1 20.8 10.1 16.0 14.5 15.0 14.7
Greece 6.5 7.4 6.8 3.3 0.5 1.9
8.2 1.0 5.0 9.3 4.5 7.1 Hungary 7.5 1.7 5.1 14.0 5.4 9.6 7.1 11.5 9.0 6.0 11.5 8.8 5.8 7.2 6.4 5.3 6.7 6.0
Iceland
3.1 7.0 5.3
12.3 14.9 13.6
Ireland 3.5 5.4 4.5 8.2 4.1 6.0 9.8 5.2 7.6 1.3 6.7 3.9 8.0 2.2 5.4 3.4 6.4 4.7
Israel 10.2 12.9 11.5
6.8 3.3 6.1 6.2 14.4 11.0 8.8 3.4 6.4
Italy 6.9 1.7 5.1 9.8 0.8 6.0 Kosovo
15.8 20.3 16.9
Latvia
12.5 10.2 11.3 11.2 13.4 12.0 Lithuania
15.7 8.5 12.8 4.8 3.0 3.9
Luxembourg 4.8 4.0 4.3 4.1 3.7 4.0 Netherlands 7.6 3.7 5.7 6.5 10.2 8.4 11.4 8.4 9.9 12.7 6.2 9.0 12.9 7.7 10.0 7.1 12.7 10.3
Norway 6.2 6.1 6.1 6.1 7.1 6.6 8.7 7.2 7.9 4.4 7.0 5.7 11.2 9.1 10.2 10.5 15.1 12.4
Poland 9.7 3.4 7.0 6.1 7.3 6.6 6.3 6.3 6.3 5.1 13.2 8.6 10.9 6.4 9.0 8.5 8.3 8.4
Portugal 10.1 4.8 7.8 8.3 2.7 5.5 3.8 3.9 3.8 2.9 4.6 3.7 3.4 0.9 2.0 5.0 0.0 2.5
Romania
10.0 14.9 12.2 9.6 14.9 12.3 Russia
11.3 13.4 12.3 10.7 6.2 8.7 8.9 9.8 9.3 7.3 6.0 6.7
Slovakia
8.7 13.6 10.1 13.6 9.3 11.8 8.0 8.2 8.1 7.2 2.5 5.1 2.3 0.0 1.0
Slovenia 5.0 8.5 6.6 4.0 4.3 4.0 4.3 1.9 3.3 3.6 5.9 4.4 7.0 7.0 7.0 4.5 0.0 2.5
Spain 7.4 1.7 4.8 8.9 5.5 7.4 7.1 5.0 6.2 8.6 7.2 7.9 4.9 7.1 6.1 2.1 5.7 3.7
Sweden 5.4 8.0 6.5 3.9 7.2 5.4 3.3 3.4 3.4 6.3 6.0 6.2 4.9 3.6 4.3 8.0 6.4 7.2
Switzerland 6.9 5.9 6.4 8.3 3.7 6.2 17.0 15.3 16.1 1.2 2.5 1.8 13.4 6.5 10.4 14.9 6.8 11.3
Turkey
5.9 5.8 5.9
0.4 2.7 1.1 UK 6.0 4.4 5.1 2.5 4.9 3.7 8.4 9.6 9.0 7.1 10.4 9.0 2.7 1.9 2.3 6.2 2.6 4.0
Ukraine
7.5 10.5 8.7 6.4 10.2 8.2 11.1 19.8 15.0 7.2 9.0 7.9
Source: ILO calculations based on the European Social Survey (Norwegian Social Science Data Services, 2002; 2004; 2006; 2008; 2010; 2012).

31


