+ All Categories
Home > Documents > Skills Practice - PBworkskeinathstems.pbworks.com/f/Georgia Mathematics 2 Teacher's Skills... ·...

Skills Practice - PBworkskeinathstems.pbworks.com/f/Georgia Mathematics 2 Teacher's Skills... ·...

Date post: 11-Aug-2018
Category:
Upload: tranthuy
View: 333 times
Download: 0 times
Share this document with a friend
36
Chapter 11 l Skills Practice 571 © 2009 Carnegie Learning, Inc. 11 Skills Practice Skills Practice for Lesson 11.1 Name _____________________________________________ Date ____________________ Mia’s Growing Like a Weed Drawing the Line of Best Fit Vocabulary Define each term in your own words and sketch an example. 1. scatter plot A scatter plot is a graph of ordered pairs of data points. 2. line of best fit A line of best fit is the line that is as close as possible to the points on a scatter plot. The line does not need to pass through each point. y x 7 9 10 8 6 4 5 3 2 1 9 8 3 4 5 7 6 1 10 0 2 y x 7 9 10 8 6 4 5 3 2 1 9 8 3 4 5 7 6 1 10 0 2
Transcript

Chapter 11 l Skills Practice 571

© 2

009 C

arn

eg

ie L

earn

ing

, In

c.

11

Skills Practice Skills Practice for Lesson 11.1

Name _____________________________________________ Date ____________________

Mia’s Growing Like a WeedDrawing the Line of Best Fit

Vocabulary Define each term in your own words and sketch an example.

1. scatter plot

A scatter plot is a graph of ordered pairs of data points.

2. line of best fit

A line of best fit is the line that is as close as possible to the points on a scatter plot. The line does not need to pass through each point.

y

x

7

9

10

8

6

4

5

3

2

1

983 4 5 761 10 0 2

y

x

7

9

10

8

6

4

5

3

2

1

983 4 5 761 10 0 2

572 Chapter 11 l Skills Practice

© 2

009 C

arn

eg

ie L

earn

ing

, In

c.

11

Problem Set Write the rows of each table as a list of ordered pairs.

1. 2.

x y x y

�2 �6 �2 �2

�1 �3 �1 �3

0 0 0 �4

1 3 1 �5

2 6 2 �6

(�2, �6), (�1, �3), (0, 0), (1, 3), (2, 6) (�2, �2), (�1, �3), (0, �4), (1, �5), (2, �6)

3. 4.

x y x y

1 0 4 1

2 4 1 4

3 6 �2 5

4 8 �5 7

9 10 �7 10

(1, 0), (2, 4), (3, 6), (4, 8), (9, 10) (4, 1), (1, 4), (�2, 5), (�5, 7), (�7, 10)

Create a scatter plot of each data set.

5. (1, 2), (3, 4), (5, 6), (6, 6), (7, 8), (8, 9) 6. (0, 3), (1, 4), (6, 4), (3, 3), (2, 5), (9, 9)

y

x

7

9

10

8

6

4

5

3

2

1

983 4 5 761 10 0 2

y

x

7

9

10

8

6

4

5

3

2

1

983 4 5 761 10 0 2

Chapter 11 l Skills Practice 573

© 2

009 C

arn

eg

ie L

earn

ing

, In

c.

Name _____________________________________________ Date ____________________

11

7. (1, 8), (4, 4), (5, 3), (3, 7), (2, 5), (8, 0) 8. (9, 0), (8, 2), (1, 9), (4, 5), (3, 8), (6, 4)

y

x

7

9

10

8

6

4

5

3

2

1

983 4 5 761 10 0 2

y

x

7

9

10

8

6

4

5

3

2

1

983 4 5 761 10 0 2

9.

x y

�7 5

�4 3

�3 2

0 �2

4 �4

6 �7

10.

x y

�8 �7

�4 �2

�1 0

0 3

2 6

8 9

y

x64–6 –4 –2 20

4

6

8

2

–4

–2

–6

–8

–10

–10 10

10

8–8

y

x64–6 –4 –2 20

4

6

8

2

–4

–2

–6

–8

–10

–10 10

10

8–8

574 Chapter 11 l Skills Practice

© 2

009 C

arn

eg

ie L

earn

ing

, In

c.

11

Draw a line that best fits the data on the scatter plot. Then write the equation of the line of best fit.

11. y

x32–3 –2 –1 10

2

3

4

5

1

–2

–1

–3

–4

–5

–5 54–4

The equation should be close to y � 0.57x � 1.26.

12. y

x32–3 –2 –1 10

2

3

4

5

1

–2

–1

–3

–4

–5

–5 54–4

The equation should be close to y � 1.36 � 0.78.

Chapter 11 l Skills Practice 575

© 2

009 C

arn

eg

ie L

earn

ing

, In

c.

Name _____________________________________________ Date ____________________

11

13. y

6 84–6–8

6

8

–4 –2 2x

2

–2

–4

–6

–8

–10

–10

10

10

4

0

The equation should be close to y � �1.75x � 2.75.

14. y

6 84–6–8

6

8

–4 –2 2x

2

–2

–4

–6

–8

–10

–10

10

10

4

0

The equation should be close to y � �0.36x � 2.35.

576 Chapter 11 l Skills Practice

© 2

009 C

arn

eg

ie L

earn

ing

, In

c.

11

Use each scatter plot and line of best fit to answer the questions.

15. The scatter plot below shows the amount of time 13 students spent studying for

a test and their test scores. The line that best fits the data is also shown, and its

equation is y � 0.28x � 48.16. Predict the test score of a student who studies for

45 minutes.

0.28(45) � 48.16 � 12.6 � 48.16 � 60.76

The test score for a student who studies 45 minutes will be

about 61%.

16. A marketing company tested the relationship between cost and sales of a sports

line of sweatshirts. The scatter plot below shows the findings. The line that best fits

the data is also shown. Its equation is y � �0.81x � 58.41. Predict the number of

sweatshirts sold daily when the price of each sweatshirt is set at $29.

�0.81(29) � 58.41 � �23.49 � 58.41 � 34.92

There should be about 35 sweatshirts sold daily when the price of a sweatshirt is set at $29.

y

x

70

90

100

80

60

40

50

30

20

10

180160140120100806040200 200

Time spent studying (minutes)

Test

Sco

re (

perc

ent)

y

x

35

45

50

40

30

20

25

15

10

5

454035302520151050 50

Price per Sweatshirt (dollars)

Num

ber

of S

wea

tshi

rts

per

Day

Chapter 11 l Skills Practice 577

© 2

009 C

arn

eg

ie L

earn

ing

, In

c.

Name _____________________________________________ Date ____________________

11

17. The scatter plot below shows the weights in pounds of 12 middle-age adult

males and their systolic blood pressures. (Systolic blood pressure is measured in

millimeters of mercury, or mm Hg.) The line that best fits the data is also shown,

and its equation is y � 0.56x � 34.48. Predict the systolic blood pressure of a

middle-age adult male who weighs 180 pounds.

0.56(180) � 34.48 � 100.8 � 34.48 � 135.28

The systolic blood pressure for a middle-age adult male who weighs 180 pounds will be about 135 mm Hg.

18. The scatter plot below shows last year’s grade point averages (GPAs) for 10 students and

the number of days they were absent from school last year. The line that best fits the data

is also shown, and its equation is y � �0.11x � 3.59. Predict the GPA of a student who

misses 10 days of school in a year.

�0.11(10) � 3.59 � �1.1 � 3.59 � 2.49

The GPA of a student who misses 10 days of school will be about 2.5.

x10075

20

40

60

80

125 150 175

Sys

tolic

Blo

od P

ress

ure

(mm

Hg)

Weight (pounds)200 225 2505025

y

100

120

140

160

180

200

0

x129

0.4

0.8

1.2

1.6

15 18 21

GP

A

Number of Days Absent from School24 27 3063

y

2.0

2.4

2.8

3.2

3.6

4.0

0

578 Chapter 11 l Skills Practice

© 2

009 C

arn

eg

ie L

earn

ing

, In

c.

11

Chapter 11 l Skills Practice 579

© 2

009 C

arn

eg

ie L

earn

ing

, In

c.

11

Skills Practice Skills Practice for Lesson 11.2

Name _____________________________________________ Date ____________________

Stroop TestPerforming an Experiment

Vocabulary Answer the following question in your own words.

1. In a Stroop Test, how are a matching list and a non-matching list related?

A Stroop Test measures the time it takes a person to read a list of color words (red, green, blue, and black). In a matching list, the color name is written in the same color ink as the color word. In a non-matching list, the color name is written in ink that is a different color than the color word.

Problem Set Write the rows of each table as a list of ordered pairs.

1. 2.

x y x y

�5 5 �6 �5

�3 3.4 �8 �9

�1 1.8 5 0

1 0.2 3 5

3 �1.4 1 4

(�5, 5), (�3, 3.4), (�1, 1.8), (�6, �5), (�8, �9), (5, 0), (1, 0.2), (3, �1.4) (3, 5), (1, 4)

580 Chapter 11 l Skills Practice

© 2

009 C

arn

eg

ie L

earn

ing

, In

c.

11

3. 4.

x y x y

–1 –1 –4 –7.5

6 5 –2 –3.5

3 1 0 0

8 9 2 4.5

–3 –3 4 8.5

(�1, �1), (6, 5), (3, 1), (8, 9), (�4, �7.5), (�2, �3.5), (0, 0), (�3, �3) (2, 4.5), (4, 8.5)

Create a scatter plot of each data set.

5. (1, 2), (3, 3), (4, 4), (6, 5), (8, 6), (9, 8) 6. (1, 7), (2, 7), (4, 6), (6, 5), (9, 4), (10, 2)

y

x

7

9

10

8

6

4

5

3

2

1

9876543210 10

y

x

7

9

10

8

6

4

5

3

2

1

9876543210 10

Chapter 11 l Skills Practice 581

© 2

009 C

arn

eg

ie L

earn

ing

, In

c.

Name _____________________________________________ Date ____________________

11

7. (�3, �6), (�2, �4), (�6, 5), (3, 1), 8. (�6, 7), (�8, 8), (2, �3), (0, 1),

(2, 4), (8, 7) (4, �4), (6, �8)

y

x64–6 –4 –2 20

4

6

8

2

–4

–2

–6

–8

–10

–10 10

10

8–8

y

x64–6 –4 –2 20

4

6

8

2

–4

–2

–6

–8

–10

–10 10

10

8–8

9.

x y

�8 6

�4 3

�3 1

0 �3

4 �4

8 �6

10.

x y

�9 �4

�7 �2

�4 0

0 1

4 3

8 4

y

x64–6 –4 –2 20

4

6

8

2

–4

–2

–6

–8

–10

–10 10

10

8–8

y

x64–6 –4 –2 20

4

6

8

2

–4

–2

–6

–8

–10

–10 10

10

8–8

582 Chapter 11 l Skills Practice

© 2

009 C

arn

eg

ie L

earn

ing

, In

c.

11

Draw a line that best fits the data on the scatter plot. Then write the equation of the line of best fit.

11. 12.

y

x32–3 –2 –1 10

2

3

4

1

–2

–1

–3

–4

–5

–5 5

5

4–4

y

x32–3 –2 –1 10

2

3

4

1

–2

–1

–3

–4

–5

–5 5

5

4–4

The equation should be close to The equation should be close y � �0.71x � 0.65. to y � �1.53x � 1.66

13. 14. y

6 84–6–8

6

8

–4 –2 2x

2

–2

–4

–6

–8

–10

–10

10

10

4

0

y

6 84–6–8

6

8

–4 –2 2x

2

–2

–4

–6

–8

–10

–10

10

10

4

0

The equation should be The equation should be close close to y � 0.67x � 1.34. to y � 0.34x � 4.6.

Chapter 11 l Skills Practice 583

© 2

009 C

arn

eg

ie L

earn

ing

, In

c.

Name _____________________________________________ Date ____________________

11

Use each scatter plot and line of best fit to answer the questions.

15. The scatter plot below shows the systolic blood pressures and ages of 13 people.

(Systolic blood pressure is measured in millimeters of mercury, or mm Hg.) The line

that best fits these data is also shown, and its equation is y � 1.05x � 97.23.

Predict a person’s systolic blood pressure if that person is 70 years old.

70 � 1.05x � 97.23

167.23 � 1.05x

159.3 � x

The systolic blood pressure for a person who is 70 years old would be about 159 mm Hg.

16. A survey of 15 people were asked the average number of hours of television each

person viewed per day. This scatter plot shows the results. The line that best fits

these data is also shown, and its equation is y � 0.05x � 1.55. Predict the age of a

person who watches 5 hours of television daily.

y � 0.05x � 1.55

5 � 0.05x � 1.55

3.45 � 0.05x

69 � x

A person who watches 5 hours of television per day would be about 69 years old.

y

x

70

90

100

80

60

40

50

30

20

10

1441281129680644832160 160

Systolic Blood Pressure (mm Hg)

Age

(ye

ars)

y

x

4

5

5.5

4.5

3.5

2.5

3

2

1.5

1

9080706050403020100 100

Age (years)

Tele

visi

on p

er D

ay (

hour

s)

584 Chapter 11 l Skills Practice

© 2

009 C

arn

eg

ie L

earn

ing

, In

c.

11

17. A survey of 10 people were asked the number of years they completed college and their

annual salary. The scatter plot shows the results of the survey. The line that best fits these

data is also shown, and its equation is y � 12,191.54x � 12,218.91. Predict the annual

salary of a person who completed 5 years of college.

x43

20,000

40,000

60,000

80,000

5 6 7

Ann

ual S

alar

y (d

olla

rs)

Number of Years of College Completed8 9 1021

y

100,000

120,000

140,000

160,000

180,000

200,000

0

12,191.54(5) � 12,218.91 � 60,957.7 � 12,218.91 � 73,176.61

The annual salary of a person who completed 5 years of college would be about $73,176.61.

18. The scatter plot below shows the various prices for raffle tickets and the number of

tickets sold at that price. The line that best fits the data is also shown, and its equation is

y � �0.05x � 21.57. Predict the number of $30 raffle tickets that would sell.

x200150

5

10

15

20

250 300 350

Tic

ket P

rice

(dol

lars

)

Number of Tickets Sold400 450 50010050

y

25

30

35

40

45

50

0

�0.05(30) � 21.57 � �1.5 � 21.57 � 20.07

About 20 $30 raffle tickets would sell.

Chapter 11 l Skills Practice 585

© 2

009 C

arn

eg

ie L

earn

ing

, In

c.

11

Skills Practice Skills Practice for Lesson 11.3

Name _____________________________________________ Date ____________________

Where Do You Buy Your Music?Median-Median Line of Best Fit

Vocabulary Define each term in your own words.

1. Median-Median line of best fit

The Median-Median line of best fit is a line of best fit that is used to help minimize the effect of outliers. It is found by dividing the data points into three groups, then using the median points from each group to calculate an equation for the line of best fit.

Problem Set Represent the data in each table as indicated.

1. Represent the data in the table as a set of ordered pairs with the profit as a

function of the number of years since 1980.

Year Profi t (dollars)

1980 5326

1988 6244

1995 7009

2000 8864

2004 10,010

(0, 5326), (8, 6244), (15, 7009), (20, 8864), (24, 10,010)

2. Represent the data in the table as a set of ordered pairs with the fee as a

function of income over $10,000.

Income ($) Fee ($)

10,000 42

12,500 56

16,000 77

22,000 126

22,500 154

(0, 42), (2500, 56), (6000, 77), (12,000, 126), (12,500, 154)

586 Chapter 11 l Skills Practice

© 2

009 C

arn

eg

ie L

earn

ing

, In

c.

11

3. Represent the data in the table as a set of ordered pairs with the number of

students as a function of height over 60 inches.

Height(inches)

Number of Students

64 3

65 64

67 60

68 54

72 11

78 1

(4, 3), (5, 64), (7, 60), (8, 54), (12, 11), (18, 1)

4. Represent the data in the table as a set of ordered pairs with sales as a function of

the number of years since 1960.

Year Sales

1960 12

1970 1460

1980 3725

1986 15,657

2000 97,899

(0, 12), (10, 1460), (20, 3725), (26, 15,657), (40, 97,899)

Use a graphing calculator to find the median-median line of best fit for each data set. Round decimals to the nearest thousandth.

5. (�3, 5), (0, 2), (3, �4), (6, �8), (�8, 8)

y � �1.25x � 0.417

6. (5, 17), (8, 20), (4, 12), (9, 28), (7, 17), (6, 15)

y � 2.375x � 2.729

7. (1, 70), (2, 75), (3, 72), (4, 66), (8, 15), (9, 15)

y � �8.214x � 89.131

8. (�6, 10), (�3, 4), (�2, 4), (�1, 0), (3, 1), (5, �5)

y � �1.059x � 1.627

Chapter 11 l Skills Practice 587

© 2

009 C

arn

eg

ie L

earn

ing

, In

c.

Name _____________________________________________ Date ____________________

11

9. 10.

x y x y

�9 �4 8 9

�7 �3 1 �1

�1 �1 �5 4

0 0 7 0

3 2 �4 �10

6 4 �3 2

y � 0.52x � 0.36 y � 0.625x � 0.25

11. 12.

x y x y

8 7 5 �5

�6 �3 3 �2

0 3 �3 4

10 9 2 0

�2 0 �8 �1

4 3 7 �6

y � 0.731x � 1.462 y � �0.609x � 1.058

588 Chapter 11 l Skills Practice

© 2

009 C

arn

eg

ie L

earn

ing

, In

c.

11

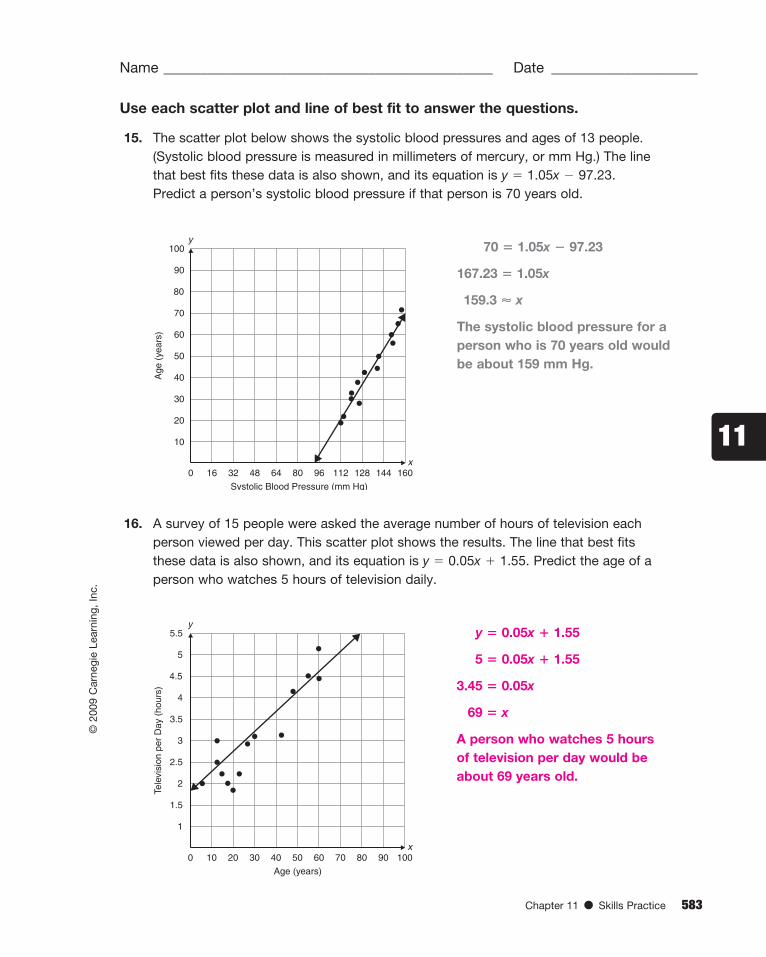
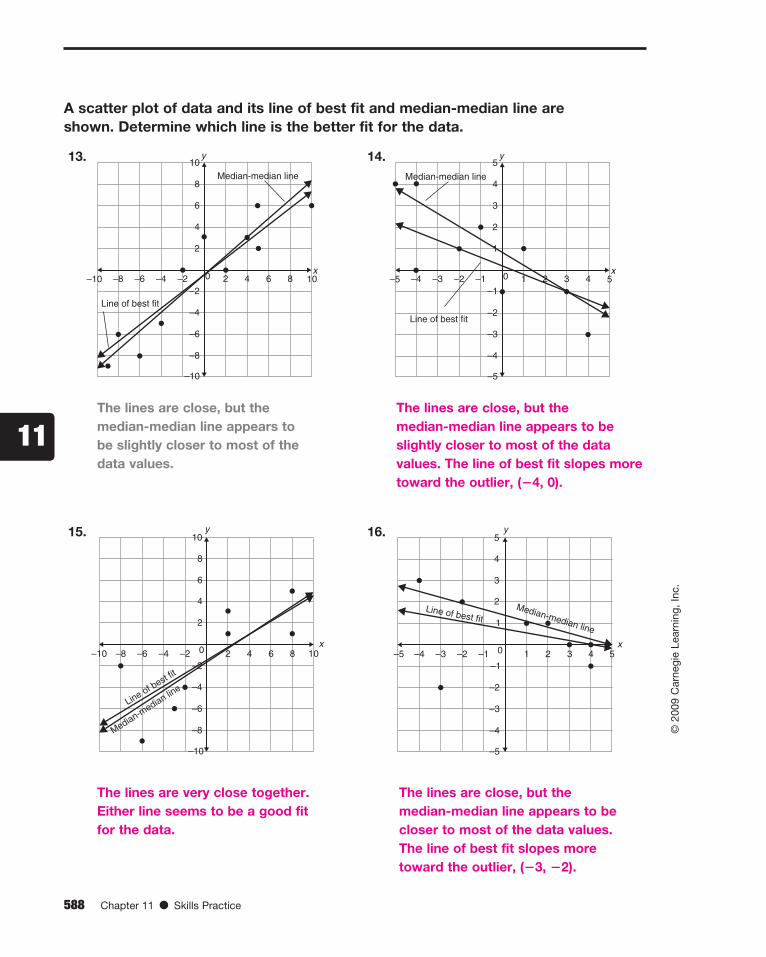
A scatter plot of data and its line of best fit and median-median line are shown. Determine which line is the better fit for the data.

13. 14. y

x64–6 –4 –2 20

4

6

8

2

–4

–2

–6

–8

–10

–10 10

10

8–8

Median-median line

Line of best fit

y

x32–3 –2 –1 10

2

3

4

1

–2

–1

–3

–4

–5

–5 5

5

4–4

Median-median line

Line of best fit

The lines are close, but the median-median line appears to be slightly closer to most of the data values.

The lines are close, but the median-median line appears to be slightly closer to most of the data values. The line of best fit slopes more toward the outlier, (�4, 0).

15. 16.

The lines are very close together. The lines are close, but theEither line seems to be a good fit median-median line appears to befor the data. closer to most of the data values. The line of best fit slopes more toward the outlier, (�3, �2).

y

6 84–6 –4–8

6

8

Line of best fit

Median-median lin

e

–2 2x

2

–2

–4

–6

–8

–10

–10

10

10

4

0

y

3 42–3–4

3

4

–2 –1 1x

1

Median-median line

Line of best fit

–1

–2

–3

–4

–5

–5

5

5

2

0

Chapter 11 l Skills Practice 589

© 2

009 C

arn

eg

ie L

earn

ing

, In

c.

11

Skills Practice Skills Practice for Lesson 11.4

Name _____________________________________________ Date ____________________

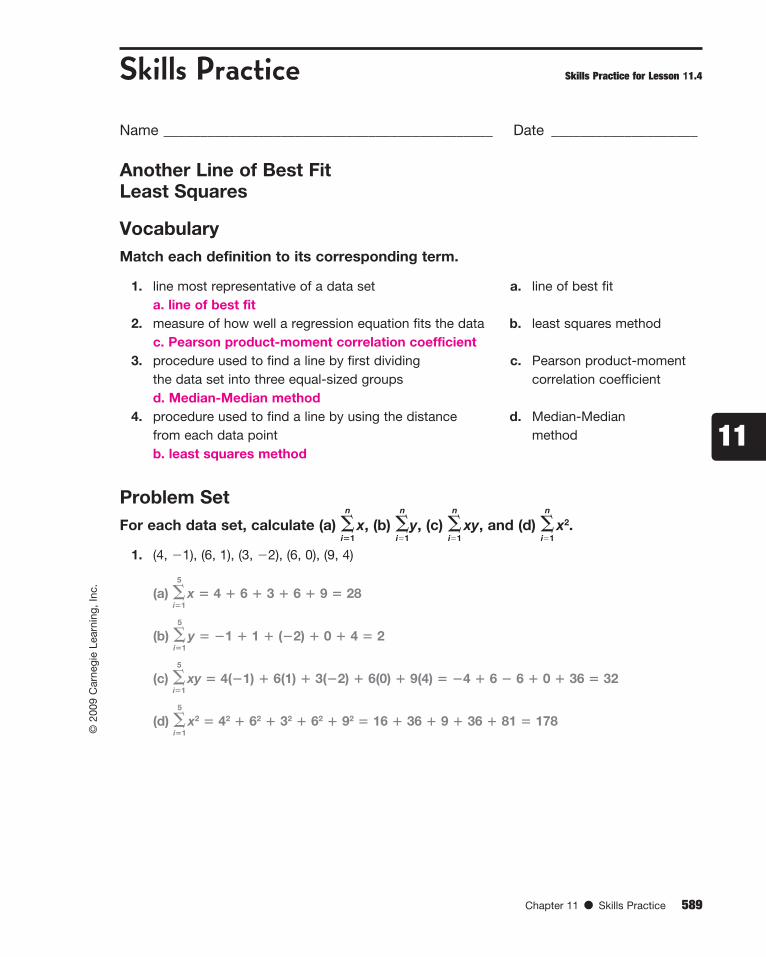
Another Line of Best FitLeast Squares

Vocabulary Match each definition to its corresponding term.

1. line most representative of a data set a. line of best fit a. line of best fit 2. measure of how well a regression equation fits the data b. least squares method c. Pearson product-moment correlation coefficient 3. procedure used to find a line by first dividing c. Pearson product-moment

the data set into three equal-sized groups correlation coefficient

d. Median-Median method 4. procedure used to find a line by using the distance d. Median-Median

from each data point method

b. least squares method

Problem Set For each data set, calculate (a) �

i�1

n

x , (b) � i�1

n

y , (c) � i�1

n

xy , and (d) � i�1

n

x 2 .

1. (4, �1), (6, 1), (3, �2), (6, 0), (9, 4)

(a) � i�1

5

x � 4 � 6 � 3 � 6 � 9 � 28

(b) � i�1

5

y � �1 � 1 � (�2) � 0 � 4 � 2

(c) � i�1

5

xy � 4(�1) � 6(1) � 3(�2) � 6(0) � 9(4) � �4 � 6 � 6 � 0 � 36 � 32

(d) � i�1

5

x 2 � 4 2 � 6 2 � 3 2 � 6 2 � 9 2 � 16 � 36 � 9 � 36 � 81 � 178

590 Chapter 11 l Skills Practice

© 2

009 C

arn

eg

ie L

earn

ing

, In

c.

11

2. (2, –5), (8, –6), (3, 3), (0, 7), (–7, 4)

(a) � i�1

5

x � 2 � 8 � 3 � 0 � (�7) � 6

(b) � i�1

5

y � �5 � (�6) � 3 � 7 � 4 � 3

(c) � i�1

5

xy � 2(�5) � 8(�6) � 3(3) � 0(7) � (�7)(4) � �10 � 48 � 9 � 0 � 28 � �77

(d) � i�1

5

x 2 � 22 � 8 2 � 3 2 � 0 2 � (�7) 2 � 4 � 64 � 9 � 0 � 49 � 126

3. (5, �5), (�2, 2), (0, �4), (3, 8), (6, 7), (8, 9)

(a) � i�1

6

x � 5 � (�2) � 0 � 3 � 6 � 8 � 20

(b) � i�1

6

y � �5 � 2 � (�4) � 8 � 7 � 9 � 17

(c) � i�1

6

xy � 5(�5) � (�2)(2) � 0(�4) � 3(8) � 6(7) � 8(9) � �25 � 4 � 0 � 24 � 42 � 72

� 109

(d) � i�1

6

x 2 � 5 2 � (�2) 2 � 0 2 � 3 2 � 6 2 � 8 2 � 25 � 4 � 0 � 9 � 36 � 64 � 138

4. (�6, 4), (3, 1), (8, �2), (6, 9), (�4, 6), (1, 3)

(a) � i�1

6

x � (�6) � 3 � 8 � 6 � (�4) � 1 � 8

(b) � i�1

6

y � 4 � 1 � (�2) � 9 � 6 � 3 � 21

(c) � i�1

6

xy � (�6)(4) � 3(1) � 8(�2) � 6(9) � (�4)(6) � 1(3) � �24 � 3 � 16 � 54 � 24 � 3 � �4

(d) � i�1

6

x 2 � (�6) 2 � 3 2 � 8 2 � 6 2 � (�4) 2 � 1 2 � 36 � 9 � 64 � 36 � 16 � 1 � 162

Use a calculator to determine the equation for the linear regression line for each data set. Round decimals to the nearest hundredth. Identify the correlation coefficient of the line of best fit.

5. (�8, 3), (�5, 1.5), (0, �0.5), (2.5, �1), (3, �1), (6, �2)

y � �0.35x � 0.09; r � �0.99

Chapter 11 l Skills Practice 591

© 2

009 C

arn

eg

ie L

earn

ing

, In

c.

Name _____________________________________________ Date ____________________

11

6. (�4, 3), (0, �3), (�3, 1), (4, �4), (8, �6), (6, �2)

y � �0.59x � 0.76; r ��0.87

7. (2, �5), (8, �6,), (3, 3), (0, 7), (�7, 4), (9, �3)

y � �0.61x � 1.53; r � �0.67

8. (�5, �2.5), (�3, �6.4), (�1, 4.2), (1, 1.8), (3, �3.4), (5, 5)

y � 0.63x � 0.22; r � 0.52

9. 10.

x y x y

�7 �9 �6 �10

�4 �2 �1 �8

0 2 0 �1

1 3 2 6

3 4 3 5

9 6 8 6

y � 0.89x � 0.37; r � 0.92 y � 1.34x � 1.68; r � 0.86

11. 12.

x y x y

�6.2 �4.2 �9 8.6

�5 3 �5 7.2

�3.6 2.6 0 6.1

0.8 2 3 2

2.6 �1 8 �5.9

7 �8.6 10 �12.8

y � �0.49x � 1.40; r � �0.55 y � �1.07x � 2.11; r � �0.92

For each line of best fit, identify the slope and y-intercept.

13. y � �0.35x � 0.09

slope � �0.35, y-intercept � �0.09

14. y � 3x � 2.7

slope � 3, y-intercept � 2.7

592 Chapter 11 l Skills Practice

© 2

009 C

arn

eg

ie L

earn

ing

, In

c.

11

15. y � 1.46x � 13.8

slope � 1.46, y-intercept � 13.8

16. y � �0.2 x � 8.15

slope � �0.2, y-intercept � �8.15

17. y � �1.89x � 0.98

slope � �1.89, y-intercept � 0.98

18. y � 2.6x � 28.5

slope � 2.6, y-intercept � �28.5

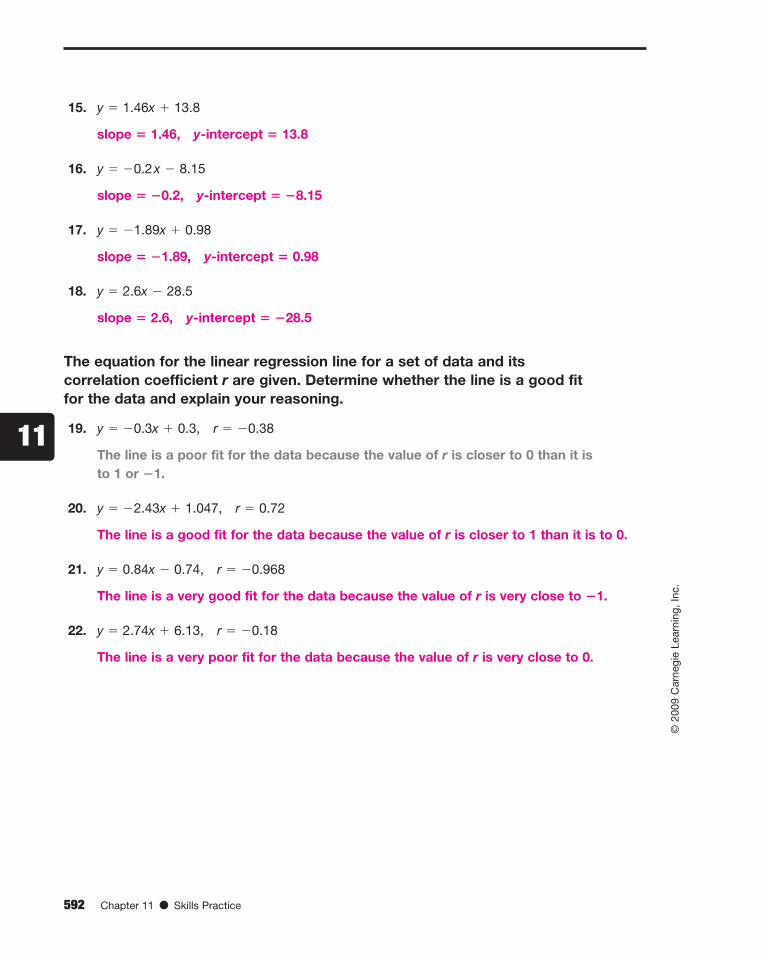
The equation for the linear regression line for a set of data and its correlation coefficient r are given. Determine whether the line is a good fit for the data and explain your reasoning.

19. y � �0.3x � 0.3, r � �0.38

The line is a poor fit for the data because the value of r is closer to 0 than it is to 1 or �1.

20. y � �2.43x � 1.047, r � 0.72

The line is a good fit for the data because the value of r is closer to 1 than it is to 0.

21. y � 0.84x � 0.74, r � �0.968

The line is a very good fit for the data because the value of r is very close to �1.

22. y � 2.74x � 6.13, r � �0.18

The line is a very poor fit for the data because the value of r is very close to 0.

Chapter 11 l Skills Practice 593

© 2

009 C

arn

eg

ie L

earn

ing

, In

c.

11

Skills Practice Skills Practice for Lesson 11.5

Name _____________________________________________ Date ____________________

Human Chain: Wrist ExperimentUsing Technology to Find a Linear Regression Equation, Part 1

Vocabulary Define each term in your own words.

1. least squares method

The least squares method is a method that uses the distance from each data point to find a line of best fit.

2. linear regression equation

A linear regression equation is the line of best fit, or the line that is used to best approximate data.

3. correlation coefficient

The correlation coefficient indicates how close data are to forming a straight line. The correlation coefficient is represented by the variable r. A value close to 1 or �1 indicates a strong correlation. A value close to 0 indicates a weak correlation.

594 Chapter 11 l Skills Practice

© 2

009 C

arn

eg

ie L

earn

ing

, In

c.

11

Problem Set

Write the linear regression equation based on the output shown from a graphing calculator. Round decimals to the nearest hundredth.

1. LinReg

y � ax � b

a � .8689320388

b � .7766990291

r2 � .9369809334

r � .9679777546

2. LinReg

y � ax � b

a � 3.016129032

b � �6.612903226

r2 � .9738808345

r � .9868540087

y � 0.87x � 0.78 y � 3.02x � 6.61

3. LinReg

y � ax � b

a � �.5145985401

b � 9.755474453

r2 � .98051884

r � �.9902115128

4. LinReg

y � ax � b

a � �4.855947955

b � �.9423791822

r2 � .9918814725

r � �.9959324638

y � �0.51x � 9.76 y � �4.86x � 0.94

Chapter 11 l Skills Practice 595

© 2

009 C

arn

eg

ie L

earn

ing

, In

c.

Name _____________________________________________ Date ____________________

11

Use a calculator to determine the linear regression equation for the data. Round decimal answers to the nearest hundredth.

5 . 6.

x y x y

�6 �30 �8 8

4 9 �5 6

�2 �16 �2 3

5 13 0 2

9 29 1 1

y � 3.97x � 6.94 y � �0.78x � 1.80

7. (6, �18), (14, �49), (�12, 52), (1, 2) 8. (0, �20), (2, �23), (�8, �7), (14, �41)

y � �3.89x � 5.50 y � �1.54x � 19.67

Identify the slope and y-intercept from the given regression equation. Then determine what the slope and y-intercept mean in the problem situation.

9. The number of students from East Valley High School who have enrolled in college

after graduating from high school can be modeled by the linear regression equation

y � 3x � 10, where y represents the number of students and x represents the

number of years since 1970.

The slope is 3. This means that each year 3 more students from East Valley High School enroll in college after graduating. The y-intercept is 10. This means that in the year 1970, or at x � 0, 10 students from East Valley High School enrolled in college after graduating.

10. The number of T-shirts a band sells during a concert can be modeled by the linear

regression equation y � 0.55x � 26.8, where y represents the number of T-shirts

sold and x represents the concert attendance.

The slope is 0.55. This means for each additional person who attends a concert, the band sells 0.55 additional T-shirts. Or, you can say that for each additional two people who attend a concert, the band sells one additional T-shirt.The y-intercept is �26.8. This means if no one attends a concert, the band would sell �26.8 T-shirts. This value does not make sense in the context of the problem.

596 Chapter 11 l Skills Practice

© 2

009 C

arn

eg

ie L

earn

ing

, In

c.

11

11. A company’s revenue can be modeled by the linear regression equation

y � �1000x � 26,000, where y represents the revenue in dollars and x represents

the number of years since the company began.

The slope is �1000. This means that each year, the company loses $1000. The y-intercept is 26,000. This means that when the company began, or at x � 0, the revenue was $26,000.

12. The number of trees in a forest can be modeled by the linear regression equation

y � �20x � 2400, where y represents the number of trees and x represents the

number of years since 1980.

The slope is �20. This means that each year, there are 20 fewer trees in the forest. The y-intercept is 2400. This means that in the year 1980, or at x � 0, there were 2400 trees in the forest.

Use the given regression equation to answer each question.

13. The length of an elephant’s tusks can be modeled by the linear regression equation

y � 5.1x � 2.5, where y represents the tusk length in centimeters and x represents

the age of the elephant in years. What is the approximate length of an elephant’s

tusks if the elephant is 30 years old?

y � 5.1(30) � 2.5

y � 150.5

The length of a 30-year-old elephant’s tusks is 150.5 centimeters.

14. The height of a pine tree can be modeled by the linear regression equation

y � 16x � 10, where y represents the height of the pine tree in inches and

x represents the number of years since you planted the tree as a seedling.

When will the pine tree be 130 inches tall?

16x � 10 � 130

x � 7.5

The pine tree will be 130 inches tall 7.5 years after you planted the seedling.

Chapter 11 l Skills Practice 597

© 2

009 C

arn

eg

ie L

earn

ing

, In

c.

Name _____________________________________________ Date ____________________

11

15. The number of typewriters manufactured by a company can be modeled by the

linear regression equation y � �27x � 1000, where y represents the number of

typewriters manufactured each year and x represents the number of years since

1970. When will the company manufacture 100 typewriters?

�27x � 1000 � 100

x � 33.3

The company will manufacture 100 typewriters about 33.3 years after 1970, or in 2003.

16. The amount of water in a water cooler in an office can be modeled by the linear

regression equation y � �2.1x � 640, where y represents the amount of water in

the cooler in ounces and x represents the number of minutes since the water cooler

was filled. How much water is in the water cooler 1 hour after it is filled?

y � �2.1(60) � 640 y � 514 There are 514 ounces of water in the water cooler one hour after it is filled.

A scatter plot and its linear regression equation are shown. Determine whether the correlation coefficient r is closest to 1, 0.5, 0, �0.5, or �1.

17. 18.

The correlation coefficient is The correlation coefficient is closest to �1. closest to 1.

y

x

7

9

10

8

6

4

5

3

2

1

9876543210 10

y

x32–3 –2 –1 10

2

3

4

1

–2

–1

–3

–4

–5

–5 5

5

4–4

598 Chapter 11 l Skills Practice

© 2

009 C

arn

eg

ie L

earn

ing

, In

c.

11

19. 20.

The correlation coefficient The correlation coefficient is is closest to 0.5. closest to 0.

y

x32–3 –2 –1 10

2

3

4

1

–2

–1

–3

–4

–5

5 6

5

4–4

y

x–7 –6 –5 0

1

–5

–4

–6

–7

–2

–1

–3

–8

1 2

2

–8 –3 –2 –1–4

Chapter 11 l Skills Practice 599

© 2

009 C

arn

eg

ie L

earn

ing

, In

c.

11

Skills Practice Skills Practice for Lesson 11.6

Name _____________________________________________ Date ____________________

Human Chain: Shoulder ExperimentUsing Technology to Find a Linear Regression Equation, Part 2

Vocabulary Write the term that best completes each statement.

1. A method commonly used by calculators and spreadsheets that uses the

distance from each data point to find the line of best fit is called the

least squares method .

2. A linear regression equation is the equation found when using the least

squares method for a line of best fit.

3. When using a calculator to determine a linear regression equation, the variable r is

the correlation coefficient .

4. In the linear regression equation y � ax � b; the variable a is the

slope of the line .

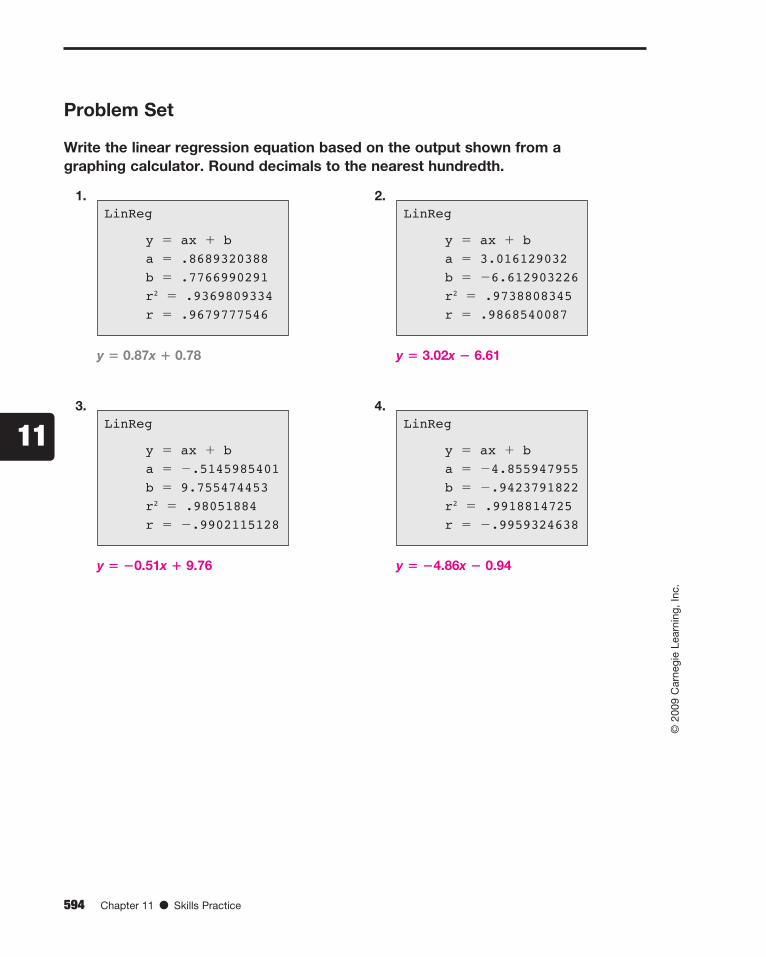
Problem Set Use a calculator to determine the linear regression equation for each data set. Round decimals to the nearest hundredth. Identify the correlation coefficient of the regression line.

1. (�2, 10), (�1, �1), (0, �8), (1, �15), (2, �21), (3, �25)

y � �6.91x � 6.54; r � �0.99

2. (2.5, 7), (�1.7, 1), (0, 6), (5, 10), (7, 9.8), (4, 5.6)

y � 0.89x � 4.07; r � 0.87

3. (2, 1.2), (1, �2.6), (4, 8.9), (�5, �9), (8, 22.8), (�2, �5.6)

y � 2.45x � 0.65; r � 0.96

4. (3, 12), (�2, �10), (7, 30), (�1, 0), (4, 13), (8, 32)

y � 3.99x � 0.21; r � 0.99

600 Chapter 11 l Skills Practice

© 2

009 C

arn

eg

ie L

earn

ing

, In

c.

11

5. 6.

x y x y

3 6 7 6

1 2 1 10

�2 �1 �2 �5

0 1 �1 5

5 8 5 10

�3 �2 �4 �2

y � 1.29x � 1.47; r � 0.99 y � 1.01x � 2.99; r � 0.69

7. 8.

x y x y

8 �7 6 �28

2 �10 4 �14

�2 6 2 4

0 4 �4 18

�3 9 �2 0

1 �3 �8 21

y � �1.54x � 1.37; r � �0.79 y � �3.27x � 0.92; r � �0.92

For each linear regression equation, identify the slope and y-intercept.

9. y � �6.91x � 6.54

slope � �6.91, y-intercept � �6.54

10. y � �0.57x � 1.36

slope � �0.57, y-intercept � �1.36

11. y � x � 1.56

slope � 1, y-intercept � 1.56

12. y � 1.15x � 0.72

slope � 1.15, y-intercept � 0.72

Chapter 11 l Skills Practice 601

© 2

009 C

arn

eg

ie L

earn

ing

, In

c.

Name _____________________________________________ Date ____________________

11

13. y � 4.98x � 8.7

slope � 4.98, y-intercept � 8.7

14. y � 4.98x

slope � 4.98, y-intercept � 0

Use each linear regression equation to answer the questions.

15. The average temperature during a baseball game and the number of bottles

of water that the vendors sell during the game can be modeled by the linear

regression equation y � 9x � 338, where x represents the average temperature in

degrees Fahrenheit and y represents the number of bottles of water sold. Predict

the number of bottles of water that will be sold during the next baseball game if the

average temperature is expected to be 72 degrees Fahrenheit.

9(72) � 338 � 648 � 338 � 310

If the average temperature is 72 degrees Fahrenheit, the vendors can expect to sell 310 bottles of water during the game.

16. The height and shoe size of a given group of adult men can be modeled by the

linear regression equation y � 0.53x � 24.68, where x represents the height in

inches and y represents the shoe size. Predict the shoe size to the nearest half-size

of an adult man in the group who is 5 feet and 8 inches tall.

5 feet and 8 inches � 68 inches tall

0.53(68) � 24.68 � 36.04 � 24.68 � 11.36

The shoe size of an adult man in the group who is 5 feet and 8 inches tall is likely to be about 11 1 __

2 .

17. The chance of precipitation given by a local weather forecaster on a particular day

and the number of golfers on a golf course that day can be modeled by the linear

regression equation y � �0.2x � 103, where x represents the number of golfers

on the golf course and y represents the chance of precipitation that day, written as

a percent. Predict the number of golfers that will be on the golf course when the

weather forecaster stated that the chance of rain is 10%.

10 � �0.2x � 103

�93 � �0.2x

465 � x

According to the model, if there is a 10% chance of rain, there will be 465 golfers on the golf course.

602 Chapter 11 l Skills Practice

© 2

009 C

arn

eg

ie L

earn

ing

, In

c.

11

18. The temperature in a controlled laboratory and the frequency of cricket chirps can

be modeled by the linear regression equation y � 3.6x � 28.2, where x represents

the number of cricket chirps per second and y represents the temperature

in degrees Fahrenheit. Predict the frequency of the cricket chirps when the

temperature in the laboratory is 80 degrees Fahrenheit.

80 � 3.6x � 28.2

51.8 � 3.6x

14.39 � x

According to the model, if the temperature in the laboratory is 80 degrees Fahrenheit, the crickets will chirp at a frequency of about 14.39 times per second.

Chapter 11 l Skills Practice 603

© 2

009 C

arn

eg

ie L

earn

ing

, In

c.

11

Skills Practice Skills Practice for Lesson 11.7

Name _____________________________________________ Date ____________________

Lies and StatisticsCausation Versus Correlation

Vocabulary Explain how each set of terms are related.

1. Correlation and causation

Correlation shows how well two or more sets of data tend to relate or vary together. Causation shows that one set of data causes another set to behave in a certain way. Causation relies on a correlation of data sets; however a correlation of data sets does not always show causation.

2. Necessary condition and sufficient condition

A necessary condition is a condition that must be satisfied for an event to occur. For instance, in order to show causation, correlation is a necessary condition. A sufficient condition is a condition that if satisfied, assures that the event will occur. For instance, correlation is not a sufficient condition to prove causation; there must be more proof.

Problem Set For each situation, decide whether the correlation implies causation. List reasons why or why not.

1. The amount of ice cream a grocery store sells is negatively correlated to the

amount of soup that the grocery store sells.

The correlation does not imply causation. There may be a correlation between ice cream sales and soup sales. For instance, ice cream sales may increase as soup sales decrease, because ice cream sales typically increase in warmer weather and soup sales typically decrease in warmer weather. However, this trend does not mean that an increase in ice cream sales causes the soup sales to decrease.

604 Chapter 11 l Skills Practice

© 2

009 C

arn

eg

ie L

earn

ing

, In

c.

11

2. The number of new entry-level jobs in a city is positively correlated to the number

of new home sales.

The correlation does not imply causation. There may be a correlation between the number of people filling the new available jobs and the number of people who can now afford new homes. However, getting a new job does not cause a person to purchase a new home. There may be many other significant factors to buying a home, such as the availability of low-interest loans on new homes, or natural disasters that result in many new homes being built out of necessity.

3. There is a positive correlation between the total number of dollars paid toward an

education and a person’s annual salary.

The correlation does not imply causation. There may be a correlation between the amount of money spent on an education and a person’s salary. For instance, someone who pays for 10 years of higher education to become a medical doctor may have a higher salary than someone who did not finish high school and is working at minimum wage. However, paying for more education does not cause one’s salary to be higher. Other factors, such as available job positions, choice of career, and personal abilities impact the amount of annual salary a person receives.

4. There is a high negative correlation between the age of a licensed driver and the

number of accidents due to a high rate of speed.

The correlation does not imply causation. There may be a correlation between driver’s age and the number of speeding accidents. For instance, an older driver is more likely to have more experience driving, and therefore be less likely to have an accident, even while traveling at a high rate of speed. An older driver is also less likely to drive at a high rate of speed. However, this trend does not mean that being younger makes a person speed and have an accident, or that being older keeps a person from speeding and having an accident.

Read each statement. Then answer the questions. Explain your reasoning.

5. A scientist claims that people who eat breakfast every morning will perform well at

their jobs.

a. Do you think that eating breakfast every morning is a necessary condition for a

person to perform well at a job?

No, it may be possible for a person to perform well at his or her job without eating breakfast every morning.

Chapter 11 l Skills Practice 605

© 2

009 C

arn

eg

ie L

earn

ing

, In

c.

Name _____________________________________________ Date ____________________

11

b. Do you think that eating breakfast every morning is a sufficient condition for a

person to perform well at a job?

No, because not every person who eats breakfast every morning performs well at his or her job.

6. A teacher said that students who read a book slowly will understand the story.

a. Do you think that reading a book slowly is a necessary condition for

understanding the story?

No, it may be possible to read quickly and still understand what is being read.

b. Do you think that reading a book slowly is a sufficient condition for a student to

understand the story?

No, because not every person who reads a book slowly is going to understand the story.

7. A reporter claims that when there are a large number of paramedics at a disaster

site, there are a large number of fatalities.

a. Do you think that a large number of paramedics at a disaster site is a necessary

condition for a large number of fatalities?

No, it may be possible for there to be a large number of fatalities at a disaster site where there are not many paramedics.

b. Do you think that a large number of paramedics at a disaster site is a sufficient

condition for a large number of fatalities?

No, because not every disaster site that has a large number of paramedics in attendance also has a large number of fatalities.

8. An adult claims that if you play with fire, you are going to have bad dreams.

a. Do you think that playing with fire is a necessary condition for a person to have

bad dreams?

No, people who do not play with fire can also have bad dreams.

b. Do you think that playing with fire is a sufficient condition for a person to have

bad dreams?

No, because not every person who plays with fire has bad dreams.

606 Chapter 11 l Skills Practice

© 2

009 C

arn

eg

ie L

earn

ing

, In

c.

11


Recommended