October 3, 2016Alexia Morgan, Consul ng Researcher
DisclaimerSeafood Watch® strives to have all Seafood Reports reviewed for accuracy and completeness by externalscien sts with exper se in ecology, fisheries science and aquaculture. Scien fic review, however, does notcons tute an endorsement of the Seafood Watch® program or its recommenda ons on the part of thereviewing scien sts. Seafood Watch® is solely responsible for the conclusions reached in this report.
Table of ContentsAbout Seafood WatchGuiding PrinciplesSummaryFinal Seafood RecommendationsIntroductionAssessment
Criterion 1: Impacts on the species under assessmentCriterion 2: Impacts on other speciesCriterion 3: Management EffectivenessCriterion 4: Impacts on the habitat and ecosystem
AcknowledgementsReferencesAppendix A: Extra By Catch SpeciesAppendix B: Update Summary
2
About Seafood Watch
Monterey Bay Aquarium’s Seafood Watch® program evaluates the ecological sustainability of wild-caught andfarmed seafood commonly found in the United States marketplace. Seafood Watch® defines sustainableseafood as origina ng from sources, whether wild-caught or farmed, which can maintain or increase produc onin the long-term without jeopardizing the structure or func on of affected ecosystems. Seafood Watch® makesits science-based recommenda ons available to the public in the form of regional pocket guides that can bedownloaded from www.seafoodwatch.org. The program’s goals are to raise awareness of important oceanconserva on issues and empower seafood consumers and businesses to make choices for healthy oceans.
Each sustainability recommenda on on the regional pocket guides is supported by a Seafood Report. Eachreport synthesizes and analyzes the most current ecological, fisheries and ecosystem science on a species, thenevaluates this informa on against the program’s conserva on ethic to arrive at a recommenda on of “BestChoices,” “Good Alterna ves” or “Avoid.” The detailed evalua on methodology is available upon request. Inproducing the Seafood Reports, Seafood Watch® seeks out research published in academic, peer-reviewedjournals whenever possible. Other sources of informa on include government technical publica ons, fisherymanagement plans and suppor ng documents, and other scien fic reviews of ecological sustainability. SeafoodWatch® Research Analysts also communicate regularly with ecologists, fisheries and aquaculture scien sts, andmembers of industry and conserva on organiza ons when evalua ng fisheries and aquaculture prac ces.Capture fisheries and aquaculture prac ces are highly dynamic; as the scien fic informa on on each specieschanges, Seafood Watch®’s sustainability recommenda ons and the underlying Seafood Reports will beupdated to reflect these changes.
Par es interested in capture fisheries, aquaculture prac ces and the sustainability of ocean ecosystems arewelcome to use Seafood Reports in any way they find useful. For more informa on about Seafood Watch® andSeafood Reports, please contact the Seafood Watch® program at Monterey Bay Aquarium by calling 1-877-229-9990.
3
Guiding Principles
Seafood Watch defines sustainable seafood as origina ng from sources, whether fished or farmed, that canmaintain or increase produc on in the long-term without jeopardizing the structure or func on of affectedecosystems.
Based on this principle, Seafood Watch had developed four sustainability criteria for evalua ng wildcatchfisheries for consumers and businesses. These criteria are:
How does fishing affect the species under assessment?
How does the fishing affect other, target and non-target species?
How effec ve is the fishery’s management?
How does the fishing affect habitats and the stability of the ecosystem?
Each criterion includes:
Factors to evaluate and score
Guidelines for integra ng these factors to produce a numerical score and ra ng
Once a ra ng has been assigned to each criterion, we develop an overall recommenda on. Criteria ra ngs andthe overall recommenda on are color-coded to correspond to the categories on the Seafood Watch pocketguide and online guide:
Best Choice/Green: Are well managed and caught in ways that cause li le harm to habitats or other wildlife.
Good Alterna ve/Yellow: Buy, but be aware there are concerns with how they’re caught.
Avoid/Red Take a pass on these for now. These items are overfished or caught in ways that harm other marinelife or the environment.
“Fish” is used throughout this document to refer to finfish, shellfish and other invertebrates
1
1
4
Summary
This report focuses on skipjack (Katsuwonus pelamis) and yellowfin tuna (Thunnus albacares) caught by trolland pole fisheries in the Indian Ocean.
All the tuna species in this report are of medium inherent vulnerability to fishing pressure based on life historycharacteris cs, including when they reach sexual maturity, maximum size, and spawning strategy. Almost allthese species are either top predators or occupy a high trophic level in the ecosystem.
The skipjack tuna popula on in the Indian Ocean is healthy, and fishing mortality rates are well belowmaximum sustainable yield, indica ng that overfishing is not occurring. Yellowfin tuna in the Indian Ocean isoverfished and overfishing is occurring.
Bycatch in the troll and pole fisheries is typically very low, but other tunas such as bigeye, bullet, and frigate areincidentally captured; other bycatch species are not common.
These species are managed through various measures by the Indian Ocean Tuna Commission (IOTC) within theIndian Ocean. Recently, the IOTC implemented a harvest control rule for skipjack tuna and measures to reducefishing mortality of yellowfin tuna, though it is unknown if the measures will be sufficient to end overfishing ofyellowfin tuna and rebuild its popula ons. Overall management is considered moderately effec ve, with amixed record of following scien fic advice and ensuring compliance with regula ons. The fishery does notimpact the benthic habitat and has moderately effec ve ecosystem-based measures in place.
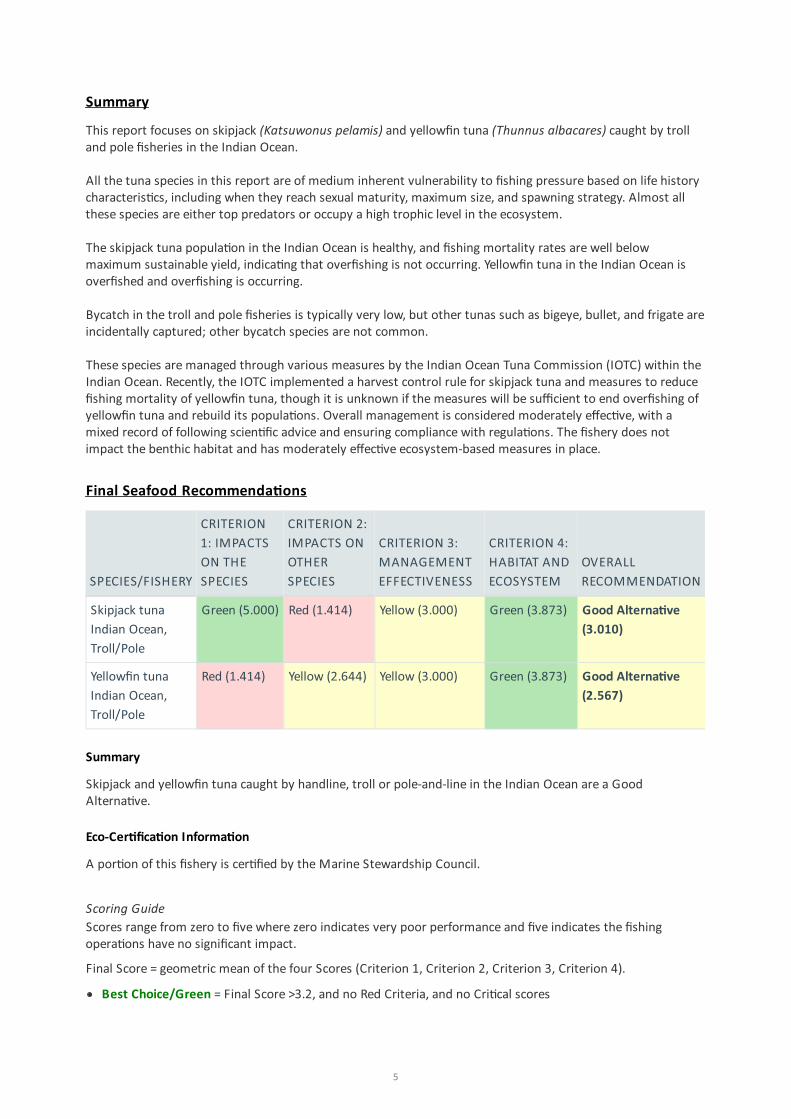
Final Seafood Recommenda ons
Summary
Skipjack and yellowfin tuna caught by handline, troll or pole-and-line in the Indian Ocean are a GoodAlterna ve.
Eco-Cer fica on Informa on
A por on of this fishery is cer fied by the Marine Stewardship Council.
Scoring GuideScores range from zero to five where zero indicates very poor performance and five indicates the fishingopera ons have no significant impact.
Final Score = geometric mean of the four Scores (Criterion 1, Criterion 2, Criterion 3, Criterion 4).
Best Choice/Green = Final Score >3.2, and no Red Criteria, and no Cri cal scores
SPECIES/FISHERY
CRITERION1: IMPACTSON THESPECIES
CRITERION 2:IMPACTS ONOTHERSPECIES
CRITERION 3:MANAGEMENTEFFECTIVENESS
CRITERION 4:HABITAT ANDECOSYSTEM
OVERALLRECOMMENDATION
Skipjack tunaIndian Ocean,Troll/Pole
Green (5.000) Red (1.414) Yellow (3.000) Green (3.873) Good Alterna ve(3.010)
Yellowfin tunaIndian Ocean,Troll/Pole
Red (1.414) Yellow (2.644) Yellow (3.000) Green (3.873) Good Alterna ve(2.567)
5
Good Alterna ve/Yellow = Final score >2.2-3.2, and neither Harvest Strategy (Factor 3.1) nor BycatchManagement Strategy (Factor 3.2) are Very High Concern2, and no more than one Red Criterion, and noCri cal scores
Avoid/Red = Final Score ≤2.2, or either Harvest Strategy (Factor 3.1) or Bycatch Management Strategy(Factor 3.2) is Very High Concern or two or more Red Criteria, or one or more Cri cal scores.
Because effec ve management is an essen al component of sustainable fisheries, Seafood Watch issues an Avoid recommenda on forany fishery scored as a Very High Concern for either factor under Management (Criterion 3).
2
6
Introduc on
Scope of the analysis and ensuing recommenda on
This report focuses on skipjack (Katsuwonus pelamis) and yellowfin tuna (Thunnus albacares) caught by troll,handline, and pole fisheries in the Indian Ocean.
Species Overview
Skipjack and yellowfin tuna are found in tropical and subtropical waters worldwide including in the IndianOcean. These species are each assessed as single popula ons in the Indian Ocean. In the Pacific Ocean, thereare two popula ons: Eastern Pacific, and Western and Central Pacific. In the Atlan c Ocean, there is onepopula on of yellowfin and two of skipjack (Eastern and Western). Both skipjack and yellowfin tuna are highlymigratory and are commonly found as juveniles schooling together below floa ng objects (IOTC 2013b) (IOTC2013c) (IOTC 2013d).
Globally, purse seines are the primary gear used to capture skipjack and yellowfin tuna. Skipjack and yellowfintuna catches have all increased substan ally over me, peaking in the early 2000s for yellowfin tuna andaround 2009 for skipjack tuna (ISSF 2013b).
In the Indian Ocean, tuna are managed by the Indian Ocean Tuna Commission (IOTC).
Produc on Sta s cs
Historically, the pole-and-line and trolling fisheries captured the majority of skipjack tuna in the Indian Oceanun l the mid-1980s, when purse seining was introduced. Since then, both fisheries have contributed far less tothe overall catches in the region. Total catches of skipjack tuna have been increasing over me and peaked in2006 at around 600,000 MT, with less than 50,000 MT coming from other fisheries including trolling, handline,and longline. In 2012, total catches were 384,537 MT, with 183,594 MT coming from trolling, handline, andlongline fishing gears (combined). The top fishing na ons for skipjack tuna using handline gear (troll and pole;in decreasing order) are Maldives, Indonesia, India, and Sri Lanka (IOTC 2013c).
Figure 1 Skipjack tuna annual catches, 1950-2012, in the Indian Ocean (IOTC 2013c).
Total annual catches of yellowfin tuna have increased significantly since the 1980s due to the expansion of thepurse seine, gillnet, and troll and pole fisheries. Total catches peaked in 2004 at 528,797 MT (20,929 MT trolland 4,631 MT handline) but have since dropped, with total catches in 2012 being 370,000 MT (21,444 MT
7
troll and 6,253 MT handline). The top fishing na ons for yellowfin tuna using handline gear (in decreasingorder) are Maldives, Yemen, Indonesia, India, and Sri Lanka (IOTC 2013d).
Figure 2 Yellowfin tuna annual catches, 1950-2012, in the Indian Ocean (IOTC 2013d).
Importance to the US/North American market.
The United States imported over half (55%) of its skipjack tuna from Panama (55%) during 2013. Otherimportant countries included the Philippines (15%) and Mexico (13%). The majority of yellowfin tuna wereimported from Trinidad and Tobago (49%) in 2013.
Figure 3 Major contributors to U.S. skipjack tuna imports (%), all countries and regions (country of origin)(NMFS 2014).
8
Figure 4 Major contributors to U.S. yellowfin tuna imports (%), all countries and regions (country of origin)(NMFS 2014).
Common and market names.
In Hawaii, bigeye and yellowfin tuna are known as ahi, and skipjack as aku. Skipjack tuna, o en together withsmaller amounts of bigeye and yellowfin tuna, is canned as "light" tuna.
Primary product forms
These species are sold canned, in fresh and frozen form, and for the sushi and sashimi markets.
9
Assessment
This sec on assesses the sustainability of the fishery(s) rela ve to the Seafood Watch Criteria for Fisheries,available at h p://www.seafoodwatch.org.
Criterion 1: Impacts on the species under assessment
This criterion evaluates the impact of fishing mortality on the species, given its current abundance. Theinherent vulnerability to fishing ra ng influences how abundance is scored, when abundance is unknown.
The final Criterion 1 score is determined by taking the geometric mean of the abundance and fishing mortalityscores. The Criterion 1 ra ng is determined as follows:
Score >3.2=Green or Low Concern
Score >2.2 and ≤3.2=Yellow or Moderate Concern
Score ≤2.2=Red or High Concern
Ra ng is Cri cal if Factor 1.3 (Fishing Mortality) is Cri cal
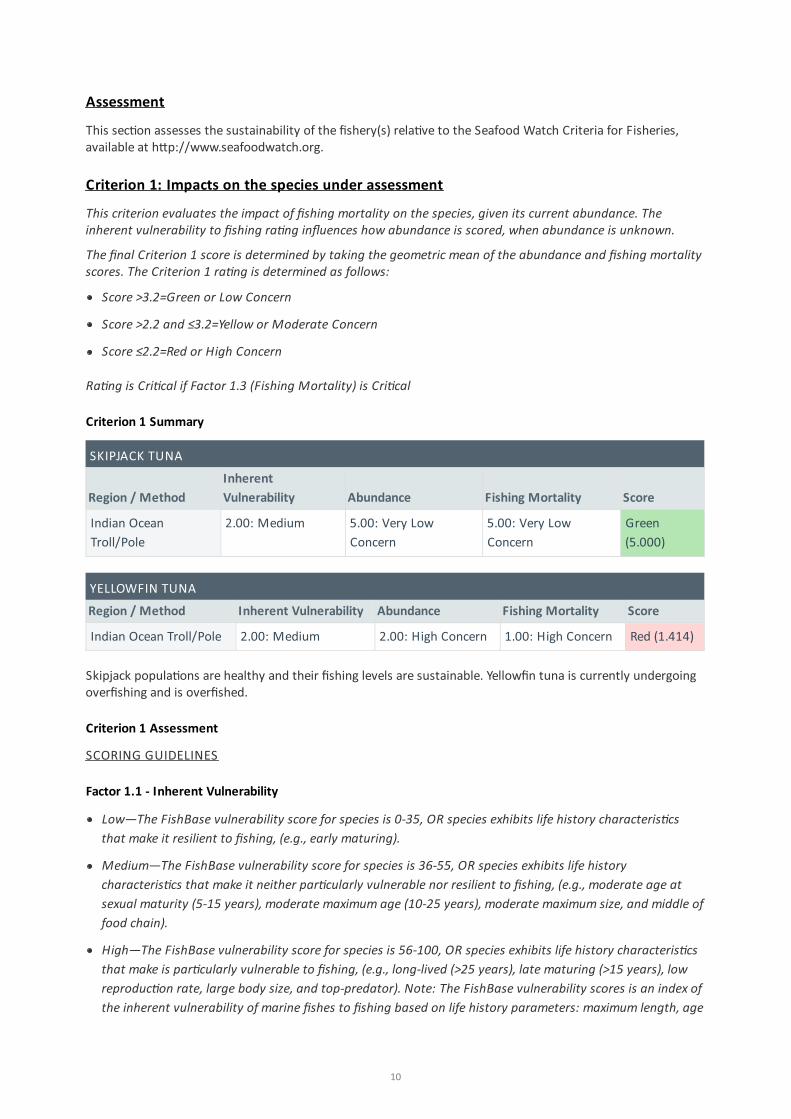
Criterion 1 Summary
Skipjack popula ons are healthy and their fishing levels are sustainable. Yellowfin tuna is currently undergoingoverfishing and is overfished.
Criterion 1 Assessment
SCORING GUIDELINES
Factor 1.1 - Inherent Vulnerability
Low—The FishBase vulnerability score for species is 0-35, OR species exhibits life history characteris csthat make it resilient to fishing, (e.g., early maturing).
Medium—The FishBase vulnerability score for species is 36-55, OR species exhibits life historycharacteris cs that make it neither par cularly vulnerable nor resilient to fishing, (e.g., moderate age atsexual maturity (5-15 years), moderate maximum age (10-25 years), moderate maximum size, and middle offood chain).
High—The FishBase vulnerability score for species is 56-100, OR species exhibits life history characteris csthat make is par cularly vulnerable to fishing, (e.g., long-lived (>25 years), late maturing (>15 years), lowreproduc on rate, large body size, and top-predator). Note: The FishBase vulnerability scores is an index ofthe inherent vulnerability of marine fishes to fishing based on life history parameters: maximum length, age
SKIPJACK TUNA
Region / MethodInherentVulnerability Abundance Fishing Mortality Score
Indian Ocean Troll/Pole 2.00: Medium 2.00: High Concern 1.00: High Concern Red (1.414)
10
at first maturity, longevity, growth rate, natural mortality rate, fecundity, spa al behaviors (e.g., schooling,aggrega ng for breeding, or consistently returning to the same sites for feeding or reproduc on) andgeographic range.
Factor 1.2 - Abundance
5 (Very Low Concern)—Strong evidence exists that the popula on is above target abundance level (e.g.,biomass at maximum sustainable yield, BMSY) or near virgin biomass.
4 (Low Concern)—Popula on may be below target abundance level, but it is considered not overfished
3 (Moderate Concern) —Abundance level is unknown and the species has a low or medium inherentvulnerability to fishing.
2 (High Concern)—Popula on is overfished, depleted, or a species of concern, OR abundance is unknownand the species has a high inherent vulnerability to fishing.
1 (Very High Concern)—Popula on is listed as threatened or endangered.
Factor 1.3 - Fishing Mortality
5 (Very Low Concern)—Highly likely that fishing mortality is below a sustainable level (e.g., below fishingmortality at maximum sustainable yield, FMSY), OR fishery does not target species and its contribu on tothe mortality of species is negligible (≤ 5% of a sustainable level of fishing mortality).
3.67 (Low Concern)—Probable (>50%) chance that fishing mortality is at or below a sustainable level, butsome uncertainty exists, OR fishery does not target species and does not adversely affect species, but itscontribu on to mortality is not negligible, OR fishing mortality is unknown, but the popula on is healthyand the species has a low suscep bility to the fishery (low chance of being caught).
2.33 (Moderate Concern)—Fishing mortality is fluctua ng around sustainable levels, OR fishing mortality isunknown and species has a moderate-high suscep bility to the fishery and, if species is depleted,reasonable management is in place.
1 (High Concern)—Overfishing is occurring, but management is in place to curtail overfishing, OR fishingmortality is unknown, species is depleted, and no management is in place.
0 (Cri cal)—Overfishing is known to be occurring and no reasonable management is in place to curtailoverfishing.
SKIPJACK TUNA
Factor 1.1 - Inherent Vulnerability
INDIAN OCEAN, TROLL/POLE
Medium
FishBase assigned a moderate vulnerability score of 39 out of 100 (Froese and Pauly 2013). Skipjack’s lifehistory characteris cs support this score. Sexual maturity is reached around 41–43 cm and before 2 years ofage, and skipjack can reach a maximum size of 110 cm and age of 12 years. It is a broadcast spawner and hasa high trophic level (Froese and Pauly 2013) (IOTC 2013c).
11
Factor 1.3 - Fishing Mortality
YELLOWFIN TUNA
Factor 1.1 - Inherent Vulnerability
Factor 1.2 - Abundance
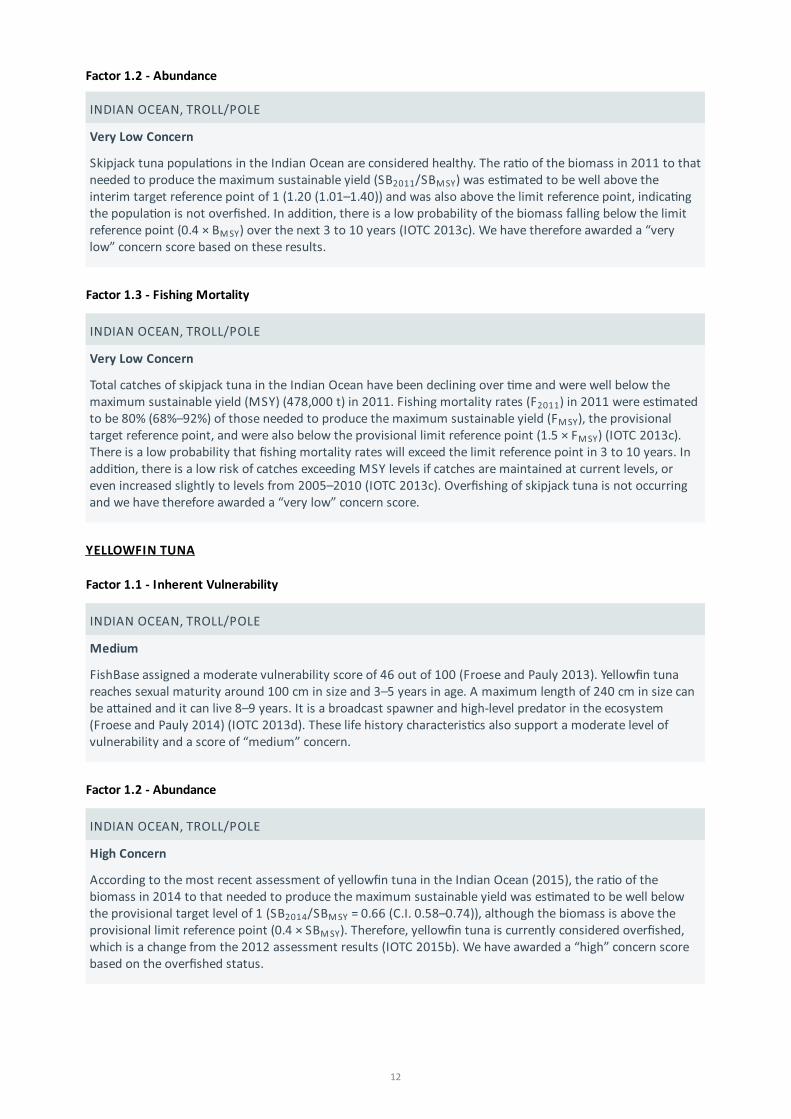
INDIAN OCEAN, TROLL/POLE
Very Low Concern
Skipjack tuna popula ons in the Indian Ocean are considered healthy. The ra o of the biomass in 2011 to thatneeded to produce the maximum sustainable yield (SB /SB ) was es mated to be well above theinterim target reference point of 1 (1.20 (1.01–1.40)) and was also above the limit reference point, indica ngthe popula on is not overfished. In addi on, there is a low probability of the biomass falling below the limitreference point (0.4 × B ) over the next 3 to 10 years (IOTC 2013c). We have therefore awarded a “verylow” concern score based on these results.
2011 M SY
M SY
INDIAN OCEAN, TROLL/POLE
Very Low Concern
Total catches of skipjack tuna in the Indian Ocean have been declining over me and were well below themaximum sustainable yield (MSY) (478,000 t) in 2011. Fishing mortality rates (F ) in 2011 were es matedto be 80% (68%–92%) of those needed to produce the maximum sustainable yield (F ), the provisionaltarget reference point, and were also below the provisional limit reference point (1.5 × F ) (IOTC 2013c).There is a low probability that fishing mortality rates will exceed the limit reference point in 3 to 10 years. Inaddi on, there is a low risk of catches exceeding MSY levels if catches are maintained at current levels, oreven increased slightly to levels from 2005–2010 (IOTC 2013c). Overfishing of skipjack tuna is not occurringand we have therefore awarded a “very low” concern score.
2011
M SY
M SY
INDIAN OCEAN, TROLL/POLE
Medium
FishBase assigned a moderate vulnerability score of 46 out of 100 (Froese and Pauly 2013). Yellowfin tunareaches sexual maturity around 100 cm in size and 3–5 years in age. A maximum length of 240 cm in size canbe a ained and it can live 8–9 years. It is a broadcast spawner and high-level predator in the ecosystem(Froese and Pauly 2014) (IOTC 2013d). These life history characteris cs also support a moderate level ofvulnerability and a score of “medium” concern.
INDIAN OCEAN, TROLL/POLE
High Concern
According to the most recent assessment of yellowfin tuna in the Indian Ocean (2015), the ra o of thebiomass in 2014 to that needed to produce the maximum sustainable yield was es mated to be well belowthe provisional target level of 1 (SB /SB = 0.66 (C.I. 0.58–0.74)), although the biomass is above theprovisional limit reference point (0.4 × SB ). Therefore, yellowfin tuna is currently considered overfished,which is a change from the 2012 assessment results (IOTC 2015b). We have awarded a “high” concern scorebased on the overfished status.
2014 M SY
M SY
12
Factor 1.2 - Abundance
INDIAN OCEAN, TROLL/POLE
High Concern
The current fishing mortality rates are es mated to be well above both the provisional target reference pointof F /F = 1.34 (1.02–1.67) and right around the limit reference point (1.4 × F ). The 2012 assessmentresults were unclear if the status of yellowfin tuna was moving toward overfishing occurring, because catchesin recent years had exceeded previous maximum sustainable yield es mates (IOTC 2013d). Based on the 2014assessment, it is clear that the popula on is undergoing overfishing (IOTC 2015b). We have thereforeawarded a “high” concern score.
2014 M SY M SY
13
Factor 1.3 - Fishing Mortality
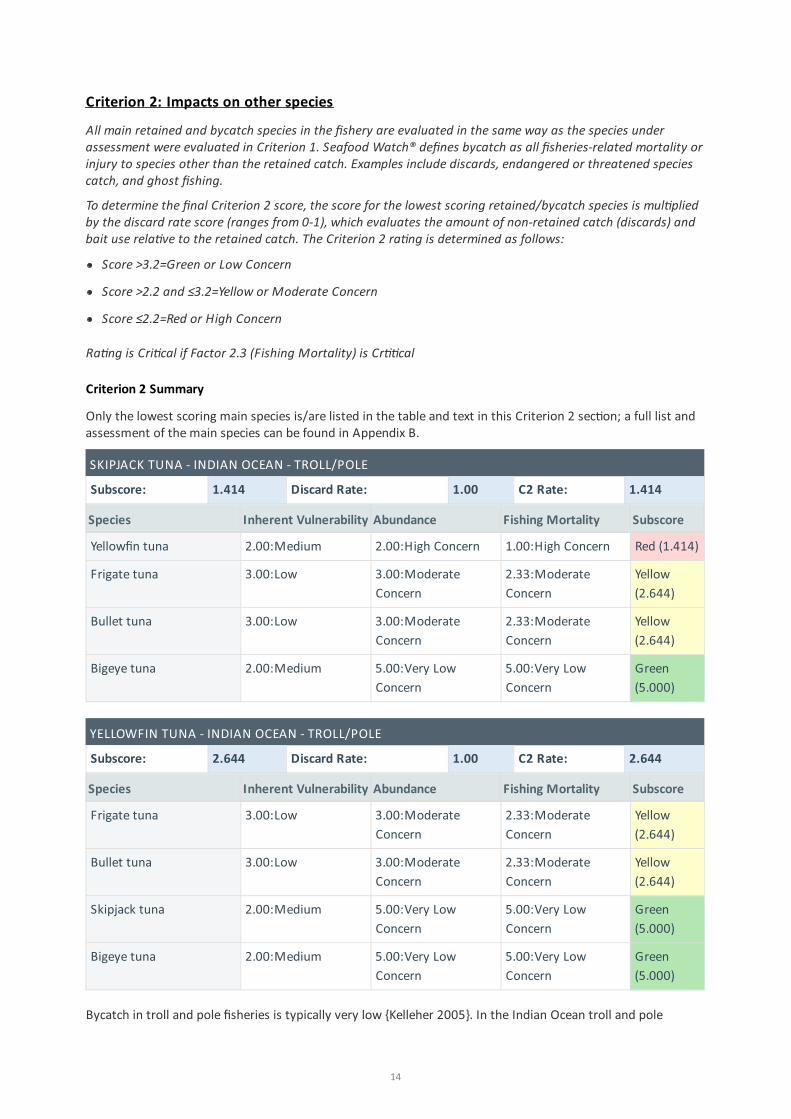
Criterion 2: Impacts on other species
All main retained and bycatch species in the fishery are evaluated in the same way as the species underassessment were evaluated in Criterion 1. Seafood Watch® defines bycatch as all fisheries-related mortality orinjury to species other than the retained catch. Examples include discards, endangered or threatened speciescatch, and ghost fishing.
To determine the final Criterion 2 score, the score for the lowest scoring retained/bycatch species is mul pliedby the discard rate score (ranges from 0-1), which evaluates the amount of non-retained catch (discards) andbait use rela ve to the retained catch. The Criterion 2 ra ng is determined as follows:
Score >3.2=Green or Low Concern
Score >2.2 and ≤3.2=Yellow or Moderate Concern
Score ≤2.2=Red or High Concern
Ra ng is Cri cal if Factor 2.3 (Fishing Mortality) is Cr cal
Criterion 2 Summary
Only the lowest scoring main species is/are listed in the table and text in this Criterion 2 sec on; a full list andassessment of the main species can be found in Appendix B.
Bycatch in troll and pole fisheries is typically very low {Kelleher 2005}. In the Indian Ocean troll and pole
SKIPJACK TUNA - INDIAN OCEAN - TROLL/POLE
Subscore: 1.414 Discard Rate: 1.00 C2 Rate: 1.414
Species Inherent Vulnerability Abundance Fishing Mortality Subscore
Yellowfin tuna 2.00:Medium 2.00:High Concern 1.00:High Concern Red (1.414)
Frigate tuna 3.00:Low 3.00:ModerateConcern
2.33:ModerateConcern
Yellow(2.644)
Bullet tuna 3.00:Low 3.00:ModerateConcern
2.33:ModerateConcern
Yellow(2.644)
Bigeye tuna 2.00:Medium 5.00:Very LowConcern
5.00:Very LowConcern
Green(5.000)
YELLOWFIN TUNA - INDIAN OCEAN - TROLL/POLE
Subscore: 2.644 Discard Rate: 1.00 C2 Rate: 2.644
Species Inherent Vulnerability Abundance Fishing Mortality Subscore
Frigate tuna 3.00:Low 3.00:ModerateConcern
2.33:ModerateConcern
Yellow(2.644)
Bullet tuna 3.00:Low 3.00:ModerateConcern
2.33:ModerateConcern
Yellow(2.644)
Skipjack tuna 2.00:Medium 5.00:Very LowConcern
5.00:Very LowConcern
Green(5.000)
Bigeye tuna 2.00:Medium 5.00:Very LowConcern
5.00:Very LowConcern
Green(5.000)
14
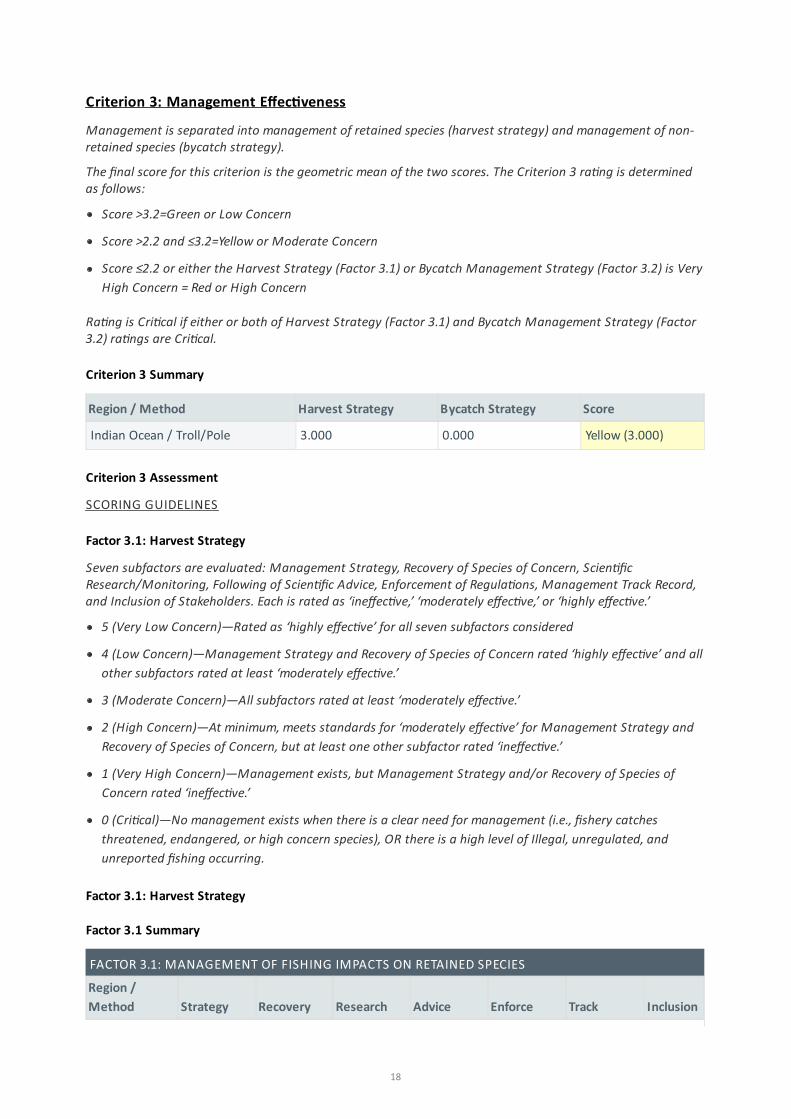
fisheries, the primary targets are skipjack and yellowfin tuna. In addi on to these main species, bigeye tuna arecaught, and bullet and frigate tuna make up as much as 7% of the total catch {Adrille et al. 2012}, so they areincluded in this report.
Criterion 2 Assessment
SCORING GUIDELINES
Factor 2.1 - Inherent Vulnerability
(same as Factor 1.1 above)
Factor 2.2 - Abundance
(same as Factor 1.2 above)
Factor 2.3 - Fishing Mortality
(same as Factor 1.3 above)
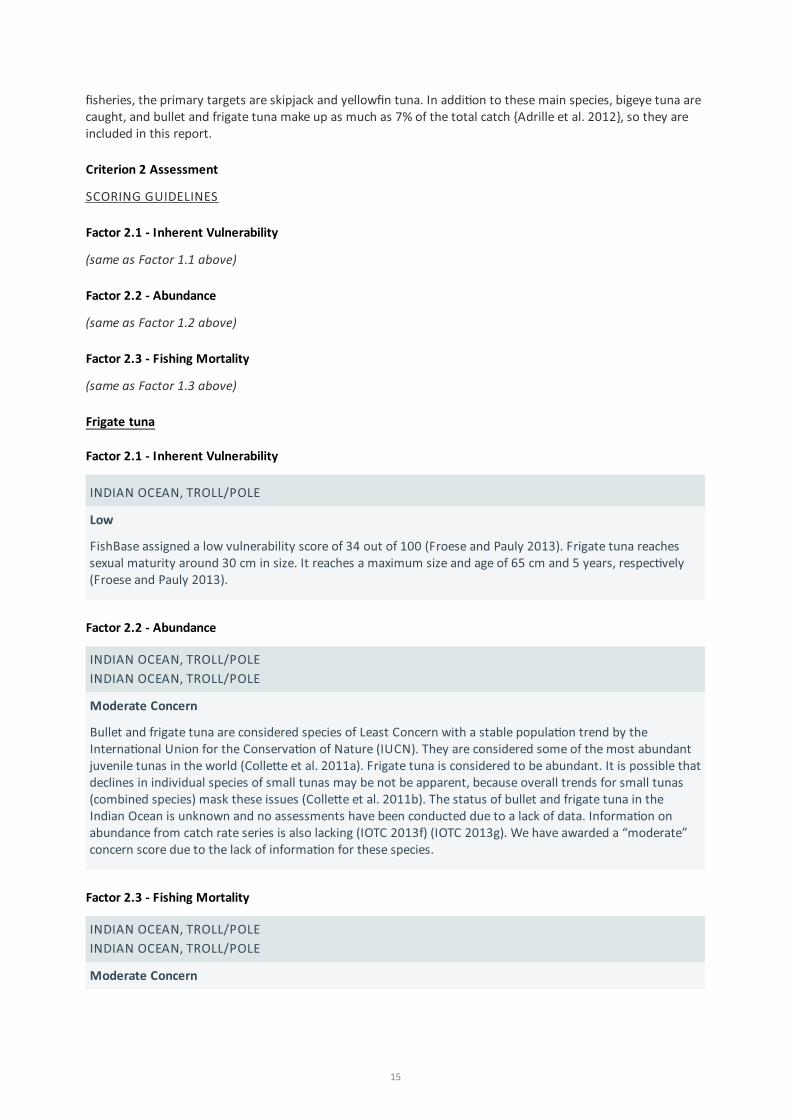
Frigate tuna
Factor 2.1 - Inherent Vulnerability
Factor 2.2 - Abundance
Factor 2.3 - Fishing Mortality
INDIAN OCEAN, TROLL/POLE
Low
FishBase assigned a low vulnerability score of 34 out of 100 (Froese and Pauly 2013). Frigate tuna reachessexual maturity around 30 cm in size. It reaches a maximum size and age of 65 cm and 5 years, respec vely(Froese and Pauly 2013).
INDIAN OCEAN, TROLL/POLEINDIAN OCEAN, TROLL/POLE
Moderate Concern
Bullet and frigate tuna are considered species of Least Concern with a stable popula on trend by theInterna onal Union for the Conserva on of Nature (IUCN). They are considered some of the most abundantjuvenile tunas in the world (Colle e et al. 2011a). Frigate tuna is considered to be abundant. It is possible thatdeclines in individual species of small tunas may be not be apparent, because overall trends for small tunas(combined species) mask these issues (Colle e et al. 2011b). The status of bullet and frigate tuna in theIndian Ocean is unknown and no assessments have been conducted due to a lack of data. Informa on onabundance from catch rate series is also lacking (IOTC 2013f) (IOTC 2013g). We have awarded a “moderate”concern score due to the lack of informa on for these species.
INDIAN OCEAN, TROLL/POLEINDIAN OCEAN, TROLL/POLE
Moderate Concern
15
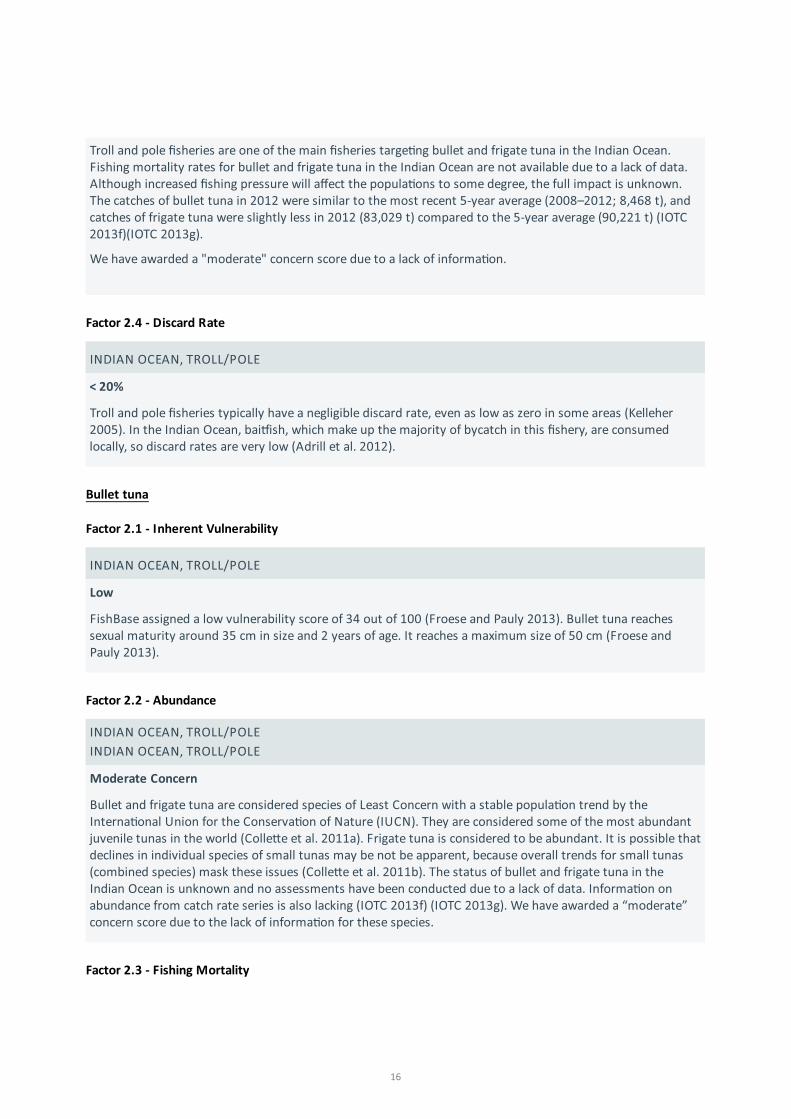
Factor 2.4 - Discard Rate
Bullet tuna
Factor 2.1 - Inherent Vulnerability
Factor 2.2 - Abundance
Factor 2.3 - Fishing Mortality
Troll and pole fisheries are one of the main fisheries targe ng bullet and frigate tuna in the Indian Ocean.Fishing mortality rates for bullet and frigate tuna in the Indian Ocean are not available due to a lack of data.Although increased fishing pressure will affect the popula ons to some degree, the full impact is unknown.The catches of bullet tuna in 2012 were similar to the most recent 5-year average (2008–2012; 8,468 t), andcatches of frigate tuna were slightly less in 2012 (83,029 t) compared to the 5-year average (90,221 t) (IOTC2013f)(IOTC 2013g).
We have awarded a "moderate" concern score due to a lack of informa on.
INDIAN OCEAN, TROLL/POLE
< 20%
Troll and pole fisheries typically have a negligible discard rate, even as low as zero in some areas (Kelleher2005). In the Indian Ocean, bai ish, which make up the majority of bycatch in this fishery, are consumedlocally, so discard rates are very low (Adrill et al. 2012).
INDIAN OCEAN, TROLL/POLE
Low
FishBase assigned a low vulnerability score of 34 out of 100 (Froese and Pauly 2013). Bullet tuna reachessexual maturity around 35 cm in size and 2 years of age. It reaches a maximum size of 50 cm (Froese andPauly 2013).
INDIAN OCEAN, TROLL/POLEINDIAN OCEAN, TROLL/POLE
Moderate Concern
Bullet and frigate tuna are considered species of Least Concern with a stable popula on trend by theInterna onal Union for the Conserva on of Nature (IUCN). They are considered some of the most abundantjuvenile tunas in the world (Colle e et al. 2011a). Frigate tuna is considered to be abundant. It is possible thatdeclines in individual species of small tunas may be not be apparent, because overall trends for small tunas(combined species) mask these issues (Colle e et al. 2011b). The status of bullet and frigate tuna in theIndian Ocean is unknown and no assessments have been conducted due to a lack of data. Informa on onabundance from catch rate series is also lacking (IOTC 2013f) (IOTC 2013g). We have awarded a “moderate”concern score due to the lack of informa on for these species.
16
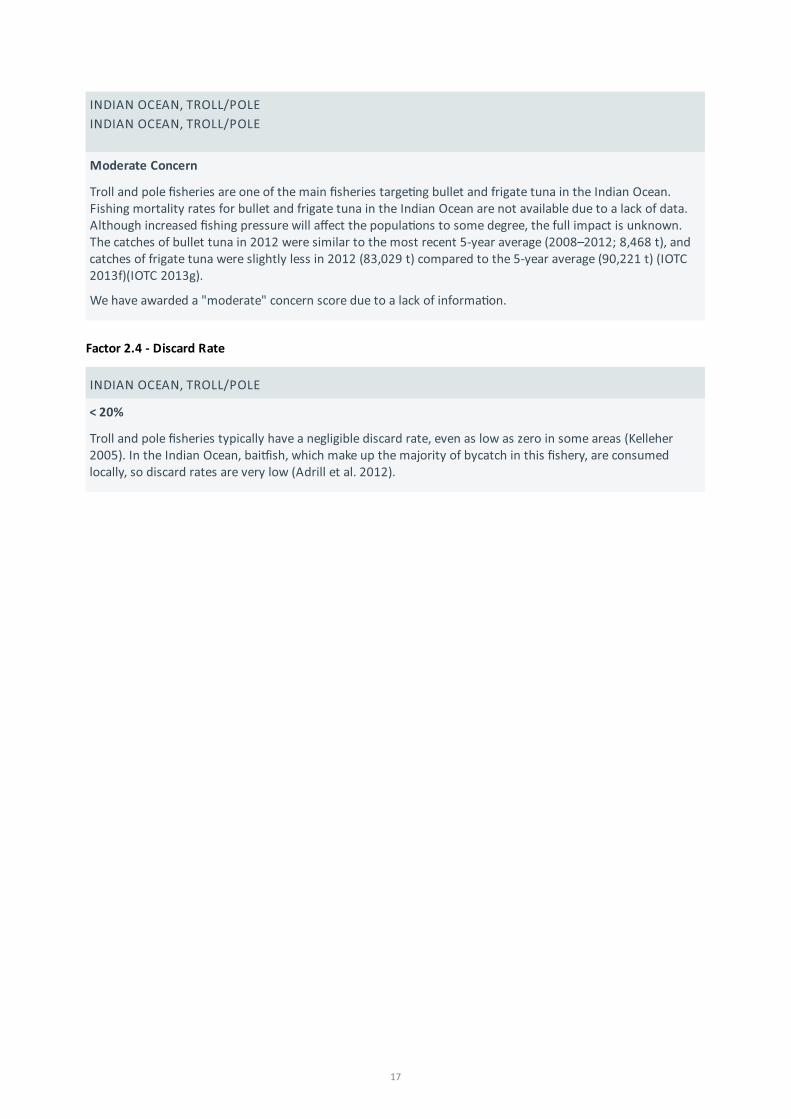
Factor 2.4 - Discard Rate
INDIAN OCEAN, TROLL/POLEINDIAN OCEAN, TROLL/POLE
Moderate Concern
Troll and pole fisheries are one of the main fisheries targe ng bullet and frigate tuna in the Indian Ocean.Fishing mortality rates for bullet and frigate tuna in the Indian Ocean are not available due to a lack of data.Although increased fishing pressure will affect the popula ons to some degree, the full impact is unknown.The catches of bullet tuna in 2012 were similar to the most recent 5-year average (2008–2012; 8,468 t), andcatches of frigate tuna were slightly less in 2012 (83,029 t) compared to the 5-year average (90,221 t) (IOTC2013f)(IOTC 2013g).
We have awarded a "moderate" concern score due to a lack of informa on.
INDIAN OCEAN, TROLL/POLE
< 20%
Troll and pole fisheries typically have a negligible discard rate, even as low as zero in some areas (Kelleher2005). In the Indian Ocean, bai ish, which make up the majority of bycatch in this fishery, are consumedlocally, so discard rates are very low (Adrill et al. 2012).
17
Criterion 3: Management Effec veness
Management is separated into management of retained species (harvest strategy) and management of non-retained species (bycatch strategy).
The final score for this criterion is the geometric mean of the two scores. The Criterion 3 ra ng is determinedas follows:
Score >3.2=Green or Low Concern
Score >2.2 and ≤3.2=Yellow or Moderate Concern
Score ≤2.2 or either the Harvest Strategy (Factor 3.1) or Bycatch Management Strategy (Factor 3.2) is VeryHigh Concern = Red or High Concern
Ra ng is Cri cal if either or both of Harvest Strategy (Factor 3.1) and Bycatch Management Strategy (Factor3.2) ra ngs are Cri cal.
Criterion 3 Summary
Criterion 3 Assessment
SCORING GUIDELINES
Factor 3.1: Harvest Strategy
Seven subfactors are evaluated: Management Strategy, Recovery of Species of Concern, Scien ficResearch/Monitoring, Following of Scien fic Advice, Enforcement of Regula ons, Management Track Record,and Inclusion of Stakeholders. Each is rated as ‘ineffec ve,’ ‘moderately effec ve,’ or ‘highly effec ve.’
5 (Very Low Concern)—Rated as ‘highly effec ve’ for all seven subfactors considered
4 (Low Concern)—Management Strategy and Recovery of Species of Concern rated ‘highly effec ve’ and allother subfactors rated at least ‘moderately effec ve.’
3 (Moderate Concern)—All subfactors rated at least ‘moderately effec ve.’
2 (High Concern)—At minimum, meets standards for ‘moderately effec ve’ for Management Strategy andRecovery of Species of Concern, but at least one other subfactor rated ‘ineffec ve.’
1 (Very High Concern)—Management exists, but Management Strategy and/or Recovery of Species ofConcern rated ‘ineffec ve.’
0 (Cri cal)—No management exists when there is a clear need for management (i.e., fishery catchesthreatened, endangered, or high concern species), OR there is a high level of Illegal, unregulated, andunreported fishing occurring.
Factor 3.1: Harvest Strategy
Factor 3.1 Summary
Region / Method Harvest Strategy Bycatch Strategy Score
Indian Ocean / Troll/Pole 3.000 0.000 Yellow (3.000)
FACTOR 3.1: MANAGEMENT OF FISHING IMPACTS ON RETAINED SPECIES
Region /Method Strategy Recovery Research Advice Enforce Track Inclusion
18
The United Na ons Straddling and Highly Migratory Fish Stocks Agreement (1995) indicated that themanagement of straddling and highly migratory fish stocks should be carried out through Regional FisheriesManagement Organiza ons (RFMOs). RFMOs are the only legally mandated fishery management body on thehigh seas and within EEZ waters. There are currently 18 RFMOs (www.fao.org) that cover nearly all of theworld’s waters. Member countries must abide by the management measures set forth by individual RFMOs inorder to fish in their waters {Cullis-Suzuki and Pauly 2010}. Some RFMOs manage all marine living resourceswithin their authority (e.g., General Fisheries Commission for the Mediterranean (GFCM)), while othersmanage a group of species such as tunas (e.g., Inter-American Tropical Tuna Commission (IATTC)). This reportfocuses on troll and pole fisheries for tuna in interna onal waters within the Indian Ocean, which are managedby the Indian Ocean Tuna Commission (IOTC). The following countries are current members of the IOTC:Australia, Belize, China, Comoros, Eritrea, European Union, France, Guinea, India, Indonesia, Iran, Japan,Kenya, Republic of Korea, Madagascar, Malaysia, Maldives, Mauri us, Mozambique, Oman, Pakistan,Philippines, Seychelles, Sierra Leone, Somalia, South Africa, Sri Lanka, Sudan, Tanzania, Thailand, UnitedKingdom, and Yemen. In addi on, Bangladesh, Djibou , Liberia, and Senegal are Coopera ng Non-Contrac ngPar es. For this report we have scored this sec on for IOTC and CCSBT management.
Subfactor 3.1.1 – Management Strategy and Implementa on
Considera ons: What type of management measures are in place? Are there appropriate management goals,and is there evidence that management goals are being met? To achieve a highly effec ve ra ng, there mustbe appropriate management goals, and evidence that the measures in place have been successful atmaintaining/rebuilding species.
Considera ons: When needed, are recovery strategies/management measures in place to rebuildoverfished/threatened/ endangered species or to limit fishery’s impact on these species and what is theirlikelihood of success? To achieve a ra ng of Highly Effec ve, rebuilding strategies that have a high likelihoodof success in an appropriate meframe must be in place when needed, as well as measures to minimizemortality for any overfished/threatened/endangered species.
Subfactor 3.1.3 – Scien fic Research and Monitoring
Considera ons: How much and what types of data are collected to evaluate the health of the popula on and
The Indian Ocean Tuna Commission (IOTC) has adopted several management measures that affect speciescaught in troll and pole fisheries. For example, the IOTC has requested that countries provide informa on onthe number of licensed vessels larger than 24 m in length (under 24 m if fishing outside of their EEZ).Countries are also required to introduce a Fleet Development Plan for capacity control (IOTC 2013l). In 2005,countries were required to limit their catches of bigeye tuna to recent levels, and Taiwan and China wereasked to limit their catches to 35,000 t. This measure was to be readdressed in 2006 but was not (although itis s ll considered an ac ve measure) (IOTC 2013e). Star ng in 2017, fleets that caught more than 5,000 MTof yellowfin tuna during 2014 must reduce their catches by 5% of 2014 levels (IOTC 2016). In addi on tothese management measures, the IOTC adopted a measure to implement the precau onary approach in2012, which included the use of stock-specific reference points, associated harvest control rules, the ability toenact emergency measures in the face of natural phenomena having a nega ve impact on resources, and toevaluate the performance of reference points and poten al harvest control rules through managementstrategy evalua on (IOTC 2013e). Currently, interim target and limit reference points are used in the IOTC foralbacore, bigeye, and yellowfin tuna, and swordfish, and the IOTC Scien fic Commi ee is to advise theCommission on target and limit reference points for albacore tuna by the end of 2014 (IOTC 2013l). A harvestcontrol rule and reference points have been formally adopted for skipjack tuna (IOTC 2016). In addi on, theScien fic Commi ee is to provide management advice for albacore tuna based on the use of ManagementStrategy Evalua on by the end of 2014 (IOTC 2013e).
In 2009, a performance review of the IOTC iden fied several areas of the current conserva on andmanagement plans that needed to be addressed. These included modifica on of the ming of data repor ng;any noncompliance should be monitored and iden fied at the member level; causes of noncompliance needto be iden fied; data quality (catch, effort, and size) needs to be improved; a scien fic observer programshould be established; a sta s cal commi ee should be developed; the list of shark species should beexpanded to include five addi onal species and applied to all gear types; alterna ve repor ng means (e.g.,port sampling) should be explored; assessment methods for data-deficient species should be developed; andmeasures such as catch limits and total allowable catches (TACs) should be explored. Various degrees of workhave been implemented since 2009 to address these issues (IOTC 2013j).
We have awarded a “moderate concern” score because the IOTC is taking ini a ve to define target and limitreference points and to adopt management measures for certain species.
INDIAN OCEAN, TROLL/POLE
Moderately Effec ve
Yellowfin tuna were last assessed as overfished in the Indian Ocean (IOTC 2015b). The IOTC has adoptedmeasures to address the status of yellowfin tuna but the success of these measures are not yet known (IOTC2016). It should be noted that management measures enacted in 2010 to address overfishing of this species(based on the 2008 assessment) were successful at rebuilding the popula on for a short me period. We havetherefore awarded a moderately effec ve score.
20
the fishery’s impact on the species? To achieve a Highly Effec ve ra ng, popula on assessments must beconducted regularly and they must be robust enough to reliably determine the popula on status.
Subfactor 3.1.4 – Management Record of Following Scien fic Advice
Considera ons: How o en (always, some mes, rarely) do managers of the fishery follow scien ficrecommenda ons/advice (e.g. do they set catch limits at recommended levels)? A Highly Effec ve ra ng isgiven if managers nearly always follow scien fic advice.
Subfactor 3.1.5 – Enforcement of Management Regula ons
Considera ons: Do fishermen comply with regula ons, and how is this monitored? To achieve a HighlyEffec ve ra ng, there must be regular enforcement of regula ons and verifica on of compliance.
INDIAN OCEAN, TROLL/POLE
Moderately Effec ve
Stock assessments for key tuna species are conducted on a regular basis but assessments for bullet andfrigate tuna are hampered due to a lack of data. Logbook data on catch and effort in the troll and polefishery are required to be submi ed to the Commission (IOTC 2013e). Member countries are required torecord and report catch and effort data by species and gear. Troll and pole fisheries must report data by a 1-degree grid area and month strata. In addi on, size data must be provided and countries must have arandom size sampling scheme in place. If an observer program is in place, this can serve as the samplingscheme (IOTC 2013e). In addi on, bigeye tuna shipments into contrac ng countries must be accompaniedby a Bigeye Tuna Sta s cal Document that includes import and export informa on, informa on on wherethe fish was caught, the product form, and what type of gear was used to capture it (IOTC 2013e). But theCompliance Commi ee indicated that repor ng of mandatory sta s cs is generally poor, due to incompleteand/or poorly documented data, although an improvement was noted in 2012 (IOTC 2013i). We havetherefore awarded only a “moderately effec ve” score.
INDIAN OCEAN, TROLL/POLE
Moderately Effec ve
The Indian Ocean Tuna Commission's Scien fic Commi ee provides advice to the Commission. In 2016, theIOTC adopted a harvest control rule for skipjack tuna in line with scien fic advice (IOTC 2016). Otherwise, nospecific advice was provided for bigeye or skipjack tuna besides monitoring skipjack tuna catches (IOTC2013b) (IOTC 2013c). In 2015, it was advised that future catches of yellowfin tuna should be 80% or less ofcurrent levels to allow the popula on to rebuild (IOTC 2015b). In 2016, the Commission adopted a measureto reduce catches for fleets that caught 5,000 MT or more of yellowfin in 2014 by 5% of 2014 catch levels(addi onal catch reduc ons are required in other fisheries) (IOTC 2016). For bullet and frigate tuna, due to alack of informa on, annual catches should be reviewed and data collec on should be improved (IOTC 2013g)(IOTC 2013f). We have awarded a "moderately effec ve" score to account for the IOTC's mixed record ofadhering to scien fic advice.
INDIAN OCEAN, TROLL/POLE
Moderately Effec ve
21
Subfactor 3.1.6 – Management Track Record
Considera ons: Does management have a history of successfully maintaining popula ons at sustainablelevels or a history of failing to maintain popula ons at sustainable levels? A Highly Effec ve ra ng is given ifmeasures enacted by management have been shown to result in the long-term maintenance of speciesover me.
The IOTC maintains a record of fishing vessels larger than 24 m in length, and all vessels (purse seine, longline,gillnet, pole and line, handline, and trolling) authorized to fish must have in place a data recording system (allvessels over 24 m and under 24 m if fishing outside EEZs). This includes logbooks (paper or electronic) thatcollect informa on (each fishery has specific required catch and effort data) (IOTC 2013e). Informa on onIllegal, Unreported, and Unregulated (IUU) vessels is required to be reported by individual countries to theCommission (IOTC 2013e). Vessel monitoring systems (VMS) are required on all vessels larger than 15 m inlength, and compliance with the me/area closure must be monitored by individual countries throughmethods such as VMS; these records must be provided to the Commission (IOTC 2013e). In addi on,countries must inspect at least 5% of landings or transshipments in their ports per year (IOTC 2013e). Thereare no TACs currently in place that need enforcement. There are con nued issues with IUU fishing in theIndian Ocean. In 2016, the Commission took further ac on to address IUU fishing (IOTC 2016).
The IOTC has a Compliance Commi ee that verifies compliance by countries with regard to implemen ng andfollowing adopted management measures (IOTC 2016b). The Commi ee meets prior to the annualCommission mee ng to assess compliance and enforcement of management measures by individualcountries. According to informa on provided during the 2016 mee ng, compliance with providing a record ofauthorized vessels increased from 30% in 2010 to 60% in 2015. Compliance with the Bigeye Tuna Sta s calDocument Program increased steadily since 2010 (13%) through 2014 (60%), decreasing slightly during 2015(54%). Compliance with observing transshipments at sea was 64% in 2015. Compliance with the regionalobserver program has remained fairly poor over me, at just 20% during 2015. Repor ng of mandatorysta s cs had a 43% compliance rate in 2015 for target species. Compliance with limi ng fishing capacity had a65% compliance rate in 2015, up from only 27% in 2010 (IOTC 2016b).
The Commi ee is responsible for repor ng its recommenda ons to the Commission. The Commi ee alsodiscusses problems related to the implementa on of management measures and provides the Commissionwith advice on how to address these issues. The Commi ee has also been tasked with developing incen vesand sanc ons to encourage compliance with adopted measures (IOTC 2013e). But the Commi ee considersonly compliance with a measure, not quality or completeness of data submi ed. In addi on, although theCommi ee will let countries know through a formal le er that they are not in compliance, it does notnecessarily inform them on how to comply with the measures (IOTC 2013h). The IOTC is currently assessingand reviewing compliance issues with regard to the implementa on of management measures, to helpstrengthen compliance and to provide technical support to developing na ons (IOTC 2013h). Informa on oncompliance with measures, such as the observer scheme, is reported in publicly accessed reports (IOTC 2012)(IOTC 2013i) (IOTC 2013k). Individual country compliance reports are also produced (IOTC 2013s). But it hasbeen noted that many countries fail to provide all the informa on necessary to monitor compliance (Pillai andSatheeshkumar 2012).
Though there have been strong improvements in both compliance with IOTC regula ons and reducing IUUfishing in recent years, some concerns remain, leading to a score of "moderately effec ve."
INDIAN OCEAN, TROLL/POLE
Moderately Effec ve
22
Subfactor 3.1.7 – Stakeholder Inclusion
Considera ons: Are stakeholders involved/included in the decision-making process? Stakeholders areindividuals/groups/organiza ons that have an interest in the fishery or that may be affected by themanagement of the fishery (e.g., fishermen, conserva on groups, etc.). A Highly Effec ve ra ng is given if themanagement process is transparent and includes stakeholder input.
Factor 3.2: Bycatch Strategy
SCORING GUIDELINES
Four subfactors are evaluated: Management Strategy and Implementa on, Scien fic Research andMonitoring, Record of Following Scien fic Advice, and Enforcement of Regula ons. Each is rated as‘ineffec ve,’ ‘moderately effec ve,’ or ‘highly effec ve.’ Unless reason exists to rate Scien fic Research andMonitoring, Record of Following Scien fic Advice, and Enforcement of Regula ons differently, these ra ng arethe same as in 3.1.
5 (Very Low Concern)—Rated as ‘highly effec ve’ for all four subfactors considered
4 (Low Concern)—Management Strategy rated ‘highly effec ve’ and all other subfactors rated at least‘moderately effec ve.’
3 (Moderate Concern)—All subfactors rated at least ‘moderately effec ve.’
2 (High Concern)—At minimum, meets standards for ‘moderately effec ve’ for Management Strategy butsome other factors rated ‘ineffec ve.’
1 (Very High Concern)—Management exists, but Management Strategy rated ‘ineffec ve.’
0 (Cri cal)—No bycatch management even when overfished, depleted, endangered or threatened speciesare known to be regular components of bycatch and are substatn ally impacted by the fishery
Subfactor 3.2.3 – Scien fic Research and Monitoring
Considera ons: Is bycatch in the fishery recorded/documented and is there adequate monitoring of bycatch tomeasure fishery’s impact on bycatch species? To achieve a Highly Effec ve ra ng, assessments must be
The Indian Ocean Tuna Commission has been mostly successful in maintaining healthy popula ons forspecies in this fishery, but the status of frigate and bullet tuna is unknown. In addi on, the Scien ficCommi ee recommended that catches of yellowfin tuna not exceed 300,000 t; however, catches exceededthis amount during both 2011 and 2012 (IOTC 2013d). We have therefore awarded only a “moderatelyeffec ve” score.
INDIAN OCEAN, TROLL/POLE
Highly Effec ve
The IOTC allows for the inclusion of stakeholders in developing management objec ves through par cipa onin countries’ delega ons and allows for accredited observers to a end Commission mee ngs (IOTC 2012).
FACTOR 3.2: BYCATCH STRATEGY
Region / Method All Kept Cri cal Strategy Research Advice Enforce
Indian Ocean / Troll/Pole Yes No
23
conducted to determine the impact of the fishery on species of concern, and an adequate bycatch datacollec on program must be in place to ensure bycatch management goals are being met
Subfactor 3.2.4 – Management Record of Following Scien fic Advice
Considera ons: How o en (always, some mes, rarely) do managers of the fishery follow scien ficrecommenda ons/advice (e.g., do they set catch limits at recommended levels)? A Highly Effec ve ra ng isgiven if managers nearly always follow scien fic advice.
Subfactor 3.2.5 – Enforcement of Management Regula ons
Considera ons: Is there a monitoring/enforcement system in place to ensure fishermen follow managementregula ons and what is the level of fishermen’s compliance with regula ons? To achieve a Highly Effec vera ng, there must be consistent enforcement of regula ons and verifica on of compliance.
24
Criterion 4: Impacts on the habitat and ecosystem
This Criterion assesses the impact of the fishery on seafloor habitats, and increases that base score if thereare measures in place to mi gate any impacts. The fishery’s overall impact on the ecosystem and food weband the use of ecosystem-based fisheries management (EBFM) principles is also evaluated. Ecosystem BasedFisheries Management aims to consider the interconnec ons among species and all natural and humanstressors on the environment.
The final score is the geometric mean of the impact of fishing gear on habitat score (plus the mi ga on of gearimpacts score) and the Ecosystem Based Fishery Management score. The Criterion 2 ra ng is determined asfollows:
Score >3.2=Green or Low Concern
Score >2.2 and ≤3.2=Yellow or Moderate Concern
Score ≤2.2=Red or High Concern
Ra ng cannot be Cri cal for Criterion 4.
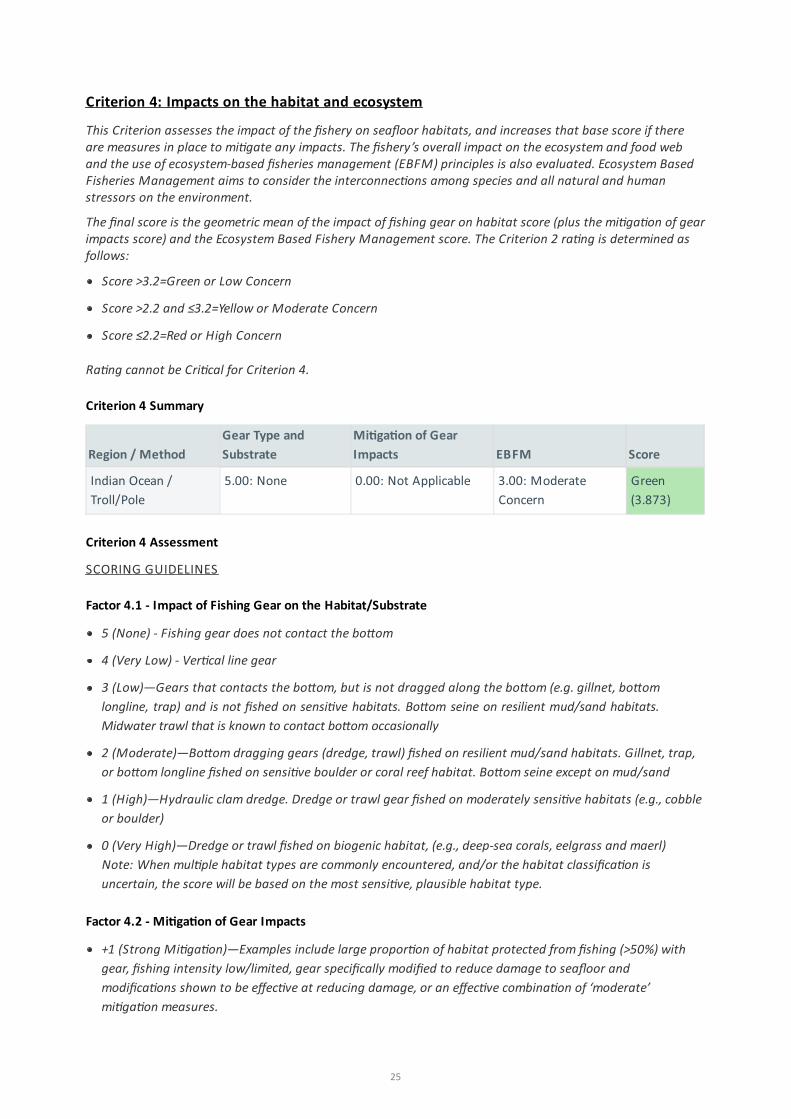
Criterion 4 Summary
Criterion 4 Assessment
SCORING GUIDELINES
Factor 4.1 - Impact of Fishing Gear on the Habitat/Substrate
5 (None) - Fishing gear does not contact the bo om
4 (Very Low) - Ver cal line gear
3 (Low)—Gears that contacts the bo om, but is not dragged along the bo om (e.g. gillnet, bo om longline, trap) and is not fished on sensi ve habitats. Bo om seine on resilient mud/sand habitats. Midwater trawl that is known to contact bo om occasionally
2 (Moderate)—Bo om dragging gears (dredge, trawl) fished on resilient mud/sand habitats. Gillnet, trap,or bo om longline fished on sensi ve boulder or coral reef habitat. Bo om seine except on mud/sand
1 (High)—Hydraulic clam dredge. Dredge or trawl gear fished on moderately sensi ve habitats (e.g., cobbleor boulder)
0 (Very High)—Dredge or trawl fished on biogenic habitat, (e.g., deep-sea corals, eelgrass and maerl)Note: When mul ple habitat types are commonly encountered, and/or the habitat classifica on isuncertain, the score will be based on the most sensi ve, plausible habitat type.
Factor 4.2 - Mi ga on of Gear Impacts
+1 (Strong Mi ga on)—Examples include large propor on of habitat protected from fishing (>50%) withgear, fishing intensity low/limited, gear specifically modified to reduce damage to seafloor andmodifica ons shown to be effec ve at reducing damage, or an effec ve combina on of ‘moderate’mi ga on measures.
Region / MethodGear Type andSubstrate
Mi ga on of GearImpacts EBFM Score
Indian Ocean /Troll/Pole
5.00: None 0.00: Not Applicable 3.00: ModerateConcern
Green(3.873)
25
+0.5 (Moderate Mi ga on)—20% of habitat protected from fishing with gear or other measures in place tolimit fishing effort, fishing intensity, and spa al footprint of damage caused from fishing.
+0.25 (Low Mi ga on)—A few measures are in place (e.g., vulnerable habitats protected but other habitatsnot protected); there are some limits on fishing effort/intensity, but not ac vely being reduced
0 (No Mi ga on)—No effec ve measures are in place to limit gear impacts on habitats
Factor 4.3 - Ecosystem-Based Fisheries Management
5 (Very Low Concern)—Substan al efforts have been made to protect species’ ecological roles and ensurefishing prac ces do not have nega ve ecological effects (e.g., large propor on of fishery area is protectedwith marine reserves, and abundance is maintained at sufficient levels to provide food to predators)
4 (Low Concern)—Studies are underway to assess the ecological role of species and measures are in placeto protect the ecological role of any species that plays an excep onally large role in the ecosystem.Measures are in place to minimize poten ally nega ve ecological effect if hatchery supplementa on or fishaggrega ng devices (FADs) are used.
3 (Moderate Concern)—Fishery does not catch species that play an excep onally large role in theecosystem, or if it does, studies are underway to determine how to protect the ecological role of thesespecies, OR nega ve ecological effects from hatchery supplementa on or FADs are possible andmanagement is not place to mi gate these impacts
2 (High Concern)—Fishery catches species that play an excep onally large role in the ecosystem and noefforts are being made to incorporate their ecological role into management.
1 (Very High Concern)—Use of hatchery supplementa on or fish aggrega ng devices (FADs) in the fisheryis having serious nega ve ecological or gene c consequences, OR fishery has resulted in trophic cascadesor other detrimental impacts to the food web.
Factor 4.1 - Impact of Fishing Gear on the Habitat/Substrate
Factor 4.2 - Mi ga on of Gear Impacts
Factor 4.3 - Ecosystem-Based Fisheries Management
INDIAN OCEAN, TROLL/POLE
None
Fishing gears such as handline and troll and pole rarely impact bo om habitats (Seafood Watch 2013).
INDIAN OCEAN, TROLL/POLE
Not Applicable
INDIAN OCEAN, TROLL/POLE
Moderate Concern
26
These troll, handline, and pole fisheries target tuna, which are top predators and considered “excep onalspecies.” In addi on to tuna, troll and pole fisheries rely on live bai ish, which could include other“excep onal species” such as anchovy or sardines. The effect of the removal of these species on theecosystem is unknown, and few bai ish fisheries are managed (Gillet 2012) (FAO 2014). The IOTC has aWorking Party on Ecosystems and Bycatch (WPEB) that analyzes technical problems related to themanagement goals, iden fies research priori es, and indicates data and informa on requirements that areneeded. In addi on, it provides advice on management measures (IOTC 2013t). This WP meets annually andpresents a final report of the mee ng, which includes informa on on the outcomes of the Scien ficCommi ee, progress on recommenda ons from the WPEB, review of informa on available on ecosystemsand bycatch (including any new informa on), and a review of na onal bycatch issues (IOTC 2013h). We havetherefore awarded a “moderate concern” score because “excep onal species” are caught but some work isbeing done to include them in the management process.
27
Acknowledgements
Scien fic review does not cons tute an endorsement of the Seafood Watch® program, or its seafoodrecommenda ons, on the part of the reviewing scien sts. Seafood Watch® is solely responsible for theconclusions reached in this report.
Seafood Watch would like to thank several anonymous reviewers for graciously reviewing this report forscien fic accuracy.
28
References
Adrill, D., Itano, D. and Gille , R. 2012. A review of bycatch and discard issues in Indian Ocean tuna fisheries.Smar ish Working Papers No 00X.
Colle e, B., Acero, A., Amorim, A.F., Boustany, A., Canales Ramirez, C., Cardenas, G., Carpenter, K.E., deOliveira Leite Jr., N., Di Natale, A., Fox, W., Fredou, F.L., Graves, J., Guzman-Mora, A., Viera Hazin, F.H., JuanJorda, M., Kada, O., Minte Vera, C., Miyabe, N., Montano Cruz, R., Nelson, R., Oxenford, H., Salas, E., Schaefer,K., Serra, R., Sun, C., Teixeira Lessa, R.P., Pires Ferreira Travassos, P.E., Uozumi, Y. & Yanez, E. 2011b. Auxisthazard. In: IUCN 2013. IUCN Red List of Threatened Species. Version 2013.1.
Colle e, B., Acero, A., Amorim, A.F., Boustany, A., Canales Ramirez, C., Cardenas, G., Carpenter, K.E., deOliveira Leite Jr., N., Di Natale, A., Fox, W., Fredou, F.L., Graves, J., Guzman-Mora, A., Viera Hazin, F.H., JuanJorda, M., Kada, O., Minte Vera, C., Miyabe, N., Montano Cruz, R., Nelson, R., Oxenford, H., Salas, E., Schaefer,K., Serra, R., Sun, C., Teixeira Lessa, R.P., Pires Ferreira Travassos, P.E., Uozumi, Y. & Yanez, E. 2011a. Auxisrochei. In: IUCN 2013. IUCN Red List of Threatened Species. Version 2013.1.
Cullis-Suzuki, S., and Pauly, D. 2010. Failing the high seas: A global evalua on of regional fisheries managementorganiza ons. Marine Policy, 34(5), 1036-1042.
FAO. 2014. Fishing techniques tuna pole and line fishing. FAO Fisheries and Aquaculture Department.
Froese, R. and D. Pauly. Editors. 2013. FishBase. World Wide Web electronic publica on.
Froese, R. and D. Pauly. Editors. 2014. FishBase. World Wide Web electronic publica on.
Gille , R. 2012. Report of the 2012 ISSF Workshop: the management of tuna bait fisheries: The results of aglobal study. ISSF Technical Report 2012-08. Interna onal Seafood Sustainability Founda on, Washington, D.C.
IOTC. 2009. Preda on survey of longline-caught fish. Indian Ocean Tuna Commission.
IOTC. 2012. Report of the fiteenth session of the IOTC Scien fic Commi ee. IOTC-2012-SC15-R[E], Mahe,Seychelles, 10-15 December 2012.
IOTC. 2013b. Status of the Indian Ocean bigeye tuna (BET: Thunnus obesus) resource. IOTC-2013-SC16-ES02[E]. Available at: h p://www.iotc.org/files/proceedings/2013/sc/IOTC-2013-SC16-ES02[E].pdf
IOTC. 2013c. Status of the Indian Ocean skipjack tuna (SKJ: Katsuwonus pelamis) resource. IOTC-2013-SC16-ES03[E]. Available at: h p://www.iotc.org/files/proceedings/2013/sc/IOTC-2013-SC16-ES03[E].pdf
IOTC. 2013d. Status of the Indian Ocean yellowfin tuna (YFT: Thunnus albacares) resource. IOTC-2013-SC16-ES04[E]. Available at: h p://www.iotc.org/files/proceedings/2013/sc/IOTC-2013-SC16-ES04[E].pdf
IOTC. 2013e. Compendium of ac ve [and pending] conserva on and management measures for the IndianOcean Tuna Commission. Last updated: 15 September, 2013.
IOTC. 2013f. Status of the Indian Ocean bullet tuna (BLT: Auxis rochei) resource. IOTC-2013-SC16-ES06[E].
IOTC. 2013g. Status of the Indian Ocean frigate tuna (FRI: Auxis thazard) resource. IOTC-2013-SC16-ES07[E].
IOTC. 2013h. Report of the ninth session of the IOTC Working Party on Ecosystems and Bycatch. IOTC-2013-WPEB09-R[E].
IOTC. 2013i. Summary report on the level of compliance. IOTC-2013-CoC10-03.
IOTC. 2013j. Performance review update (Resolu on 09/01 - on the performance review follow-up). IOTC-2013-CoC10-06.
IOTC. 2013k. Summary report on possible infrac ons observed under the regional observer programme. IOTC-2013-CoC10-08c Rev 1[E].
IOTC. 2013l. Compendium of ac ve [and pending] conserva on and management measures for the IndianOcean Tuna Commission. Last updated: 15 September, 2013.
IOTC. 2013t. Working par es. Indian Ocean Tuna Commission.
29
IOTC. 2015. Status of the Indian Ocean albacore (ALB: Thunnus alalunga) resource. IOTC-2015-SC18-ESo1[E].Available at: h p://iotc.org/mee ngs/18th-scien fic-commi ee-sc18
IOTC. 2015b. Status of the Indian Ocean yellowfin tuna (YFT: Thunnus albacares) resource. IOTC-2015-SC18-ES04
IOTC. 2016. Conserva on and Management Measures adopted by the IOTC at its 20th Session. IOTC Circular2016-054.
IOTC. 2016b. Summary report on the level of compliance. IOTC-2016-CoC13-03 Rev 1.
Interna onal Seafood Sustainability Founda on (ISSF). 2013b. ISSF stock status ra ngs 2013 status of theworld fisheries for tuna. ISSF Technical Report 2013-4, April 2013.
Kelleher, K. 2005. Discards in the world's marine fisheries. An update. FAO Fisheries Technical Paper No. 470.Rome, FAO. 131 p.
Na onal Marine Fisheries Service (NMFS). 2013. US foreign trade. NOAA Office of Science and Technology.
Pillai, N.G. and Satheeshkumar, P. 2012. Biology, fishery, conserva on and management of Indian OceanFisheries. Ocean Science Journal 47:411-433
Seafood Watch. 2013. Seafood Watch criteria for fisheries. Monterey Bay Aquarium Seafood Watch VersionJanuary 18, 2013. 82 p
30
Appendix A: Extra By Catch Species
Bigeye tuna
Factor 2.1 - Inherent Vulnerability
Factor 2.2 - Abundance
Factor 2.3 - Fishing Mortality
Factor 2.4 - Discard Rate
INDIAN OCEAN, TROLL/POLE
Medium
FishBase assigned a high to very high vulnerability of 72 out of 100 for bigeye tuna (Froese and Pauly 2013).But bigeye tuna’s life history characteris cs suggest a medium vulnerability to fishing. For example, bigeyetuna reaches sexual maturity around 100 cm or 3 years of age, reaches a maximum size of 200 cm, and livesaround 15 years (IOTC 2013b). It is a broadcast spawner and top predator (Froese and Pauly 2013). Based onthese life history characteris cs, we have awarded a “medium” score.
INDIAN OCEAN, TROLL/POLE
Very Low Concern
According to the most recent assessment, the biomass of bigeye tuna is es mated to currently be well abovetarget levels that produce the maximum sustainable yield (SB /SB = 1.44 (0.87–2.22)). The currentbiomass is around 40% of virgin levels (IOTC 2013b). We have awarded a “very low” concern score becausethe biomass is well above target levels.
2012 M SY
INDIAN OCEAN, TROLL/POLE
Very Low Concern
Fishing mortality rates for bigeye tuna are es mated to be below the provisional target levels needed toproduce the maximum sustainable yield (F ) as well as below the interim limit reference point. Currently,fishing mortality is only 42% (21%–80% range) of F and therefore overfishing is not occurring. Catchesover the last 5 years have been below MSY levels. Maintaining catches at the current level should notnega vely affect the popula on (IOTC 2013b), so we have awarded a “very low” concern score.
M SY
M SY
INDIAN OCEAN, TROLL/POLE
< 20%
Troll and pole fisheries typically have a negligible discard rate, even as low as zero in some areas (Kelleher2005). In the Indian Ocean, bai ish, which make up the majority of bycatch in this fishery, are consumedlocally, so discard rates are very low (Adrill et al. 2012).
31
Appendix B: Update Summary
This report was updated during August 2016 to incorporate a new stock assessment for yellowfin tuna thatwas published in November 2015 and new management measures adopted in May of 2016. The status changefor yellowfin resulted in a change to the Criterion 1 score from green to red and no change in the overallrecommenda on. Recommenda ons for albacore tuna and bigeye tuna caught by troll/pole were removed dueto low volume.