18
Investor Presentation February 2008

Investor Presentation
February 2008

1
Disclaimer
This presentation has been prepared by SK Telecom Co., Ltd. (“the Company”). This presentation is being presented solely for your information and is subject to change without notice. No representation or warranty, expressed or implied, is made and no reliance should be placed on the accuracy, fairness or completeness of the information presented. The Company, its affiliates, advisers or representatives accept no liability whatsoever for any losses arising from any information contained in the presentation.
This presentation does not constitute an offer or invitation to purchase or subscribe for any shares of the Company, and no part of this presentation shall form the basis of or be relied upon in connection with any contract or commitment.
The contents of this presentation may not be reproduced, redistributed or passed on, directly or indirectly, to any other person or published, in whole or in part, for any purpose.

2
1. Industry Overview
2. 2007 Operating Results
3. Growth Strategy
4. SK Telecom’s Investment Assets
5. Commitment to Shareholders
Table of ContentsTable of Contents

3
1. Industry Overview
2. 2007 Operating Results
3. Growth Strategy
4. SK Telecom’s Investment Assets
5. Commitment to Shareholders

4
Overview of Korean Wireless MarketOverview of Korean Wireless Market
Mobile Telecommunications Market Trend
67.9%70.1%
75.9%79.4%
83.2% 89.8%
Source: MIC, NSO
Total subscribers Penetration
(000s, %)
Despite the maturing market, wireless data market continues to grow
Wireless Data Market Growth
1,086
1,736
2,424
3,285
3,6853,887
2002 2003 2004 2005 2006 2007
(KRW Bn)
6-yr CAGR : 29.0%
Source: Earnings ReleaseWCDMA subscribers
32,34233,592
36,58638,342
40,19743,498
166
5,700
2002 2003 2004 2005 2006 2007
5,700166

5
2007 Competitive Landscape2007 Competitive Landscape
4,024
1,583
678
SKT KTF LGT
11,286
5,5723,249
SKT KTF LGT
25.3
28.7 29.8
SKT KTF LGT
SK Telecom continues to demonstrate undisputed market leadership
Market Share by Subscribers Revenue
Marketing Expense to Sales EBITDA
(000s, %)
(KRW Bn)(%)
SKT50.5%
LGT18.0%
KTF31.5%
※ As of December 31, 2007
21,968
7,809
13,721
(KRW Bn)
**
* Service revenue(Handset revenue excluded)

6
1. Industry Overview
2. 2007 Operating Results
3. Growth Strategy
4. SK Telecom’s Investment Assets
5. Commitment to Shareholders

7
2007 Results2007 Results
Review of performance in 2007
Revenue
Marketing expense to revenue
Net income
(KRW Bn)
EBITDA (EBITDA Margin)
20072007 YoYYoY 4Q20074Q200720062006
11,286 2,916
1,642 66
4,024(35.7%)
855(29.3%)
25.3% 29.3%
1,855 696
3Q20073Q2007
2,816
777
1,011(35.9%)
25.2%
442
QoQQoQ
4%
-91%
-15%
4.0%p
57%
21,968
10,651
1,447
4,232(39.7%)
20.5%
1,518
20,271 21,968
6%
14%
-5%
4.7%p
22%
8% 21,606 2%
Capital expenditure
Subscribers (000’)

8
1. Industry Overview
2. 2007 Operating Results
3. Growth Strategy
4. SK Telecom’s Investment Assets
5. Commitment to Shareholders

9
WCDMAWCDMA
Enhancing competitiveness in WCDMA market through upgrades of network quality,
extensive handset line-ups and innovative services
� Cutting-edge network
quality/coverage achieved
� Nationwide HSUPA service
by 2009
� WCDMA subscribers 2.5mil.,
exceeding the target of
1.5mil. in 2007
Network
� Wireless-to-wireless, web-to-wireless, fixed-to-wireless visual phone
� Image coloring, image message call
� VU traffic report, VU monitoring
� T-login : Hi-speed Internet access
� Full-browsing: Mobile web browser
� UCC, video messenger, web-like e-mail
Visual
Internet
� GSM / WCDMA covers 80% of the world
� Global roaming alliance with Bridge Alliance*(190mil. subscribers) in Asia and Freemove in Europe
� Wireless financial services via USIM
-Credit card transactions, mobile banking and payment services, membership cards, mobile gift cards, etc
Global
Convenience
� Strengthen WCDMA competitiveness through reinforcement of handset line-ups
- 14 models in 2007(30% of total line-ups introduced in 2007)
- Introduce 28~35 models in 2008 (60% of new models planned in 2008)
� Plans to introduce handsets by global manufacturers in 2008
Device
Service
* A partnership of eleven leading mobile operators in Asia Pacific region including Bharti Airtel, Telkomsel, AIS,
Globe Telecom, Optus, SingTel, etc.

10
Acquisition of Hanaro TelecomAcquisition of Hanaro Telecom
Solidify sustainable growth trajectory and create customer value in wired/wireless
convergence environment
Bundled
Products
Overview of Hanaro TelecomOverview of Hanaro Telecom Expected SynergiesExpected Synergies
IPTV
• IPTV to provide growth momentum for
SKT’s content business
• Strengthen HanaTV’s content competitiveness
through SKT’s diverse content universe
• Reinforce product competitiveness through
bundled products and services
- Combine SKT’s mobile services with
Hanaro Telecom’s fixed line services
Convergence
BM
• Realize sustainable growth through
development of new convergence business
model
• 2nd largest fixed line operator with 3.6mil. broadband and 2.0mil. telephony subscribers (Dec. 07)
• KRW 1,868Bn sales in 2007
• 807,000 subscribers (Dec. 07)
• Competitive edge from its rich contents relative to peers
Broadband Market Share (%)
Hanaro
Telecom
25.3
Sales Composition (%)
* As of September 31, 2007
Others
0.4%KT 44.7
Others
19.2
LG
Dacom
10.9
Broadband
59.8
Voice
27.8
Leased
line 6.3%
※ SKT decided to acquire an additional 38.89% stake in December 2007 and will become
the largest shareholder of Hanaro Telecom with a 43.59% stake after government approval
IDC &
Solution 5.6%

11
12
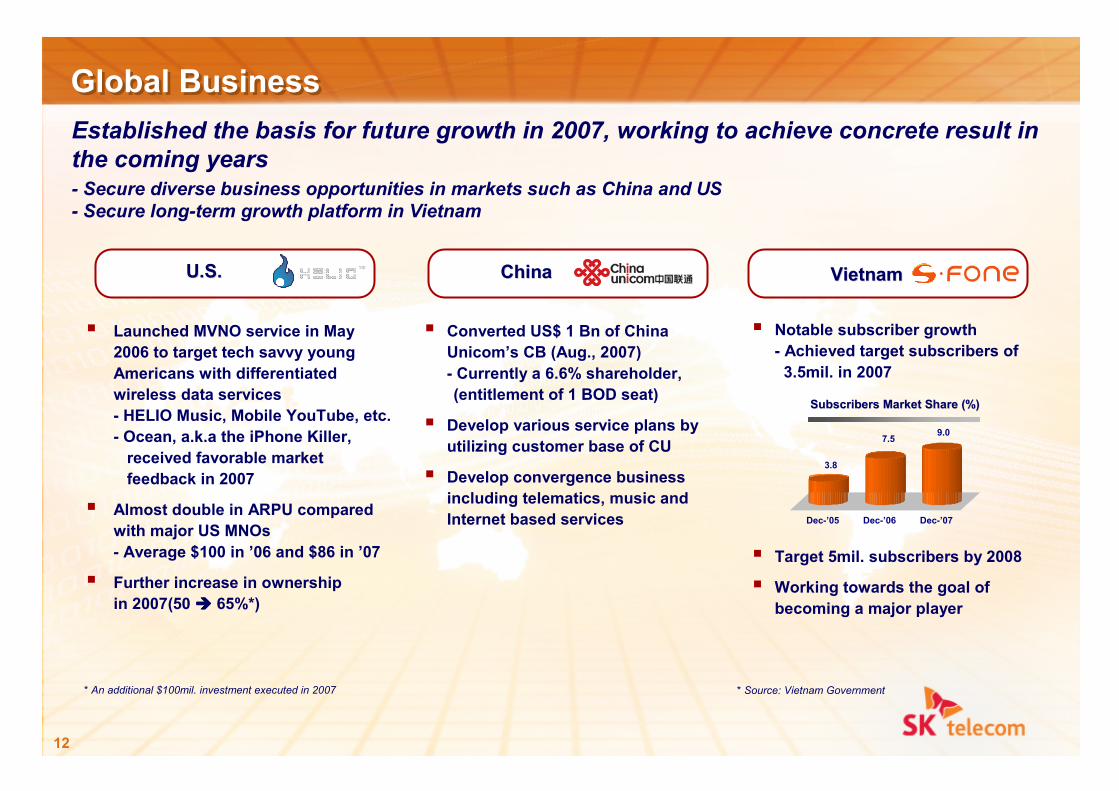
Global Business Global Business
Established the basis for future growth in 2007, working to achieve concrete result in
the coming years- Secure diverse business opportunities in markets such as China and US
- Secure long-term growth platform in Vietnam
� Converted US$ 1 Bn of China
Unicom’s CB (Aug., 2007)
- Currently a 6.6% shareholder,
(entitlement of 1 BOD seat)
� Develop various service plans by
utilizing customer base of CU
� Develop convergence business
including telematics, music and
Internet based services
ChinaChina
* Source: Vietnam Government
� Notable subscriber growth
- Achieved target subscribers of
3.5mil. in 2007
� Target 5mil. subscribers by 2008
� Working towards the goal of
becoming a major player
VietnamVietnam
Subscribers Market Share (%)Subscribers Market Share (%)
� Launched MVNO service in May
2006 to target tech savvy young
Americans with differentiated
wireless data services
- HELIO Music, Mobile YouTube, etc.
- Ocean, a.k.a the iPhone Killer,
received favorable market
feedback in 2007
� Almost double in ARPU compared
with major US MNOs
- Average $100 in ’06 and $86 in ’07
� Further increase in ownership
in 2007(50 ���� 65%*)
U.S.U.S.
* An additional $100mil. investment executed in 2007
3.8
7.59.0
Dec-’05 Dec-’06 Dec-’07

13
1. Industry Overview
2. 2007 Operating Results
3. Growth Strategy
4. SK Telecom’s Investment Assets
5. Commitment to Shareholders
14
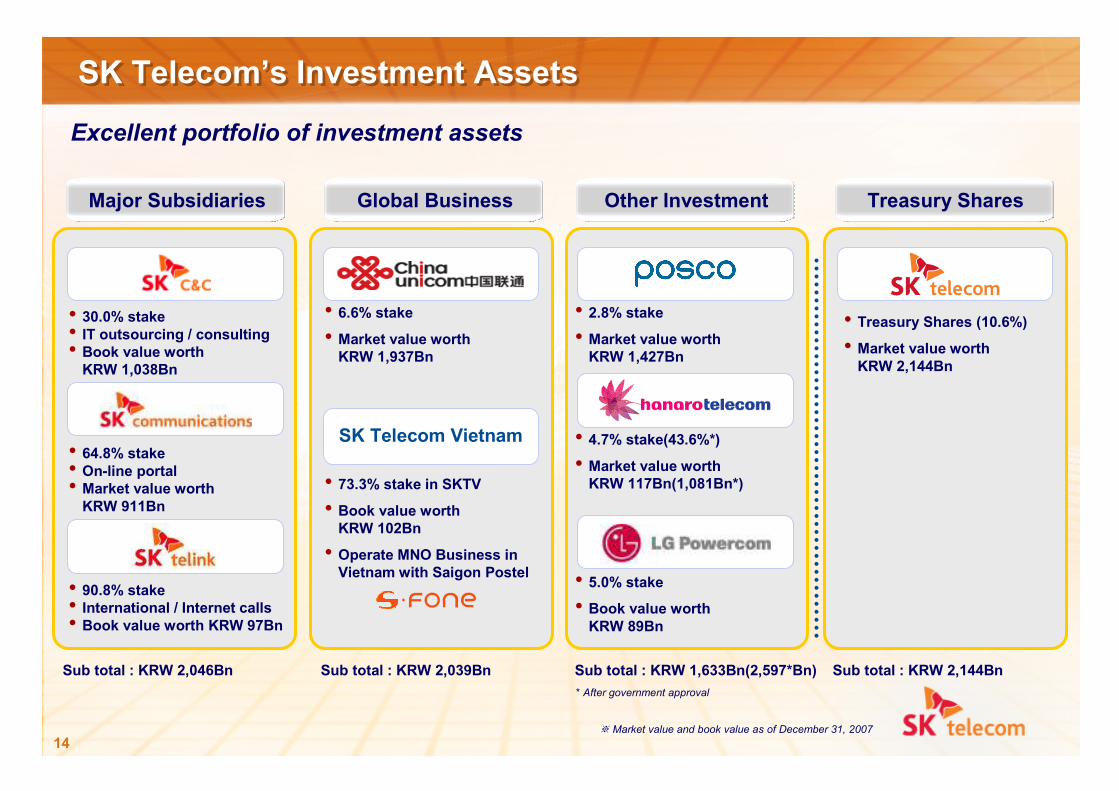
SK Telecom’s Investment AssetsSK Telecom’s Investment Assets
※ Market value and book value as of December 31, 2007
Excellent portfolio of investment assets
• 30.0% stake• IT outsourcing / consulting• Book value worth KRW 1,038Bn
• 64.8% stake• On-line portal• Market value worthKRW 911Bn
• 90.8% stake• International / Internet calls• Book value worth KRW 97Bn
SK Telecom Vietnam
• 6.6% stake• Market value worth KRW 1,937Bn
• 73.3% stake in SKTV• Book value worth KRW 102Bn
• Operate MNO Business in Vietnam with Saigon Postel
• 2.8% stake• Market value worth KRW 1,427Bn
• 4.7% stake(43.6%*) • Market value worth KRW 117Bn(1,081Bn*)
• 5.0% stake• Book value worth KRW 89Bn
• Treasury Shares (10.6%)• Market value worth KRW 2,144Bn
Major Subsidiaries Global Business Other Investment Treasury Shares
Sub total : KRW 2,046Bn Sub total : KRW 2,039Bn Sub total : KRW 1,633Bn(2,597*Bn) Sub total : KRW 2,144Bn
* After government approval
15
1. Industry Overview
2. 2007 Operating Results
3. Growth Strategy
4. SK Telecom’s Investment Assets
5. Commitment to Shareholders

16
Improving Shareholder ValueImproving Shareholder Value
10%21% 25%
35% 40% KRW 8,000
2002 2003 2004 2005 2006 2007
SK Telecom is committed to enhancing shareholder value
Payout ratio DPS* Overall amount is expected tobe similar to 2007
Special Dividends : Approx. KRW 300 Bn for 2004
Special Dividends : KRW 1,400 per shareSpecial Dividends : KRW 1,400 per share for 2007for 2007
Stock Buyback : KRW 100 Bn for 2007Stock Buyback : KRW 100 Bn for 2007
Stock Buyback : KRW 200 Bn for 2006
2008E
17
THANK YOUTHANK YOUTHANK YOU


